Rating Histogram Comparisons
This article provides a table and two graphs comparing three Go rating systems (AGA, EGD and KGS). A chess rating system (USCF) is included for those interested in comparisons, or more familiar with it.
| Table of contents |
Table Comparing the Cumulative Histograms of Several Rating Systems
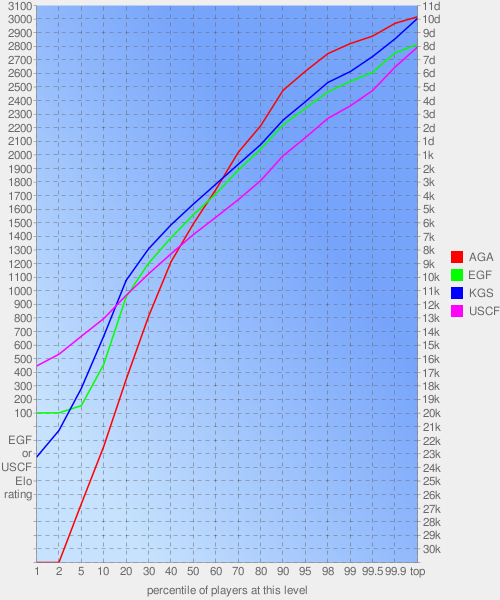
This table shows the rating you need to be at a given percentile of the players in each rating system.
| Percentile | AGA[1] | EGD[2] | EGD rank | KGS[1][3] | USCF[4] (chess) |
|---|---|---|---|---|---|
| 1% | -34.61 | 100 | > 20k | -24.26 | 444 |
| 2% | -32.58 | 100 | > 20k | -22.30 | 531 |
| 5% | -27.69 | 153 | 20–19k | -19.20 | 663 |
| 10% | -23.47 | 456 | 17–16k | -15.36 | 793 |
| 20% | -18.54 | 953 | 12–11k | -11.26 | 964 |
| 30% | -13.91 | 1200 | 9k | -8.94 | 1122 |
| 40% | -9.90 | 1387 | 8–7k | -7.18 | 1269 |
| 50% | -7.10 | 1557 | 6–5k | -5.65 | 1411 |
| 60% | -4.59 | 1709 | ~4k | -4.19 | 1538 |
| 70% | -1.85 | 1884 | 3–2k | -2.73 | 1667 |
| 80% | 2.10 | 2039 | 1k–1d | -1.28 | 1807 |
| 90% | 4.71 | 2217 | 2–3d | 2.52 | 1990 |
| 95% | 6.12 | 2339 | 3–4d | 3.88 | 2124 |
| 98% | 7.41 | 2460 | 4–5d | 5.29 | 2265 |
| 99% | 8.15 | 2536 | 5–6d | 6.09 | 2357 |
| 99.5% | 8.70 | 2604 | ~6d | 7.20 | 2470 |
| 99.9% | 9.64 | 2747 | 7–8d / 2–3p | pro | 2643 |
| top | 10.12 | 2809 | 8d / 4–5p | 9p | 2789 |
Notes
[1] KGS and AGA ratings are in AGA form: ``n`` kyu ≈ ``-n``½, ``n`` dan ≈ ``+n``½, with a jump from -½ to +½.
[2] The EGD cuts off at rating 100 = 20 kyu. This distorts the EGF graphs for the 1% and 2% percentiles.
[3] The 99.9% and top rating for KGS have been estimated as 2850 (8.5 dan amateur) and 3000 (10 dan amateur).
[4] USCF (United States Chess Federation) ratings, e.g. a master has a 2200 rating.
Cumulative distribution function
The following diagram plots the four rating systems as a ![[ext]](images/extlink.gif) cumulative distribution function:
the vertical axis shows the percentage of players up to the level indicated along the horizontal axis. The top scale shows USCF ratings, while the bottom scale shows AGA ratings[1].
cumulative distribution function:
the vertical axis shows the percentage of players up to the level indicated along the horizontal axis. The top scale shows USCF ratings, while the bottom scale shows AGA ratings[1].

Usage Example: You have rating 2000 USCF, and are curious what that is equivalent to in go. Find the point where the USCF graph crosses 2000, which is at about 90%. Then move straight up to see where the other graphs cross that percentile, which is (roughly) 2200 EGF (2 dan), 3 dan KGS and 5 dan AGA.
Cumulative histogram
The following diagram plots the same data as a ![[ext]](images/extlink.gif) cumulative histogram.
cumulative histogram.
The correspondence of the Elo (left) and Dan/Kyu (right) scales is based on EGF assignments.

Data sources
- AGA (American Go Association):
![[ext]](images/extlink.gif) http://usgo.org/ratings/RatingsQuery.asp - Ratings updated in or after 2005-11, as of 2007-11-6.
http://usgo.org/ratings/RatingsQuery.asp - Ratings updated in or after 2005-11, as of 2007-11-6.
- EGF/AGD (European Go Federation / Database):
![[ext]](images/extlink.gif) http://www.europeangodatabase.eu/EGD/
http://www.europeangodatabase.eu/EGD/
- KGS (KGS Go Server): KGS Rank Histogram / Data
- USCF:
![[ext]](images/extlink.gif) http://www.geocities.com/siliconvalley/lab/7378/histogra.htm
http://www.geocities.com/siliconvalley/lab/7378/histogra.htm
The raw data for KGS and USCF ratings are in the form of histogram buckets. I used linear interpolation to estimate more accurate numbers. The raw data for the AGA and EGF was the entire list, so I simply used the rating of the players at the appropriate percentiles.
Related links
- Professional Rank Histograms
- FIDE Titles and EGF Go Ratings
- DGS Rating Histogram
- KGS Rank Histogram
- AGA Rating Histogram
- Rank Worldwide Comparison
- Improvement Statistics
![Sensei's Library [Welcome to Sensei's Library!]](images/stone-hello.png)