Tamsin: My first attempt at go fiction. My intention is to make a serious point, but I might give up on that if it seems appropriate to do so. One new chapter whenever I feel like writing one.
For your information:
This story is set in New York City around the mid-to-late 1950s. Caitlin Wang is the daughter of an immigrant Chinese amateur go player and an American woman. I have made some space at the bottom of this page for readers to suggest improvements, such as tips on how to make the characters' dialogue more authentic. Also, forgive me for the inevitable cultural misunderstandings and biases. You will find that similarities with Hikaru No Go are only passing - particularly as I go back over the story to replace rip-offs with more original ideas as I think of them! This is the "Paul Simon Approach" to writing - i.e., you start off with somebody else's work, then you replace bits and pieces until what you're left with is something totally diferent and new. Please do not alter the main body of the story.
mgoetze: Discussion moved to /Discussion.
PROLOGUE
Nakamura Satoru would have nightmares about his first day at work for the rest of his life. And not only at nights would he see the man's figure falling endlessly over a few short feet, but during the day he would expect to see it, too, whenever he looked up.
The day had begun so proudly. His grandmother, his mother and his unemployed father had given him presents - a headband, a beautiful kimono, a fan, and, slightly incongruously, a digital watch - and had toasted him with sake. He, of course, had allowed himself only a single small cup. He had passed the tests and was now the family breadwinner.
The day had gone so well. He enjoyed operating the controls of his subway train, and was thrilled to power it through the tunnels beneath Tokyo and to emerge into brilliantly lit stations, crowded beyond imagining with people.
Then there was the camaraderie shared with his new colleagues. The company exhortation in the locker room at the beginning of the shift, the dirty jokes exchanged over hurried bento lunches, the subtle greetings between drivers and station staff.
Yet, as his first day was drawing to a close, as he was carefully guiding the train into the penultimate station, he looked down ever so briefly to glance at his watch. A fraction of a moment later, he looked up again, and saw the man falling.
CHAPTER ONE
Another bleak October afternoon. There would be no Indian summer that year. A young girl was sitting on her bed, engrossed in a chess game that she was replaying from the 1948 World Championship. [3] She sometimes shivered in the draught from the window, and occasionally lifted her eyes, dark and liquid, from the chess board to push away strand of deeply brown hair.
Her mother knocked, unheard, on the door and stepped in.
"Come on," she said, "It's time to get going. Put on your coat."
"Sheesh, Ma!" moaned Caitlin, "Do we really have to go?"
"Yes, Caitlin," replied her mother, "You do."
"But I'm just getting to Smyslov's famous combination."
"That can wait. This is important!"
"No, this is important." declared the girl, stubbornly.
"It can wait. Got it?" rasped her mother.
"And it's so creepy. So weird. I hate it there," protested Caitlin, as her mother grasped her wrist.
"Now you know there's nothing to be scared of," scolded her mother, "But I do know you just want to get back to your chess sets. Huh, a girl of your age shouldn't be frightened of something like that anyhow. It's a few prayers and a pinprick."
"Then why don't you do it, Ma?"
"Because," responded the woman, "That's why. Now make with your shoes and be quiet already."
They arrived at the small temple off Chatham Square about ten minutes later. The woman nudged the reluctant girl, and her daughter performed the usual rituals while she waited. Having done these, Caitlin braced herself and stepped into the sanctuary, carrying a small bowl of Frankincense.
She was greeted by the elderly priest, a small, sprightly man with a shaven head and stringy beard. He led her to the altar and showed her where to place the Frankincense offering. He grabbed her wrist as she was placing the bowl on the heater; she rolled her eyes and tutted when he indicated to her to use both hands.
She then lit a taper and applied it to the incense. The priest bade her kneel and intoned some prayers to the altar, which was surrounded by candles and which bore a small black and white photograph of a rather haggard-looking Asian man.
Caitlin was not expecting anything spiritual to happen. She had done this before, on several occasions, and nothing had happened. Yet this time, despite the aching boredom, she felt a certain unwelcome, but exciting unease.
After they had prayed together - or, rather, after the old man had prayed and Caitlin had stifled several yawns - the priest rose and produced a small camphorwood chest.
He opened the chest. It contained ten stones - five black and five white. It also contained a small silver knife, which had a groove running along the blade, which the priest removed.
For Caitlin, this signalled the beginning of the worst part. The priest drew several short breaths and then his eyes rolled upwards, to show only the whites. He then grasped the girl and made an incision in her right arm, using the silver knife. She gasped. For a moment, she thought only of fleeing. She hated these stupid mumbo-jumbo rituals now and had only gone through them before for fear of her mother, but now, oh now she hated it all enough not to care about that. Yet, the moment passed, and she found herself compelled to stay.
The priest allowed the girl's blood to trickle along the groove and onto the sandy floor between them, gradually forming the outline of archaic versions of Chinese characters - North, West, South, East, Sky and Earth. She began to feel faint, for the priest had cut somewhat more deeply than usual and had forgotten to apply a tourniquet, a legal rather than ceremonial requirement, before commencing the ritual.
He took the stones and, his eyes remaining white and sightless, cast them in threes over the symbols. A black stone was left over.
Several minutes passed, and Caitlin struggled to remain conscious, but she was still awake when the priest refocussed his eyes and spoke.
"You will choose between two roads," he said solemnly. His voice sounded more resonant than Caitlin had ever heard it.
"If you follow chess," he continued, "You will achieve glory and find destruction."
"If you follow wei qi", he said, "You will achieve glory and bring destruction".
At this point, the girl fainted altogether. When she awoke, she was lying in her own bed, her right arm tightly bandaged. She gradually became aware of an unfamiliar male voice.
"Now, Mrs Wang," it said, "She will need to stay in bed for another two days. She has been in shock, and although she is in excellent health, it would be wise to take things gently."
END OF CHAPTER ONE
CHAPTER TWO
"What?" exclaimed Mrs Wang, "What did you say?"
"I said, can I go to the wei qi parlour with Uncle Sam tonight?"
"But tonight's chess night!" replied her mother.
"I'm getting bored with chess." said Caitlin.
"But you always hated it when I got out your father's wei qi board. You know I got rid of it because of you. What's with the sudden change of heart?"
"I just want to try it, alright?" snapped Caitlin.
"Hey!" hissed Mrs Wang, "You will not talk to me like that."
"Sorry," whispered Caitlin.
"Good," said her mother. "I will ring Uncle Sam and ask him to pick you up at about seven."
Later that evening, Caitlin found herself sitting at a long table, the only girl in the dimly lit, smoky room. The gentleman across the table, Mr Pak, continued explaining the rules.
"So, if you play there, it's got two eyes and you can't be killed. Do you understand?"
"Yes, Mr Pak," replied Caitlin, "But what if I play there?"
"No, because..." replied Mr Pak. But at that point Mr Pak noticed something and started to study the board more intently.
"Can't Black take White's surrounding stones?" asked Caitlin.
"Erm, erm," replied the elderly gentleman, "Well, I think so, just let me put some stones down and check."
A few of the other players had overheard the conversation and were looking on. One of them grabbed a stone and put it down.
"What would you do if White did that then?" asked Mr Chang.
"But then I'd put one here," replied Caitlin, excitedly.
"Did you really never play before?" queried Mr Pak.
"Yeah, surely your father must've..." asked another man, a tall, balding person in his late 60s.
"Don't talk about my father!" snapped Caitlin.
The room became silent. The balding man eyed the girl, the corners of his mouth quivering. The silence was broken at length by the patron, Huang Zi.
"Apologise to Mr Zheng at once!" ordered Huang Zi.
"I'm sorry," murmured Caitlin.
The elderly man was unimpressed.
"I said, apologise!" commanded Huang Zi.
"I am truly sorry," whispered Caitlin, "Please forgive me."
"Mr Wang," said Huang Zi, "I think you should take her home now. It's getting late and she has ruffled enough feathers for one evening. But I will be in touch with your sister-in-law before you get her home."
"Please, don't do that," pleaded Sam Wang, stepping up to Huang Zi so that he could whisper in his ear. "Marlene will go nuts if she hears about this."
"That's not why I want to talk to her," replied Huang Zi, enigmatically.
END OF CHAPTER TWO
CHAPTER THREE
Marlene Wang was standing by the small table in her hallway, talking into her antiquated telephone.
"No, I told you already," said Mrs Wang, "She has never played the game before. Anyway, what did you say she did? Saw a move some old man missed? So what's so remarkable about that? She's very clever and plays chess a lot."
"Yes," said Huang Zi, "You're probably right. Old Mr Pak isn't very bright and I could see he didn't set up the position properly. But, look, could you do one thing for me?"
"Go on," responded Mrs Wang.
"Bring her down to my class at the China School next Thusday morning. I want to do some little tests."
"What kinda tests?"
"Look, Mrs Wang," explained Huang Zi, "I'm pretty good at spotting talent...there are certain things to look for, even if a child doesn't know the rules of the game."
At that moment, Sam arrived with Caitlin. Mrs Wang covered up the mouthpiece and told Sam to pour himself some coffee, while the girl removed her shoes. She then hurried to finish her conversation with the wei qi parlour proprietor.
"Okay, I'll do that," agreed Mrs Wang, "It's late. I'll see you Thursday."
The next few days passed uneasily. Marlene Wang was worried on the one hand because Caitlin stopped bringing chess books hom fom the library, but on the other she was quite pleased not to have to find her playing with the oddballs over at Washington Square. She was relieved, too, that her girl had ceased talking interminably about Botvinnik and Bronstein, Smyslov and Petrosian and a host of other obscure Russians, but nurtured a host of other, more nagging worries. Was this new interest in wei qi just a fad? But what if she started to hang around with the fanatics who had ruined her father? What if she turned out to be like her father?
Persuading Caitlin to accompany her to the China School did not prove easy, either.
"I'm an American! I don't want to go to no ghetto Chinese school!" shouted Caitlin.
"I already explained three times now that I'm not taking you there to enrol," said Mrs Wang.
"Huh! You told me the same thing about the temples and the Aunties," spat Caitlin, "Just a visit, you say. Next thing I know and I'm spinning prayer wheels and burning incense like they're going out of style. What is it with you? I'm sick of all this dumb stuff."
"You mind your mouth!" retorted her mother, gripping her wrists, "You remember what happened last time you showed such disrespect?"
Caitlin paused and felt a twinge of pain as she remembered. Wisely, she fell silent and listened to her mother.
"You're about an inch away," warned her mother. "Now, you're coming with me to meet Mr Huang. And, if you would just let me explain just once more if you'll only listen, he wants to play wei qi with you."
"Anyway, Caitlin," her mother continued, "I just don't understand you. One minute you hate all things Chinese, and the next you ask me to take you to a wei qi parlour. Then you complain when I want to take you to play wei qi at the China School."
"I want to play wei qi," said Caitlin, petulantly. "I don't want to go to a Chinese School."
"As I've told you, a million times already, I'm not taking you there to enrol."
Caitlin hated the place. She hated the gaudy red- and green-painted gates, the banners, the signs written in Chinese. She barely managed to hide her disgust when Mr Huang poured her a cup of a green tea after she had been shown into his office. Her expression brightened only when Mr Huang took out a large go board and produced a pair of baskets, each containing glass stones.
"Where do you think the best spot is?" he asked.
She looked at him quizzically.
"If you had only one move," he said, "Where would you put it?"
She took a white stone from the basket nearest Mr Huang. He winced a little, but let her rudeness pass. He noticed that she held the stone correctly, gracefully even. Caitlin did not hesitate, but placed the stone firmly onto the central point - tianyuan - the source of heaven.
"Why did you do that?" asked Huang Zi.
"Who controls the centre," she replied, "Controls the whole."
"Did you learn that from playing chess?"
"No, I knew that before I learned chess."
"And what if I started off here?" asked Huang Zi, placing a stone in one of the corners.
"I noticed those old men doing that," replied Caitlin, "But what do they know?"
Huang Zi coughed, holding back his annoyance. Marlene Wang looked sharply at her daughter.
"What's the point of this game?" asked Huang Zi, "Do you know that?"
"To control," responded Caitlin, instantly.
"No," answered Huang Zi, "The idea is to take territory."
"But the one who has control," returned Caitlin, without hesitating, "Will take it in the end."
Huang Zi's face turned purple and Marlene Wang angrily advanced on her daughter. But, an instant later, Huang Zi began laughing. His body shook with laughter. He howled and stamped on the floor. Mother and daughter stared at him in amazement. Eventually, he regained his composure.
"Miss Wang," he said, "Please leave the room."
END OF CHAPTER THREE
CHAPTER FOUR
Huang Zi became Caitlin's go teacher. The clientele in his go parlour quickly learned to fear and respect the gangly half-Chinese girl with the beautiful brown, almost black, hair and pale skin. They feared her because she was brash, a bad loser and highly emotional, scarcely able to hide her glee at opponents' mistakes and prone to tears when things went against her. They feared her also because she seemed to gain a stone in strength with every game.
Huang Zi tried hard to smooth out her rough edges, even banning her from the club for a week after she had humiliated old Mr Pak in her first nine-stone game as White. Yet, there was little he could do. Sam Wang had warned him about Marlene's alcoholism and unstable temperament. Any mention of misbehaviour might result in a beating. Nor could they think of a way to remove Caitlin from Marlene's care. She was all that Marlene had left of her husband. Heaven only knew what she would do if Caitlin were taken away.
Nevertheless, some progress was achieved over the first year. Huang Zi had arranged for Caitlin to attend the China School, which he part-owned, for one day a week. Caitlin was horrified at the idea, but Huang Zi had threatened to cease teaching her go if she decided not to go along with it. The idea was for Caitlin to improve her Mandarin and to become more appreciative of her ethnic background; she had never been able to understand why her White mother would sometimes insist on talking to her in Mandarin, and she hated it whenever her mother dragged her along to her obscure Confucian temple. At least, thought Huang Zi, Caitlin might appreciate a more authentic cultural experience. Not that Caitlin's progress was easy. The other children teased her at first because of her hair, and because she was tall and pale. But, gradually, Caitlin earned respect. She was not only tough when playing adults at wei qi, but she was well able to look after herself, one day sending one of the toughest boys home in tears after he had foolishly picked a fight with her. Her Mandarin improved quickly, too, in spite of distaste for it.
Occasionally, Huang Zi would take Caitlin to other go clubs around New York. She particularly enjoyed trips out to Flushing, which was just beginning to become a popular location for Korean and Chinese immigrants. Although she lost most of her games, she always returned from Mr Seong's baduk hall on 49th street with her head buzzing with ideas. The players there were so tough, so determined, so ruthless. She so much wanted to be like them.
By November, Caitlin had been playing for just over a year and had reached the rank of 1st dan in Huang Zi's wei qi parlour. She still had little chance when playing on even with the Koreans out in Flushing, but she was reducing her handicaps and growing in skill with each game she played. Another interesting factor was that she was becoming much better at controlling her feelings. You could see that she was angry when she lost, but somehow she found herself able to offer the victor an icy smile. Most of the men found it cute for an eleven-year-old girl to smile like this, but they did not realise that she was planning to belittle each of them as soon as she became strong enough -- she never forgot and certainly never forgave a defeat.
It was snowing outside, but Caitlin was sitting by a parafin heater in the Seong Baduk Hall, engrossed in a romance novel. She found such literature corny, but somehow it helped her to express new feelings that were stirring within her. It was quiet, save for the occasional moans or laughs of a pair of elderly gentleman who played speed go in one corner, gambling a dollar a game. She took no interest in them. Even though they were stronger than her in a manner of speaking, she could see that they played a poor class of go, and she didn't want to waste her time on it.
Huang Zi returned, carrying a brown paper bag and accompanied by a smartly dressed Asian man. They removed their coats and brushed snow from them.
"Here, Caitlin," said Huang Zi, handing Caitlin the bag, "I got you a burger and fries. Sheesh, when are you gonna start eating real food?"
"Thanks," said Caitlin, scarcely looking up from her book.
"Now," said Huang Zi, "Allow me to introduce you to Mr Yamada. He is visiting from Japan."
"Hello," murmured Caitlin, in a matter-of-fact voice.
"Caitlin!" barked Huang Zi, "Be polite! Mr Yamada is a very important man."
Caitlin got up and put down her book, a little more forcefully than necessary. Cringing inside, she bowed deeply, and called to mind the greeting Huang Zi had taught her.
"Yamada-san, hajimemashite. Dozo yorishiku."
Yamada responded in English, "Hello Miss Wang, may I have a game with you. Mr Huang was telling me how skilful you are."
Caitlin nodded and sat down at one of the go boards. Mr Yamada sat down opposite her. She reached for the white stones. Huang Zi was horrified and went over to grasp the bowl, but Mr Yamada merely smiled and spoke gently.
"You may certainly have the white stones, Miss Wang," he said, "But allow me to pass on my first move."
Caitlin turned pink, and offered the bowl of white stones to Mr Yamada, but he laughed and refused it. She grasped a stone and slapped it hard into the top right corner. Mr Yamada passed again, and again, until five white stones were in place. He then began to play.
Yamada played loose, fluid moves, setting up light positions throughout the board. Caitlin was amazed that he did not attack with dogged persistence like the Koreans, indeed he even allowed her to capture a group of five stones in one of the early exchanges. At first, she thought that her opponent was soft, and would be an easy kill, but even as she was removing his stones from the board she blushed and hesitated, as she saw how strong his shape had become, how her capturing stones were themselves tightly confined, no longer to play any meaningful part in the game. Yamada noticed her reaction and smiled inwardly. She had made one of the commonest mistakes, for sure, but he was impressed that she had realised it so quickly.
Caitlin began to think hard. Every impulse told her to play close to Yamada's strong group, to take away the territory that he threatened to make. She picked up a stone and went to place it, but stopped herself; she saw that if she played where she had wanted to, then he would make a pincer. For sure, her group would survive, and the strong enemy group would be neutralised, but what about her corner? That would become much weaker - Yamada might even be able to kill it. Not only that, but she also asked herself, what about the invading group itself? What would she get for it other than a miserable, grovelling life? Maybe Mr Kim, the 2 gup and one of the strongest players in the Baduk hall, would play like this -- indeed she had seen him do it -- and get away with it -- she had seen him do that, too -- but it simply didn't feel right. Better skill doesn't make one a better player than the opponent, not always. Some people, like old Mr Cho, were hopelessly lacking in skill, at least compared with their peers, and yet somehow managed to win their share of games through better overall judgement. Everybody knew, she pondered, how Mr Cho would avoid fights and play tightly, but do so in such a way that his strategic gains would outweigh his tactical losses. So, in the end, she decided she would try and play as she thought Mr Cho would.
The minutes ticked by, and Yamada studied his opponent carefully. She was so pretty, so delicate; and yet there was something about the way she looked at the board, intently evaluating possibilities, that bespoke cruel determination. He had rarely seen that particular look, that trance-like concentration, except in the very finest players in Japan.
Caitlin wracked her memory, thinking back over games she had seen and played with Mr Cho, trying to find a comparable situation. Eventually, she opted on a tight small knight's enclosure from her star point, facing toward her opponent's strong group. Sure, Huang Zi and others had told her that this move was frowned upon as a rule,[1] but this seemed the only way to play, the only way to continue developing her position while thwarting her opponent's expansion in that direction.
Huang Zi was watching, and shook his head very slightly, but Yamada sank into thought. This was the best move, but not at all easy to find under the circumstances.
Two hours passed unnoticed. A small crowd of players arrived unnoticed, too.
Eventually, the game concluded, after several nerve-jangling ko fights had been played out. Caitlin had lost by three points. She turned white and ran out of the room, sobbing, even as Mr Yamada had begun returning stones to the bowls, and even as the onlookers were clapping their hands in admiration for such a fiercely contested game.
Huang Zi turned after Caitlin, "Hey, Caitlin Wang, come back this instant, and thank Mr Yamada for the game!"
Yamada got up and caught up with Huang Zi.
"Mr Huang", said Yamada, "I am not offended. You cannot know what she put into this game. But I tell you, I have not seen talent like this in all the forty three years that I have been playing go."
END OF CHAPTER FOUR
CHAPTER FIVE
They eventually found Caitlin lying semi-conscious in one the back streets. She had sat down weeping in the snow, oblivious to the cold and filth. Huang Zi took off his coat and wrapped her in it, and drove her back to Manhattan Chinatown, to her mother's apartment.
Caitlin suffered miserably from a chill for another ten days. Her mother alternated between anger and concern, bringing the girl soup one moment and scolding her the next for being so foolish.
Still, she recovered, and returned to her routine of reading the old go magazines Huang Zi had given her, devouring trashy romances, and attending school.
While Caitlin was recovering, Mr Yamada and Huang Zi met for dinner, at a smart place near Yamada's Brooklyn hotel.
"How is she?" asked Yamada.
"The doctor says she will be fit for school again by Monday," replied Huang Zi.
"I tell you again," said Yamada, "I have never seen a child quite like her."
"I remember Kuwabara when he was a child," continued Yamada, as he poured a drink for Huang Zi, "He used to go off wandering when he had lost, but never in such weather."
"I've got to teach her some manners," lamented Huang Zi.
"Hah-hah," laughed Yamada, "That will come. But she'll never be able to mean it. She's too much of a killer, that one."
"Indeed," said Huang Zi.
They continued talking for a while, reminiscing about young players they had known in the past, until they reached a late stage in the meal. They decided to bring their discussion to the point.
"Now," said Yamada, "May I make a proposal?"
"Do please," responded Huang Zi.
"A child of such talent might do well if she spent some time studying in one of our go schools in Japan," said Yamada.
"Indeed," said Huang Zi, "The go world in Japan is flourishing. I have noticed even some Chinese names doing well of late."
"Hah-hah," laughed Yamada, "Yes, young Rin will go far, I may predict."
"But, to do so well," continued Yamada, "It is naturally necessary that a child be recommended and sponsored."
Huang Zi nodded his head.
"To that end, Mr Huang," said Yamada, "I need no further convincing. I would gladly provide a letter of recommendation to Mr Takeshi himself..."
"Takeshi Maruhito? Takeshi himself!" coughed Huang Zi, genuinely surpised.
"Yes, the go school of Takeshi Maruhito Meijin. Already the Number One go dojo in Japan."
"Do you really believe in her talent that much? From just one game?" exclaimed Huang Zi, forgetting himself in his surprise.
"Indeed I do," replied Yamada, equally directly, but cordially.
"There would of course be minor practical matters to arrange," continued Yamada, "But Mrs Takeshi will see to her comfort, I am certain."
Huang Zi frowned.
"Mr Yamada," said Huang Zi, "On your recommendations, I would gladly take any practical matter in hand. However, I can forsee a serious problem."
The problem, of course, was Marlene Wang. Huang Zi and Yamada went to see her while Caitlin was at school. Marlene was furious.
"Take her to Japan?" cried Marlene, "I don't want her setting foot there. Don't you know what the Japanese did to Marlene's grandfather? Don't you?"
"I know," replied Huang Zi, "But time moves on."
"Not for Wang Qin!" screamed Marlene, "Not for his friends, not for his countrymen."
Marlene rounded on Yamada.
"And you!" she cried, "What about you? Who did you slaughter?"
"Madam," replied Yamada, with dignity, "I killed nobody. I served my emperor and my country, but I was wounded and discharged before I could even aim my rifle."
"That doesn't change anything!" raged Marlene.
"Maybe it does not," said Huang Zi, "But what about Caitlin? what about her life? God knows how I'd like to change the past, but how can we not allow Caitlin the best chance in her future?"
Marlene stared at Huang Zi, still shaking with anger.
"Marlene," he said gently, "Japan has changed. They have suffered as well. They have to face the future, too. We all have to begin healing sometime. Must Caitlin bear her grandfather's wounds?"
AUTHOR'S NOTE: I am uncomfortable with this section. I cannot see how I can avoid mentioning the War given the time frame of my story, but I don't want to offend anybody. How can I keep this even-handed and fair without losing dramatic effect?
"And what about me?" asked Marlene, "I do not want to go to Japan. Yet you're asking me to send my only daughter there."
"There are many Americans and Chinese in Japan, too," said Yamada.
"Yes, Marlene," said Huang Zi, "It wouldn't be so very different to living here."
END OF CHAPTER FIVE
CHAPTER SIX
It took many months to make arrangements for Marlene and Caitlin Wang to leave the United States. Marlene changed her mind frequently, and re-changed it equally often. Eventually, though, Marlene agreed to Huang Zi and Yamada's plans, on condition that Caitlin lived with her, rather than at Takeshi Meijin's house.
Caitlin herself was horrified at the prospect of the leaving the United States. She was still less than delighted with her American mother's obsession with Chinese traditions, and with her weekly sessions at the China School. The thought of learning another language, learning yet more customs, and eating still more weird food was almost too much to face. However, Huang Zi was able to persuade her. The prospect of earning large amounts of money was not yet especially tempting, but when Huang Zi mentioned the kinds of players Caitlin would be able to play with every day the girl's imagination began to fly.
They were to depart at the end of summer, shortly after Caitlin's fifteenth birthday. The final days of summer term seemed unreal to Caitlin, and she found great difficulty in concentrating on classes. She loved modern life in New York, but she always found learning American history to be boring at best, and pointless at worst. What did she care how the Gettysburg Address went? What did she care for Andrew Grant?[2] What good to her was the history of railroads so long as she could get to where she wanted? As for the China School, strangely it seemed to her to be less of a burden. What was one day a week spent speaking Mandarin and learning calligraphy compared with the life that was in prospect for her? She was dreading Japan and all its customs, so familiar and yet so foreign, but even so she was looking forward to it because at least she would get to play the fighting games of go that she longed for.
The last day of term came quickly. Caitlin was gazing blankly at the blackboard as Mr Harlow finished writing out revision notes. She began nodding off, but was caught up short when she heard her name.
"So, if the value of Y is 3.5, who can tell me how to work out what X is in this equation," said Mr Harlow, looking around, "Hmm. Caitlin Wang."
"Huh, yeh, sorry," she responded.
"If the value of Y is 3.5, can you tell us what X is in the equation?" repeated Mr Harlow.
"Erm, erm," hesitated Caitlin, thinking furiously, "23.567."
"Jumping Jehesophat!" responded Mr Harlow, "That's absolutely correct, but I only wanted the answer to one decimal place you know."
"Sorry," replied Caitlin.
"No, it's great," said Mr Harlow, "You're a strange girl. Half asleep and then you solve that equation on sight to three decimal places. Oh well, shame you're leaving. Right, let's move on. Gary Karpov! Stop scratching yourself - you're not a monkey! - and tell me what the answer would be if I made the value of Y here 3."
Most of the class turned back to the blackboard, but a few faces glared enviously at Caitlin for a moment. There was one face however, that remained fixed on her for more than a moment, and it bore a smile. Caitlin noticed the boy, and smiled back at him. It was shy Peter Gray, the kid from Queens.
The bell rang. Caitlin gathered her things together slowly and deliberately, taking much more time than necessary. Peter Gray did the same thing. She waited for him in the corridor.
Caitlin looked at her watch.
"Nuts! I'm going to miss the bus," she lied.
"C-c-can I walk you home?" stammered Peter.
"I guess you'll have to," replied Caitlin.
Neither the boy nor the girl said anything for several minutes. Peter did not know what he should say; he had noticed Caitlin months ago, had been fascinated by her, but had never found an opportunity to make contact. Caitlin was not nervous herself - in fact she felt slightly amused by his shyness - but she wanted him to say something, to show her something of himself. Of course, several boys had asked her out already, but none of them had shown her any respect: they had been confident that she would say yes, and were stunned when she rejected them. All Peter seemed to want, in contrast, was to be near her for a time, and she sensed his fear and joy as he achieved even this small thing - and she liked that, for it made her feel special.
Eventually, Peter thought of something to say.
"I hear you like playing chess, that you're really swell at chess," he said, "I like chess. Will you play a game with me some time?"
"I don't like chess," she replied, but on seeing his features fold, she added, "But I used to."
"Would you play with me?" he asked again.
"No," she responded.
He looked downcast once again, and he was silent for some time. She decided the moment was right to rescue him.
"Have you ever played go?" she asked
"What's that?"
"Maybe some time I will show you," she responded.
She turned to enter the subway station.
"I'll be okay by myself now Peter," said Caitlin, "Thankyou for walking with me. I'll see you again."
He looked sad and disappointed, and he said goodbye and trudged off. But looking back for a moment, he realised that she had ben watching him instead of turning straight into the tunnel to the subway. Perhaps she was interested in him, after all.
CHAPTER SEVEN
Peter Gray had never heard of go, and neither had his mother and father. He got the dog-eared encyclopaedia down from the shelf and looked it up, but he was hardly convinced by the definition:
'GO or GOBANG. An Oriental game popular in Japan. Played on a grid of 15 x 15 squares. The object is to make a line of five counters, orthogonally or diagonally.'
This did not seem to be the kind of game that anybody would give up playing chess for. He thought about asking Caitlin next time he saw her, but there were two drawbacks to that idea. First, it was already Wednesday evening and term ended on Friday, meaning that it was quite possible he would not get to see her (Math being the only class they both attended at the same time). Second, he worried that she might think him an idiot. So, on consideration, it seemed better to him to do what he always did when he came across a puzzle - to go to the city library at the weekend and to do some research.
In the meantime, Caitlin's mother received letters from Japan, another one confirming Caitlin's acceptance at the dojo of Takeshi Meijin and one explaining precautions and arrangements required to take up residence. Huang Zi was also becoming something of a fixture in the house, tutoring Caitlin daily and constantly reassuring Marlene. For all this, Japan suddenly seemed unbelievably distant and vague in Caitlin's mind, as unreal as school had become. She was surprised at herself, but she was intrigued by the shy, awkward boy who had walked her to the subway station last night. She sweetly regretted not having been a little more forthcoming, too, but she hoped that she he would seek her out.
They did not see each other. Somehow, the teachers managed unintentionally to contrive things so that class overlapped by a few minutes, so that Caitlin would have to be on the other side of the building as Peter was arriving in another part of it.
Peter did not give up, however. He went to the library on the weekend following the end of term and began digging. The librarians had not heard of a game called go, but his luck changed when he stumbled across a book entitled Go and Gomoku by the famous chess master Edward Lasker. He settled down at a desk, and began to read.
He was enthralled. What a simple concept for a game! How amazing the possibities! He also learned, with interest, that the game was sometimes known by other names. And so, before Peter left the library, he began scouring the telephone directories for the words "igo" and "wei qi". He was surprised to learn that there were over thirty locations in the five boroughs of New York where one could play, but he was resolved to try them all if he had to, just to show Caitlin what he was prepared to do in order to see her again.
During the same weekend, Huang Zi presented Caitlin with a book.
"These are the games of Master Wu," he said, "I have mentioned him before, but now I think you are ready. He is the real number one player in Japan. Greater even than Takeshi Sensei. Like us, he is Chinese. One day, you will get to meet him. Strive to become like him and do honour to China."
Caitlin felt honoured and irritated at the same time. Not so long ago she would have retorted that she was an American, but now she recognised the trouble Mr Huang had gone to to obtain the book and received it gratefully.
"I don't want to you to continue attending the Baduk Hall or any other wei qi parlour from now on," said Huang Zi, "From now on, I wish you to memorise one game from that book each day."
Caitlin looked at him with a puzzled expression. Again, she felt irritation along with other emotions.
"There are those who play," continued Huang Zi, "And those who progress. Master Wu's moves will show you the way."
Caitlin understood, but it was simply not in her character to follow such a command. She would play go, no matter what Huang Zi told her to do.
Several days passed before Peter Gray summoned up the courage to begin his quest. He first tried the Seong Baduk Hall in Flushing. He arrived in the mid-afternoon, when the only patrons about were a group of elderly men and Mr Seong's younger brother, Mok. Peter found the place thorougly intimidating. The air was already blue with smoke, and an argument was in progress.
"Hello?" said Peter, nervously.
"Yeah?" responded Seong Mok, "You've come to play Baduk?"
"I don't know how," Peter admitted.
"Beginner's class on Friday, 6 PM, $2," responded Seong Mok, rather curtly.
"Please, I'm looking for a girl, her name's Caitlin," said Peter.
Seong Mok misheard him.
"Sorry, nobody called Kate here," he said.
Peter thanked him for his trouble and left, feeling deflated. It only later occurred to Seong Mok that there was a customer of the boy's age called "Caitlin Wang"; he did not think of it immediately because everybody referred to her as "Miss Wong" or, somewhat more often, as that "Chinese brat". He was not surprised that a boy was look for her, however - she was becoming rather cute. Dang! If only she were a little older, he thought.
Caitlin scoured the telephone directories, and eventually hit on a club that sounded promising. Somewhere where she would not be known; somewhere that had not banned her for her poor manners; somewhere where she could get a decent game without Huang Zi finding out about it.
By the time two weeks had passed, Peter had nearly given up his search. A couple of the go parlours he visited knew of Caitlin Wang, but were unable to provide information as to where she lived or even when she would most likely show up again. Most of the time he felt embarrassed and had great difficulties explaining what he was doing. He was not aware of the coincidence, of course, but at one of the clubs one of the players sat him down and played a game with him; his name was Pak, and he proudly wiped out every one of Peter's stones. Peter asked Mr Pak whether he knew of Caitlin Wang.
"Ah, Miss Wang," he said, "She used to play at Huang Zi's Parlour."
"Yes?" said Peter, eagerly, "Where is it?"
"Ah, he closed it down a few weeks ago," replied Mr Pak.
"Do you know where I could find this Huang Zi?" asked Peter.
"Sorry," said Mr Pak, shaking his skinny bald head.
"What is like? Is she good?" asked Peter.
"She's good, but I could give her 9 stones, just as I did you," lied Mr Pak.
The other regulars at the club overheard this, but let it pass. They had vaguely heard of a supremely strong half-Chinese prodigy, and they knew Mr Pak to be a bit soft in the head, but what was the point of correcting him? It was not as if he had very much else to do than make fantastic boasts and to beat up on any new players who happened to come to the club. Still, as Peter was climbing back up the stairs to the sidewalk, a woman trotted up behind him and put her hand on his shoulder.
"Excuse me," she said.
Peter turned round to face the woman, who had been sitting in the corner quietly washing go stones in a bowl of soapy water while he had been playing with Mr Pak.
"Did I hear you say you were looking for Caitlin Wang?" said the woman.
"Yes," replied Peter.
"I have met her once or twice," the woman said, "I'll bet you like her, eh?"
Peter blushed.
"Well, she's a strange girl. She's kind of unpredictable." continued the woman, "But I think I might know where you might find her."
Peter looked at her.
"My husband said that last week she showed up at the Dragon on 123rd St. It's a bit distant, and he was only there to see his cousin about a business thing, but he noticed that she was there. He didn't know what she was doing so far uptown, but there you go."
"The Dragon?" Peter said.
"Yes, it's a restaurant," said the woman, "But if you ask for Guo Yang's Wei Qi they'll show you round the back. It's open every night, but the 'gang' only meet on Thursday night."
"The gang?"
"Gambling. High stakes," she explained, "But don't you dare let on that you know about that."
Peter thanked her and headed home, happy to have another possibility to try.
Another Thursday evening rolled around. Again, Caitlin lied to her mother and Huang Zi that she was heading to a Japanese evening class at the community college in Brooklyn. Again, she declined Huang Zi's offer of a ride. Once more, Huang Zi later noted that money was missing from his wallet. He was becoming extremely suspicious. He was quite a careless man, he knew, and it was not unlike him to lose $100 bills - but for this to happen three Thursday evenings in succession? What the hell could Caitlin need to steal such large amounts of money for? Then, a dark thought entered his mind. Damn! Had she got mixed up with the "gang"? How in heaven's name did she find out about it? He had to act.
END OF CHAPTER SEVEN
CHAPTER EIGHT
Peter turned up at the Dragon on the Thursday and asked for Guo Yang's Wei Qi, but the waiter politely denied any knowledge of it. Peter did not believe the waiter, but lacking sufficient money to hang around and to buy a meal, he had no choice but to loiter in the street opposite the restaurant and to wait and see if Caitlin appeared.
A middle-aged man walked into the restaurant. The waiter recognised him immediately.
"Ah, Mr Huang," said the waiter, "They are all here. And there's a new face. A girl."
Huang Zi's face turned red. He was a calm man, but now he was becoming very angry.
In a back room, Caitlin Wang was playing go with a stocky man who appeared to be in his mid-forties. Half a dozen other men were standing around the table, following the action on the board. Wads of money were stacked on the table. Every spectator's expression changed from one agony to another with each move, as a violent fight unfolded. The girl was lanky, slight and weak-looking, but on the go board she was slugging it out toe-to-toe with Harry Yang himself.
The door burst open.
"So!" roared Huang Zi, "THIS is how you treat me!? You're a no-good scum like your father! Well, I'm gonna thrash your butt here and now and so bad you'll be standing all the way to Japan."
Caitlin looked at him, stunned. The other men had seen many violent outbursts in their time, but nobody had ever seen Huang Zi look so angry, not even in the good old days when he would hang around drinking and gambling with "Drunken Master" Wang Ping Yuan. They did not oppose him as he dragged Caitlin out of her chair and into the restaurant. He threw her over one of the tables, upsetting some plates, and removed his belt.
At the same time, Peter was looking into the window and saw what was about to happen. He could not stand it. He did not stop to think but ran into the restaurant and grabbed Huang Zi's wrist, even as he was swinging his belt to strike the terrified girl.
There was mayhem. Huang Zi tried to push the boy away, but Peter would not let go. They struggled together, upsetting another table, kicking each other but somehow staying on their feet. When, after several long minutes, it appeared that Huang Zi was overpowering the boy, Peter desperately lunged up and bit deeply into his arm, straightaway drawing streams of blood.
The pain of the bite yanked Huang Zi back to his senses. He dropped the belt and saw himself for how he was behaving: a bully. He crumpled up and began sobbing uncontrollably.
Peter ran over to Caitlin and put his arms around her. She, too, was crying, heaving great sobs. She was out of her mind with fear.
Yang Guo himself appeared.
"What the blue blazes is going on?" he demanded, as he beheld the staggering mess in his restaurant.
"Shall I call the police?" asked on the diners.
"Damn no," replied Yang Guo.
Yang Guo turned to his son, who had been watching the scene.
"Harry, get them into the back room NOW. And when you've done that, get this goddamned mess straightened out."
The atmosphere in the back room was bizarre. Somehow anti-climactic, and yet even more tense at once. Caitlin was curled up in one corner, gently sobbing as Peter held her tightly, trying hard to comfort her and not having a clue as to what to say or do.
"Old Huang Zi," said Yang Guo, shaking his head, "And there I was, thinking you had gone all respectable."
"I'm sorry," croaked Huang Zi, "I will pay for the damage."
"You're damn lucky that I can't call the cops, Huang," said Yang Guo.
"I never thought I could lose my temper like that," continued Huang Zi.
"So, I take it she did not have your permission to be here, after all?" asked Yang Guo, ironically. "Anyway, I suppose I'm gonna have to call Dr Li over to patch you up."
Yang Guo called for Dr Li and gave Peter some dollars to take Caitlin home in a cab. Huang Zi tried to approach her, but the others would not let him.
"It's gonna be a long time before she trusts you again," said Yang Guo.
END OF CHAPTER EIGHT
CHAPTER NINE
Caitlin refused to see Huang Zi for two weeks. Huang Zi explained to Marlene what had happened and apologised profusely. Marlene herself was furious with Caitlin but could not bring herself to punish her for the thefts. She was, in fact, more angry still with Huang Zi for the way he had terrified her daughter in the restuarant.
Every day, Peter would call. Had things been different, Marlene would have turned him away, but, as it was, she felt profoundly grateful to him for way he had defended Caitlin.
To begin with, Peter would sit with Caitlin in her room. She said very little, but he understood. He would gently hold her hand whil she gazed at the wall, half-remembering Huang Zi's outburst and half-escaping into the games of Master Wu that she had memorised.
Then, one day, Caitlin began to talk. She told Peter everything, even the things for which she had no words. How she longed for her father, whom she remembered only distantly, a vague form that smelt sweetly of cheap whiskey and cheap tobacco, who would put her on his knee and hold her, safe; safe forever from all harm. How her father faded away even before she could remember him properly. She told Peter about her mother, the way she drank and sometimes spoke only to her in Mandarin, even though she knew little of the language and even though her mother was really ordinary Marlene Thomas from New Jersey. How her mother would take her to strange temples and make her pray to photographs of her grandfather and his father before him. How she had learned chess at school and had found within it a world without pain, a world of play and delight so sharply contrasted with the human ruins around her. How finally she had been overcome with the urge to play the strange game that she had seen her Chinese relatives playing at parties, and how that game made even chess seem as a stream compared with the ocean. And it was at that moment that her eyes met with Peter's, and they felt pulled together by an irresistible force, a force that compelled their lips to meet in an endlessly sweet and unreal kiss.
It was the longest summer of Caitlin's life and also the shortest. Time seemed to have no meaning while she was with Peter, whose kindness and respect for her belied his years. He would show her treasures in museums and galleries, things that she used to dismiss as boring and irrelevant. He showed her how to see the beauty in a leaf, and to appreciate the flowing power and still tranquility of a river. Yet every wonderful day that passed was a day nearer to the departures hall. Even though she loved Peter, she knew that her life was going to be in Japan, that her destiny was in Japan.
Ten days before departure, Huang Zi called early at the Wang's apartment, before Peter had arrived and while Caitlin was still making the breakfast.
"What do you want?"
"I'm truly sorry," said Huang Zi.
"Yeah," said Caitlin, "So, what do you want?"
"Look, Caitlin," said Huang Zi, with a slight edge, "What I did was wrong. Wrong, wrong, wrong. But haven't you forgotten something? You were taking cash out my wallet, and that was bad enough, and then lying not only to me, which I can just about stand, but to your own mother, which was unforgiveable..."
"Alright, alright already," Caitlin interrupted, "I'm sorry too."
There was a slight pause.
"Well, I suppose you'd better come in," continued Caitlin, slightly reluctantly, "Can I get you some coffee?"
"Yes, thanks."
"Why have you come?"
"You need to know some things," said Huang Zi, solemnly.
"What kind of things?"
"Your mom never told you much about what happened to your father."
"He died when I was little," replied Caitlin.
"That's not really true," responded Huang Zi.
"Hah!" laughed Caitlin, bitterly, "So now my mom's a liar to me? Is that unforgivable, too?"
"No," retorted Huang Zi, "Whatever your mother said, she would have said for your own good."
At that moment, Marlene Wang appeared in the living room, dressed only in her Chinese silk bathrobe.
"Hello, Zi," said Marlene, "I see she's talking to you now."
"Yes, Marlene," replied Huang Zi, "I think it's time to tell her about her father."
"He said he's not dead. Is that right?" asked Caitlin.
"He's as good as dead," returned Marlene.
"What! So he's alive after all!? How could you make me think he was dead!"
Caitlin was briefly enraged, but suddenly she began crying. Huang Zi tried to put his arms around her to comfort her, but Caitlin pushed him away. He realised then that he had lost her trust forever. Finally, it was Marlene who calmed Caitlin down enough to listen, simply by holding her hand and waiting. How Marlene wished that Peter had been there!
"His name is Wang Ping Yuan," said Huang Zi, "He was perhaps the strongest wei qi player in the States in the 1930s and 1940s."
Caitlin looked directly at Huang Zi for the first time.
"He was also a drunk and a gambler. A cheat, a thief and a womaniser," added Huang Zi.
"Not to mention a wife-batterer," said Marlene.
"He was a brilliant man and a total idiot. 'A short, short man with a big face,' was how old Takanatsu-sensei used to call him."
"When he first came to America, there was very little work. It was in the blackest days of the depression," continued Huang Zi, "He would hang around the wei qi parlours and baduk halls, taking on all comers for a few cents a game. And that is how he would get by. He got particularly good at hustling. That is, some guy would come in, and Ping Yuan would give him a game. He'd play really badly, and contrive to lose by many points. Then, when the other guy was starting to get bored, he'd fiddle it so he'd win by just a point or two, making it look kind of lucky. That's how he'd hook 'em. The fishes would never believe this jerk could beat them. There was seldom a fish he didn't leave high and dry."
Caitlin stared at him.
"But, for all that," Huang Zi went on, "He was generous. I've known him lend a friend his last cent on many occasions, and while he'd always clean his victims out, he'd quite often buy them a sandwich and coffee. He was never as ruthless in life as he was on the go board."
"That was how he lived, and then the New Deal came along, and he got himself a job. It was hard work, but he had regular money and lots more of it than he got out of hustling. And that's when he started drinking again. It'd wouldn't have been so bad, but for his falling in with Yang Guo and the 'gang'. Word had got around about his skills, and one day he was invited to play with the Yangs and for real money, too. He got more erratic at attending his job, and his drinking got worse, but he managed to keep winning. Then I met him."
"I was the only player in New York who could match up to Wang Ping Yuan, the 'Drunken Master'. We'd play all night and the rest of the gang would bet ever bigger on the outcome. It got real serious, too. A chump by the name of Chung Li got murdered one night because he defaulted on one payment too many. The police never got close to solving it because we closed ranks. But, between us, let me tell you that it's not a good idea to double-cross Yang Guo and his son, 'Crazy' Harry."
"Then the war came. Ping Yuan cleaned up his act smartish and got himself enlisted early in 1942, and he was a good soldier for a time. He was real brave. He was doing really well and was decorated more than once."
"How did he meet my mother?" asked Caitlin.
"I'm coming to that," responded Huang Zi.
"He took part in the D-Day landings in Normandy, in France," Huang Zi continued, "He was right in the front line. And that's how he got wounded. Heaven alone knows how the field surgeons managed to save his legs. But that was Wang Ping Yuan finished as a soldier."
"He was sent back home and spent three months in hospital. Your mom was working as a nurse there."
Marlene Wang took up the story.
"He was in a really bad way. But he was also so handsome. I had to make him mine -- and I did."
"We got married shortly after the war, and life was great for a time. He got himself a nice job and I was still working as a nurse. We were saving money. Then I got pregnant with you. He got scared, responsibility and all that. He'd go out drinking and he'd go out gambling all night. I got sick of him and left, but then he cleaned himself up once more and talked me into taking him back. And that was always the way. Like the black and white stones he liked to play with: he'd a be an angel for a time and the best husband in the world, then he'd go mixing with that 'gang' and Yang Guo's and blow his money on drink and betting. It fell to me to maintain some standards, to preserve some dignity. I learned Chinese and I maintained a good traditional household to make him happy, and to please his family. I tried my best to be a good wife to him and a good mother to you. He was a rascal."
"But the worst of it happened when you were still little. I don't know all the details, but I believe he tried to underwrite a wager with our home. And this time, he lost the game."
Huang Zi picked up the thread.
"He didn't lose the game, in my view. Yang Guo pulled off something funny. Ping Yuan was drunker than usual, but still damn sharp, except he wasn't expecting Guo to play what I'd call 'creative' threats in the ko fight. What I mean is, he played valid moves, but surreptitiously changed the position of one or two of the other stones with his pinky. I was there. It barely registered on me while I was watching. No matter what the stakes, it was just not the kind of thing you expect to see. But I realised afterward. And so did Ping Yuan."
"So, the next day, he refused to pay. Yang Guo gave him time to reconsider, but he kept on refusing."
Marlene took up the story again.
"And that's how we lost our home, though you barely would remember that, Caitlin. Ping Yuan ran away -- I think he's somewhere on the West Coast now -- and Yang Guo and his mob evicted us. We were taken in by one of your uncles for a time and then I got us our own apartment, right here. And I've heard nothing from either Wang Ping Yuan or Yang Guo since."
END OF CHAPTER NINE
CHAPTER TEN
The next ten days passed so slowly and yet so quickly for Caitlin. There was the hard work of memorising games, of learning set phrases of Japanese, packing clothes and possessions, and seemingly endless visits to relatives. There were also the sweet hours spent with Peter, which seemed to end before they began. And then, one morning, of course, Huang Zi appeared with his uncle's truck, to take Caitlin and Marlene to La Guardia Airport.
Peter appeared shortly afterward, and, with tears in his eyes, he helped Huang Zi to carry the Wangs' cases and other gear to the truck.
It took two hours to complete check-in, and there was, for some undisclosed reason, a delay of one hour before the flight was called. At first, Caitlin and Peter savoured each other's company and were overjoyed at the delay, but as time went on, and the moment of departure drew nearer, they began to long to separate, so that the pain would pass and so that they could look forward to seeing each other again.
Huang Zi kissed Marlene and, somewhat uncomfortably, shook Caitlin's hand, wishing them both happiness and good luck. Peter stared after Caitlin and Marlene as they went past the gate at the last moment. They exchanged one last look, and he melted into tears. Even now he understood fully the extent of his loss.
Caitlin wept as she was guided into her seat by the matronly stewardess. She did not notice take-off, even though this was her first time in an aeroplane. Eventually, however, her stomach awakened her from the terrible trance of tears she had worked herself into. The motherly cabin lady had been watching her, and gently tapped hers shoulder.
"Are alright now, Caitlin? Are you hungry?"
Caitlin nodded her head, and wiped away tears with her sleeve.
"What would you like to eat? You can have either a burger with fries or Japanese-style noodles."
Caitlin chose the burger and fries.
"And could you bring me another one of those sakes?" asked Marlene, who was already slight drunk.
Caitlin ate her meal and began to feel a little better. She began to gaze out of the window, and she was fascinated by the brilliance of the light above the clouds, and indeed by the sheer strangeness of being above them. She was amazed by the variety of shapes and textures - some were massive like soft-edged icebergs, while others resembled fantastic animals and faces, and still others seemed like smoke rising from a fire. She noticed also the occasional shake of the aircraft and felt the powerful droning of the engines, endless and secure. And, at length, with her mother babbling drunkenly beside her, Caitlin drifted off.
They landed, another six hours later, at Handeda airport. Although she had recovered somewhat, having fallen asleep, Marlene was a little unsteady, and her state made it difficult for the pair to make it past the immigration and customs officers. Caitlin was surprised at how quiet the airport seemed. She had been expecting hustle and bustle like that in the departure terminal of La Guardia, but the atmosphere here was oddly serene. Finally, the stepped out in the arrivals hall, which was rather busy.
A small, grey-haired lady in a kimono stepped forward and bowed.
"Hello, good afternoon. It is a pleasure to meet you Wang-san and Wang-chan," she said, in passable English, "I am Suzuki Keiko. I am matron to Takeshi-Sensei's household. Please be welcome to Japan."
Marlene pushed Caitlin's head down, bowed a little unsteadily, and replied.
"Hello, Mrs Suzuku. It is good to meet you, too."
Suzuki blushed and giggled a little.
"Suzuki," she said, correcting Marlene, "Anyway, please come with me."
They pushed their luggage carts behind Suzuki. Despite her fatigue, Caitlin was fascinated by the new world she had landed in. It all seemed so much more orderly than home, and everybody looked so serious. Yet, the advertisements on the walls featured childish cartoon characters doing adult things, such as a yellow dog on a bicycle enjoying a Lucky 7 cigarette or a furry, kitten-like thing, which was bright pink and green, drinking Asahi super dry straight from the bottle. And, now and then, an elegant woman would pass by in kimono and clogs, fanning herself.
Suzuki led them to her car and helped them load it with their things.
"First, I take you to Takeshi-Sensei's house. We will make you comfortable Caitlin. Then, Takeshi-Sensei has promised to take you both for a meal."
"That sounds swell," said Marlene.
"Please understand," continued Suzuki, "That this is a very special honour. You are very special guests. Caitlin, you will be Takeshi-Sensei's first non-Japanese disciple."
"You better behave yourself good, then, young lady," warned Marlene, completely forgetting that of the pair, she was the more like to commit an indisgression. And she would, too, for nobody had warned her in advance of the considerable powers of sake.
They drove through the endless grey cityscape of rickety, boxlike buildings, which seemed to collide with one another under a sky of tangled telegraph wires. Eventually, they reached a slightly less congested neighbourhood, in which there were patches of grass and a few trees. Suzuki turned the car sharply down a narrow lane, and they pulled up before a large house, built in traditional Japanese style.
"We are here," said Suzuki, "This is the house of Takeshi-Sensei."
"It's grand!" exclaimed Marlene.
Caitlin didn't know what to say. She remained silent.
"I will take you to your apartment after we have settled Caitlin in," continued Suzuki, "It is only two minutes' walk away."
A large man came out to meet them. Suzuki bowed and spoke gently. The man picked up Caitlin's cases and began carying them into the house. Suzuki bid them follow.
Suzuki was impressed that both Caitlin and Marlene immediately reached down to remove their shoes upon stepping into the entrance. She smiled at them and bade them follow.
The house smelled of incense and was surprisingly cool. Caitlin could hear the laughter of children coming from one of the rooms. Soon, they reached a small room, in which a western-style bed stood in one corner. On it lay a kimono, in rich blue silk.
"That is a present from Takeshi-Sensei," said Suzuki, pointing to the kimono, "And this will be your room. I hope you like it here."
"It is beautiful," said Caitlin, smiling for the first time.
"Now, you please rest. It is 4 PM now. I will come back for you at 8 PM. If you need bathroom, it is across the corridor on your left. Please put on the kimono before I return."
Suzuki turned away and Marlene began to follow. Then it struck both Americans that a phase of their lives had just ended. Already, Caitlin had left home.
Marlene turned around and grasped her daughter, embracing her tightly. Caitlin cried.
When Caitlin was alone, she sat down, suddenly remembering Peter again. She wept and then, exhausted, she slept.
END OF CHAPTER TEN
CHAPTER ELEVEN
Caitlin came to with a start. She looked at her little travel clock - it was already 7.55 PM. She wanted to use the lavatory, but knew she had to get ready quickly, too. She slipped off her blouse and skirt, and tried to put on the kimono.
It was easy enough to get her arms into the garment, but she had no idea how to fasten it up. No matter which way she folded it across her chest, it fell open again. She searched for buttons and strings, but could not find any. She saw the obi resting beside it, but could only hold it in her hands, wondering how on earth she was meant to put it on.
Suzuki knocked on the door, then entered. She giggled when she saw the pretty half-Chinese girl standing in front of her, wrapped awkwardly in the silk robe.
"Would you like a help?" asked Suzuki.
Caitlin nodded.
Suzuki rearranged the kimono and made her lift her arms. Then she picked up the obi and wound it around her waist, quickly and skilfully. Then she looked at Caitlin and shook her head.
"Hmm, you look pretty but we must make your hair better."
Suzuki slipped out of the room. Caitlin glanced into the mirror and caught sight of herself. Yes, her hair was ruffled from sleeping. She had never taken much interest in her hair up to now, but now she saw how out of keeping it was with the beautiful robes that she was wearing.
Suzuki reappeared, carrying an ivory comb and some lacquered wooden pins. She bade Caitlin sit, and began combing her hair and fastening it in place with the pins.
"There," said Suzuki with satisfaction, "You look like elegant lady now."
Caitlin looked at herself in the mirror and became aware, for the first time, that she was beautiful. She had always been moved when Peter said it, but she never could believe it of herself. But now, standing in equisite costume with her hair deftly arranged, she could see that she was stunning. She was not beautiful in the ordinary way--her face was too assymetrical and angular for that--but she nevertheless was beautiful: her skin was pale and delicate, her nose was small and pretty, and her lips were full and shapely; but above all, her eyes, while deeply brown like the finest chocolate, sparkled. Who would resist her when she looked upon a person with those unique eyes?
Marlene, too, was impressed when they met up again at Takeshi-sensei's dinner. She saw her daughter's beauty in its first adult splendour.
Takeshi-sensei was rather tall for a Japanese. He was built like a bear, too, and at the sleeves and collar of his shirt thick black hairs were visible. He was nothing like the small, wiry old man that Caitlin had pictured in her imagination.
Takeshi-sensei may have looked like a brute of a man, but his behaviour was as suave as that of a movie idol. He greeted the two women in English, and delicately kissed each on the right hand. Caitlin trembled a little: this was so different from Peter's gaucheness. Marlene, also, was excited. This man was like Ping Yuan at his best, but still better-looking and smoother, too.
They were joined by Suzuki, and by two teenage boys. Takeshi introduced them as Yamada Satoru and Kobayashi Kenzo, and explained that they were his senior disciples. Kobayashi was a pleasant-looking young man, with a kind face. Yamada, in contrast, was old-looking before his time and he stank of cigarettes. While Kobayashi simply bowed politely to both Marlene and Caitlin, Yamada leered at Caitlin for a long second before nodding curtly.
Takeshi led the party around the corner and to a building adorned with red lanterns. A dark blue flag, decorated with a sakura design, fluttered across the entrance in the late summer breeze.
They were greeted by an elderly woman clad in a scarlet kimono, and led to a low table.
Presently, several flasks of hot sake were brought to the table. Takeshi poured cups for each of the company, and Suzuki, finally, poured a cup for him.
The hostess brought food to the party. Much of it was unfamiliar to Caitlin, who had grown up with Marlene's attempts at Szechuan cuisine and who preferred burgers, fries and chilli. She liked the tempura, and thought miso soup wasn't bad, but some of the vegetables were too tangy for her taste. Meanwhile, Yamada alternated between slurping noodles messily and staring at her lustfully. Caitlin found him disgusting. He spoke to her a couple of times, each time smirking and grunting lasciviously, but Caitlin was pleased that she could not understand him. In her mind's eye, she foresaw herself giving him a good slap across the face before too long.
The others were delightful, on the other hand. Takeshi kept inquiring if Caitlin and Marlene had had enough of each dish, and he kept them both well-supplied with hot sake. Caitlin paced herself, having read somewhere about its potency, and, of course, not being used to drinking. Marlene, on the other hand, took full advantage of Takeshi's generosity, and before long she was laughing too loudly and upsetting various things on the table. Takeshi and Suzuki smiled indulgently, although they both privately thought that she was disgracing herself. Caitlin was not too worried, though, as she had seen Marlene far, far drunker.
- MAJOR REVISION BEGINS HERE***
Yamada continued leering drunkenly at Caitlin, but fortunately he started feeling drowsy and nodded off. The others let him sleep as they finished their desserts, until Suzuki wakened him with a sharp rap on the head with the fan. It was time to go home.
They tottered back more slowly than they had come, Marlene and Yamada found particular difficulty in staying upright. In the end, Suzuki-san had to guide Marlene back to her apartment, while Takeshi-sensei and Kobayashi dragged Yamada along by the shoulders. Exhausted with jetlag, Caitlin longed for bed.
On arriving back at Takeshi's residence, Caitlin declined Takeshi-sensei's offer of coffee and made straight for her room. She slipped off the kimono, and with great will power forced herself to hang it up in the little wardrobe in the corner. Then, she staggered into bed, and slept for hours.
END OF CHAPTER TEN
CHAPTER ELEVEN
Caitlin adapted to her new life surprisingly quickly. She liked Takeshi-sensei very much, although it was not often that he spent any time with the inseis, and found the school's main teacher, Hatori-sensei, quite amiable if somewhat eccentric. She began picking up Japanese faster than she expected, although she missed American food terribly.
Caitlin also enjoyed the attention the received from the other inseis, who were all male. She didn't forget Peter, and she wasn't interested in the others, who were all rather gawkish and clumsy, but she did like the feeling of power it gave her. Every day she became more and more aware of her beauty and grace. Yet, at the same time, a certain cruelty in her character became apparent. She had never experienced personal power before; to be sure, when she was little she had felt a certain glee at delivering checkmate in a game of chess with one of her uncles, but to make others visibly weak in mere sight of her was something altogether new.
Marlene, too, did rather better than some people expected. She found her flat somewhat small, and struggled with the TV, but she was very pleased to find out about the Chinatown in nearby Yokohama, and was able to make new friends fairly quickly. She was also very pleased with the low price of whiskey and cigarettes in Japan.
January came around, and Caitlin entered the insei league. She decided to make a weapon of her beauty. Although Suzuki-san had advised her that a simple skirt and blouse would be acceptable attire, Caitlin showed up for her first match wearing the kimono that Takeshi-sensei had given her. She had also learned to do her hair and make-up.
Caitlin arrived early and seated herself at the allotted goban. She was pleasingly aware that the other inseis were catching furtive stares at her: the boys desired her, while the girls looked at the new upstart Chinese bitch with cold jealousy. Who did she think she was? A Yankee-Chinese turning up to her first match in traditional Japanese dress.
Caitlin's opponent arrived. He was a chubby boy of 15. Caitlin stood up, unfolding her tall body, and she then bowed deeply to greet her opponent. The poor boy half-whimpered. He had never seen such a graceful, statuesque and unusual-looking girl before. He was well-beaten even before he bowed to return Caitlin's greeting.
They kneeled at the goban. The boy, Koyama, almost dropped the stones all over the board when they performed nigiri. Caitlin, for her part, took a sadistic delight in the boy's unease.
Caitlin took black. She picked up her first stone in her slender hands, and placed it with a ringing click on the four-four point. Koyama almost recoiled, and it took him several minutes to gather his composure sufficiently to begin playing. All the while, Caitlin fanned herself and look calmly at the board, occasionally brushing a stray strand of hair from her face.
She played quickly and confidently, while Koyama struggled over his moves. Koyama's sensei was on the verge of dismissing him: the boy was doing badly, and had been doing badly for a long time. He was naturally a very slow player, and it took him a long time, apparently, to see the most obvious things. Yet, behind this, a real talent was developing. Koyama liked to check things again and again, to make sure, and he tried to examine all the possibilities. He was already something of a truth-seeker. While this set him up for many losses in his insei games, with their rather short time limits, it made him an unusually patient and determined student. Shortly after this game, he would begin winning game after game, and, indeed, one day he would be known as "the rock" for his massive body, glacial pace and ultra-solid style. But at the moment, this rock was only pumice, while Caitlin was a drill, sharp and precise.
"Arimasen," whispered Koyama, bowing his head over the board. A drop of sweat fell from his brow and landed on the stone that Caitlin had just played to kill his group.
"Arigato gozaimashita", chimed Caitlin, smiling sweetly.
Hatori-sensei had been watching, and he approached the goban.
"Well done," he said, "I am proud."
Hatori-sensei turned to Koyama and said some kind words to him.
"You had the right ideas, but you were not calculating clearly. If only you had had more time, ne? Let me show you how you could have defended."
Caitlin destroyed the other inseis that she had to face that day. These were two boys and a girl. One of the boys was a no-hoper who would soon drop out of the insei league to pursue medicine, while the other was one of those people with talent, but no steel in their character--the first thirty moves or so of the game had truly been interesting, but the heart went out of him when Caitlin gained the upper hand in the early fighting. The girl, Keiko, played with incredible resolve, but she was no match for a woman who had honed her skills already in the smoky gambling dens of New York's Korean and Chinese districts.
By the end of her first month, Caitlin had worked her way to B class. Takeshi-sensei was particularly delighted with her, and Hatori-sensei made no secret of his admiration for the young woman's go abilities in his study sessions. This provoked mixed reactions among her peers. Yamada, for one, was more interested in Caitlin's blossoming figure, and his leering eyes earned him more than one sharp rap on the forehead from Hatori's fan. Kobayashi Kenzo, on the other hand, worked ever harder to try and keep pace with Caitlin. The trouble was, for him, that novel ideas came to her naturally, while he had to contrive his, which sometimes led to interesting discussions at the study sessions, and which more often made Hatori-sensei laugh gently. The other students included several young boys, too young yet to be interested in girls, and Yoko, a girl about Caitlin's age.
At first, Yoko despised Caitlin. It was so annoying: this lanky American with her stupid accent and her damnable skill on the goban. She tried to make Caitlin's life as uncomfortable as she could, but Caitlin seemed to take each petty action in her stride, as if it were of no consequence to her. Yoko did not realise that Caitlin often cried late at night, and on her days off sightseeing with her mother.
But Yoko was not born to be a nasty person, and she simply could not continue her hostile front.
CHAPTER TWELVE
By the end of Caitlin's first term, she had gained a position in the top half of group B. She narrowly missed out on promotion to group A, when she managed to lose a critical game to Yamada.
The trouble was that culture shock had set in badly. For sure, she had dealt with the first six months very well, and the kindness of her hosts and the sheer excitement of playing such competitive go and studying it under Takeshi's inspired guidance had often taken her mind off Peter and home. But, for a Westerner, even one such as Caitlin, who had grown up in a largely Asian community, Japan can be a very strange place. The men could be scrupulously polite, and quite disgusting at the same time, while the girls and women seemed oddly deferential. It was disconcerting for Caitlin to be given such respect and freedom at study sessions, and then half-an-hour later to be expected to give way to younger boys at mealtimes, to let them decide what channel to watch on the TV.
Then, one day she received a letter. She knew at once from whom it came, because the address was marked in careful, slightly awkward characters.
It was from Peter. He had taken a job working in a local store, and had saved for the last nine months. His father had also given him some money for his birthday. He finally had enough money to come to Japan, to see his "beautiful love".
Yet, although she felt charmed by Peter's efforts and words, she noticed another feeling, that they seemed irritating rather than enchanting. She could not help wondering whether he had grown as much as she had in the time since she had kissed him goodbye at the airport. She remembered the magical days of the previous summer, and how he had shown her so many things. Could it be like that again? With Peter?
Caitlin was growing in many ways. Not only was she becoming stronger at the goban, but she had also entered her physical growth spurt. Before this time, she had been tall for her age, but now she was already 5 feet 10, and was taller than the boys in the house. She found shopping exasperating, and was distraught when she grew out of her favourite bluejeans.
Caitlin felt depressed and discouraged. This, however, did not affect her strength as a go player: when the summer term began, she won every single game. The only player who gave her any difficulties was Koyama, who on one occasion stubbornly fought back from an early deficit only to lose by a half point. After that game, Koyama followed her out of the playing hall.
"Um, hey, O-chan" he said.
"What?" responded Caitlin, in a sharp tone. "Call me Miss Wang or Ka-to-rin. I hate being called 'O'."
"Um, well," continued Koyama, "That was a good game. I enjoyed it."
"Humph! You know you should have lost by more than ten points. I was thinking about dinner." said Caitlin.
"Oh, sorry," blushed Koyama, "I am being rude. But, anyway, I wanted to ask you something."
"What would that be?" inquired Caitlin, raising an eyebrow.
"Well, do you want to go to the cinema this evening," asked Koyama, "That is, if sensei will allow it."
"And what shall we see?"
"There's a new Godzilla movie out. Oh my! It looks really exciting." gushed Koyama.
Caitlin began laughing. She was already 17, and Koyama would not be 16 until August. She then stopped laughing, stood at her full height, and looking down into Koyama's eyes, said the following:
"You should feel right at home there, among Godzilla and his friends. If only it were real, eh? You might find another monster who'd go out with you."
Caitlin started laughing again.
Koyama was stunned. He did not understand her at first, and then the insult sank in. He had been thinking about this girl continually since meeting her, and he had believed that she was kind and sweet. He had been laughed at before, when he as the ugly kid at nursery school, but nobody laughed at him when he had been accepted by Hatori-sensei as a special pupil, at an unprecendently young age. The tears well in his eyes, but he held himself together to respond:
"I'm sorry. Perhaps another time then."
But Caitlin had already turned away, and departed. The boy found somewhere quiet, and wept. He swore that one day, it would be the other way around: that he would smile, while she wept. He then looked up in the mirror, and saw his tear-stained face, round and flushed, with a fluffy growth of hair over his top lip. He had been a fool to think he could be the boyfriend of O-chan, but he was determined to make a fool of her.
He spent the rest of the day sitting by himself, looking at those records of Caitlin's games that he could find, and once more he went through the games that he had played with her. He would make that cold bitch pay.
END OF CHAPTER
CHAPTER THIRTEEN
The girls had finished breakfast, and Caitlin and the older girls were leaving the table as the two youngest insei, Mariko and Yaeko were gathering up the plates.
As was usual by now, Caitlin had said very little to anyone, except to hiss a warning to Mariko when she had accidentally dropped her chopsticks, which had caused the child's eyes to well up. The others were embarrassed, but were too afraid of Caitlin to say anything.
Caitlin was in her room, arranging her hair. It was no longer black: as she had got older, her hair had lightened in colour, taking on a warm auburn shade. To her annoyance it still grew absolutely straight. Today was a day off. Peter would be arriving in a few weeks' time (and she wondered what that would feel like), and there were no matches coming up until the following week. She was seeing less of her mother these days, and was confident enough to travel about Tokyo by herself. She was trying to make up her mind what to do with the day when Yoko appeared at the door.
"Hey, Caitlin", said Yoko. "What are you doing?"
"I'm putting on my coat," replied Caitlin, coldly.
"Are you going out somewhere?" asked Yoko.
"No, I'm just putting on my coat for fun," retorted Caitlin, sarcastically.
"Oh, Caitlin. Why are you always being so nasty to everybody these days?" sighed Yoko.
"What? I am not nasty. I don't care for acting all friendly when I don't mean, either." said Caitlin, in a slightly surprised tone.
"Look, I know it was you who gave Mariko's doll to the dog," said Yoko, "And the others think it was you. That was horrible! Why did you..."
"Heh! I thought it was quite funny," interrupted Caitlin, "Stupid little girl. If she wants to be a go pro, she can't be soft on a silly little doll."
"Caitlin!" said Yoko, raising her voice somewhat, "Mariko is seven years old."
"So?"
"And, besides, Miss Wang, I know you have your little secrets," said Yoko, archly.
"What?"
"That stuffed cat you take to bed with you. Now, if I was not a nice person..."
"You ever touch my stuff, and I will..."
"Caitlin! Please," interrupted Yoko, "Why won't you drop all this? Don't you want to have any friends? I know you cry at night. I hated you, and I still do hate you a bit, but please let us try to be friends."
"And you want me to open up to you?" asked Caitlin, "Do you really want to know me?"
"I'm not sure that I really do, but I have got to try." said Yoko, hesitantly.
"Well, then, if you want to be my friend, spend the day with me. We will go to Ueno Park and we will talk. How about that?"
"Alright."
Error: list nesting is too deep. Nesting is limited to 9 steps.
If you have tried to make a horizontal line, use '----' instead.
NOTES TO MY DEAR SELF:
1) Should I fast forward a bit now? Get Peter's humiliation at Caitlin's hands in Tokyo out of the way. Give further hints that she is growing up to be a very unpleasant person indeed.
2) Early pro career. Famous incident with great player "Mr Wu". Alienates everybody but Yoko, her becomes her only friend. Hint maybe at a Sapphic relationship.
3) Begin the denoument. How Caitlin is connected with train-driver Mr Nakamura.
4) Epilogue: Caitlin's legacy. Implications for go on a worldwide scale (getting to the point I originally wanted to make, which will be...)
5) Before I forget again, I need to bring Wang Ping Yuan (Caitlin's father) into the story. Will she accept him? Shall I do a Star Wars-style "Caitlin, I am your father" encounter?
Style note. I realise that this is not going to a Jane Austen-esque literary masterpiece. But it's kind of fun in its own dramatic and not very realistic way. Therefore, I'm going to try and give it a somewhat "soap opera" feel. Lots of emotion, Caitlin as gifted villainess. Incidentally, while being 6ft myself, I sympathise with Caitlin for being an unusually tall woman, I really don't intend her to project myself in any way. For a start, I'm going to be cruel and make her slightly tall than me, so she'll have an ever harder time finding shoes than me...secondly, I'm a very gentle girl and would hate to be like Caitlin. She is sociopathic and alternates between extreme lack of emotion and extreme emotional intensity. It would really not be very much fun being Caitlin.
TO BE CONTINUED
TO BE CONTINUED
WORKING DUMP
Then, it happened. As they were making their way back to Takeshi's residence, Yamada sidled up to Caitlin and tried to grope her. She yelled in rage, and caught him a sharp blow on the cheek. The dirty grin was still frozen on his face when Takeshi turned round to see what had happened.
A moment later, Yamada starting shouting and cursing at Caitlin in Japanese.
"That bitch!" he screamed, "Did you see what that dirty Chinese dog-woman did?"
Marlene, suddenly sober and terrifying in her anger, grabbed Yamada and screamed at him in English. Yamada shrunk back, trying to get out of her grasp as she began to thrash him with the handbag. It had never occurred to him before that women could hit back.
"I don't know what you're saying, mister," she yelled, "But I know you did something bad!"
Takeshi had turned purple with embarrassment, while Suzuki tried to talk to Caitlin, who was now crying. Kobayashi, meanwhile, separated the spitting Marlene and the cowering Yamada.
And so began perhaps the bitterest rivalry ever in go. When the incident had been investigated, Takeshi disowned Yamada as his disciple, but, in view of his undeniably exceptional ability, graciously arranged for him to study with another well-known professional. Yamada never forgot the way Caitlin and Marlene had humiliated him and was determined to block her at every turn. Caitlin, in return, conceived a passionate hatred for him which she began to channel into an almost demonic power of concentration and endurance. She was already capable of being ruthless, but this outrage created within her an altogether new force, and Yamada would not be its only victim.
---
READERS' EDITORIAL NOTES
Tamsin: Writing a story is a bit like telling lies. It's easy to get into a tangle. So, if you spot any loose threads or holes in the plot, please point them out here. Likewise, please use this space to point out any inconsistencies of style and characterisation. Please do not make general comments; the /Discussion page is for that.
Minor issue in chapter five:
"Take her to Japan?" cried Marlene, "I don't want her setting foot there. Don't you know what the Japanese did to Marlene's grandfather? Don't you?"
It reads as if Marlene is talking in the third person... Also, maybe the second and third sentences will sound more natural (as an American) if Marlene used "do you" instead of "don't you".
Please consider changing the "Jumping Jehesophat" exclamation used by the math teacher. I cringed when I read it.
Please consider altering the Pak's to Park's. I know there are Paks but Park is more common. Or maybe you should just change it to something that is easier to recognize as a Korean surname... like Kim or something. Also the character named Mok... I don't think Mok Pak is a common Korean name (I'm Korean). Maybe you were thinking of Mok Jinsuk?, but even then Mok is his surname.
Very minor, but this occurs twice:
"END OF CHAPTER TEN
CHAPTER ELEVEN"
you actually have 12 chapters :)
It's excellent so far, I'll be checking back here for more! (And I don't think there's much resemblance to HnG at all... aside from the fact that she's a prodigy - which is a fairly common theme in similar stories, e.g. "Searching for Bobby Fischer")
Malweth
[1] To be sure, the small knight's enclosure from the star point is no longer novel, its having been popularised by Kobayashi Koichi, but this was the late 1950s, and IIRC this move was considered a slightly suboptimal way of developing a star point.
[2] Not our friend, fellow deshi Andrew Grant, but a former president of the USA!
[3]: Nice story! Just a note to say that the 1948 world chess
championship was actually a tournament, in which Bronstein did not participate. You may change to fit the facts, or leave this anachronism in the name of poetic license. ilan Tamsin: Have changed to Smyslov - please suggest a likelier name if this is still no good!
 2007 the Authors,
published under the OpenContent License V1.0.
2007 the Authors,
published under the OpenContent License V1.0.
![[Welcome to Sensei's Library!]](../../images/stone-hello.png "Sensei's Library")
![[ext]](../../images/extlink.gif) David Carlton's review
David Carlton's review![[Diagram]](../../diagrams/28/0c2759abc669fe0a33a50d71e163f0cf.png)
![[Diagram]](../../diagrams/36/83fb3f834898b7b8ef36d31eaf71ce92.png)
![[Diagram]](../../diagrams/21/49f87d00ca08182f7957f1bb62ccb0fe.png)
![[Diagram]](../../diagrams/52/4c0e9131891055dfb97bd4154b6322a0.png)
![[Diagram]](../../diagrams/50/3337f6dd46c66466c4ed57aed642f5a8.png)
![[Diagram]](../../diagrams/20/229e4639170407ace1863f18e1719d9f.png)
![[Diagram]](../../diagrams/3/e836c6ad0ba591b60a4683db2ebf3a54.png)
![[Diagram]](../../diagrams/3/9c1d88e21334cdbeca84d52a4417ab16.png)
 and the other one seemed to kill, however the other was much simpler giving white fewer practical chances.
![[Diagram]](../../diagrams/9/2c7a0d783415a76164f46d347f33584f.png)
![[Diagram]](../../diagrams/43/ce9385fadaf036d17ede86b6e0e4f56f.png)
![[Diagram]](../../diagrams/51/bc13220395ca639a19e8eaabcc7137ac.png)
![[Diagram]](../../diagrams/51/f24743ebd3ea349922de666f100f2d6a.png)
![[Diagram]](../../diagrams/6/6e18081112a8e69ad6a12ef8d9c7ba85.png)
![[Diagram]](../../diagrams/42/0ae328dc05038023c63d3434e8c6b960.png)
![[Diagram]](../../diagrams/37/23e7271b14a45e2a5bd7b70f5b656db7.png)
![[Diagram]](../../diagrams/46/4792884978f1389580a3903a300f2685.png)
![[Diagram]](../../diagrams/23/9b993258f839ccc45be82485ed8855f1.png)
![[Diagram]](../../diagrams/22/443b6ff47d40521526034fa6b92d2b33.png)
![[Diagram]](../../diagrams/22/7dedc245bc7c7c4a295856e0b12ed584.png)
![[Diagram]](../../diagrams/29/b282c5841bd0b3535373ee3753d742e2.png)
![[Diagram]](../../diagrams/3/1a97dbfe68ea7bd6cba9d25ae6c8aae7.png)
![[Diagram]](../../diagrams/22/e4d2f5bb0a7bebfd2bcbf7213feb2232.png)
![[Diagram]](../../diagrams/48/3ec0edd24254cfa09276b22500403f4a.png)
 catches White in a
  -
- ![[Diagram]](../../diagrams/7/e26b50088f709ec63a30b11a97e57f55.png)
![[Diagram]](../../diagrams/36/3f35bc5b56c3db845f739758329d63a8.png)
![[Diagram]](../../diagrams/34/9f25262235657de732ae87ad5fe10d1f.png)
 in variation 2.
![[Diagram]](../../diagrams/1/20362f138903480a60ba6c19753208e0.png)
![[Diagram]](../../diagrams/20/8c91fb33c9200db10143e5b920b0a1ad.png)
![[Diagram]](../../diagrams/5/7bb69e1d8e0b17168c4a7865d506324b.png)
 (an atari at
 ![[Diagram]](../../diagrams/36/3e903f4ccabd3c14e11843a2db08a7d3.png)
 take care of things. (Neither can white extend up at the top; because of the marked black stone, this atari-capture move is useful for black more than once.) Note that white cannot atari at a for the same reason.
![[Diagram]](../../diagrams/35/8b0d30f8dc9f9b4e165dd82cb16ccfc7.png)
![[Diagram]](../../diagrams/23/17c1d6ca8f40fada45835c20bedbb927.png)
![[Diagram]](../../diagrams/32/d2ebed48127f80960fb0f4bb4391c893.png)
 White plays 'b' and is safe. Black cannot cut at 'c' and therefor White is safe. Also, 'd' is sente, as there is no ko threat to be found anywhere.
![[Diagram]](../../diagrams/10/a5be9e2a17d4818c9055a398b318ac65.png)
 cleanly.
![[Diagram]](../../diagrams/50/e15bb7ae68a21a6ff8fc9a1030422dc2.png)
![[Diagram]](../../diagrams/10/ef963714eee4b7cee3b40908d81b462a.png)
![[Diagram]](../../diagrams/37/f03ea8f6a8275d541681c871a0e37d46.png)
![[Diagram]](../../diagrams/5/9d165f80cf8e86e636ce2ddaca8098e0.png)
![[Diagram]](../../diagrams/49/36ceddfbe7d7f19573ad0a3be3eb40f9.png)
![[Diagram]](../../diagrams/49/df90dc5145275b23cf2200276e61c81a.png)
 .
.
 ...
...
![[Diagram]](../../diagrams/50/6be9a6c09573d60c08fd86ade8cf8086.png)
 ...
...
![[Diagram]](../../diagrams/51/79d067f60cb2f788956ba1ee1c20ab22.png)
![[Diagram]](../../diagrams/9/7893970bd3a650d525f28d38086ad3b3.png)
![[Diagram]](../../diagrams/4/d7f275e4b4304b6864a88c953b40bd27.png)
 'a' and 'b' are miai. If
 ![[Diagram]](../../diagrams/17/9482147d555a1201e522fb4be8877309.png)
![[Diagram]](../../diagrams/25/027a9589761de8dee9bda5dd2d97f90b.png)
![[Diagram]](../../diagrams/3/3e4c6384179c9d4353bf11478ea06a4e.png)
 , which might become useful. --
![[Diagram]](../../diagrams/22/1b7b03ebb568c78e752ec1374f2c2178.png)
![[Diagram]](../../diagrams/17/a685cf4d3ba6ac8323eac46df4a75971.png)
 at b or c is easy to see, but a might be more difficult.
![[Diagram]](../../diagrams/43/ba8bf5992016dc90de61d7ebf426bdd8.png)
![[Diagram]](../../diagrams/13/086ae2a80074faafd05e7a26e46fbd60.png)
![[Diagram]](../../diagrams/48/1e3de60a6e4829aa400722783942a93e.png)
![[Diagram]](../../diagrams/28/a629067875234a382719e0b0544e6148.png)
![[Diagram]](../../diagrams/38/ae08a99501f3ef2e876eaab8e7e81329.png)
![[Diagram]](../../diagrams/15/65cfc4cbab4b6f82aa74309893a7496a.png)
 prevents Black from making
  destroys the
 ![[Diagram]](../../diagrams/48/d47ee6d7309877bf6190f09be413e2d2.png)
![[Diagram]](../../diagrams/2/29b646702d6a397d1be05c79979fedc6.png)
![[Diagram]](../../diagrams/46/8e1c387ab774b44628b3353fc9147ae5.png)
![[Diagram]](../../diagrams/28/1f730fabd14d8566f92500f8e4e27853.png)
![[Diagram]](../../diagrams/7/ebf1f1b96d0f367dd296d4eb0bdd4714.png)
![[Diagram]](../../diagrams/33/b601bb2c737fd10ba773f06a4b83ffb6.png)
![[Diagram]](../../diagrams/38/88aee4488cb88c0802f39ccf199989da.png)
![[Diagram]](../../diagrams/43/6f9d7a69bec599f3ab528b0ebe752104.png)
![[Diagram]](../../diagrams/11/c3c7b3bdcd419830e2ebbe1f98ce4383.png)
 , a White play at
 ![[Diagram]](../../diagrams/41/e1d1dd70979440fed8b9e129f7eee2f8.png)
![[Diagram]](../../diagrams/35/7cdff90d9e54b90813775cb61f5a5360.png)
![[Diagram]](../../diagrams/28/83f15bd60de88d7fa03dd734fb43916e.png)
![[Diagram]](../../diagrams/33/8a8e0c3c465cac9d773f2d58b3f0bb7f.png)
![[Diagram]](../../diagrams/43/440d50e7ae2b603b2063290af7027d1b.png)
![[Diagram]](../../diagrams/18/fc25dc23659ed393e804c6c99768757a.png)
![[Diagram]](../../diagrams/49/46b9152936c2f108b55e635f39eac3a4.png)
![[Diagram]](../../diagrams/8/da6bd48b19223b27e47831bde3007a14.png)
![[Diagram]](../../diagrams/7/43043ab42aea3186795c757f2be363b5.png)
 is obvious and white still has 2 ko threats. The value of the move is 2.0 moku miai counting. Two black stones are added to the captured stones
![[Diagram]](../../diagrams/14/7903653a14c2aff229080bbdbbb4c97c.png)
 and
and  , It's not over yet!
![[Diagram]](../../diagrams/23/9f6bb4c837374e1c16eb76894a5535f2.png)
![[Diagram]](../../diagrams/49/2e6b4285965b993682b9755d9a4f9291.png)
![[Diagram]](../../diagrams/23/c88a66a61bf30930e07b57e600287f99.png)
![[Diagram]](../../diagrams/39/bee59d7c3cb9bae6334ab7dc9f26b90a.png)
![[Diagram]](../../diagrams/16/03a57493a9c9d0a03bb40ca51c060753.png)
 )
)
![[Diagram]](../../diagrams/33/94094c2d07eb1caf81cb6eb47a0ff102.png)
![[Diagram]](../../diagrams/19/21277983448e6eb5a7667c5410916842.png)
![[Diagram]](../../diagrams/7/4ea10761f7f5375bb002b35bf0cfea60.png)
![[Diagram]](../../diagrams/3/b03b31feab46068299452acca757ef2e.png)
![[Diagram]](../../diagrams/1/7d2195a9c7e0ca4a60cf1311f3669193.png)
![[Diagram]](../../diagrams/23/bd692faf85be3a676757748c89d11dc4.png)
 .
.
 . This move is larger than going for two stones in gote at the bottom. The two stones at the bottom are 2 points miai and the defence at the top is 2.66 as we all know.
![[Diagram]](../../diagrams/36/de55ce30d853ba94efb2a97c0aedb92e.png)
![[Diagram]](../../diagrams/47/cf4d12946422080e654b32aa1b44ed69.png)
![[Diagram]](../../diagrams/6/c49464a8f1c4cf2c4d0bdb2cb87114e6.png)
![[Diagram]](../../diagrams/2/70a1ca12cd5ddd78005b6001ba516564.png)
![[Diagram]](../../diagrams/19/a6e7a91b8442e2fe8cee357343c4016a.png)
![[Diagram]](../../diagrams/3/4d45ff14f529bf3f41b3d44132e8801f.png)
![[Diagram]](../../diagrams/45/405d3ac7358e61ea41df967b9f99c337.png)
![[Diagram]](../../diagrams/24/534dade65901335e52a283c77f0de8b7.png)
![[Diagram]](../../diagrams/35/7f67c3de27ecf280049df2d62a0daae1.png)
![[Diagram]](../../diagrams/13/43a9909d0405261e17f560169231e18c.png)
![[Diagram]](../../diagrams/47/a6249519bf3fc2bd7ac729b545316a6f.png)
![[Diagram]](../../diagrams/45/a44653155e76b4e095c1853f0891579f.png)
![[Diagram]](../../diagrams/48/9e47cec745a19c25cc4723f4c72ca547.png)
![[Diagram]](../../diagrams/17/ef43f77011e0dce30cac6ee533d55284.png)
![[Diagram]](../../diagrams/33/985302fc02abe4c89d8b29cc25763210.png)
![[Diagram]](../../diagrams/11/9279e4e1e88772843763deae558a475b.png)
![[Diagram]](../../diagrams/0/3c5d2648fceb42211f04b1fee2106c69.png)
![[Diagram]](../../diagrams/25/a94e6940fe0552251d522bb05314c953.png)
![[Diagram]](../../diagrams/47/9bab13e083bf74e8635e84b7e684707d.png)
![[Diagram]](../../diagrams/26/414b179fa207437ac662ba71731803f7.png)
![[Diagram]](../../diagrams/12/cdaaf317aac4f464f6975631bea1404b.png)
![[Diagram]](../../diagrams/45/902c274c6aa9dc56f4be7d3caa181cb0.png)
![[Diagram]](../../diagrams/47/b25f24253cf68db61070bb4eaa32b8fb.png)
![[Diagram]](../../diagrams/10/b0380119adaa3082d520fda1f86844bf.png)
![[Diagram]](../../diagrams/24/e8d1e084e8e56a075e1b5025fe59aca5.png)
![[Diagram]](../../diagrams/34/640d49d05710d0a8045129d3309f8172.png)
![[Diagram]](../../diagrams/22/9602a54abd8ad239cfee99351db90b14.png)
![[Diagram]](../../diagrams/4/93483da170c02674f1dd90aaa55a6dff.png)
![[Diagram]](../../diagrams/37/6a00c041732c47fba7852c63a23d42ae.png)
![[Diagram]](../../diagrams/1/4e7a1059dcb2685262a232816957cdb4.png)
![[Diagram]](../../diagrams/37/cbbf1355cd7835ff1d403d6fdd9a0033.png)
![[Diagram]](../../diagrams/3/5578489195d4b453a8e32e217379b866.png)
![[Diagram]](../../diagrams/41/3f9ae1364b41af36e8d600d78fa86ef9.png)
![[Diagram]](../../diagrams/13/3a425f78e97c7e42f9d5165d8c80aadd.png)
![[Diagram]](../../diagrams/7/551cc121d65b5d0302458fe58cf03996.png)
![[Diagram]](../../diagrams/1/f886944df7f0c4c6b5c6f22444f363a9.png)
![[Diagram]](../../diagrams/52/f19518cf39064f96c06271bcbf3ba8b3.png)
![[Diagram]](../../diagrams/30/84778735986ad449f322f67dbdb942d7.png)
![[Diagram]](../../diagrams/8/70ec80b7dfccb5dfc0f1ade71ab50873.png)
![[Diagram]](../../diagrams/45/967adfd5cb5da0b5ba767d1cd4077e2d.png)
![[Diagram]](../../diagrams/24/5cf5189bf95b3d9a53a71d945f7a14aa.png)
![[Diagram]](../../diagrams/51/49946fe223c1a211e91e8eeabb13e618.png)
![[Diagram]](../../diagrams/14/851530b966eada0245eafaf0c162d06e.png)
![[Diagram]](../../diagrams/25/0ee85dd3a5f6077b328e8e37e80aef33.png)
![[Diagram]](../../diagrams/48/8dc80fc0da38d6c86418f6fc9280f75a.png)
![[Diagram]](../../diagrams/7/ea97d153cd8a8b22763b973940dd0649.png)
![[Diagram]](../../diagrams/49/9f9a489483aa76e383e9f824c3d7dd0f.png)
![[Diagram]](../../diagrams/46/f463b35ed33b8659b4ea7cb5bbb72cff.png)
![[Diagram]](../../diagrams/44/ada784bdb59133ae31d81ebe5f7e40f8.png)
![[Diagram]](../../diagrams/35/24ebd7f7bd160dd784df777aeb53aac9.png)
![[Diagram]](../../diagrams/32/81c719d658b682a5d891c680bc2e3f99.png)
![[Diagram]](../../diagrams/16/ff1fa89acf61a58c338076cc8a3304f7.png)
![[Diagram]](../../diagrams/6/957e7c5cc561150265f5f4e5da3f1e13.png)
![[Diagram]](../../diagrams/0/12208964c6c7cbfa8f64f1aeab2c3a30.png)
![[Diagram]](../../diagrams/11/14eebbb02f81ea79c51671522b119b37.png)
![[Diagram]](../../diagrams/5/05bc1317b031cf86fe494355054c0a9f.png)
 may be enough to settle Black. There's also some aji in the corner, but maybe not it can only be spent once.
![[Diagram]](../../diagrams/0/163156b131367524704ad4ad774b495b.png)
![[Diagram]](../../diagrams/2/899839b003e39a01a202065932439834.png)
![[Diagram]](../../diagrams/45/d6c4527607340566cb9f8695fe11989f.png)
![[Diagram]](../../diagrams/24/53848d20db2bbe503f0cb3aea9cc9396.png)
![[Diagram]](../../diagrams/28/b825d9d6b5332fad30564b4003f3b3d5.png)
![[Diagram]](../../diagrams/32/ce4c10c5da34b66e4dca64d368d622f4.png)
![[Diagram]](../../diagrams/16/2820a668aa24c50984af6b6fcd41f90c.png)
![[Diagram]](../../diagrams/41/98e88b81bc5e42f72c1c7716f1db701a.png)
![[Diagram]](../../diagrams/33/2831b7006e72a5c5016310d2c9662749.png)
![[Diagram]](../../diagrams/21/95c6af91a55a32143f109772e01dc032.png)
![[Diagram]](../../diagrams/23/4beb33dacd19b12883e9046a38f7fadb.png)
![[Diagram]](../../diagrams/12/e43abb45f8e53c830de1c146146b5f66.png)
![[Diagram]](../../diagrams/1/3f3a9c4f02e3f9c7d5d3a826b6517c0f.png)
![[Diagram]](../../diagrams/15/d5ec85d29ebfbea43eaf1291906c0bfd.png)
![[Diagram]](../../diagrams/41/10399582e7661c5ac3ad83d704be2eda.png)
![[Diagram]](../../diagrams/15/756cdee62592ae7ad03fd7b7ed598b02.png)
![[Diagram]](../../diagrams/49/88d6a9f8602b62e74dd51da5a5b6a543.png)
![[Diagram]](../../diagrams/40/ca18e6ed27e1d58521931b38ed61ac7c.png)
![[Diagram]](../../diagrams/35/2fd9652a19a40db95c0d6ecf94330d18.png)
![[Diagram]](../../diagrams/23/6b4d2f4915237c36bcea645951e3bdd5.png)
![[Diagram]](../../diagrams/28/059ff438d16587409dbc8730886e5789.png)
![[Diagram]](../../diagrams/50/4746d02e0703370a693338b04c6c54cf.png)
![[Diagram]](../../diagrams/26/27e4769da8e3bcc24198f8afb37c07fe.png)
![[Diagram]](../../diagrams/25/7b582f62ec3bd32b4d6403579a6d7741.png)
![[Diagram]](../../diagrams/4/1926d066a974c4c1cd3bc4d5d287c7e7.png)
![[Diagram]](../../diagrams/28/29416a2c240e1f0d5c958eabe9aa9a27.png)
![[Diagram]](../../diagrams/32/71702da421a9226db78eecea8e1ba884.png)
![[Diagram]](../../diagrams/17/0c01a12f0455e6bae373dca84a3363a4.png)
![[Diagram]](../../diagrams/28/b39c27add73bf496598fe7a5d7d1bbec.png)
![[Diagram]](../../diagrams/39/c9cac2fd2090713ffed7c50d0d60e9b7.png)
![[Diagram]](../../diagrams/7/d5f8a2e58e139b498d4426af0654bc9e.png)
![[Diagram]](../../diagrams/14/01cf19abc9d0b8a708a4655ed75e95ad.png)
![[Diagram]](../../diagrams/19/dbc3ea1ff6c57a947bc70bf29f0f5586.png)
![[Diagram]](../../diagrams/35/697fc521684018783855ab5bd71dbfd5.png)
![[Diagram]](../../diagrams/22/b1a5be9dbfbbd4b6baa93b63936598b2.png)
![[Diagram]](../../diagrams/1/bd30fe4de6b6babadd07e966eabf46e1.png)
![[Diagram]](../../diagrams/13/e795694f18dcb3c24a495c0d5993095b.png)
![[Diagram]](../../diagrams/18/4f9b499797b94e5cba9aef8af56ebe0b.png)
![[Diagram]](../../diagrams/1/07aa9329a5595b4f895930018fe379fb.png)
![[Diagram]](../../diagrams/8/38e3e85f31667373d517b25c34a27c43.png)
![[Diagram]](../../diagrams/24/2afb8e06efaba34cf62bf1c2a5b2d6b4.png)


![[Diagram]](../../diagrams/38/30670cce470d347ad917b97d7d2246c7.png)
![[Diagram]](../../diagrams/18/82dac7e86da9adaa33b14ab55764517f.png)
![[Diagram]](../../diagrams/37/a765711708b833e917759894264290d2.png)
![[Diagram]](../../diagrams/16/c78286e6b195393d69a8a303eed4dd71.png)
![[Diagram]](../../diagrams/41/a0af46a1fb2380a611d3e8ef6ca1db5f.png)
![[Diagram]](../../diagrams/44/e9272f6341058d7d74830cf5db023bf2.png)
![[Diagram]](../../diagrams/10/c992e362436ec0826caf893523140769.png)
![[Diagram]](../../diagrams/33/575cb15eed16a5ad3830aea9557f9e30.png)
![[Diagram]](../../diagrams/46/91bbff428976820df7d347b2ad7799a6.png)
![[Diagram]](../../diagrams/12/af1e098526e9b7f0d226d3629bd986c5.png)
![[Diagram]](../../diagrams/8/405505613417e03134b3a014bc3e5ddf.png)
![[Diagram]](../../diagrams/20/678f9feb2cddfb7e997e156cad718042.png)
![[Diagram]](../../diagrams/8/c121d9a380085e36d82e5143f22e0d9e.png)
![[Diagram]](../../diagrams/52/7f47af82212afecbc7b9425f9f9ded74.png)
![[Diagram]](../../diagrams/47/88929424a6713b32edba4e2ded78bf52.png)
![[Diagram]](../../diagrams/7/3a89db571a799f923695142670e8e1a7.png)
![[Diagram]](../../diagrams/52/b29b71d70194cf69f6600c9f86385a34.png)
![[Diagram]](../../diagrams/37/9f341e6dcc8560fba66716d0a1a7eaf1.png)
![[Diagram]](../../diagrams/34/cb6a36bc3d2ed2ea656d159153b57507.png)

![[Diagram]](../../diagrams/31/51114f7d82a67c010bf971fb4b969dab.png)
![[Diagram]](../../diagrams/29/81f11d0848cef2663512c78ef31b272c.png)
![[Diagram]](../../diagrams/23/7594ae083d60bdfab05fa099ac25cd49.png)
![[Diagram]](../../diagrams/15/14a0295c108ef2fc53c96db3f944d38b.png)
![[Diagram]](../../diagrams/23/9f4fe752a435fbaaecd8df87d6195e95.png)
![[Diagram]](../../diagrams/48/5384c8b22788833fdca958254ad2dfa2.png)
![[Diagram]](../../diagrams/35/b454813ea7deed8f3f54b3d741015c3e.png)
![[Diagram]](../../diagrams/45/5f0935a4ce5a8476ce13137dc94f1f7b.png)
![[Diagram]](../../diagrams/4/da1e5d7643d3acb4b56c9d7e082e1c71.png)
![[Diagram]](../../diagrams/45/ce8e80361d424017f6f78d98960f7891.png)
![[Diagram]](../../diagrams/14/bf21da014db3ed53d5d54bbc95b7b051.png)
![[Diagram]](../../diagrams/39/0e9a0d1ee59d9dd13a2093769f2d7b17.png)
![[Diagram]](../../diagrams/33/fdeaeb2ae9fdcf8f60a1c6ccf39a03e1.png)
![[Diagram]](../../diagrams/51/3aa030aced6a3e2cf872fd170f9defd1.png)
![[Diagram]](../../diagrams/52/d138f8ebf06253b23188182653133003.png)
![[Diagram]](../../diagrams/14/ca2dc66b471f83cfa8427c4cbaadb334.png)
![[Diagram]](../../diagrams/32/8b29e0c6848d322385f95547b1fded82.png)
![[Diagram]](../../diagrams/21/cb933f4ba5f5cbeeb396d1af0c0f34cf.png)
![[Diagram]](../../diagrams/16/a66f1ab5b57d06f81eade5a3cf257c41.png)
![[Diagram]](../../diagrams/28/05b684f4873761f9e72aebe6ab69d86a.png)
![[Diagram]](../../diagrams/0/8fd89dfca2ec02cd097a9643848a0121.png)
![[Diagram]](../../diagrams/50/b82c21bbfe72894e144c46fc0ce01901.png)
![[Diagram]](../../diagrams/35/891a105b5b907b03b886e85d068a9606.png)
![[Diagram]](../../diagrams/10/47fdf7e804d41094733b7ca487758816.png)
![[Diagram]](../../diagrams/26/3e21c654e8120c3888e6100632915b46.png)
![[Diagram]](../../diagrams/24/3b213039789a562185e6924f515f49ba.png)
![[Diagram]](../../diagrams/35/d15671f89975f502f3b5105a74bccf06.png)
![[Diagram]](../../diagrams/33/e6f704b31645d01015552d9490e6380b.png)
![[Diagram]](../../diagrams/21/a980447d535a2545b1b036d1e841739f.png)
![[Diagram]](../../diagrams/5/567c1195b9cfd2a404c4f952fc459f45.png)
![[Diagram]](../../diagrams/36/094bbabbe96c22874d5945f058429591.png)
![[Diagram]](../../diagrams/21/7ff17c3349e8cecde84ed82c77a4bbf3.png)
![[Diagram]](../../diagrams/26/553def24a32ec62c3015dc45b8908d6e.png)
![[Diagram]](../../diagrams/18/46376b9990b21855d999db27558d18bd.png)
![[Diagram]](../../diagrams/33/6484f9731fabafdfa56754c6def868bc.png)
![[Diagram]](../../diagrams/44/9a23e183cf0ef2e84f99a40c2f7bcd51.png)
![[Diagram]](../../diagrams/25/af165e4cc8ed393cf2e8827b8acfecc7.png)
![[Diagram]](../../diagrams/17/59f9abeea0f529a185d0c5fa250e7eb8.png)
![[Diagram]](../../diagrams/23/ffd7bb85a69ab712842073fd155f6098.png)
![[Diagram]](../../diagrams/32/54101904cfad4b5481f27dc8b21ccc58.png)
![[Diagram]](../../diagrams/21/0580e7dc754924bfcb0ed53adc7c6e51.png)
![[Diagram]](../../diagrams/22/535d56f177b66ba3737542a92c082eb9.png)
![[Diagram]](../../diagrams/36/64c9c6b3a8a66c64d56ceee6c9fc7527.png)
![[Diagram]](../../diagrams/22/4048b5e59fb645b4e2a9020630e4daf6.png)
![[Diagram]](../../diagrams/28/9a80617a21284356ffe45f0b211974f1.png)
![[Diagram]](../../diagrams/24/a98105f323ffbb3245992f46878ec787.png)
![[Diagram]](../../diagrams/48/274702882c4dc90d3fddb843c3b81113.png)
![[Diagram]](../../diagrams/2/982a883fd320cf7e8643e97d08e1f365.png)
![[Diagram]](../../diagrams/28/528e9c1eda87bd1c0ede928a99002a59.png)
![[Diagram]](../../diagrams/1/189300b29bb0f892772433b6bc344f36.png)
![[Diagram]](../../diagrams/33/626990f3e8df8aade714befc27d721b7.png)
![[Diagram]](../../diagrams/44/6272c1f938e2688d4300e0e052072c41.png)
![[Diagram]](../../diagrams/29/15df60ec02ec8d4e68ac4d3f94ab6805.png)
![[Diagram]](../../diagrams/36/62a6b58fc6e895e41fd36861f1ba8886.png)
![[Diagram]](../../diagrams/29/7fc8b4311515bccf46c9d057814a3e32.png)
![[Diagram]](../../diagrams/11/497fee64ae42244c95e33d5e7347563c.png)
![[Diagram]](../../diagrams/10/554a3491eb95248ab43775a7870d4323.png)
![[Diagram]](../../diagrams/17/6cfbe6bff7aaff5b67d3faa16ae79206.png)
![[Diagram]](../../diagrams/1/8967cc5d39c02aa07c2310327d02a122.png)
![[Diagram]](../../diagrams/23/f88141fac64bcfcd5fbcb7682b4434b5.png)
![[Diagram]](../../diagrams/8/9f47ef9ed8fae99c6a751810c1cf3702.png)
![[Diagram]](../../diagrams/5/91dc37382dad0bdf10889946bd5b4808.png)
![[Diagram]](../../diagrams/32/3c7ccbcdaff383967fd5cbc162a39ae4.png)
![[Diagram]](../../diagrams/51/a7ec73360acb84d01d407e2b9a9d333a.png)
![[Diagram]](../../diagrams/20/5647c42bcf01f51e6d4c3c35aedef723.png)
![[Diagram]](../../diagrams/40/443f7f051f5d9df123de0acc6c6227ad.png)
![[Diagram]](../../diagrams/0/0c29fa7846c594d7ff6909b5685253c4.png)
![[Diagram]](../../diagrams/14/8be9a024cb3671fa95efa3675540075e.png)
![[Diagram]](../../diagrams/32/de170ad3a1ff855fc6ccf5d9d7d275fb.png)
![[Diagram]](../../diagrams/52/c811e2350f3e0aa87f6526e2eb5ccdcb.png)
 Français
![[Diagram]](../../diagrams/14/53740df8d3f6aad780a1c12550f2bef3.png)
![[Diagram]](../../diagrams/46/617ee00cfd086f8a5ce19826ac8a3cb7.png)
![[Diagram]](../../diagrams/42/b3a1a98125ef00ab39fd1d0f65416d0b.png)
![[Diagram]](../../diagrams/25/8d56c2e4a477b908d64d7b6a5410cb83.png)
![[Diagram]](../../diagrams/35/30958414204a6e56e0f0134d3ae32523.png)
![[Diagram]](../../diagrams/9/5456d6288bdcf35c29c3bb1a688dce1a.png)
![[Diagram]](../../diagrams/49/61d49b1bb9c9e88bac78cceb7fc2a915.png)
![[Diagram]](../../diagrams/15/acb9e1221abef5c520dd8a4044f872f3.png)
![[Diagram]](../../diagrams/36/def9b76569ecd5bef018ca78b6f66a24.png)
![[Diagram]](../../diagrams/31/964af8f5767c29c6a5d1b6b87eae8998.png)
![[Diagram]](../../diagrams/30/801214cf00348dc08b7c2d620706a2be.png)
![[Diagram]](../../diagrams/14/8599e4eba86ce4ea22a30170a91c0235.png)
![[Diagram]](../../diagrams/45/8d14a4d9871cc2848e2f61e2aebae2b7.png)
![[Diagram]](../../diagrams/51/eaf835c5a05bec7278712ca022b5bdf0.png)
![[Diagram]](../../diagrams/39/44d9e285cd4fbfb785e0d5d4e300d934.png)
![[Diagram]](../../diagrams/12/e3dba469d53c391c7c1500e0ae98ee38.png)
![[Diagram]](../../diagrams/20/25ff2ae0fa7583f6387a8b81895b11fe.png)
![[Diagram]](../../diagrams/18/039c99df6ce5015022dc4ff8e43538a0.png)
![[Diagram]](../../diagrams/21/943a40d823e62add750a809632e83dd0.png)
![[Diagram]](../../diagrams/9/459106da40fdabc06a94f7be76922d57.png)
![[Diagram]](../../diagrams/38/26771fe6632fc440b9e0dd141fb6f848.png)
![[Diagram]](../../diagrams/10/a7d3e5bd9f16234761d4376d1e9a44b0.png)
![[Diagram]](../../diagrams/39/628dcbc2265c154f5b1969c80102eb45.png)
![[Diagram]](../../diagrams/9/6a4c102ece771a8dc1fb2eff6b58f850.png)
![[Diagram]](../../diagrams/1/deb06332eb4ad531df9e4f30acecc165.png)
![[Diagram]](../../diagrams/41/c8793bd1ebfb7255d802bc24d04219d7.png)
![[Diagram]](../../diagrams/25/bee5cb5bb3d0504c9ba432eb7322ee5e.png)
![[Diagram]](../../diagrams/7/c54b66beda8a1198c55c0031d7b149fc.png)
![[Diagram]](../../diagrams/40/e38dc744c962ffa3c9ef86c76bd495c7.png)
![[Diagram]](../../diagrams/18/4bc9b268770bcdefad4ed1857026a8c7.png)
![[Diagram]](../../diagrams/12/04810225436bab6beb8327aedf9e7c9f.png)
![[Diagram]](../../diagrams/14/a313bb645de81565e62ea3bbb8236cd2.png)
![[Diagram]](../../diagrams/7/19ad5ae5a4e8dcd23f51525ac503b4d3.png)
![[Diagram]](../../diagrams/15/558c2854d93ff2b3314eb90642549980.png)
![[Diagram]](../../diagrams/34/030f35742d166678025c584904ced856.png)
![[Diagram]](../../diagrams/21/a5685046c5f390b17e987c51bb4f68fa.png)
![[Diagram]](../../diagrams/52/6f8d50aee8a7af11d0162ead22add42f.png)
![[Diagram]](../../diagrams/2/ef3aadcd5a9ab10fbd3b908d51fc7cea.png)
![[Diagram]](../../diagrams/24/9f3cf3c7ac14718f1175941f2124ddec.png)
![[Diagram]](../../diagrams/13/fe6ed758f5aaf5a12534193f94cab20c.png)
![[Diagram]](../../diagrams/25/0c49a1e1abdeb5caca18e7bbb46d1507.png)
![[Diagram]](../../diagrams/51/e077794b50fd5ff216eca643ba874661.png)
![[Diagram]](../../diagrams/33/4623491a9aede50d38b4842e3e5e26fd.png)
![[Diagram]](../../diagrams/0/ff8e6172c8c1332ede607958c5564054.png)
![[Diagram]](../../diagrams/24/fff5a4a33ebdd49e7c5277431c381ae7.png)
![[Diagram]](../../diagrams/23/544dc5315a856bed3e3045cd3fddb804.png)
![[Diagram]](../../diagrams/11/c1a5c5d715027468b200a084764ef638.png)
![[Diagram]](../../diagrams/50/64886ee5f8972b9916aa68d304cfc176.png)
![[Diagram]](../../diagrams/38/906849c678077900faf1cdec5409e6bd.png)
![[Diagram]](../../diagrams/36/7118ad3135f5459a488b30edae8fd04f.png)
![[Diagram]](../../diagrams/37/d9a2d467ce70c380e85d31d6a4798a7d.png)
![[Diagram]](../../diagrams/35/cf666e832c498d1e82f1f9aac920734b.png)
![[Diagram]](../../diagrams/35/6b00f57f651a3c7287525f362940453b.png)
![[Diagram]](../../diagrams/1/a0ea036308bf0fb0d81dfce843b3fe62.png)
![[Diagram]](../../diagrams/34/2b5e5997663df2527b5ad1f797d7f5cd.png)
![[Diagram]](../../diagrams/2/0b81268e02b3ba021ef71357f8f27570.png)
![[Diagram]](../../diagrams/36/c6ee3e0686e07f47403cb8a1c96f8e65.png)
![[Diagram]](../../diagrams/40/a3a7a3a64b9b142a8c8153585fa296b7.png)
![[Diagram]](../../diagrams/29/d6d5bc1954b98c798b0624e35d771ca5.png)
![[Diagram]](../../diagrams/12/064380a721f09b12bb8d950c30b105e5.png)
![[Diagram]](../../diagrams/9/df3300a0d9cbe314892de0cbbcb8c50a.png)
![[Diagram]](../../diagrams/13/bbc13bd509ddb4de04da1f7201ba6c08.png)
![[Diagram]](../../diagrams/45/e4a5fa9c1ba91dc78665732b8c2eca18.png)
![[Diagram]](../../diagrams/12/a16c21545628895e76dd7f76e85ceb46.png)
![[Diagram]](../../diagrams/10/76109a9877c956bcec2e1403a28a98e3.png)
![[Diagram]](../../diagrams/29/f69abcc3ed61da6f224a57f960732840.png)
![[Diagram]](../../diagrams/52/c8e50be671fbe02d04a761b4c7487c0a.png)
![[Diagram]](../../diagrams/11/6d1da6f22991f928c0d41e5d432fa717.png)
![[Diagram]](../../diagrams/14/37a253c9fb2881a2114bb95eff26f3f5.png)
![[Diagram]](../../diagrams/28/2ff183a587fa650234f304d800447636.png)
![[Diagram]](../../diagrams/10/e5136038f3a771d1e94cf9986a399971.png)
![[Diagram]](../../diagrams/26/4f11203a9c3f3cb051bfcce98f68a886.png)
![[Diagram]](../../diagrams/9/a0650103107eddddf61c918f0c2361bd.png)
![[Diagram]](../../diagrams/8/cbd5eea64df030e1d364a6e37d0327fb.png)
![[Diagram]](../../diagrams/43/747a95c6b5facb1c4148c46119b50d1e.png)
![[Diagram]](../../diagrams/40/819e2d9a93a4a3ff22a53502f38a2fd1.png)
![[Diagram]](../../diagrams/6/67294a4a6c98249e83c1ad8faec60ff0.png)
![[Diagram]](../../diagrams/37/debcda5c2576a0d86126c84a9a42e83d.png)
![[Diagram]](../../diagrams/19/7ae1fd59cc19067f5f7e4bc2ab18ec1b.png)
![[Diagram]](../../diagrams/17/7858b7695965f169cd8954b88da77aab.png)
![[Diagram]](../../diagrams/25/3a0c5f3b72066adc83517a24ad1fb207.png)
![[Diagram]](../../diagrams/20/1df9f30af028060eabba2a9a37631c43.png)
![[Diagram]](../../diagrams/47/4182ba5dbc3274b057cd9823745e3013.png)
![[Diagram]](../../diagrams/32/7f8c6cb667baa2424a07d9e063cac3f9.png)
![[Diagram]](../../diagrams/2/e1f622da2beb8441b8082b2f3e85ea4d.png)
![[Diagram]](../../diagrams/13/95141424cf80537cbc62c2cac60e006c.png)
![[Diagram]](../../diagrams/28/e07de3badec9961ab85116b1395e2ba4.png)
![[Diagram]](../../diagrams/36/6b60df70ef1abb169aba3ab7fb715e91.png)
![[Diagram]](../../diagrams/32/642bfd54e7af659196aa220ff7d80a6a.png)
![[Diagram]](../../diagrams/15/b5879f57262d8d3a88046c4c625f830e.png)
![[Diagram]](../../diagrams/33/434e59ea5f7a838ea155b04d7e0abab2.png)
![[Diagram]](../../diagrams/27/8bf83969b2322a4cacb38a593097d3e2.png)
![[Diagram]](../../diagrams/41/0b24fca8449fd3e9501ab15aec2ddf85.png)
![[Diagram]](../../diagrams/46/b6d2896cb3cd4c2af26b4bbbbdc97f06.png)
![[Diagram]](../../diagrams/39/ca105273c54acecc9ce80b3957d479ec.png)
![[Diagram]](../../diagrams/17/ae805571ae665bde17b9909eb2c4b6a8.png)
![[Diagram]](../../diagrams/17/060a905485a5e5dece60279581f6387e.png)
![[Diagram]](../../diagrams/38/155fecdabccfaa602c5e9e35b115619a.png)
![[Diagram]](../../diagrams/0/a2529461984cd0a0fa406cb42acdd213.png)
![[Diagram]](../../diagrams/6/5ec13474c9f622c4e3cab625815bd38b.png)
![[Diagram]](../../diagrams/24/934c2fd3758fdd2b9836e1ae941d16e8.png)
![[Diagram]](../../diagrams/30/a39502147cef79a195dcaa0c13a3984f.png)
![[Diagram]](../../diagrams/36/0eaeac1c3083eb25b16d16a7737ebb49.png)
![[Diagram]](../../diagrams/21/8f30a2c5e78c33084e22a073bd8da4cb.png)
![[Diagram]](../../diagrams/32/bd6b727399ed5a0faf900dfc872fa82e.png)
![[Diagram]](../../diagrams/15/2cd98dfb953de1946aca367b82b28b33.png)
![[Diagram]](../../diagrams/39/b5ba3bdfcf0fb94e9f2666a1156be91f.png)
![[Diagram]](../../diagrams/2/3eda58f322128bab9cf5bbc78d9ba750.png)
![[Diagram]](../../diagrams/28/89e53822384e9f539b9301f4d500ecf4.png)
![[Diagram]](../../diagrams/34/e6f0fb3a9b65a0de35e9582706d0cb0f.png)
![[Diagram]](../../diagrams/14/e9dc59a941bbfe20d0a68a28e7d7bc2f.png)
![[Diagram]](../../diagrams/28/c4b10c3c723276bbe73516d9c8d857dc.png)
![[Diagram]](../../diagrams/17/1ac8740253d2b20be441076c5ccda7d0.png)
![[Diagram]](../../diagrams/46/0ba54802f7df902b2b725a3cae2a3ead.png)
![[Diagram]](../../diagrams/48/28bc755d2fb834cc6b1e376d03f0d78d.png)
![[Diagram]](../../diagrams/35/ceedb2fbe2b638e7d6210b476c19a56e.png)
![[Diagram]](../../diagrams/39/3b85cb2783449497ce3bc9317e01f10c.png)
![[Diagram]](../../diagrams/26/e5bd4a46c99c2013959e58e5cfd8a4ed.png)
![[Diagram]](../../diagrams/18/fb0c8c22cf293e873e530e4ce014ced5.png)
![[Diagram]](../../diagrams/35/e6d7048ced5be400bdeb2ff3f3698949.png)
![[Diagram]](../../diagrams/52/8f2104344a29a82f9f03aa83dcb4f1d1.png)
![[Diagram]](../../diagrams/42/af52e7c8fbbfbf1ce06035ec21023fb4.png)
![[Diagram]](../../diagrams/50/f105b685637790604aac5562117f1545.png)
![[Diagram]](../../diagrams/35/be8c8004fe48b36d8fb9342c973ce578.png)
![[Diagram]](../../diagrams/48/2c72705a488a4d9330158324d8b6e1c3.png)
![[Diagram]](../../diagrams/51/1c34cec53bf7d5a1dd6be412a08f3d67.png)
![[Diagram]](../../diagrams/5/6d705a3a4e705c2632c395fea2d98392.png)
![[Diagram]](../../diagrams/19/a5f887d8acc7ef8d2f34962e4b18634a.png)
![[Diagram]](../../diagrams/28/7c2591bd961ba51337b62c5b51d55fa6.png)
![[Diagram]](../../diagrams/49/8b927d8e577328533b8de9407d6c2a8f.png)
![[Diagram]](../../diagrams/16/7ad31b31fe77bda95f5ac7f1177f0cbd.png)
![[Diagram]](../../diagrams/10/80893280a4259d45ba02af7217f1f413.png)
![[Diagram]](../../diagrams/29/cf1eaba0a503cf097c6807ad0d0758d5.png)
![[Diagram]](../../diagrams/12/a5dcb5537b33debc09df16e61b9c7e8d.png)
![[Diagram]](../../diagrams/31/9c6ecab1ced7b4f2f10d7452fdb48730.png)
![[Diagram]](../../diagrams/48/5e6e95b98753a8c62fb6482d58d9a798.png)
![[Diagram]](../../diagrams/40/59715d33893388dead5142e6b81f2ffc.png)
![[Diagram]](../../diagrams/52/9b2c34611293ddd50505ed552ed13467.png)
![[Diagram]](../../diagrams/50/982f973c9cee31e5c0a3103076d13aa4.png)
![[Diagram]](../../diagrams/47/490c4d547f1ef76afac3f80f068d51df.png)
![[Diagram]](../../diagrams/15/e4c7f53ba09b1ba3fd89ab84b7219252.png)
![[Diagram]](../../diagrams/38/3cc4702c12f37e80278acb0f1a06a0ec.png)
![[Diagram]](../../diagrams/8/99d79280d9de694a88c0d04573f91668.png)
![[Diagram]](../../diagrams/18/0322461ce555a3c62978f48bbdaf9f92.png)
![[Diagram]](../../diagrams/29/baa8a49e9774c8190d20eafcebd3ef1f.png)
![[Diagram]](../../diagrams/25/78441b7ab375744ba3bd990dae56d557.png)
![[Diagram]](../../diagrams/45/7f1312070b3ecc61c7017345530940ef.png)
![[Diagram]](../../diagrams/0/b10acccaa57c8796b9c4f66d5b54016b.png)
![[Diagram]](../../diagrams/35/74a49e6bd9c2100d9ad23d09d97a41fa.png)
![[Diagram]](../../diagrams/39/1efb9c7c0c0bb9d3a98e1800fb99a566.png)
![[Diagram]](../../diagrams/38/1dc5795071d24db5d1a6ee9a20a4c20b.png)
![[Diagram]](../../diagrams/3/d1e4b0cd80dc67514d7573e97db98232.png)
![[Diagram]](../../diagrams/43/5f11815400aa12c46c80fd3748820e46.png)
![[Diagram]](../../diagrams/16/7d45c7e939669bd81e524da24bf8673e.png)
![[Diagram]](../../diagrams/12/5a72a74bfa865626846b0f6949a2438e.png)
![[Diagram]](../../diagrams/49/86978455a755126c6bb25c2f7eeee37d.png)
![[Diagram]](../../diagrams/35/598a69339f5ef0397f1713a015e33175.png)
![[Diagram]](../../diagrams/35/c8a4a2749105dee6b811f00576251227.png)
![[Diagram]](../../diagrams/39/27279f52b0fb6ba3b756eea44a652e93.png)
![[Diagram]](../../diagrams/41/1c95c18c60885ba9212b9f5a6a58d51c.png)
![[Diagram]](../../diagrams/19/4fc84d4d103b71c309c95e19fa5c2ba5.png)
![[Diagram]](../../diagrams/52/12635aacd3e417173e5ca9f6ef3786a4.png)
![[Diagram]](../../diagrams/17/0762c8e6ec800e2fb7afe45d3961d363.png)
![[Diagram]](../../diagrams/0/ba01fbb795aa4b9edd0b18ba8e95e03b.png)
![[Diagram]](../../diagrams/18/573bd37911357e1d1e5047b16a571a39.png)
![[Diagram]](../../diagrams/13/1dc093aaa8afd7b55ba8fa610a17bbf6.png)
![[Diagram]](../../diagrams/1/35db82a15daee1d175a94b53c22778b1.png)
![[Diagram]](../../diagrams/47/30c950cc4825052fe6901bca48fd8c1f.png)
![[Diagram]](../../diagrams/10/9b4a4b3e5b985e56dbf2c39d6c400941.png)
![[Diagram]](../../diagrams/32/c10f2055b0ccca88402b3e9bace05fac.png)
![[Diagram]](../../diagrams/46/f7248c38dc22aa7fc1be25c01737e2ee.png)
![[Diagram]](../../diagrams/8/52c3fa1374af3f58d709fa5ab5701bf5.png)
![[Diagram]](../../diagrams/8/49844f433e05eabfeea14954926fee77.png)
![[Diagram]](../../diagrams/6/3011bc2f1b6f6b88f897849f14dee9a9.png)
![[Diagram]](../../diagrams/38/23033cbfbc6e7c999a5c86745f7311ae.png)
![[Diagram]](../../diagrams/33/59d9ba009971e47a8523a5076704bc14.png)
![[Diagram]](../../diagrams/19/9ae1452e022a5a1def7db40fdcac9ae0.png)
![[Diagram]](../../diagrams/38/bd2665a01e4a93ff5168ab862cd72536.png)
![[Diagram]](../../diagrams/15/a34a1aae3bc9451e5e7ba94928d58ec5.png)
![[Diagram]](../../diagrams/17/2b905977de91874bb2566da8d264e402.png)
![[Diagram]](../../diagrams/26/8775e913eb023d3471dbb12996209294.png)
![[Diagram]](../../diagrams/22/0590826ba6a5aac6c5e251d9cf996106.png)
![[Diagram]](../../diagrams/52/da6c2c0460c02e92fafc2cd9c14c20bf.png)
![[Diagram]](../../diagrams/48/b7b76c10af5bb238b95cb33f67f6203f.png)
![[Diagram]](../../diagrams/33/9e8e2a9a80ab9919e7bc835c758ac05a.png)
![[Diagram]](../../diagrams/12/0420bdbbc21c20798157e8a96aed53ab.png)
![[Diagram]](../../diagrams/48/ddba71c2a3ef23c3960297d6d16ef5dc.png)
![[Diagram]](../../diagrams/11/9a2dcf342169a580d88faf9fd084437d.png)
![[Diagram]](../../diagrams/50/fb4af11c7981ec088bd92c3d81a497f8.png)
![[Diagram]](../../diagrams/6/09a00c3be80488274eee240a20b7793d.png)
![[Diagram]](../../diagrams/17/26d0e5c179693aaadc856fcf1d82594c.png)
![[Diagram]](../../diagrams/24/7a32259f09dd204e08bd2c91b6d79a8e.png)
![[Diagram]](../../diagrams/21/2391ef630d54b76f6f2777d045e2418d.png)
![[Diagram]](../../diagrams/44/0c8972957397ae0dd50e323837926fc3.png)
![[Diagram]](../../diagrams/0/23e3ea056441f3eec40b6891ad8d14c9.png)
![[Diagram]](../../diagrams/37/a18b69fa3adc7cf6d5aee6c743fce1a3.png)
![[Diagram]](../../diagrams/7/8741bf748c78e3c9f6622bab04215ed5.png)
![[Diagram]](../../diagrams/28/e362152ce6056de7ad4a318713cbafb1.png)
![[Diagram]](../../diagrams/29/e74d06e1dcd0245bd61c7811d1f2d6a9.png)
![[Diagram]](../../diagrams/8/889fa6059f2ee22d5585732c46a71522.png)
![[Diagram]](../../diagrams/14/d756854b62f3a41e53c7328b7379ef04.png)
![[Diagram]](../../diagrams/0/88ae0127f4c8258bbd62a453d677569a.png)
![[Diagram]](../../diagrams/42/f20ce9a1375bcc64df62cf3a66784a35.png)
![[Diagram]](../../diagrams/16/249ec13a83e8874f66dd7784ef69253e.png)
![[Diagram]](../../diagrams/18/1dea23c0014e7aa74092de47ff0c052c.png)
![[Diagram]](../../diagrams/20/5067cfcbb3191a4bc5a662dc809e7643.png)
![[Diagram]](../../diagrams/28/d5ef5d885627e822fd14e6b682a6ad5c.png)
![[Diagram]](../../diagrams/23/ed65b93cce2fcdc5a0bcea20f62c5d20.png)
![[Diagram]](../../diagrams/43/de32471450bff7d20da2d190f4e2201a.png)
![[Diagram]](../../diagrams/46/ffdf614f7345302d118899a575ae5d18.png)
![[Diagram]](../../diagrams/6/a2099fadd9381db89c0d481297f7a0da.png)
![[Diagram]](../../diagrams/38/790d0c16361c80c79b33ec0bcc56f757.png)
![[Diagram]](../../diagrams/22/6aa4da9282ae04fb124c300173a53e08.png)
![[Diagram]](../../diagrams/33/5116436926d35328bfc39ede36440e6a.png)
![[Diagram]](../../diagrams/4/8825141489169e0061d8b69e014613c7.png)
![[Diagram]](../../diagrams/16/b31688e0f49254cbe022807e5d6c9e8d.png)
![[Diagram]](../../diagrams/50/7d9100b8ea522ce94a9d43afac5de84e.png)
![[Diagram]](../../diagrams/46/7ed194a5857308ac45bec91a0fc52516.png)
![[Diagram]](../../diagrams/44/1359caec260529753b65e161aad34c37.png)
![[Diagram]](../../diagrams/44/2966c5372ddd7044b34ef8f7361db15d.png)
![[Diagram]](../../diagrams/28/63569fb2c69e9463b62f00d64009dc47.png)
![[Diagram]](../../diagrams/18/e3d2a6f7fb323694aa9b991a044b9c38.png)
![[Diagram]](../../diagrams/26/2254c3d6adba6d14ca75f679afcf116a.png)
![[Diagram]](../../diagrams/44/f8268561371c5f76e0f8f0b5d52a1f33.png)
![[Diagram]](../../diagrams/18/0296f3841fd0111ebe0161b0fc0a4ca4.png)
![[Diagram]](../../diagrams/32/c78d48d69a88c16558e041d29f0924d4.png)
![[Diagram]](../../diagrams/15/10157447964d1ea1917ed32d08c62009.png)
![[Diagram]](../../diagrams/46/ff8cc549c6a8e56f12300c400e25dda9.png)
![[Diagram]](../../diagrams/14/5147a7012e597044ece712af1ac5e6c5.png)
![[Diagram]](../../diagrams/15/26bc60d7a372d3c0335c5775c242213b.png)
![[Diagram]](../../diagrams/41/0e07b2198ff1d3d561b6f7fe3f97ffb5.png)
![[Diagram]](../../diagrams/36/6c31a35e633413fe75f6e445b5533f6b.png)
![[Diagram]](../../diagrams/46/fd0b3658a02cc2b1123deb2b43a32654.png)
![[Diagram]](../../diagrams/27/a08f6bda6f1f1127e54e1f8c63b27fbb.png)
![[Diagram]](../../diagrams/29/8a652121dcd0f9bf99911aedea3442f9.png)
![[Diagram]](../../diagrams/41/d40bc164bcd5648678d1e474d7a18b50.png)
![[Diagram]](../../diagrams/45/3803051a7ce2ee2394580f6b86759897.png)
![[Diagram]](../../diagrams/51/1e730e9b1ef4d3dc743fbc28f528d383.png)
![[Diagram]](../../diagrams/37/06084e7048ccd2b2b9740958cbc089ca.png)
![[Diagram]](../../diagrams/17/b0039472d0c1933821de3aa2d9166843.png)
![[Diagram]](../../diagrams/35/0da52f54d84922f62dfb01f4c3bc7510.png)
![[Diagram]](../../diagrams/16/79beee85f7c46469ba71f96629d1bbcb.png)
![[Diagram]](../../diagrams/7/22d65f66a4395e5393671db2835c314e.png)
![[Diagram]](../../diagrams/16/f4e86ed2cc05e4a4d9e9e6ba08bcbf69.png)
![[Diagram]](../../diagrams/36/e8e1e9d6689d47ce500600943ef35d65.png)
![[Diagram]](../../diagrams/38/6b1138b29e4825570c65341ade1460ae.png)
![[Diagram]](../../diagrams/13/07495bcd9ac6cd4209c1b6ee2ee5ed6c.png)
![[Diagram]](../../diagrams/45/26a99b30a9e777578f892a3fb56e2ba4.png)
![[Diagram]](../../diagrams/19/5190402672ae2655682ec2bdbc887e66.png)
![[Diagram]](../../diagrams/11/da3fdc93a762bd37e0fc72d708223820.png)
![[Diagram]](../../diagrams/0/86de3e8cc5146decd2900e51f70e5b57.png)
![[Diagram]](../../diagrams/38/5682f858aec91ac4c7f2a3542fdf625e.png)
![[Diagram]](../../diagrams/6/a788cf670ca93b54749382c1181463f2.png)
![[Diagram]](../../diagrams/36/bf978902e30906780a8c269d53016cc4.png)
![[Diagram]](../../diagrams/19/8a2654034d83042f6d860b919f385af4.png)
![[Diagram]](../../diagrams/40/235d85e4d5e276a1543049f26c2571ae.png)
![[Diagram]](../../diagrams/46/a1d2eed260c902f869de8c1300e6fc58.png)
![[Diagram]](../../diagrams/44/2e62a1a8c0a50b0a275d9b65e48f8db1.png)
![[Diagram]](../../diagrams/15/640c8aee85e860b34e5dd3325526c66b.png)
![[Diagram]](../../diagrams/6/574cde679146b75ddeea9cdf74865afb.png)
![[Diagram]](../../diagrams/35/f22cbaf80eaf2e0fbc86b5c0e7ffd414.png)
![[Diagram]](../../diagrams/51/b08039d7ce0b07d940c7c431c6ff54b8.png)
![[Diagram]](../../diagrams/46/62de5ec5c2b74e5b0a29cf8097734caf.png)
![[Diagram]](../../diagrams/8/e4d2e5754182e1efed56cf725a6f56f4.png)
![[Diagram]](../../diagrams/50/3348a0b6fc9577db186197e3666ca8bb.png)
![[Diagram]](../../diagrams/12/395e6a2929afc39cb5e932ee1b3d7662.png)
![[Diagram]](../../diagrams/45/65e4e5d073b16928c516a6ceaa835971.png)
![[Diagram]](../../diagrams/40/a42d9e2cdb3018cf8d87d866a491a087.png)
![[Diagram]](../../diagrams/35/efadd18a7555d2b4c1a1ac85bbf5ee99.png)
![[Diagram]](../../diagrams/2/52e3648d0e3434d0198067d2218c2dc8.png)
![[Diagram]](../../diagrams/49/33aa1fbd6df2063bf69925ebb9acd190.png)
![[Diagram]](../../diagrams/46/1c3f59872dbb8cf3cb9e8320c4da9136.png)
![[Diagram]](../../diagrams/48/9bc2763e4a9d3e7eff7bf6ea03f2801a.png)
![[Diagram]](../../diagrams/4/6b5c3bae55174841eedc85505b28019c.png)
![[Diagram]](../../diagrams/2/96fc4071a403c7114dad1a04233de0a6.png)
![[Diagram]](../../diagrams/43/6b682e8fced99bf9ddbf3c3ca619bd91.png)
![[Diagram]](../../diagrams/10/4a39b0947c347214edca1ebdcfa18290.png)
![[Diagram]](../../diagrams/0/dd1c87c0c94a6d9156b94d1732437d7f.png)
![[Diagram]](../../diagrams/9/32de3b155d246c2e5d3c9d24656e646d.png)
![[Diagram]](../../diagrams/25/9f91957b68a70909c0a2e7835482fcab.png)
![[Diagram]](../../diagrams/46/ee7218c35053f40b1b3340bdf102ebdd.png)
![[Diagram]](../../diagrams/13/ad91b2fc8cc174a2eb9f146a3d4435b4.png)
![[Diagram]](../../diagrams/31/db04a6a5cdd69a9e6f7f0ee5d6122aa2.png)
![[Diagram]](../../diagrams/25/74c6200858a5cb48a6d039ba90fa413a.png)
![[Diagram]](../../diagrams/43/70ca8be1ddc18317c93bffc76259b883.png)
![[Diagram]](../../diagrams/10/e57afb2d82972cba4b6ca198cdef399e.png)
![[Diagram]](../../diagrams/23/f96e86e041ef74c0fda349ba53e74e6f.png)
![[Diagram]](../../diagrams/21/2b7fea5da405737135a73d5073bc0fa9.png)
![[Diagram]](../../diagrams/11/ad69503886b26fd36a230b3aa72bd716.png)
![[Diagram]](../../diagrams/3/ae3cb7007b278b062c360dc5cce709eb.png)
![[Diagram]](../../diagrams/7/acfc079bd65dfb232584c81a7803db69.png)
![[Diagram]](../../diagrams/36/387fabceb6ed73dbefabeb2fbcafa7a7.png)
![[Diagram]](../../diagrams/44/458cec5c176fc32d74b92d3694e418a8.png)
![[Diagram]](../../diagrams/32/4affddc6128e17e18c68328bc281995b.png)
![[Diagram]](../../diagrams/46/23e23fcaa4305f956b7981b0958c78bd.png)
![[Diagram]](../../diagrams/35/f686e9827c6a7bf9473ced5a794584ed.png)
![[Diagram]](../../diagrams/41/e09cd4533a8e74f8bd4a18cbdcfc0b30.png)
![[Diagram]](../../diagrams/13/94b2a4649cab3f7c8d6636b07385a9f7.png)
![[Diagram]](../../diagrams/51/201ddb387b09f4e5c64e6a8bec8048b9.png)
![[Diagram]](../../diagrams/2/febeddb188f02c90c60b018747d6fbe3.png)
![[Diagram]](../../diagrams/21/bd6edb04bc03ab44cb3569c12dc2204d.png)
![[Diagram]](../../diagrams/28/e104353f5945ca237697505f0da7f14d.png)
![[Diagram]](../../diagrams/33/f690864faae5827fea5660ac4fa9a896.png)
![[Diagram]](../../diagrams/33/aed49a53c7a3e41af0472bfc433ce21f.png)
![[Diagram]](../../diagrams/8/06efc3f945667a3fc2a72724279dd34b.png)
![[Diagram]](../../diagrams/28/4dac3b180a068fe30f2961f35521464d.png)
![[Diagram]](../../diagrams/12/80183fe9140a8a53d84728909d627631.png)
![[Diagram]](../../diagrams/45/d48bf22dc51c8bf0085dfef04387faca.png)
![[Diagram]](../../diagrams/25/2c2da4ecb25f300d9ddfa0de777100f6.png)
![[Diagram]](../../diagrams/33/bd4a550fed2eb0c381e672944e4f5526.png)
![[Diagram]](../../diagrams/35/f7110cada22d1dc8718483a6f1cb69be.png)
![[Diagram]](../../diagrams/24/b2b72aeefe834a4b45f64783ac6e9cc6.png)
![[Diagram]](../../diagrams/37/24a378d5153820995d5159b4c5f576a7.png)
![[Diagram]](../../diagrams/13/eab96e13aeb5253ef4218d1e37af74d7.png)
![[Diagram]](../../diagrams/47/bd461f791ac625bdb1dcdfebc7978083.png)
![[Diagram]](../../diagrams/15/912f749d90bcaa17871ab3ed6d10cc71.png)
![[Diagram]](../../diagrams/0/b6c57c8b743776581b14fae27058dc95.png)
![[Diagram]](../../diagrams/48/c28a65aeea6eda89d062aeaba0409c81.png)
![[Diagram]](../../diagrams/18/0eb2f23bd5633b7ef77b8d79f59b9b4b.png)
![[Diagram]](../../diagrams/4/c45b711b9700152132ac86898c0f7476.png)
![[Diagram]](../../diagrams/12/b53ac5bec37b02a7f94c587c766ca678.png)
![[Diagram]](../../diagrams/4/9aec9a266688ea5fbd4b3db91ad4666a.png)
![[Diagram]](../../diagrams/10/8859f20cfb54c662969535a842554bd9.png)
![[Diagram]](../../diagrams/50/c3ff5318d5a65105e995cc35266f9752.png)
![[Diagram]](../../diagrams/26/8fc5fe5677d834ecf0dae641d6301694.png)
![[Diagram]](../../diagrams/47/9a854528c3bdd57fa3fbccc5ac8b9e64.png)
![[Diagram]](../../diagrams/20/16c1179f6912e5bc58cce475cc3f8c06.png)
![[Diagram]](../../diagrams/29/e5bf982a48122d8bbbd6178e633e7536.png)
![[Diagram]](../../diagrams/12/04d825b104ea0ed82c2cdeb405df68e6.png)
![[Diagram]](../../diagrams/52/e073996bc959716663d91d8c2ac4d64c.png)
![[Diagram]](../../diagrams/41/51b0aad9bd1334cc89775e0f281d7686.png)
![[Diagram]](../../diagrams/29/481667e10e82361925fbf52fe88e90d2.png)
![[Diagram]](../../diagrams/26/42710080ca38a478075cfd46be252a75.png)
![[Diagram]](../../diagrams/44/6b8d9bf84c697962c159a5cdcba401fa.png)
![[Diagram]](../../diagrams/12/99c348b8bb3df452b8591541ba081b98.png)
![[Diagram]](../../diagrams/40/5b89d6fe2b42ee46a8c601ba51bf32b1.png)
![[Diagram]](../../diagrams/36/2b417f7c17271e01f115910e39233a58.png)
![[Diagram]](../../diagrams/25/06d7610882880ae292667ffa260b396c.png)
![[Diagram]](../../diagrams/11/19253031bfcf23cda440e6a8060257c2.png)
![[Diagram]](../../diagrams/36/e336848f149c8428db4f03d064ca6587.png)
![[Diagram]](../../diagrams/13/3ffbfa1243a167d23ddb75fa5fc1008b.png)
![[Diagram]](../../diagrams/5/873aa65e3f52b8387efeb293f6460332.png)
![[Diagram]](../../diagrams/26/68b8e9559d2df515bf9833c31f070189.png)
![[Diagram]](../../diagrams/18/4d03ffc921d889cc9b14e123cf79480c.png)
![[Diagram]](../../diagrams/25/534a8c4625c5ae4303818f1195d93f6b.png)
![[Diagram]](../../diagrams/50/9709a3979ea1130c41445ad1a4275e34.png)
![[Diagram]](../../diagrams/38/608ed63aaacbe4d2d63c34da3efea3fc.png)
![[Diagram]](../../diagrams/44/69ca57af427d15d840c55288952bbe9b.png)
![[Diagram]](../../diagrams/5/328e8df279a12dbb36325b98198ba4b7.png)
![[Diagram]](../../diagrams/42/9089038d9da8385b6bc7b9aeeb6a1c8a.png)
![[Diagram]](../../diagrams/35/689edb68b6beebc56a2f8ed81ab83a1c.png)
![[Diagram]](../../diagrams/16/8ad2a3a078132de26ff5965e4c66bbc5.png)
![[Diagram]](../../diagrams/26/b56898220236bd2fb2f758f3b476e607.png)
![[Diagram]](../../diagrams/4/3c02ab894acca3c9a33dd8c006560ede.png)
![[Diagram]](../../diagrams/35/d69a99e8870bff1362774a75b40790c1.png)
![[Diagram]](../../diagrams/14/a278be6eca67dd3cbd9d5447c1b1dbe1.png)
![[Diagram]](../../diagrams/49/98ef955668d85178805dee0494a68a54.png)
![[Diagram]](../../diagrams/25/ca001be12f5fa6beb9ea20c40ed16292.png)
![[Diagram]](../../diagrams/0/19f698d025b05b51947d726ab6b149b3.png)
![[Diagram]](../../diagrams/11/52f7a1ef50d7d313e2b505aa2c42c3e1.png)
![[Diagram]](../../diagrams/40/f4fb4b6f621539834a7ec0a8f64940a0.png)
![[Diagram]](../../diagrams/11/2c9adc4d3c7794e0e15f49ea19e13b71.png)
![[Diagram]](../../diagrams/48/c0a36b8ba480402596d7534c79e1ba70.png)
![[Diagram]](../../diagrams/47/30329d2cc592820d40de5fd3c8fe6fad.png)
![[Diagram]](../../diagrams/51/b94fdb85857f5eb864b512b466b9cd98.png)
![[Diagram]](../../diagrams/48/7717b77b78240db49cb1ecf8e7145dc1.png)
![[Diagram]](../../diagrams/48/e271afca22bd1a39a0ff9589c508bf04.png)
![[Diagram]](../../diagrams/20/bd2b8e9663aa2c8b9bd438963b9db4ac.png)
![[Diagram]](../../diagrams/47/5e35be176b29fb1467b74318dc19356f.png)
![[Diagram]](../../diagrams/13/91e1402b1658e85632a5bd6f3beed704.png)
![[Diagram]](../../diagrams/24/6a87717858156a4d0e653288cd6b94e2.png)
![[Diagram]](../../diagrams/25/fd2b81b18a478b84387214c5ba8ec219.png)
![[Diagram]](../../diagrams/30/9101d1aed678707854887550830e56e3.png)
![[Diagram]](../../diagrams/8/bd5ad1336109a3f3ddef7d4a54bfaa13.png)
![[Diagram]](../../diagrams/3/104ecc486e3283167f47d110662e6c29.png)
![[Diagram]](../../diagrams/26/7a9bde4e7ce53c360a3da3e8987c2f0e.png)
![[Diagram]](../../diagrams/15/7db634434c46444c71974c741b46902e.png)
![[Diagram]](../../diagrams/2/ba00e3c7a7bcd0b71e9e62bb4897db34.png)
![[Diagram]](../../diagrams/25/d919dbfb53e16c99c93f432025e00b0c.png)
![[Diagram]](../../diagrams/47/e280775d7b488948b48dca1688fa623c.png)
![[Diagram]](../../diagrams/2/c45d5dea097c0072c8d679a714eeb4bd.png)
![[Diagram]](../../diagrams/17/40dda2325da9ae80a8a9a7245fa46e38.png)
![[Diagram]](../../diagrams/42/2ce6a5b31560e865cbfb136ef69cf2e3.png)
![[Diagram]](../../diagrams/2/17f7002ab16d2b1b60b266e9d7ef692a.png)
![[Diagram]](../../diagrams/30/2311b0229132fcc378ba4b889edf268c.png)
![[Diagram]](../../diagrams/50/a0a5f2764f86286ee4c129dca91143df.png)
![[Diagram]](../../diagrams/15/15dce3a1624fb43ff73766018653ae1f.png)
![[Diagram]](../../diagrams/44/2bba145d0eeec85fd1458020e54eab1e.png)
![[Diagram]](../../diagrams/27/e04998387697c533236c4a0aa0866faa.png)
![[Diagram]](../../diagrams/35/80e69ade4a76622d6ae803590ba6c732.png)
![[Diagram]](../../diagrams/37/ad0033fa29b52aaf3f2a4e3dfe5c73b2.png)
![[Diagram]](../../diagrams/43/a6fa6b5329d8de974d875d90c14f5e73.png)
![[Diagram]](../../diagrams/3/adfbabe1a7eca7bf91c1ed3c72ef3442.png)
![[Diagram]](../../diagrams/35/970bea7cddbdb0264da6ba76ff78bb6a.png)
![[Diagram]](../../diagrams/46/5ec88d2929d82e92054e86c5c0ec9193.png)
![[Diagram]](../../diagrams/43/0d9c2f26978798ccb003e99e825ffeb2.png)
![[Diagram]](../../diagrams/40/aa87abe45fe6a6ba47641a942711f6ab.png)
![[Diagram]](../../diagrams/50/0f9f45c8bfbd2e6a9fd92a8d0dcaaf72.png)
![[Diagram]](../../diagrams/17/931d3e25e0b3e4330f4af9ed80e83742.png)
![[Diagram]](../../diagrams/2/bee97d1bcd812f75a9e2a90128adb29c.png)
![[Diagram]](../../diagrams/42/b93bc3918af139bb5c7c9cc7ae98d500.png)
![[Diagram]](../../diagrams/45/45d1eabbfb49b18358e17e5b65ac04b6.png)
![[Diagram]](../../diagrams/12/1e5cb756409efffef864357ac08b967b.png)
![[Diagram]](../../diagrams/19/285e0f554df96daba8824923421fa1ef.png)
![[Diagram]](../../diagrams/39/bfccea029ecadb126394007858e376a7.png)
![[Diagram]](../../diagrams/49/74d922ad045b551db51548f3342575c7.png)
![[Diagram]](../../diagrams/38/ef8318f498374f2bbf141c9864dd5da2.png)
![[Diagram]](../../diagrams/22/61eebc8cf7d3e839246185ddd5d661fe.png)
![[Diagram]](../../diagrams/32/88cfffa7f19c85b4931ff0eb4e568941.png)
![[Diagram]](../../diagrams/15/5c807728da65f16af8f0d64ff2339d7b.png)
![[Diagram]](../../diagrams/24/b6db81dd4935e877da8a87fb1979b635.png)
![[Diagram]](../../diagrams/35/a06ccbe612a43f15f228e3a8aebd2e7e.png)
![[Diagram]](../../diagrams/33/157637032fd7bc92aa8dba4f9c6acf18.png)
![[Diagram]](../../diagrams/25/e099e03c24b7b43a89476672a8e0f8f6.png)
![[Diagram]](../../diagrams/34/9590a556fb20a546e39b08282ce34dbe.png)
![[Diagram]](../../diagrams/1/a1cef0d8f0dd7cb91e06cf70962d7c0c.png)
![[Diagram]](../../diagrams/46/b995d87b16a7c46aa8fde8f4aeedb6c9.png)
![[Diagram]](../../diagrams/10/f7de5a39f6cb1cb736a953104209f226.png)
![[Diagram]](../../diagrams/0/ebd5adf54094e518a4c702ee0a27504e.png)
![[Diagram]](../../diagrams/1/40ec93c875a1a3ebc3d82fd7a070a077.png)
![[Diagram]](../../diagrams/14/fd402d04bdafc1bf56e004f714196de5.png)
![[Diagram]](../../diagrams/27/5fba9774808d9456be2825169c590d40.png)
![[Diagram]](../../diagrams/31/054901ebb131c92f96764b83f6c7650a.png)
![[Diagram]](../../diagrams/49/52c07998cd9eb812b847207201bbf6fe.png)
![[Diagram]](../../diagrams/0/baba99d029a7db89053f36e4cbbcecc2.png)
![[Diagram]](../../diagrams/2/be49a72aba80f322ab19a3df2e455f24.png)
![[Diagram]](../../diagrams/24/c3bbd8e8103a43318601f045bf39b29c.png)
![[Diagram]](../../diagrams/37/f4d09df5d79158b451eb6fd484ba0926.png)
![[Diagram]](../../diagrams/3/87779e5267135f04987c5ce17cab0dd5.png)
![[Diagram]](../../diagrams/4/60f6b112fa8e28b5a66c9ca9ebcd8f1d.png)
![[Diagram]](../../diagrams/12/55d9c5c9a1a5c79c2f921a99762620da.png)
![[Diagram]](../../diagrams/18/90cde17f02bada8baf2a25676d90a493.png)
![[Diagram]](../../diagrams/17/3fc2fc3d9740e16cec84a31c53db1215.png)
![[Diagram]](../../diagrams/13/60d5b34125af717d91c63fb10070ce0c.png)
![[Diagram]](../../diagrams/43/652b304267157a2066aa06ac9e101503.png)
![[Diagram]](../../diagrams/24/38d79e1105dc36cb890d13d7d15df97f.png)
![[Diagram]](../../diagrams/49/61ea4e21cb3569227044975fd593e06d.png)
![[Diagram]](../../diagrams/28/ca5d05b90748a8f8741188de809763c9.png)
![[Diagram]](../../diagrams/44/b970252f3c0f935d8e9604d6bde5479e.png)
![[Diagram]](../../diagrams/36/5985efa42e79318ee0b7af7dee1ec5c0.png)
![[Diagram]](../../diagrams/40/5bd08f087a03d332d3ccae4caf5bac56.png)
![[Diagram]](../../diagrams/22/4b47dd90340d41254f4078dcb9c07018.png)
![[Diagram]](../../diagrams/10/45278180189f7920bb208571e07ffdd1.png)
![[Diagram]](../../diagrams/7/cb185ac1c6e9f8f03d63e60df59c95b9.png)
![[Diagram]](../../diagrams/47/a13d10041a6898824752d7bcfd2c410b.png)
![[Diagram]](../../diagrams/52/4054b288676ee31c3ddbcf21ee9bbd16.png)
![[Diagram]](../../diagrams/43/93fdc1dd2d37c4cf8d8f891f4ce6af99.png)
![[Diagram]](../../diagrams/19/62eb3919442a1005265ae03638ac7b3e.png)
![[Diagram]](../../diagrams/14/d8d870169338194889e182edbab4a79e.png)
![[Diagram]](../../diagrams/51/538e3e0a57f814848a3867ade451e725.png)
![[Diagram]](../../diagrams/43/adefd9ffd6bb0b88ea8de13114cc4d55.png)
![[Diagram]](../../diagrams/26/1aa16efefb852903e6c7a12754a90a20.png)
![[Diagram]](../../diagrams/39/2e867b60ad09344ab69ed861710b5400.png)
![[Diagram]](../../diagrams/23/7f11ec0377424d0817025a982c693067.png)
![[Diagram]](../../diagrams/42/a9b396fb52e125063852057f464374ac.png)
![[Diagram]](../../diagrams/5/31960eca80f6932b2621c0a11c36b653.png)
![[Diagram]](../../diagrams/1/3b988631a8a13de2e218b99d4331930e.png)
![[Diagram]](../../diagrams/29/aa26521d8cdeb5293c6695f0c9cba235.png)
![[Diagram]](../../diagrams/41/efde6639eb7bd7c0b62bc1c1cfe252a7.png)
![[Diagram]](../../diagrams/38/4d5aaef01bd36d739304085e8b540778.png)
![[Diagram]](../../diagrams/21/a0c8c09b2cf4901ee718d06b0b2eca90.png)
![[Diagram]](../../diagrams/0/d6ff5b507b9ea5af39797f4da186dc8a.png)
![[Diagram]](../../diagrams/33/e7bd3805adde4efbaa496caac7b0964e.png)
![[Diagram]](../../diagrams/30/5c65e9b681298d08655356a1127222be.png)
![[Diagram]](../../diagrams/13/aea802af4d2dbc0265932f198fa66984.png)
![[Diagram]](../../diagrams/17/bba6290f136b995e57a896ecf677b364.png)
![[Diagram]](../../diagrams/12/1fd7473a0808b56ed16b7381973a2360.png)
![[Diagram]](../../diagrams/20/49c203a13964cce0e64498e89fca8d94.png)
![[Diagram]](../../diagrams/2/f733f847cf6db1e4770d28c3ea72a344.png)
![[Diagram]](../../diagrams/10/adb07d0b477f7bd958d388bdebeee028.png)
![[Diagram]](../../diagrams/3/d95275cf00559136ff7a4ec08b8c8b5c.png)
![[Diagram]](../../diagrams/22/b3eb003731ae9750acfecaa540b8acfe.png)
![[Diagram]](../../diagrams/1/4aa1adf175660f1a06a2cb4077046a79.png)
![[Diagram]](../../diagrams/34/a485973e71d7865532cae795c21d5e07.png)
![[Diagram]](../../diagrams/22/f50e5ccb8ff70c7b1079ed501b06d8bf.png)
![[Diagram]](../../diagrams/25/953b6ee4335fc79ac26fbc79d8844e34.png)
![[Diagram]](../../diagrams/16/030f98c002762a2cd9f2ed8055c6f378.png)
![[Diagram]](../../diagrams/2/8899fdb1ab8ba5cae8d5d393bd3068b5.png)
![[Diagram]](../../diagrams/30/6359137f9e6aec2226b309695cf81e74.png)
![[Diagram]](../../diagrams/36/5130f56ef76ef4f19be1ca7fdd72b83f.png)
![[Diagram]](../../diagrams/14/b8b7a4f31336cd143c0fd75ab57e9e11.png)
![[Diagram]](../../diagrams/18/cb6f7e77f64a5bcca55bd234c31b4ccb.png)
![[Diagram]](../../diagrams/20/b7f4bfd64c06cbc400eb621002b67a1a.png)
![[Diagram]](../../diagrams/20/bb79b6d6b1228c7ac515c064c42cb89c.png)
![[Diagram]](../../diagrams/34/480e22ddd2032e9066248e9c93d44553.png)
![[Diagram]](../../diagrams/32/fe49a01bdbe40e13e48f455934181299.png)
![[Diagram]](../../diagrams/29/e76d3f18053e68988127e7e44d497d91.png)
![[Diagram]](../../diagrams/36/f90f7814d7fa38b269c70137276d313e.png)
![[Diagram]](../../diagrams/35/9ab0a6982be255eeba9c51623b3fb996.png)
![[Diagram]](../../diagrams/31/62ae6c1ed2b9653e85118334cb03ab32.png)
![[Diagram]](../../diagrams/19/77e5562df55801d54d286fb6c4816a7c.png)
![[Diagram]](../../diagrams/38/ae852f0748d1e4beee4c67127136821a.png)
![[Diagram]](../../diagrams/39/798fdd187925f675177546dc94b6eb28.png)
![[Diagram]](../../diagrams/1/718dd3620f0e52c862d86fcc82d69ae4.png)
![[Diagram]](../../diagrams/32/9119e8fcd0550cb5dd7af3dfa30a6253.png)
![[Diagram]](../../diagrams/3/01620f1d69c00b7c922c404a036cf7a7.png)
![[Diagram]](../../diagrams/34/01d79bbf75843a41851e2d51ece4c856.png)
![[Diagram]](../../diagrams/49/4d72207b61bbede454c3f60803df1491.png)
![[Diagram]](../../diagrams/34/1d2e7e29f706d228bc639b782607223f.png)
![[Diagram]](../../diagrams/28/85a845ace6f45012e434e976dafecf6c.png)
![[Diagram]](../../diagrams/7/b84670774954e3823aec8ae4d6dc33b5.png)
![[Diagram]](../../diagrams/25/1947ffc430b40d9887a9454ef9cef028.png)
![[Diagram]](../../diagrams/10/38ffe908d49c6954c09687db4feb5253.png)
![[Diagram]](../../diagrams/47/fcc2f2c44ba0ca3a123ba202d02e99c4.png)
![[Diagram]](../../diagrams/3/80958b630c90c6dbbcf5a4a4e76985a9.png)
![[Diagram]](../../diagrams/36/bf8688224f49004cd34e4d12488cfed0.png)
![[Diagram]](../../diagrams/34/4e86022cc0a3521161abfcf3685e0d37.png)
![[Diagram]](../../diagrams/41/7f2bd13555e44dffec1384f0959bb511.png)
![[Diagram]](../../diagrams/30/c9ad958e1c6f9b3405b8991fe8cc3880.png)
![[Diagram]](../../diagrams/7/b5732df27efab61acdb89b86b08567e8.png)
![[Diagram]](../../diagrams/8/741f8912190532a5c0da2f51e185bddd.png)
![[Diagram]](../../diagrams/37/61887393a3b687151fba3b1019a50362.png)
![[Diagram]](../../diagrams/11/9e0e95d3a8b4660ea10c5042459c9ec4.png)
![[Diagram]](../../diagrams/46/c9fa616227c720cee4c590ec953e3e75.png)
![[Diagram]](../../diagrams/26/8ce5c24e5c5f80c3548ae87021f3c0b0.png)
![[Diagram]](../../diagrams/50/59e6ae33aae2bd334fa40fbc421edf13.png)
![[Diagram]](../../diagrams/9/696866ff28e3299dab8fda311b04fd0a.png)
![[Diagram]](../../diagrams/31/a0f2ff48f49eb05ea67b4519fa7cf4d1.png)
![[Diagram]](../../diagrams/47/0ce9f36d17246a61c22f845b89bf0e10.png)
![[Diagram]](../../diagrams/14/0e36b1002a0bdbd4dc7f5442b7554abd.png)
![[Diagram]](../../diagrams/24/553069052a02024b6c00de153d394b91.png)
![[Diagram]](../../diagrams/17/b7b2b809d2709b5cce58b1bec72b1157.png)
![[Diagram]](../../diagrams/7/577023ae43c4a1fb6e16264ff692f0ec.png)
![[Diagram]](../../diagrams/13/1a62f0777a52fff6404335cb7d928397.png)
![[Diagram]](../../diagrams/0/953cb72a1f75cd1e1f07b1217253b42d.png)
![[Diagram]](../../diagrams/24/095c9dc9d89644f235ebf5dcf73d17b4.png)
![[Diagram]](../../diagrams/6/ff8cb02b72abfb92f6d26fd25084f5e7.png)
![[Diagram]](../../diagrams/17/42751a138c7af7ddb9285668ff35fe98.png)
![[Diagram]](../../diagrams/44/fba51fcee855834821a59880f9dd8d78.png)
![[Diagram]](../../diagrams/35/c6a6473f056586fef514a7a3229be16f.png)
![[Diagram]](../../diagrams/19/ffa7969042ae3037a69f0aa0eb3a022c.png)
![[Diagram]](../../diagrams/11/9893b09948412368acbc9b52c62f1c44.png)
![[Diagram]](../../diagrams/6/ca18194d4d534ea8270e7d80f56bcb3c.png)
![[Diagram]](../../diagrams/5/e52fc0015aac1b1123a1222fcce0eb7a.png)
![[Diagram]](../../diagrams/15/7b2efdb43c737df88b12135c3a1c6e6b.png)
![[Diagram]](../../diagrams/18/a07039ca735c6f9dc74591673578ae0f.png)
![[Diagram]](../../diagrams/7/d5444786d4cc3c3788334d7d06a7b0b5.png)
![[Diagram]](../../diagrams/42/9abcdc24fb842fc77d2f123ea86a3809.png)
![[Diagram]](../../diagrams/17/c08df8c9b4fe7e233827279111bb6327.png)
![[Diagram]](../../diagrams/30/f4021fd23b2d80fc4d9fdd8a7ee3d0ea.png)
![[Diagram]](../../diagrams/50/a4a9832bde13b9a14f7163fd9d3ba8e7.png)
![[Diagram]](../../diagrams/10/9c050431d27d1c870e91e18f15cfcf50.png)
![[Diagram]](../../diagrams/15/a81fe76696ab855ad4c6809f384f15c0.png)
![[Diagram]](../../diagrams/52/bf6d46634c50bb6094b275970a47dd4c.png)
![[Diagram]](../../diagrams/32/64d14f57154b64336e89b1e13d3a0ebd.png)
![[circled point]](../../images/ec.gif) is that now an invasion by white at y is less severe because a black play at z is sente, which would not be the case with
is that now an invasion by white at y is less severe because a black play at z is sente, which would not be the case with ![[Diagram]](../../diagrams/42/80231c6ea990da261fd1c07f3264c5dc.png)
![[Diagram]](../../diagrams/3/70b4973c430a8481df0bdd88b1eaef3d.png)
![[Diagram]](../../diagrams/33/dd84de97790b578b6ebaf72fdd955086.png)
![[Diagram]](../../diagrams/0/a20f76a559342165a11548c8362f5563.png)
![[Diagram]](../../diagrams/11/ac55cf5de4f4bfd7a4d78b2600b5e639.png)
![[Diagram]](../../diagrams/37/5f9e9737512fe878cbfc1d861fe974ab.png)
![[Diagram]](../../diagrams/18/83ab66e4743b726d716ee08e750f745a.png)
![[Diagram]](../../diagrams/15/66e39a0cafb76cc1029e499ee9cf8933.png)
![[Diagram]](../../diagrams/47/2d0a84a6b3b154709e950e70d821ab8a.png)
![[Diagram]](../../diagrams/36/18c1c68a1b3a10167cecd4781738a0ba.png)
![[Diagram]](../../diagrams/1/8c271d320703cfaac32b8c5d8792f040.png)
![[Diagram]](../../diagrams/29/4b84dd94c35d01a7ad113a0b4e5d1df5.png)
![[Diagram]](../../diagrams/28/9b68ba8f458e820319da820f4171ad6f.png)
![[Diagram]](../../diagrams/14/f43c23c82934a465c39ab1c401491432.png)
![[Diagram]](../../diagrams/24/63dd21efea6564454129b73d5cee4546.png)
![[Diagram]](../../diagrams/33/6abaea0fe6ac4a252ed96d1b45fe6fe5.png)
![[Diagram]](../../diagrams/29/38c2afbdc6ce4f513c6e8911c021eab2.png)
![[Diagram]](../../diagrams/34/e84daf0987452a25aed66a45d6b239af.png)
![[Diagram]](../../diagrams/47/e307f65bdcb2b92cdf4d6fbf1032b752.png)
![[Diagram]](../../diagrams/36/c19672aeff8faad629e703f462b3f32c.png)
![[Diagram]](../../diagrams/3/f701ae9e9920ae6cf10221cabf427659.png)
![[Diagram]](../../diagrams/3/2423f50c9c0ff46d089808c933555429.png)
![[Diagram]](../../diagrams/18/4e1afa79f9b57b1147565d5e886d7a80.png)
![[Diagram]](../../diagrams/33/bb478c8b5b6d0888475e8f5997fb45cd.png)
![[Diagram]](../../diagrams/11/23c46ca56ba88a658e11d2c61cb66d35.png)
![[Diagram]](../../diagrams/30/dacac7be69bb9cb94c03b4e13dae7bb1.png)
![[Diagram]](../../diagrams/43/d5f53e77c8190db7186d4609cb805b2d.png)
![[Diagram]](../../diagrams/51/2ae0da461adff75b59c5c533fda83ec9.png)
![[Diagram]](../../diagrams/11/2c479a535aefbf859eca2dc7c2634478.png)
![[Diagram]](../../diagrams/11/00685f341a420544d5f49846271ebdea.png)
![[Diagram]](../../diagrams/9/edb79d5dc987450cb688790973f9a12c.png)
![[Diagram]](../../diagrams/11/b998ef22fcb802068ca22e98c8608e10.png)
![[Diagram]](../../diagrams/40/31ec03caf6178faec4ee3c76edb6f586.png)
![[Diagram]](../../diagrams/22/594abd67be2b5da4261b300a6a154c07.png)
![[Diagram]](../../diagrams/4/51e1840fb29fc0c9fb9b2edadab34381.png)
![[Diagram]](../../diagrams/22/36b5584eba4b98170cfe660bd89d7af7.png)
![[Diagram]](../../diagrams/22/7bcb52f23dcefbab70d6886379c879d0.png)
![[Diagram]](../../diagrams/23/3c24ea9865080ab966d4d351cd68a44e.png)
![[Diagram]](../../diagrams/34/663338eb8eba2043fc9717086390228a.png)
![[Diagram]](../../diagrams/3/ebf885bc5b5e689b48844899439de023.png)
![[Diagram]](../../diagrams/49/6e1ae7117091918975d5629b20cb9507.png)
![[Diagram]](../../diagrams/3/5d2e220d5fb6f4e7a95d84ad1cbf4ddc.png)
![[Diagram]](../../diagrams/17/0f1968998b2902c60ab8cddf8330db32.png)
![[Diagram]](../../diagrams/20/8822e91001074840744d42354d224e28.png)
![[Diagram]](../../diagrams/17/139ae74f7a864609712710f833c84271.png)
![[Diagram]](../../diagrams/32/74d6cfce574fd6061e24a1b91e419e5f.png)
![[Diagram]](../../diagrams/42/751505ffac3dc6d86310eede0033bd1e.png)
![[Diagram]](../../diagrams/32/a1b17d54e42ca50180d5a9f37577c09d.png)
![[Diagram]](../../diagrams/38/b91c108b4c6b11e2a402b241d69ebb5d.png)
![[Diagram]](../../diagrams/45/d7347994a24027219d212fd64e822cc7.png)
![[Diagram]](../../diagrams/36/03571b06c62e5af3230ba53c26b8d821.png)
![[Diagram]](../../diagrams/50/8145e5f137da764cfdc241fe9f55a7a6.png)
![[Diagram]](../../diagrams/11/91124611ed341c9c886658357021ef9f.png)
![[Diagram]](../../diagrams/21/964ed56803c08a140f54a0f975c6e693.png)
![[Diagram]](../../diagrams/27/a94438db2cb01e112ccb234f97e84da5.png)
![[Diagram]](../../diagrams/20/ebe330e16dc43e292fa718522b373c2b.png)
![[Diagram]](../../diagrams/16/1fcf2573d9b6a066845db99f91d8b18c.png)
![[Diagram]](../../diagrams/9/800e85f7a7623856fd604b8f302ffeb5.png)
![[Diagram]](../../diagrams/44/2d2bd3212617d6c8f8d45238cd44f878.png)
![[Diagram]](../../diagrams/41/5c330fcc9aca1c2a6df1e5131fbe9e9d.png)
![[Diagram]](../../diagrams/33/181a7f0316720aa1d8f276100719b425.png)
![[Diagram]](../../diagrams/18/a2560dae86b62d6535da93bdb1fc86e4.png)
![[Diagram]](../../diagrams/6/d3b0ad765c341559a6ab7f4cb1632da9.png)
![[Diagram]](../../diagrams/16/daddaba890e1245932972ec98ceefafe.png)
![[Diagram]](../../diagrams/12/f13d4955588b788adc7f44752111178c.png)
![[Diagram]](../../diagrams/42/e19e3714bf3b6afa2caf71686af17c88.png)
![[Diagram]](../../diagrams/36/dd16aa60eadcd407844efadb0d5db301.png)
![[Diagram]](../../diagrams/29/67e89b0467a8eb93ffa565a17d261a4b.png)
![[Diagram]](../../diagrams/31/063f94a34fe1a0a388c8aba93e6c8618.png)
![[Diagram]](../../diagrams/26/f2e60828c1d7429de85297eec53571c7.png)
![[Diagram]](../../diagrams/17/66184895b948dc6161b381930505147f.png)
![[Diagram]](../../diagrams/3/5b0ef84f259c49a39d7e523c74df587b.png)
![[Diagram]](../../diagrams/30/ffff47699c8a686918a50bf10efe22c4.png)
![[Diagram]](../../diagrams/29/b4c27da4866f9d5c72293e969f56985a.png)
![[Diagram]](../../diagrams/18/b3180b5503cedbdcbd33fc788d8d27c4.png)
![[Diagram]](../../diagrams/11/b1b3fd6b6d544a27a4a06490413a3a95.png)
![[Diagram]](../../diagrams/37/ba6f9c6b1d19f22ba3d0810c38465689.png)
![[Diagram]](../../diagrams/0/bf5fdb0a0744d40940d74af75a3fa047.png)
![[Diagram]](../../diagrams/51/d9777fd9eb13a322c932c0145c626121.png)
![[Diagram]](../../diagrams/33/f5a60d1fca40b9613150b4398c8106af.png)
![[Diagram]](../../diagrams/3/d4290bbfbf837cb70010975bad99068b.png)
![[Diagram]](../../diagrams/28/79e72940602e382e37b6cfd56a8683be.png)
![[Diagram]](../../diagrams/2/305669adab26385c690ce3605488c5af.png)
![[Diagram]](../../diagrams/33/12bca2a3fbe1ecf9187e55e6a299668e.png)
![[Diagram]](../../diagrams/15/7ef6646662779240c006a6af586509d9.png)
![[Diagram]](../../diagrams/38/d386201b080453a7fc8bca3dac7896a5.png)
![[Diagram]](../../diagrams/34/8086d7886c16227592d8af44d61b3880.png)
![[Diagram]](../../diagrams/22/abb6945366fce234b19ec5c392ef2193.png)
![[Diagram]](../../diagrams/24/46a617cf156dcd07064801f3c5c737a0.png)
![[Diagram]](../../diagrams/16/79af49298249e75774ff58a9d10e7f47.png)
![[Diagram]](../../diagrams/11/97a74b253f30e15f5ae3fe1ceb03d7b9.png)
![[Diagram]](../../diagrams/20/75f0e1b611247a15ad8361a9ac482208.png)
![[Diagram]](../../diagrams/47/ba5291a64620f094405cfd631a2ed037.png)
![[Diagram]](../../diagrams/35/420f962146c5abaa3acdaf1aa543dfa2.png)
![[Diagram]](../../diagrams/52/b3eae48a1d0d2fdd78d2a17a46e811fd.png)
![[Diagram]](../../diagrams/42/0edd48036b048eb84cbcb3e7e44ccbbc.png)
![[Diagram]](../../diagrams/42/90314748d20bc43720e0a26f5080b23e.png)
![[Diagram]](../../diagrams/42/5262bc5685cf8ec6668104f57bc9d227.png)
![[Diagram]](../../diagrams/45/69ea76b1e1d8649cc3021584cbbb2516.png)
![[Diagram]](../../diagrams/24/3745d6c41028092273073069f4af09c0.png)
![[Diagram]](../../diagrams/35/1727ca5ea540906259459a66ef7e28d6.png)
![[Diagram]](../../diagrams/43/0c5f138dd4e3322a3902e479b0bea104.png)
![[Diagram]](../../diagrams/1/cfd70dba85e0b7d2538762025fa47ee5.png)
![[Diagram]](../../diagrams/4/c33ca4c57369d25d782a41c4237af1ac.png)
![[Diagram]](../../diagrams/50/d5a6372a7ef7b36d5eadf57f1c39b8dd.png)
![[Diagram]](../../diagrams/29/bc8e73e0f628950385ef673227c5d996.png)
![[Diagram]](../../diagrams/41/bb23e3d46b68302371eee7d608e8dec4.png)
![[Diagram]](../../diagrams/41/5eeb11395baadf507f67f7c33f332dc9.png)
![[Diagram]](../../diagrams/2/d55831c5482c8dfec9288a1049f8a1b3.png)
![[Diagram]](../../diagrams/51/76371a20f6d003d1c8ad31250ff3777c.png)
![[Diagram]](../../diagrams/16/3cb762771177394eba8a4e630afb9bf8.png)
![[Diagram]](../../diagrams/37/a13089ece216054068cb6e76c73fda53.png)
![[Diagram]](../../diagrams/35/3a49cfabd7c0839da0e5c7f9db41bb1e.png)
![[Diagram]](../../diagrams/34/28ad0e5b7a207a25da6fcb50ae927557.png)
![[Diagram]](../../diagrams/20/ae472a23fe409415ffc93fb587852d8c.png)
![[Diagram]](../../diagrams/41/9dd881e9939302b8aed659f7dbe70248.png)
![[Diagram]](../../diagrams/26/8eb8b566240e71bc0cc5215594c756d2.png)
![[Diagram]](../../diagrams/0/b4fe51100617562642f71089808efe2b.png)
![[Diagram]](../../diagrams/43/0739dcfd668ccff3b929ccb3438b3fba.png)
![[Diagram]](../../diagrams/2/77a731a566b68b8d59b5d87e1bee0d5d.png)
![[Diagram]](../../diagrams/13/9579246f23a2c87c36755a67b9214cf9.png)
![[Diagram]](../../diagrams/3/6e34a42b6a645c28a42390050c2f15c7.png)
![[Diagram]](../../diagrams/3/d712da37ed203e47d1d4230bb2c4daf8.png)
![[Diagram]](../../diagrams/13/25c7d43f6854e3b588fc1063b5d9ec78.png)
![[Diagram]](../../diagrams/47/21809166eaa48eb3738f8e621efb990a.png)
![[Diagram]](../../diagrams/36/05b1683ee3a928518fd7c0bf004805f0.png)
![[Diagram]](../../diagrams/18/02bc4c9954c8965d3e2ee3376cc12654.png)
![[Diagram]](../../diagrams/27/f4ba3aa288964362259012a2019b1617.png)
![[Diagram]](../../diagrams/20/aaecac46062aa1b828133cd15cbc7eff.png)
![[Diagram]](../../diagrams/4/671f7131f33058e54ca75a4acb1a5193.png)
![[Diagram]](../../diagrams/2/973b314ccff4c37fddaf74643c8f7594.png)
![[Diagram]](../../diagrams/21/bc03252db627978ba35db51320546bde.png)
![[Diagram]](../../diagrams/3/aeb2c64b64551ffa810509e493ff5cff.png)
![[Diagram]](../../diagrams/22/007f2413ea67b6b525c797a6adf54630.png)
![[Diagram]](../../diagrams/39/b126ad3069be188df651ae9e9f28235f.png)
![[Diagram]](../../diagrams/49/8111e881888874cde1693ac7e41f4a98.png)
![[Diagram]](../../diagrams/16/11f5595cc0217e590c7c73d17217e360.png)
![[Diagram]](../../diagrams/51/8ac9a1003c9482b6e3cab45b1acb9af0.png)
![[Diagram]](../../diagrams/14/213c34c899b0a743900656cccdb4ad27.png)
![[Diagram]](../../diagrams/12/5ee0f51f93e7de714f8462e134d7be05.png)
![[Diagram]](../../diagrams/0/f87479387978f808af9490c598957c61.png)
![[Diagram]](../../diagrams/22/a8d1d3258030ed52c6758e1c7bbe1830.png)
![[Diagram]](../../diagrams/5/600ff9d14c6de06a2d7a7353e011d41c.png)
![[Diagram]](../../diagrams/22/99d6bd3e91e111e98a477cfca3434844.png)
![[Diagram]](../../diagrams/8/44a3f0467ef8e8dd015f692f007ff649.png)
![[Diagram]](../../diagrams/24/7b0bf5ce8d4f8b3c17e7ec39abc66ff8.png)
![[Diagram]](../../diagrams/1/c72c17326a683adb829f249882316e03.png)
![[Diagram]](../../diagrams/43/29443888dd9aca473aa455ca40615dfd.png)
![[Diagram]](../../diagrams/39/2eaa95b3af6313141d7f69688b577160.png)
![[Diagram]](../../diagrams/32/e59f11d48e4f155dbcbc0bef1ed6686b.png)
![[Diagram]](../../diagrams/10/e4ef1c55655ca12243834d923e2c6b42.png)
![[Diagram]](../../diagrams/25/a9ddca1226ca5732ccb6fd25e4ec460b.png)
![[Diagram]](../../diagrams/24/2f0a169d835cd68de45126f79d75b16a.png)
![[Diagram]](../../diagrams/48/b0dc48e4ae9c5d1e145843f1e1c3aa2d.png)
![[Diagram]](../../diagrams/5/f38909bdda371756c6bf4db450cf5972.png)
![[Diagram]](../../diagrams/16/d6a5f4a75d83bcc92fbceacadbd49d7b.png)
![[Diagram]](../../diagrams/52/7be84c0006d7014e485689f53e1be9de.png)
![[Diagram]](../../diagrams/35/dfa1c2557a171c4356150b931f01a072.png)
![[Diagram]](../../diagrams/28/2432deedb04ed6b006ddb455a1a7b133.png)
![[Diagram]](../../diagrams/36/3204d02cdc1bb4a0ecadcb11b1417268.png)
![[Diagram]](../../diagrams/11/660c6b069e3589be34965cb7242241ec.png)
![[Diagram]](../../diagrams/22/4821233075c282bbd5dbaadfbf05974e.png)
![[Diagram]](../../diagrams/4/271111c38f9c0d51db6847c65c663130.png)
![[Diagram]](../../diagrams/31/5640e53fbfb592898bd427a75782998b.png)
![[Diagram]](../../diagrams/34/5c969deb407c504502d96f38b3b8f122.png)
![[Diagram]](../../diagrams/9/aea918a6c6907a1e0ff4d091f782c8fb.png)
![[Diagram]](../../diagrams/52/2a6d47fc22b794b3274c13d2742e49a4.png)
![[Diagram]](../../diagrams/13/52b958d3940f08cc1ce4bdcf5a262401.png)
![[Diagram]](../../diagrams/7/5ee93d82cbf943a301a69d1bb3920556.png)
![[Diagram]](../../diagrams/34/ad59acb9392e9b814be26888c71b78e0.png)
![[Diagram]](../../diagrams/43/43cf77f89912973bbc8e6606e5a6e08a.png)
![[Diagram]](../../diagrams/40/fa14f821a5d0e4e6ffd23fbbc58720b0.png)
![[Diagram]](../../diagrams/35/3a94c68be2fe325b5381c63a00227dfb.png)
![[Diagram]](../../diagrams/24/8b5df6b9ade6dd2f2fac74547d62d3db.png)
![[Diagram]](../../diagrams/49/5902f4d53c6b95667b40175dc6d78de8.png)
![[Diagram]](../../diagrams/49/6fca37cd7eab000811263187b9fcae5f.png)
![[Diagram]](../../diagrams/12/6e6ec7a53d7277485b355262b1954e6f.png)
![[Diagram]](../../diagrams/15/8dad8fa735ed9d6f33f8dac40ed4a417.png)
![[Diagram]](../../diagrams/25/a113e2b1c3d8d2dc94147f209926bfab.png)
![[Diagram]](../../diagrams/25/d9910681ab61eedd4dcbbe9cfee4f39a.png)
![[Diagram]](../../diagrams/24/0ee2e22672aaefc34d4ae659d2954e94.png)
![[Diagram]](../../diagrams/30/8f8b28f463829aa3b4bce6ca099826fb.png)
![[Diagram]](../../diagrams/19/fdfe70dc5b9e4490afcfc34f151bdf9e.png)
![[Diagram]](../../diagrams/7/24303521821891fc268bb736847dedfb.png)
![[Diagram]](../../diagrams/13/8a3c7f3c4d5f5d5b8a8977fa09102e00.png)
![[Diagram]](../../diagrams/50/d78d7f66e49ecc09caf2d41d71cc72de.png)
![[Diagram]](../../diagrams/25/42157cf91db389214a57b07b48ea5fba.png)
![[Diagram]](../../diagrams/34/ff0c6366f630805d4a31c0717421b0c9.png)
![[Diagram]](../../diagrams/52/8d2ebbae252e91c9335ec637ab1919d6.png)
![[Diagram]](../../diagrams/49/4cf59902329d763933427547aff45dbd.png)
![[Diagram]](../../diagrams/32/42fd3de4c8786428feadc7e6b7d9af60.png)
![[Diagram]](../../diagrams/46/8f1016c734f8ab9b1a2b3dd348375c90.png)
![[Diagram]](../../diagrams/29/d976c9833cabe5977f05f85aaceeda8b.png)
![[Diagram]](../../diagrams/30/357f9b25edb3cb67ebc533bf21a1ce21.png)
![[Diagram]](../../diagrams/42/5e1b7b42b99b2e5bacbb6ee139fdebeb.png)
![[Diagram]](../../diagrams/6/b389675c1823a192b01b59b68ebb29bc.png)
![[Diagram]](../../diagrams/21/2c0961d4472a993ba53d955a4e3aaa46.png)
![[Diagram]](../../diagrams/4/4b90db816c4f840388bb8678e25c88db.png)
![[Diagram]](../../diagrams/19/237d977b8f3a243893b162af975a5f67.png)
![[Diagram]](../../diagrams/36/b66ea9e4e98d4e8d0b096c8688237927.png)
![[Diagram]](../../diagrams/22/19d2a0b781c7ffb91156fd02a17125c1.png)
![[Diagram]](../../diagrams/50/073fa28d4e8a04575cada3a88d8171cb.png)
![[Diagram]](../../diagrams/44/c44a36812631f9536ab32f352127369b.png)
![[Diagram]](../../diagrams/12/290aca37f736ac0e1eae4e43958c770b.png)
![[Diagram]](../../diagrams/49/d4796519fcded8a45694bc1761c97100.png)
![[Diagram]](../../diagrams/0/0b7e824afd29049204922a456baf9746.png)
![[Diagram]](../../diagrams/5/99beb86bfcccf15b43fa60843413ecfd.png)
![[Diagram]](../../diagrams/30/631953d4e5c1c1657bca2377e3b552da.png)
![[Diagram]](../../diagrams/3/05c6d29d5c7d8de25c8245dffc7dc980.png)
![[Diagram]](../../diagrams/37/eef4a0a383206dc6b9aefedb2ad98e6e.png)
![[Diagram]](../../diagrams/38/b05ce29e2a01a42ce54e5abcb145507d.png)
![[Diagram]](../../diagrams/41/6c9a169497d3a0bf075799c7fee5ed8c.png)
![[Diagram]](../../diagrams/39/80b5bfa983ebaa85794c6e46e879d163.png)
![[Diagram]](../../diagrams/10/410482df3ca6c0eaa766e1e381f1bbed.png)
![[Diagram]](../../diagrams/45/964290db3a4578f724363cc24d942e14.png)
![[Diagram]](../../diagrams/10/de8741f6374c4f71e9ea1570730906e4.png)
![[Diagram]](../../diagrams/7/eeb0f1ca940a89399e7ad364f7f9382c.png)
![[Diagram]](../../diagrams/22/298a35e509325b875eacdb773934d679.png)
![[Diagram]](../../diagrams/26/8ce62e6c887121bb9d07348887663e73.png)
![[Diagram]](../../diagrams/6/f01b1b58b696d6ef9c9745cd284019e6.png)
![[Diagram]](../../diagrams/14/8c788a376e8e8de03d8ce202fc128a08.png)
![[Diagram]](../../diagrams/24/f8577f9121bfd2f5014cb83dfbc5667e.png)
![[Diagram]](../../diagrams/18/cb329b5dd7fb57d43f7fa108bba7fa3d.png)
![[Diagram]](../../diagrams/16/2cf3cd096425891bb4fe5e9f5e75993c.png)
![[Diagram]](../../diagrams/10/a7224a21031d371c5b507153db786772.png)
![[Diagram]](../../diagrams/3/bd5f1bd9184cdd284133eb0e23a9759c.png)
![[Diagram]](../../diagrams/52/8f4e0479df7fb70744aff07c3201384f.png)
![[Diagram]](../../diagrams/4/e4f14a9ad08b435926462f8f9e7b82ff.png)
![[Diagram]](../../diagrams/28/6f681ddcbdddb76b91e68bbc5a8984bb.png)
![[Diagram]](../../diagrams/37/ad83acbf268b26abfd9bd1188b743724.png)
![[Diagram]](../../diagrams/33/9f31579cc9c75391e9b7b3ec121f9e2e.png)
![[Diagram]](../../diagrams/10/6a16af2a4e6f1b06d03fb48d8bee6426.png)
![[Diagram]](../../diagrams/27/2597b3cef8faa26cd7dc71aec10b91b3.png)
![[Diagram]](../../diagrams/4/d2ee06e4984776ce75bc912d2bf4f729.png)
![[Diagram]](../../diagrams/23/f8989867785f7d161d30f6ba896dd663.png)
![[Diagram]](../../diagrams/15/dcd9f8e4c68eb24725d81f0bd0a4f228.png)
![[Diagram]](../../diagrams/47/5950543dc584f108c99214a242a3117e.png)
![[Diagram]](../../diagrams/1/8629dcfad604250595243fb28c010ccf.png)
![[Diagram]](../../diagrams/34/382dfb83122633163c475b815a6510bc.png)
![[Diagram]](../../diagrams/5/510b6ecee896bd4c196a7ef81014aa13.png)
![[Diagram]](../../diagrams/52/08516854f4f58d0244c517f233ed8a8e.png)
![[Diagram]](../../diagrams/36/d96f43afe061530f625c37cd262a4ae2.png)
![[Diagram]](../../diagrams/15/193e1af0806eb4383f8859df576ab00f.png)
![[Diagram]](../../diagrams/35/2adc8cadee44e8e56762198ebefe4473.png)
![[Diagram]](../../diagrams/5/c1acee3e54f8834a27ae6be108f91275.png)
![[Diagram]](../../diagrams/16/30ac48c3c819933d899c882bcb7cccb4.png)
![[Diagram]](../../diagrams/13/ed8b8b593f00fd966bc0033b1ea29562.png)
![[Diagram]](../../diagrams/49/38573a72c4cefbd453256b6875ad0e9d.png)
![[Diagram]](../../diagrams/10/8c9d2af02127127b8be2f4d4c859bfa0.png)
![[Diagram]](../../diagrams/35/ea73becd94a45645de26c91d27af6af0.png)
![[Diagram]](../../diagrams/18/e7e1bdbda559ca7aa34069a1681aa70d.png)
![[Diagram]](../../diagrams/31/569d9763f8d74fa785614eea5aa5351c.png)
![[Diagram]](../../diagrams/13/c338c86e5e0c2094091dd6eccff2cd1b.png)
![[Diagram]](../../diagrams/25/ee18323442f0927021e24ccb2a16ba73.png)
![[Diagram]](../../diagrams/15/d912f69a0f50c73efac3d3b7bcc49722.png)
![[Diagram]](../../diagrams/27/750f4128e51c051419ef98e23adbcb47.png)
![[Diagram]](../../diagrams/26/8ee5c48fb92043f7d0b7a0fc726b5f65.png)
![[Diagram]](../../diagrams/5/386bfde5ba6c1dda5fc44336c5e43e72.png)
![[Diagram]](../../diagrams/16/a45d19d2f0c810a07ab666848d46c0d7.png)
![[Diagram]](../../diagrams/45/0b989eb9a0a3556b3f3836bfd933c7cb.png)
![[Diagram]](../../diagrams/21/f4057b6775f3c8119683549a2e3020b9.png)
![[Diagram]](../../diagrams/31/2cfa620b24565e5a927c2a1e13334f30.png)
![[Diagram]](../../diagrams/17/f672a336eeda9ddf60a29593ed893a38.png)
![[Diagram]](../../diagrams/47/6c8ae9ce4f67242437b4325aec2a86d0.png)
![[Diagram]](../../diagrams/48/156fbee2cdda818a0436553213b35223.png)
![[Diagram]](../../diagrams/24/e1d978f09312fc509ca542095366a2f4.png)
![[Diagram]](../../diagrams/8/224a1057580faefcb544031858513706.png)
![[Diagram]](../../diagrams/8/0c0304ba45d6cc05292ccb84fbd0a8dd.png)
![[Diagram]](../../diagrams/0/259423214f57eea1004869f7bc42c692.png)
![[Diagram]](../../diagrams/46/46782de7f04103d1ae981a53ca3b5209.png)
![[Diagram]](../../diagrams/4/7ae65d014b11443fe93352cfdf6d0af7.png)
![[Diagram]](../../diagrams/46/bf02c80f1fe962f47d5bdb7fdd486ca3.png)
![[Diagram]](../../diagrams/19/ca0bf0c2d7c4803b84214be337638feb.png)
![[Diagram]](../../diagrams/4/c8eafefd7762ea056fb8aa585fb72b9c.png)
![[Diagram]](../../diagrams/1/ff8f1ceabf4158c64b80c7226c4cf056.png)
![[Diagram]](../../diagrams/25/051f48d56c8781140c5c24a6032d0255.png)
![[Diagram]](../../diagrams/36/b5117e8a47673f22dfd43c7095da6233.png)
![[Diagram]](../../diagrams/7/e34765f8e67e719f6108db4bb05ee60b.png)
![[Diagram]](../../diagrams/20/d2ac6c685eb380a6b4461ed86458fe5a.png)
![[Diagram]](../../diagrams/45/dd9e848e0b77a7787bdc4ebdcec0a252.png)
![[Diagram]](../../diagrams/27/bd6eee6f901dceac6a429ef8aaa79132.png)
![[Diagram]](../../diagrams/27/3c6fab0698228a76951539b09fee581f.png)
![[Diagram]](../../diagrams/10/6a75f77f3bfdc1b65e28454fe972ce9e.png)
![[Diagram]](../../diagrams/16/f751bc1c31cb7bc4ec39a0182047c8de.png)
![[Diagram]](../../diagrams/52/35c30577e574a143a0f18553f8579661.png)
![[Diagram]](../../diagrams/7/e290e79b05722a575ec91a8670db3348.png)
![[Diagram]](../../diagrams/25/8544815c62d81ce23d177bb45b6fd6aa.png)
![[Diagram]](../../diagrams/34/83ce84bc8f9be8ccb861ac3fd5577d33.png)
![[Diagram]](../../diagrams/20/b3248ad201d73f0c2cdccef257283363.png)
![[Diagram]](../../diagrams/35/117e132b2c46e66a329ab3cd7e0bb469.png)
![[Diagram]](../../diagrams/34/98b7ce5e5381da5211b58cd4b12d87b2.png)
![[Diagram]](../../diagrams/9/f4858ff6f5d0289173f2d1b77be73fcc.png)
![[Diagram]](../../diagrams/6/7c3d14a0a1c0c925fc0c1e879fca7f5f.png)
![[Diagram]](../../diagrams/13/65c1eb42d85e54f60c40544243089c23.png)
![[Diagram]](../../diagrams/51/da831e15e6e5b9b1281683b7e96184fb.png)
![[Diagram]](../../diagrams/10/83211f364b437d80dcb339aadf12a5d9.png)
![[Diagram]](../../diagrams/10/a67046c0760f45d77e6ab9accb1f137b.png)
![[Diagram]](../../diagrams/46/e0aee3e5ce05b6c7d5ec8e9a698c1ee4.png)
![[Diagram]](../../diagrams/50/2694064e9a674cc03c4e3cc7d2930549.png)
![[Diagram]](../../diagrams/41/24be8d64b5a544b00c942f2b28a27b9a.png)
![[Diagram]](../../diagrams/50/31ed50bfb317acdc0e24367d2a90194a.png)
![[Diagram]](../../diagrams/20/8c88a6643f697301bcfa363547f1986e.png)
![[Diagram]](../../diagrams/47/f35e9f4acc8c601b6b726c412ac1326f.png)
![[Diagram]](../../diagrams/6/ed49c9797713e83ed906e4b096952a9d.png)
![[Diagram]](../../diagrams/47/1b8e55e3049dfb38c8e3f2b3dbe7f880.png)
![[Diagram]](../../diagrams/37/1968ffe39e270ff7e59254c63a84758e.png)
![[Diagram]](../../diagrams/11/4d7b63adff89291811eb67307eaa79c1.png)
![[Diagram]](../../diagrams/36/164c51ff560ce522d00b60d8f2b922ba.png)
![[Diagram]](../../diagrams/2/8c88da4c5bb4ac858328b6cea70fc8f9.png)
![[Diagram]](../../diagrams/9/d97d18afb831e52849f4fc5a34d8be81.png)
![[Diagram]](../../diagrams/43/59583f2a31335dc955873f09e52d896c.png)
![[Diagram]](../../diagrams/11/74f4652e1fdaddb6f1ec8a8f48fef00d.png)
![[Diagram]](../../diagrams/26/dbb6b6d39622c5cb6bba1fac5e961e92.png)
![[Diagram]](../../diagrams/48/e2d7226bd217e589c79fb5e9b1f52dc2.png)
![[Diagram]](../../diagrams/23/054ba029a47ea41138f513c21aff572e.png)
![[Diagram]](../../diagrams/18/1f868b995cd69fe85c4d7a48cabcb74b.png)
![[Diagram]](../../diagrams/35/2f7694ce099b6ec28d6a3770ddecb530.png)
![[Diagram]](../../diagrams/42/c34c359d89ecfd04b217be88b9859b04.png)
![[Diagram]](../../diagrams/15/2b4261a2db592251a11d1177a88570e2.png)
![[Diagram]](../../diagrams/50/9f9ca0c9b6a79ecaf393abfc23d1acd3.png)
![[Diagram]](../../diagrams/36/4673ffae68527289f294ab29aaaa7111.png)
![[Diagram]](../../diagrams/8/7b1a5add53b4587d58bc38e95402f7f8.png)
![[Diagram]](../../diagrams/42/8fc392824fca86dbb427fac57edb5e39.png)
![[Diagram]](../../diagrams/38/5d1a1cb7aec1c7a4ea26cb8bd42f5f53.png)
![[Diagram]](../../diagrams/49/4338d290766d1005eddbef6967957166.png)
![[Diagram]](../../diagrams/0/69ec5a1547174de129ebbd163a7c8835.png)
![[Diagram]](../../diagrams/48/1c697da3aa41b47033d1cc8dbad6a7df.png)
![[Diagram]](../../diagrams/9/b8a1f85b3a8684b905314cbf437104d6.png)
![[Diagram]](../../diagrams/24/0d9599da6ac605736a58e3fcb9cfb25f.png)
![[Diagram]](../../diagrams/42/b002b1fb3f85c7126270afff1876df73.png)
![[Diagram]](../../diagrams/3/1f5533117eb69a22f1d91765979aee3d.png)
![[Diagram]](../../diagrams/35/c4a470c9d37c129fec444ff9d7a45940.png)
![[Diagram]](../../diagrams/50/21fced561e0b4579338cd13e1322bec7.png)
![[Diagram]](../../diagrams/19/c8a4e2ded206dc514ba2cfc3e8920ad2.png)
![[Diagram]](../../diagrams/48/291e92315b05fd3a4a6b550b32746032.png)
![[Diagram]](../../diagrams/52/fbe89bf31984605af7861618ac3641c8.png)
![[Diagram]](../../diagrams/29/e7ea5e597a83ebab3d3103032d554f48.png)
![[Diagram]](../../diagrams/46/11128de70c999297bf6c6b6a9961fd66.png)
![[Diagram]](../../diagrams/47/ff97877c987cde577a55b1596d31fca7.png)
![[Diagram]](../../diagrams/9/825b84db7e7943fea35fae0f24d44e15.png)
![[Diagram]](../../diagrams/38/d522c11ad4cbdf23d63357f4284dd9a1.png)
![[Diagram]](../../diagrams/0/412f300553c68bbcc0ee3c23a85c8efb.png)
![[Diagram]](../../diagrams/38/2631730d78a65170bcdcf894a0f3838d.png)
![[Diagram]](../../diagrams/13/948ad12c7eacbe3e839bed3472c6a161.png)
![[Diagram]](../../diagrams/52/5ab0f36299ac8ac3e2d2d6741ceed783.png)
![[Diagram]](../../diagrams/40/0313a46886fa660bbb450a07a1783b34.png)
![[Diagram]](../../diagrams/28/1cb0a7b94de050d70d173bc98f7f1fc2.png)
![[Diagram]](../../diagrams/25/4ad41d860ff4943923470523bd0ad456.png)
![[Diagram]](../../diagrams/51/bf75289bdc7d4d62c74b739d634e4f63.png)
![[Diagram]](../../diagrams/51/6e89a43b1e52e48ce9f0b29d4214b78c.png)
![[Diagram]](../../diagrams/6/135ad4ecb48a1d2221a1b95f53201443.png)
![[Diagram]](../../diagrams/52/e3ffba5f76bf2b113116fb63cb883c09.png)
![[Diagram]](../../diagrams/19/b7cfe8f6a1f2bdb1ae688fd3053a5962.png)
![[Diagram]](../../diagrams/51/b90bc6581ea8fa4e9b395e677a6702d7.png)
![[Diagram]](../../diagrams/15/d1cd92d24c93892a252777d9b9c37adc.png)
![[Diagram]](../../diagrams/52/b7835ea64485c44f9e0846024aa899d7.png)
![[Diagram]](../../diagrams/19/b6246a0859915649fc3211b0361ff597.png)
![[Diagram]](../../diagrams/46/d0d1306756c1858be940273ecd5c5418.png)
![[Diagram]](../../diagrams/19/6920e1cce9b02cd8255beb55dabd0169.png)
![[Diagram]](../../diagrams/9/0fca1188c4472aa06796227a59aa27ae.png)
![[Diagram]](../../diagrams/42/ff3da7bea7aef8f437f394e90f3f86c6.png)
![[Diagram]](../../diagrams/37/e876c6f34a1493795b02f0da2b45cee0.png)
![[Diagram]](../../diagrams/34/7d2113d28dfe3cdacac70856866117fa.png)
![[Diagram]](../../diagrams/0/acce7f3a1dffc01c7d184d6122340cc8.png)
![[Diagram]](../../diagrams/39/2d6100a60d18db3daed71b64c9695067.png)
![[Diagram]](../../diagrams/14/c7c3651256ac1a0a9c507126694c87f6.png)
![[Diagram]](../../diagrams/0/7b73e71dbee0672706c7e1bb4818b4d3.png)
![[Diagram]](../../diagrams/52/7a9a1bd0dca5cbd7d7e64836bf874f75.png)
![[Diagram]](../../diagrams/5/ba68733d393f51fe22d1c29a9bf2fec7.png)
![[Diagram]](../../diagrams/31/2e87eba3c04281508eff9b76aebc2665.png)
![[Diagram]](../../diagrams/47/b057c4499e25d365af523e502af43158.png)
![[Diagram]](../../diagrams/19/d4c5456772a74988bffa8e2b6b313e97.png)
![[Diagram]](../../diagrams/38/b4aa6f65702bca27de6ec899885b2929.png)
![[Diagram]](../../diagrams/1/e53348d0ce1cddbcef85f06abbcc465f.png)
![[Diagram]](../../diagrams/40/f68bb138a724ef945512f940988242cb.png)
![[Diagram]](../../diagrams/8/a962c12c863640859359b63a3528c5aa.png)
![[Diagram]](../../diagrams/20/ea851cf6c082a590c8cf7e3b09a306a5.png)
![[Diagram]](../../diagrams/5/12067bf1d9daf5eb1a10d48200518689.png)
![[Diagram]](../../diagrams/4/f017353f9be6320e439f9279f844926a.png)
![[Diagram]](../../diagrams/20/7029eb8151634328d8c2b4a077cce092.png)
![[Diagram]](../../diagrams/28/b4038a2edbdc7dfc62491d075e317732.png)
![[Diagram]](../../diagrams/15/b2dc9f8953f8b514c29e23e2bccba837.png)
![[Diagram]](../../diagrams/1/d6023f0470ed7f615e538f96b97a6173.png)
![[Diagram]](../../diagrams/7/b0bb7bdb9c3478acea094d11cdcb0aa6.png)
![[Diagram]](../../diagrams/20/6b4dbafda97296c18eeb4e6b892fdd98.png)
![[Diagram]](../../diagrams/14/753d1b2652e210e09bca35db18f9b319.png)
![[Diagram]](../../diagrams/28/c5763233ce6b5438ef5c46aaba6879bb.png)
![[Diagram]](../../diagrams/42/c79f18963a065722d7788714e0977fba.png)
![[Diagram]](../../diagrams/20/fb0a162bba2abaaba7ebb3e77593ef59.png)
![[Diagram]](../../diagrams/13/62e08e33e1147b21809249dc53233bb7.png)
![[Diagram]](../../diagrams/2/e56c5c10faed44c4c9347d1d2ddc4fcf.png)
![[Diagram]](../../diagrams/45/f788bcafd71f2243ee5758da252acd33.png)
![[Diagram]](../../diagrams/40/bc2da75796d2874a89bfc6a519d535bf.png)
![[Diagram]](../../diagrams/52/57397daf60499779e074be4cced8ea83.png)
![[Diagram]](../../diagrams/35/3fb951ffaafb8fb71a2a3899ccd4c4b5.png)
![[Diagram]](../../diagrams/18/3e9190b3003cb177d752b19aef99c3d3.png)
![[Diagram]](../../diagrams/42/19e972512651b87cbe0793a994d01995.png)
![[Diagram]](../../diagrams/11/dd4756d4d763b65b29595812b1ec7217.png)
![[Diagram]](../../diagrams/25/12159ae92697035b8fa1354b2760b6e0.png)
![[Diagram]](../../diagrams/42/08566f8e39b264f01f9287f82ef64a22.png)
![[Diagram]](../../diagrams/18/bae3b6485fa4aad60d4f2ab9eda3064c.png)
![[Diagram]](../../diagrams/5/9bb19f2f4f016dfdba21c8de272771de.png)
![[Diagram]](../../diagrams/24/5e7fddc783bbaadf01e0e320d7d9bc1e.png)
![[Diagram]](../../diagrams/0/ae7d8545493c1c372537d66b3d27231d.png)
![[Diagram]](../../diagrams/20/febdb80f7333270e266e31167ad97743.png)
![[Diagram]](../../diagrams/13/ae0618cfd96c93a309a9ce12515c6b7c.png)
![[Diagram]](../../diagrams/13/624415224727905734c5a4d2bd863f28.png)
![[Diagram]](../../diagrams/22/99c0bacbca3a8f6e06034cd984665f64.png)
![[Diagram]](../../diagrams/3/02cb78e214f386c26483d9c2934825b6.png)
![[Diagram]](../../diagrams/10/4ad525668c5993b0b3e6891344bcbfe9.png)
![[Diagram]](../../diagrams/13/b5f0ff66c8ffb7750db8ce544145a072.png)
![[Diagram]](../../diagrams/41/82a79c6fff74fb01e4d3ee574414a2f9.png)
![[Diagram]](../../diagrams/10/2859b7b8382eafaa1973889b992419bc.png)
![[Diagram]](../../diagrams/52/f42ee594143a59c13e4d8bf660a9d803.png)
![[Diagram]](../../diagrams/49/0bcf9756a7d857b05f5e026d76e962c9.png)
![[Diagram]](../../diagrams/10/c43ec8e925528243cd9ea94dd9d9c356.png)
![[Diagram]](../../diagrams/11/32a0a15145e2e6dab2fb60d870d8fb99.png)
![[Diagram]](../../diagrams/19/5aee7d13ce25fbf88e637ab99ccb5045.png)
![[Diagram]](../../diagrams/23/b99e8fb162b3ada82c288e5d9c1da661.png)
![[Diagram]](../../diagrams/11/053f04c6d4d2243394b1974dcc7bf616.png)
![[Diagram]](../../diagrams/8/54cd53ae1b89943ca1c9ca639e4bdda3.png)
![[Diagram]](../../diagrams/0/e2652691ac68dab93d13325bad8646a2.png)
![[Diagram]](../../diagrams/49/3a4de1e1cfe7066bcc4fef583526084c.png)
![[Diagram]](../../diagrams/2/9f9e8cea3e1b33721db6a45d43af8da9.png)
![[Diagram]](../../diagrams/9/6d853ff9035aece146ca9cad3f052490.png)
![[Diagram]](../../diagrams/10/87701259725d396efaefedccc67973a1.png)
![[Diagram]](../../diagrams/52/b1e84b53ed363a4472af0ae8e7615e9b.png)
![[Diagram]](../../diagrams/43/0d6f7ea1ad577b0292dbd157bf269a47.png)
![[Diagram]](../../diagrams/49/b193a36ebdc3c2de3065582548dd9e1c.png)
![[Diagram]](../../diagrams/5/12ab29effb4df6ba1c2ec9dca30db59d.png)
![[Diagram]](../../diagrams/41/14070c98d20ac6393534977867192608.png)
![[Diagram]](../../diagrams/31/8f19fafff5ba715e10951860029a73f4.png)
![[Diagram]](../../diagrams/34/5e92deba4f258b0917818e3883b11b71.png)
![[Diagram]](../../diagrams/26/2f0e68e3a467cbb3fc573e3c04324bc1.png)
![[Diagram]](../../diagrams/20/0abdec226dad9082d7b6d15a1f645a8a.png)
![[Diagram]](../../diagrams/1/c04f0ad1b1bc3276736d3685d8772493.png)
![[Diagram]](../../diagrams/52/e801e07d539936994fc9e81370428c25.png)
![[Diagram]](../../diagrams/21/510bd4bdc9790d31e90f63e9729185c8.png)
![[Diagram]](../../diagrams/41/539f1a8260e986f3264ac24b92290e79.png)
![[Diagram]](../../diagrams/52/44da12efa831d20c7e4b94d98e546371.png)
![[Diagram]](../../diagrams/9/fbb61a07a809ae88aa91442c582534e0.png)
![[Diagram]](../../diagrams/11/1866b184a420acf40dbe68a5f47cd7d2.png)
![[Diagram]](../../diagrams/29/4746d592bf7790d326bb6353d6a169b5.png)
![[Diagram]](../../diagrams/12/067aca401bee1e07d2e444a0574a52e5.png)
![[Diagram]](../../diagrams/10/112f5d612fb2fe23d621e0b707345cb4.png)
![[Diagram]](../../diagrams/11/b182062c3ea064fd7f97f010dc39c798.png)
![[Diagram]](../../diagrams/28/a5cbcd01dfc812e7acb6b99ba4e834f5.png)
![[Diagram]](../../diagrams/45/196425eded312e041d32c3d6882acdaf.png)
![[Diagram]](../../diagrams/17/57f126b80ca5e249a2e86f6ec31da344.png)
![[Diagram]](../../diagrams/16/2b8045b17cd9c9ccaf8ec734570f1670.png)
![[Diagram]](../../diagrams/12/201e168c32a158f17bd5ba1beb1f4c5b.png)
![[Diagram]](../../diagrams/35/4b1551cb1f68a38f0b45f7991b4da97b.png)
![[Diagram]](../../diagrams/7/18352d0aa1eedc5c459da199d249c2c7.png)
![[Diagram]](../../diagrams/27/36048a63d07f7639e108fa9fe944b1c7.png)
![[Diagram]](../../diagrams/16/b18b5fb4c1672b7266f151a4e5dfc28b.png)
![[Diagram]](../../diagrams/24/b077885f880384be3a8cc6d22bec659a.png)
![[Diagram]](../../diagrams/46/600c2a3f8ad8ae4d33599593dee60c7b.png)
![[Diagram]](../../diagrams/15/78541900b1fe376aebed3424a991e8af.png)
![[Diagram]](../../diagrams/27/7d8d53724bfc2cbd82ee158875c27a59.png)
![[Diagram]](../../diagrams/5/06fc21e84b5d24b20bebf12c20d93291.png)
![[Diagram]](../../diagrams/41/9b9236ea3aba2833bcba848050767f1a.png)
![[Diagram]](../../diagrams/48/f157b8b3c0aa7870b8b2dcdc19f16917.png)
![[Diagram]](../../diagrams/19/3a74806dd89b10e52fed52c3cf51932c.png)
![[Diagram]](../../diagrams/46/7635babef43e825b0fa3cad21aba8330.png)
![[Diagram]](../../diagrams/23/129193bf30b34167c48216faaaf3c16b.png)
![[Diagram]](../../diagrams/3/a387024ff2d860a2b37134e62b893a29.png)
![[Diagram]](../../diagrams/40/3f174b75c8e5fd48c3240e1a7f312911.png)
![[Diagram]](../../diagrams/1/1656ccc3a6fd33bf3932dd1d483ce9ec.png)
![[Diagram]](../../diagrams/47/33fd26ab10b9a73881e7d7bd58172362.png)
![[Diagram]](../../diagrams/29/a76ace8421049c4ed0cd83006e631f37.png)
![[Diagram]](../../diagrams/41/24f08e3bdff7c9affe20dd83f5cd1c6c.png)
![[Diagram]](../../diagrams/50/0550c2863e22da1bc84368befce411c4.png)
![[Diagram]](../../diagrams/48/c6dc9cee60f4dc6dd7a1fa34031c2b8c.png)
![[Diagram]](../../diagrams/36/26214fb7c239e3b90b480a4972931682.png)
![[Diagram]](../../diagrams/10/ccd28b4b607d5aa029a19d92653f928f.png)
![[Diagram]](../../diagrams/42/f86cb969101e91afdb6456a395549694.png)
![[Diagram]](../../diagrams/22/61ef79ba1375419ba4258147ce90a3cd.png)
![[Diagram]](../../diagrams/29/81e89835125a541323775c3244a4e71f.png)
![[Diagram]](../../diagrams/52/1b6644db7d46222750febd5076f5693c.png)
![[Diagram]](../../diagrams/37/ec9362c5fc51469c40ba0a7b85f30a5f.png)
![[Diagram]](../../diagrams/27/2393a84bf5ccd5474ec608d26a057312.png)
![[Diagram]](../../diagrams/12/3dcc79b383637d1d3545e63c43160ee6.png)
![[Diagram]](../../diagrams/27/74dbdeceab38a7f405c0939a3e97884e.png)
![[Diagram]](../../diagrams/45/ea9d161972e02cfe21e94a0d41931f96.png)
![[Diagram]](../../diagrams/18/99a3a70ee80b379b62c11b8d0585d483.png)
![[Diagram]](../../diagrams/2/6fcab1fa9b4cd14b7448b5aaf637a60c.png)
![[Diagram]](../../diagrams/18/f229ef0a357b6e9f6f31eb8f7203bde6.png)
![[Diagram]](../../diagrams/6/7cc02f19cb0bb60e4d8c42092cd8c2a1.png)
![[Diagram]](../../diagrams/3/5a5e80baa2df1498f9a3392d7e16f217.png)
![[Diagram]](../../diagrams/27/c178dae6550c9b266d744365314f5b95.png)
![[Diagram]](../../diagrams/1/c9f062398b7abe0776aa2678173f6e7e.png)
![[Diagram]](../../diagrams/23/c94f2a8ba85d55f21bd9ae7ee755b9e3.png)
![[Diagram]](../../diagrams/37/ab05229437e52d134c5946cda67d7c52.png)
![[Diagram]](../../diagrams/2/15b64d7914e0a990f483e01c61eb26a3.png)
![[Diagram]](../../diagrams/21/059eaef0909f2b0174310b2a20c65e98.png)
![[Diagram]](../../diagrams/36/b945881736ae3e5961b0f5ca38ef4c50.png)
![[Diagram]](../../diagrams/0/e3333981628db667b386669053954303.png)
![[Diagram]](../../diagrams/22/0ae7f0407e7a5fb9e5c32df4b74968e3.png)
![[Diagram]](../../diagrams/34/c93b646ee8ccd53273b8e2f175f39cfa.png)
![[Diagram]](../../diagrams/27/25d448c38647e5dbda4048e3054d8b4f.png)
![[Diagram]](../../diagrams/30/b97ebf78081ad348b370425c04b2e57d.png)
![[Diagram]](../../diagrams/31/0d5b742b686650c221696a9ff9d11445.png)
![[Diagram]](../../diagrams/16/8c1549dad8de5bc7a38adc5533715ec0.png)
![[Diagram]](../../diagrams/10/0434567ad8d076871f0830205b2ed829.png)
![[Diagram]](../../diagrams/19/88ed44bf39306ffc89b9ce5546d747dc.png)
![[Diagram]](../../diagrams/44/58598d6276d8ced8f72b83085780fb7a.png)
![[Diagram]](../../diagrams/31/0f5e403f7609a9c5a23c431015d1f21f.png)
![[Diagram]](../../diagrams/36/65ee1e6f09334da650a4950c6908aca2.png)
![[Diagram]](../../diagrams/3/f43b82677c5a1b20b6b7e5a88c91bc57.png)
![[Diagram]](../../diagrams/47/254670884513e542c76c4349de97322c.png)
![[Diagram]](../../diagrams/39/d60b579f4bd6db3addb2e49c30b5575e.png)
![[Diagram]](../../diagrams/35/a81921c45879353aee3cf5382ba56f3c.png)
![[Diagram]](../../diagrams/5/9337a57f7aa9a5ffd07c269b06833758.png)
![[Diagram]](../../diagrams/27/15cc175eed4acf67620f56811be80417.png)
![[Diagram]](../../diagrams/36/a6cc3cd7094d16374d9c21620df7942a.png)
![[Diagram]](../../diagrams/21/b8bc893b38629e2123f82a9d367f4963.png)
![[Diagram]](../../diagrams/12/ad93d7b20b233d2acd0df4eabb085af7.png)
![[Diagram]](../../diagrams/16/e38a3992086d29816e655d951fe25eae.png)
![[Diagram]](../../diagrams/15/b4c631436120dcb6d2214d207b2be705.png)
![[Diagram]](../../diagrams/32/98a602aa12e92d9701284d6a7c738725.png)
![[Diagram]](../../diagrams/13/bdde2634853808b02e9d3404611d84ff.png)
![[Diagram]](../../diagrams/7/0ca9d383f6d7058030482d384f9badd3.png)
![[Diagram]](../../diagrams/38/5e282c27835028f19cefd04e054ff730.png)
![[Diagram]](../../diagrams/1/7dc0cf57e09ac8c9cdf599a01686d515.png)
![[Diagram]](../../diagrams/8/03467e1e1b6f759f1b2b3417ede32177.png)
![[Diagram]](../../diagrams/12/1a4225cfceb1f08c1f9f1c789248b27e.png)
![[Diagram]](../../diagrams/51/ce215e2dc00e32cb14aa2cd782bf3fdb.png)
![[Diagram]](../../diagrams/13/21001e443183ad3bce7de40bac10fc34.png)
![[Diagram]](../../diagrams/43/405c603cd09e4517d4ce7b2fe8f0a70e.png)
![[Diagram]](../../diagrams/29/150330f2fe22229ee1828ac62c70ebac.png)
![[Diagram]](../../diagrams/28/694ecaec15c526b4da8f995479c2babe.png)
![[Diagram]](../../diagrams/39/e94fdfcc7252850a64506edfecb92233.png)
![[Diagram]](../../diagrams/48/5e88a051f05ae342ab2afb35bc072e3a.png)
![[Diagram]](../../diagrams/31/7d0fc27d496d98096b728758e6ca84fc.png)
![[Diagram]](../../diagrams/33/e3758e08d9d14f40e82997b2aa8b161c.png)
![[Diagram]](../../diagrams/49/09adb8d4b6d2d439b3bacd4038903a14.png)
![[Diagram]](../../diagrams/15/28158fb42a98f27e2a2b79cc63df8e27.png)
![[Diagram]](../../diagrams/39/77b9b46a48e8ffb668c0981755dde343.png)
![[Diagram]](../../diagrams/21/4332e0602ce85b45a9821e4b080a8940.png)
![[Diagram]](../../diagrams/0/0ea29102f2a5fc6e609fd67277091a5d.png)
![[Diagram]](../../diagrams/9/c773b0f935ad73cb4d1fa726bf159ca5.png)
![[Diagram]](../../diagrams/32/4479d06e47f019aff9e3a4e5d2155a6e.png)
![[Diagram]](../../diagrams/19/5a2e9a3ced8a9e0467b8707b5d1d8eb7.png)
![[Diagram]](../../diagrams/0/cfe4c87123ef4f17ae54e8ad11fbae70.png)
![[Diagram]](../../diagrams/28/83ca322e59571a64159df4b1e797e8ed.png)
![[Diagram]](../../diagrams/8/64e2d8ab24631d72eb71bcfbd6de2e87.png)
![[Diagram]](../../diagrams/14/a494474a5605cca013d96fa63fc66ed1.png)
![[Diagram]](../../diagrams/11/8a5f206690681d2a1f3701cc61e8702d.png)
![[Diagram]](../../diagrams/27/89a1173c2314bcf30db03db35b3745a1.png)
![[Diagram]](../../diagrams/30/6c71c58b06327dadf3f464c222fa7623.png)
![[Diagram]](../../diagrams/48/505f54cc56bb1ec25cc3327beb79565c.png)
![[Diagram]](../../diagrams/0/58c8dc8c1893db39df31ade4272f70e6.png)
![[Diagram]](../../diagrams/49/49c9c62dae303d8208fee5a7671b8c78.png)
![[Diagram]](../../diagrams/27/ffe67730071574aecb1a5c98c8c0bdaf.png)
![[Diagram]](../../diagrams/24/cfba144f33663bad0aab4740176f9386.png)
![[Diagram]](../../diagrams/42/318485d6cd88ae73e1b347ffbe8898f2.png)
![[Diagram]](../../diagrams/39/0f1e1416a77e6234fb93e6fa88a751dc.png)
![[Diagram]](../../diagrams/29/1a6553440d4115a81e73f090ed5a51a0.png)
![[Diagram]](../../diagrams/12/75df38f66448dd9a0a5ed1a730cdf5f9.png)
![[Diagram]](../../diagrams/31/ff4e965e65cad058ee2f3596eb8bd15a.png)
![[Diagram]](../../diagrams/25/d38028726729e7744d37616c51360d30.png)
![[Diagram]](../../diagrams/3/dd22f465a3e6ff7f2a75c407b0c3e1af.png)
![[Diagram]](../../diagrams/34/efd22ccf49de7a079e601bc1dd57e959.png)
![[Diagram]](../../diagrams/31/bd5746e24a0eb283eea0ac25e886a85b.png)
![[Diagram]](../../diagrams/22/a015c05d9fcc3fee485b34eecdd1dd4d.png)
![[Diagram]](../../diagrams/11/d6a967e0af9d75c07ad1a71082a05474.png)
![[Diagram]](../../diagrams/6/6c3e451985d54c5b94c7caaf7835c1a2.png)
![[Diagram]](../../diagrams/4/65659b4a647f221d36960ccc1a6e39ce.png)
![[Diagram]](../../diagrams/28/96fc9d8ab04653e5ae72f03f9b3dd6aa.png)
![[Diagram]](../../diagrams/52/2e702ea99ba3bc97b0920eea4e1cfa22.png)
![[Diagram]](../../diagrams/27/c15b44fe9777b860a5c1e459b26d5440.png)
![[Diagram]](../../diagrams/30/0fc31170ffeff4e43f1c0f9ec3d6afbe.png)
![[Diagram]](../../diagrams/21/a2c21f3bad9e9b72336547920298a9ff.png)
![[Diagram]](../../diagrams/14/4bbe01d8642c0bdce3ba73aac83b2355.png)
![[Diagram]](../../diagrams/37/07830c26d7abeba519b5a06168610993.png)
![[Diagram]](../../diagrams/37/998fa59ef86f98e4bd4931571c0a917d.png)
![[Diagram]](../../diagrams/51/708e5cd820e63c33db291f1d049e976f.png)
![[Diagram]](../../diagrams/26/ef2c24685ce268d2442d0b961af56769.png)
![[Diagram]](../../diagrams/27/592258c4e186972b2a7795d2358fea0b.png)
![[Diagram]](../../diagrams/40/4e2b4ce441c6ee1add2df218dd18423f.png)
![[Diagram]](../../diagrams/8/9ff7a050decfed18cdd88788eb3adcc5.png)
![[Diagram]](../../diagrams/18/7b9caf3f51f1c6b012379a5770d09f1a.png)
![[Diagram]](../../diagrams/10/52e90267b30d212c51f7a98f0d5abdc7.png)
![[Diagram]](../../diagrams/28/a3a14f549411d5249aea3a301397f62d.png)
![[Diagram]](../../diagrams/20/e01fd7a4a0a241390b5c5d0362c30413.png)
![[Diagram]](../../diagrams/6/23590b69520f5deae4dae9132f0fc3f5.png)
![[Diagram]](../../diagrams/47/bb77da127987f3d2dc18986bb22bd83f.png)
![[Diagram]](../../diagrams/23/4a715a156728dd519d12b33a686b0195.png)
![[Diagram]](../../diagrams/0/b1a732c7ee69ba30a5ded9a7f6147c91.png)
![[Diagram]](../../diagrams/40/72f5ba547c3c809e1cebb0e975c835f2.png)
![[Diagram]](../../diagrams/2/d1f0ad8c0157c9c6b8d0a3661ba2c6da.png)
![[Diagram]](../../diagrams/26/efacf9ed6fbb23336c7218093d152542.png)
![[Diagram]](../../diagrams/39/af3e90b9e9bd851fef12396d11775232.png)
![[Diagram]](../../diagrams/21/fff5cce97e184cbf76b2d9d78943ab13.png)
![[Diagram]](../../diagrams/45/36e18a529bfbaeef331132f3c91107bf.png)
![[Diagram]](../../diagrams/14/f5b5d3317d1dd17dfc916b2ab98277e4.png)
![[Diagram]](../../diagrams/43/9e9b2081a55df524841445a44834c6e2.png)
![[Diagram]](../../diagrams/17/c3f9e42a93f209d904a7249f3a8ab02a.png)
![[Diagram]](../../diagrams/31/9236f053ae456f55b32f5eea871b6d2c.png)
![[Diagram]](../../diagrams/38/30496edb11d495bbbd46b30f4be715ab.png)
![[Diagram]](../../diagrams/48/295d16ca31d06b8ffc959df008719fb2.png)
![[Diagram]](../../diagrams/48/b3293f7149150ea3d10c86f87da581d2.png)
![[Diagram]](../../diagrams/39/505dddc8be8aa42c688e8b7034b8976b.png)
![[Diagram]](../../diagrams/5/5d7efb0ab49e774d7cb8512dcd9330dc.png)
![[Diagram]](../../diagrams/22/4510db2f923c0d7c7cf243f121085915.png)
![[Diagram]](../../diagrams/20/5450c66560dd189281275bbfc1540b6e.png)
![[Diagram]](../../diagrams/36/2a4744fdc16f4512cad39d7596a8d686.png)
![[Diagram]](../../diagrams/30/53cac106b1a14ce76f4d719a8a254dd6.png)
![[Diagram]](../../diagrams/41/298869bbcf7cef9bde314a7b2310dacb.png)
![[Diagram]](../../diagrams/5/f91e4a7dc47a16970a29c384054571b0.png)
![[Diagram]](../../diagrams/2/e6666c30c60dfacc74fb7dedb6c6f9ef.png)
![[Diagram]](../../diagrams/27/d28d2015df68656e99f97d4945898c3e.png)
![[Diagram]](../../diagrams/19/6c5bb3026dd5c8f27727fd97e59c7202.png)
![[Diagram]](../../diagrams/39/29fbf7cdf360df81d791c5abac9022a5.png)
![[Diagram]](../../diagrams/47/a87cadee42900d8d26c97f48526a2bc3.png)
![[Diagram]](../../diagrams/3/069501c56877caf0d8d66a49e35ce1ad.png)
![[Diagram]](../../diagrams/44/abcbe5d661c8956b75d8624cb22f5616.png)
![[Diagram]](../../diagrams/35/29e24ee2b3034a68b0f495fd5e0df51f.png)
![[Diagram]](../../diagrams/4/2a5ca4031abbf6aebac96e7a3af43dbe.png)
![[Diagram]](../../diagrams/4/608ac1aa7b6160a6d5d89f6c33f618b2.png)
![[Diagram]](../../diagrams/20/02e545ab2a7d9254076e9f7a5d89142c.png)
![[Diagram]](../../diagrams/36/1ba78af1669e8d28215b3f06f2400389.png)
![[Diagram]](../../diagrams/25/fb98f772310c6d9df078db635009533e.png)
![[Diagram]](../../diagrams/18/7751afd62c1a37fd54c9328c778935fe.png)
![[Diagram]](../../diagrams/27/484bc6facedf21b4cd325f50886b1d12.png)
![[Diagram]](../../diagrams/1/83b48b5020dec744aae0cb203c6c5167.png)
![[Diagram]](../../diagrams/37/54ec38ada1c9d867e3c6e47182ccdc9f.png)
![[Diagram]](../../diagrams/50/6906fdc5b05d71f22fb6b5a2264915b5.png)
![[Diagram]](../../diagrams/15/430cc691f9c3eafc63fab6386af20ece.png)
![[Diagram]](../../diagrams/39/33c770635c4354c07950ea9b5b754a63.png)
![[Diagram]](../../diagrams/7/92793daa316ddf7ec1bda687aeabdab7.png)
![[Diagram]](../../diagrams/33/8096e4c0f6e8f8b5bc9fb3bfcaa38d19.png)
![[Diagram]](../../diagrams/20/cbc110139ca1f3aa5eb4f72c00280f8e.png)
![[Diagram]](../../diagrams/38/cd914ceee2c3b4b0cf6e785b1e706f54.png)
![[Diagram]](../../diagrams/0/d5519ed3b21535179aecda539682a3d9.png)
![[Diagram]](../../diagrams/41/4a63bfaf1bd2cd935a0ee3da94bc2558.png)
![[Diagram]](../../diagrams/14/76ce7518a2203be61cbf112eb6cdfd84.png)
![[Diagram]](../../diagrams/50/96c345a328dde810ea9bfefc43a99ca6.png)
![[Diagram]](../../diagrams/10/07522a7cb00be37996f1108d7e1ee14a.png)
![[Diagram]](../../diagrams/25/b80479306cc1718c66a28d7f9743a5ca.png)
![[Diagram]](../../diagrams/29/b0db829659bfffe52a1b8aadd3fec2a5.png)
![[Diagram]](../../diagrams/26/52e0301bdabc3390526b309fa65be76c.png)
![[Diagram]](../../diagrams/14/6ba0ee3253f58bf81e8c0d92cd2bef44.png)
![[Diagram]](../../diagrams/1/b0c8822128552405bbbb4317981f032f.png)
![[Diagram]](../../diagrams/29/e360c7017f5f950c00908fcb7f64cb7b.png)
![[Diagram]](../../diagrams/43/964cb9aff195f3d35c7c5c2cca7e85ca.png)
![[Diagram]](../../diagrams/48/4e9ca08d46eb414ccd2e827a12522b0a.png)
![[Diagram]](../../diagrams/26/eabce11ff21e7dbfcf3698ff4a7f8a68.png)
![[Diagram]](../../diagrams/12/c7f97f380b1dfd84d44b9cd64a21c130.png)
![[Diagram]](../../diagrams/49/03a0d5f8846f4843362225cc3e713a9a.png)
![[Diagram]](../../diagrams/9/7fcc85d7a4d00e86965a5707af9e200b.png)


![[Diagram]](../../diagrams/30/f24cf258b6ea6a7beda875d7d0dc9582.png)
![[Diagram]](../../diagrams/13/f7858f441d2b56f4d6268e444f5f0b89.png)
![[Diagram]](../../diagrams/20/be93e331364aafad72e54d7aea4ac1e8.png)
![[Diagram]](../../diagrams/23/f5f3782c4337975b3f40113c716a40bb.png)
![[Diagram]](../../diagrams/46/6f821836f3229862147a904d904302a1.png)
![[Diagram]](../../diagrams/16/08a38d7026cd70d3c4d781d4a8b4d349.png)
![[Diagram]](../../diagrams/6/e0a2da1c1f4b65846ade72d4236c4d15.png)
![[Diagram]](../../diagrams/13/b06436d4289be48e8df5d8f4af954518.png)
![[Diagram]](../../diagrams/13/d2590ce87b3ed0a34f46fedbea11ad46.png)
![[Diagram]](../../diagrams/10/c2176d604231e70efc6a3d2693241a98.png)
![[Diagram]](../../diagrams/27/804d30faafe2fd615b8105a26c21326e.png)
![[Diagram]](../../diagrams/24/89d9f995a8508c857f05bc1015ab703f.png)
![[Diagram]](../../diagrams/35/439b59a366887c44deaceaf3508e0e99.png)
![[Diagram]](../../diagrams/6/63f8db368d15334263e37e6f30b49574.png)
![[Diagram]](../../diagrams/32/51a8af7bb4c2a3fc13f7b65d530e9830.png)
![[Diagram]](../../diagrams/46/1d8e9cc8be63356b3eb38fa2bb36e3e5.png)
![[Diagram]](../../diagrams/38/cfff2bfc88d8aa83880037e16203ec5f.png)
![[Diagram]](../../diagrams/44/44ee43536385d90d63b1eebbc745d059.png)
![[Diagram]](../../diagrams/15/8ba06fafa8c6a7530398ccc8b3dd870a.png)
![[Diagram]](../../diagrams/44/ef54a0c98d3e29d416a568861c6f078c.png)
![[Diagram]](../../diagrams/28/f558b26b87b1bd55d6c9755cba36eead.png)
![[Diagram]](../../diagrams/32/ad2a3abecf9e6841b3d18f49ec345791.png)
![[Diagram]](../../diagrams/34/29c6d0cce2ade51b05844f1758f5368b.png)
![[Diagram]](../../diagrams/36/9c57aa6e0e3c41c17300a4dae4007ecd.png)
![[Diagram]](../../diagrams/11/bea08aa578d2453cd1c85bee6c513780.png)
![[Diagram]](../../diagrams/48/4322f5acd128a5ae475421225dead9b8.png)
![[Diagram]](../../diagrams/29/2852fc2c0cd33f8a6dddf1a6dbc66d4a.png)
![[Diagram]](../../diagrams/2/b2c68847ebfc9fb22d7a644872c23bd4.png)
![[Diagram]](../../diagrams/29/e5c002832270cf5831096f74cba49399.png)
![[Diagram]](../../diagrams/20/d54709a8215d01e5599574c6d746afe4.png)
![[Diagram]](../../diagrams/10/46b1389e9548a6b74ecb2e80ffe180bb.png)
![[Diagram]](../../diagrams/22/4dc60eab92fdb9a83b4159b15bf5d7d2.png)
![[Diagram]](../../diagrams/12/3b9e51ed64024ee82c8b112b98ab2732.png)
![[Diagram]](../../diagrams/41/1670fa89e33dc3578fb6fc6ebf88ab9a.png)
![[Diagram]](../../diagrams/41/51c89a65ec1b43cce9d8da9aa4400cb4.png)
![[Diagram]](../../diagrams/1/9de1038a244f5e69456b555b757d976d.png)
![[Diagram]](../../diagrams/4/ef208c57629dc21e12ad752b860e391c.png)
![[Diagram]](../../diagrams/13/9dfd79119b53935a98d630e1b4df1f23.png)
![[Diagram]](../../diagrams/35/6b758584812338e381ac7c5429ba15e1.png)
![[Diagram]](../../diagrams/38/dba87ad9bef312a7eb844503e0ac6b7d.png)
![[Diagram]](../../diagrams/1/fdd93c7c2e4244bca0c54eaef3a91736.png)
![[Diagram]](../../diagrams/5/6912a1527f00b22d600a5c0425dbffaa.png)
![[Diagram]](../../diagrams/48/1e1aa82b4e18eb7299d75139f804b8ef.png)
![[Diagram]](../../diagrams/26/f09b3613cb1c32789c9ddd0c312e5df9.png)
![[Diagram]](../../diagrams/2/1d3593da07c6687b92d61f01d532ad89.png)
![[Diagram]](../../diagrams/23/10f1bd65e55c70e4c6dff8c64fdcde6d.png)
![[Diagram]](../../diagrams/29/f982b1df59b00a6485f955626aba899b.png)
![[Diagram]](../../diagrams/48/c2ce38cf06cf667e505502dc25570906.png)
![[Diagram]](../../diagrams/3/f24139d02d9a914ac6d8c2bf3b52605a.png)
![[Diagram]](../../diagrams/12/d5fb5e07997392ab734f9dc0606a8771.png)
![[Diagram]](../../diagrams/28/6ae1e01989b3843634409f5cae891d1a.png)
![[Diagram]](../../diagrams/8/485173b59e8a31c2854e72252aa68a9c.png)
![[Diagram]](../../diagrams/1/3e62fe5ca063e31e04bd886e699bec8e.png)
![[Diagram]](../../diagrams/0/4bde4084ff7ce8eed984562a911ed48a.png)
![[Diagram]](../../diagrams/1/290fe3cb89970a7acc958026ff92e253.png)
![[Diagram]](../../diagrams/48/a3dadbfdc02fb75c254d41a965d24393.png)
![[Diagram]](../../diagrams/13/9790b24f005cc1e3d5ce59325e9822fc.png)
![[Diagram]](../../diagrams/24/a7705797c36ad1e941ec481954a8f72f.png)
![[Diagram]](../../diagrams/29/2ee49b9823b9aef1e979ac8067b79cc4.png)
![[Diagram]](../../diagrams/22/ea242f8ffb2c458a0617cab0dbe93a33.png)
![[Diagram]](../../diagrams/22/27fcc0ce9d2a2eb73ef8806526e8d00f.png)
![[Diagram]](../../diagrams/49/b78d598224839bbefdccbf9cb6a631c0.png)
![[Diagram]](../../diagrams/28/5f149088dae61b0d4f5ecdbf6a870fa3.png)
![[Diagram]](../../diagrams/29/faa4bff49ca8082737b342e440045cf0.png)
![[Diagram]](../../diagrams/31/e4284741f5a0b1002ae1b3350dce81ff.png)
![[Diagram]](../../diagrams/32/db0ebfa2249bbe41cd73128f55b00ae4.png)
![[Diagram]](../../diagrams/42/e28a389b846b2c0490984c42cfa6b6d4.png)
![[Diagram]](../../diagrams/41/16e2c8defd9026c66bd762c35f30bf3e.png)
![[Diagram]](../../diagrams/10/828abd1a306e37b7048a0772bfd87388.png)
![[Diagram]](../../diagrams/0/6659201f27d6186d41fbf46199302eb7.png)
![[Diagram]](../../diagrams/43/197604df345ef475c6df2afd65d27b8e.png)
![[Diagram]](../../diagrams/16/e11239bd70621ac17454cc6bc3092be3.png)
![[Diagram]](../../diagrams/47/4e412ee1c661ef5289e3fb2231d33447.png)
![[Diagram]](../../diagrams/15/964e719159cd189b2358fd90af2bbb9e.png)
![[Diagram]](../../diagrams/3/27a72042718b6fc8c7b563471e823c9f.png)
![[Diagram]](../../diagrams/13/6b4d3db70fcc1c875e64edc346695f38.png)
![[Diagram]](../../diagrams/15/43146fc8461a534185de5c2e9745d926.png)
![[Diagram]](../../diagrams/29/3b04016b36af129dc12ad50569c93802.png)
![[Diagram]](../../diagrams/35/25e1660e8a5c293582f1e1c42c8089dd.png)
![[Diagram]](../../diagrams/14/dc6d2e98d52e31b8f953968abbe9c46f.png)
![[Diagram]](../../diagrams/47/31818ef2d30d29e20a7632654200df7e.png)
![[Diagram]](../../diagrams/50/6c591d23d4814144f43910b4909fd8e8.png)
![[Diagram]](../../diagrams/34/218fc4f2034181103b92b61f74a6a3d4.png)
![[Diagram]](../../diagrams/49/282aed06a01b94a13a4a576172d3f92e.png)
![[Diagram]](../../diagrams/27/6245d464ca0694f551ed952a2579f133.png)
![[Diagram]](../../diagrams/44/804c755d74bf264782e7fc6c5934be6a.png)
![[Diagram]](../../diagrams/24/5c2024c8ef965342f4755740267f47d1.png)
![[Diagram]](../../diagrams/28/cfb00666491df0ffcb3c4dc48c289a5e.png)
![[Diagram]](../../diagrams/47/ce61b8224ed6fa9a09ccab4e67368457.png)
![[Diagram]](../../diagrams/17/e6fdd98c01054c55dc53e0dbde5186e2.png)
![[Diagram]](../../diagrams/15/b7d4e2515edd3e8f421540e0c24c1877.png)
![[Diagram]](../../diagrams/46/a1e453834c819d19f1641591c9164c5b.png)
![[Diagram]](../../diagrams/13/b6d95bdf096f0f4fd60643d82fdf42da.png)
![[Diagram]](../../diagrams/24/1a724d6938aef61f943bf926bec82ec6.png)
![[Diagram]](../../diagrams/10/3780156fa729ab1ad5633c6d161bab67.png)
![[Diagram]](../../diagrams/34/d98e486d929447639076e844f2e776be.png)
![[Diagram]](../../diagrams/33/91c0c47ff9a5750ad957a9f38d7582f4.png)
![[Diagram]](../../diagrams/47/4db9fc814f3e4243046dc5ca0f1a21c6.png)
![[Diagram]](../../diagrams/15/0cf2104fa0cf18edf53346d226768b6f.png)
![[Diagram]](../../diagrams/22/fcc1c740416aa32729c474af82c9232f.png)
![[Diagram]](../../diagrams/8/feb0d4262c75ee31a5044344668c2696.png)
![[Diagram]](../../diagrams/45/42f32cb5e09fb100877476555c6ece18.png)
![[Diagram]](../../diagrams/22/368c28d19b347bd74be685e100397a22.png)
![[Diagram]](../../diagrams/46/117631aa7a59d839d7f37cfd6acfc105.png)
![[Diagram]](../../diagrams/51/09bc7fd6d7030fe606014310da726f28.png)
![[Diagram]](../../diagrams/52/a16dcb22c7389d36e37c36681a3c407a.png)
![[Diagram]](../../diagrams/32/fdad381b947e652093d192bf34f395ff.png)
![[Diagram]](../../diagrams/33/a8546ccec9db786d29303a7307ea5a5c.png)
![[Diagram]](../../diagrams/17/c976cbe64fffb7a72f6700c5891846c6.png)
![[Diagram]](../../diagrams/30/6a2a2c424f7d2405f2762c0cd632f817.png)
![[Diagram]](../../diagrams/37/0c07b95f044f593da738b600960985d0.png)
![[Diagram]](../../diagrams/24/7cb806838dc0d9c963b9eae5a9506e93.png)
![[Diagram]](../../diagrams/41/21ce90e4802d72afdc0df1f3596a91f1.png)
![[Diagram]](../../diagrams/39/9f2489504d5c14dbf1c02e39a1478eac.png)
![[Diagram]](../../diagrams/36/fbdb3ab3e181bad7c3050d19501f1877.png)
![[Diagram]](../../diagrams/8/3aa5a3f11ca6fd59b057aa1c6b826b53.png)
![[Diagram]](../../diagrams/10/72e66178cc43f50b5b0bf5483858b970.png)
![[Diagram]](../../diagrams/49/d0b80406a8b8eb0fced33a3234adf32a.png)
![[Diagram]](../../diagrams/51/68c0d461a5fac53cdea04419381ae6e3.png)
![[Diagram]](../../diagrams/43/296d9455d8a9f5c1a21c172712e2553a.png)
![[Diagram]](../../diagrams/35/81d28f549be6fe5a73690912196d10c6.png)
![[Diagram]](../../diagrams/14/e8fab356b9699ac31c8128d97a145b99.png)
![[Diagram]](../../diagrams/38/f2b2c7088df1a56fad65713d4f570d44.png)
![[Diagram]](../../diagrams/13/71b8e36fb892647184e6de5b9d0db0a6.png)
![[Diagram]](../../diagrams/40/9931489a34cfbda4d2cffed8dbb92684.png)
![[Diagram]](../../diagrams/12/bfd8250ed10bc9c959bc02011c18fd82.png)
![[Diagram]](../../diagrams/29/5a6f5828d1efb191413a3487b360c851.png)
![[Diagram]](../../diagrams/32/2732ed5d9f0b6c044f14f24e7f1069c8.png)
![[Diagram]](../../diagrams/26/eeeb48ed3df43a2b23a0cf73564af734.png)
![[Diagram]](../../diagrams/32/4e3e838bda08fa688972c53d4ed2e850.png)
![[Diagram]](../../diagrams/0/56b5c3091313c30ce8820dd4a0baa299.png)
![[Diagram]](../../diagrams/35/0a62da96a782120a9ff710c3e801068a.png)
![[Diagram]](../../diagrams/33/b94f38d3b2528520bc66ab128d548f8f.png)
![[Diagram]](../../diagrams/36/5eea6f212f453ac752ffec552b79e042.png)
![[Diagram]](../../diagrams/36/9312814d18ee493d9986f54a4d816033.png)
![[Diagram]](../../diagrams/47/1e2d660112d9cbe4528f1d9f618b606a.png)
![[Diagram]](../../diagrams/23/bb347cc32f11937b1811c81b3c20e4dd.png)
![[Diagram]](../../diagrams/22/d2d7dc8567ef37209a83cfd8cd63b8b7.png)
![[Diagram]](../../diagrams/43/aaee30495097334c4d8e584c8ea599c4.png)
![[Diagram]](../../diagrams/50/c22ce62acdc97b001d54712b6a1799ed.png)
![[Diagram]](../../diagrams/33/160c143ebde1b20b1ea79a8295c53f8f.png)
![[Diagram]](../../diagrams/2/171afe0759a02bcc1a44835c91deb727.png)
![[Diagram]](../../diagrams/9/35254c40d65ab6459770c26c462b5769.png)
![[Diagram]](../../diagrams/31/df4c7d6c9d153024d9634a1e7d45434b.png)
![[Diagram]](../../diagrams/22/db80041a18261dea70b30d932c714880.png)
![[Diagram]](../../diagrams/8/7fb1491a612064bbd2b4830c985d39ab.png)
![[Diagram]](../../diagrams/35/0427efca355b08ac76f537dc300efd47.png)
![[Diagram]](../../diagrams/39/0fc55eac67bd50f170b24926e8a0239f.png)
![[Diagram]](../../diagrams/28/80303235191954d6e93e2658638f3a26.png)
![[Diagram]](../../diagrams/0/1aa19eb003a91caf1f2278858a458d23.png)
![[Diagram]](../../diagrams/1/950147d7b13d6a094a85af39ed0aea59.png)
![[Diagram]](../../diagrams/50/20f774f186249c0693c15b779ff85425.png)
![[Diagram]](../../diagrams/49/5bed91ce2387ca8167d5ebeab412536f.png)
![[Diagram]](../../diagrams/10/71428023bcfec32cf086a32bdd983d5a.png)
![[Diagram]](../../diagrams/1/67b9ff8acd61af06522c50867eeaffef.png)
![[Diagram]](../../diagrams/1/e329185ec1dd2ea508cc30f751692463.png)
![[Diagram]](../../diagrams/41/1967385bd388c8f3160ef38f4cac864b.png)
![[Diagram]](../../diagrams/9/d41643185903a2fbe7489cbbc983a490.png)
![[Diagram]](../../diagrams/26/d4ef4a53be66847dd4bfcd2975061460.png)
![[Diagram]](../../diagrams/45/9d8f18f6e5963693ef426b97f2935bb5.png)
![[Diagram]](../../diagrams/43/4451bc42e7b9a66d2c35ddcd287fb551.png)
![[Diagram]](../../diagrams/50/2b3f2ca53f6597f2296c88b7f8b8b80a.png)
![[Diagram]](../../diagrams/33/34ef164f261d9ad02173a1de44e0cb85.png)
![[Diagram]](../../diagrams/12/d2e564e23df943782df392325a9283d2.png)
![[Diagram]](../../diagrams/44/c7f5f25d569efaa2cc5d8911002f034c.png)
![[Diagram]](../../diagrams/12/727ab72a38e0de2213fdf290d1d94b31.png)
![[Diagram]](../../diagrams/30/8fc84a3c6db56862e7cbc6b447b24ded.png)
![[Diagram]](../../diagrams/38/fd90c1bcc0139410b6270c096cb5faa9.png)
![[Diagram]](../../diagrams/42/e29f89513ee4ab22a05fb12b2bce565e.png)
![[Diagram]](../../diagrams/21/1e1bc3fa13aa2bf0691558fd8514a939.png)
![[Diagram]](../../diagrams/24/6e77022292a9c5fb86904d3568c2ba42.png)
![[Diagram]](../../diagrams/13/0d2964d2070a3509dbcf4c3e11263431.png)
![[Diagram]](../../diagrams/0/ba5a27a80bbdf6601dfc331027ec15a5.png)
![[Diagram]](../../diagrams/10/65d9b5a5b6f292aa355651eb83955531.png)
![[Diagram]](../../diagrams/50/0c7628d96b15678f917fff8185b648f9.png)
![[Diagram]](../../diagrams/29/0632f5a68afc07b56eb5246db0b9fd3d.png)
![[Diagram]](../../diagrams/0/4f2a9081eb754e8b3cf461441c55f376.png)
![[Diagram]](../../diagrams/28/6f62114fbb144c1ae2f7685a3c2dabf5.png)
![[Diagram]](../../diagrams/6/a84a7f01f76f017b38244937f1ba944a.png)
![[Diagram]](../../diagrams/15/da802d00bd0d97a6d566fe7c9e76d871.png)
![[Diagram]](../../diagrams/35/bc4218bb5d52fbf3a5e43e8114abeb4a.png)
![[Diagram]](../../diagrams/32/3c336f7fbd87d94f603bef8025fc8ed5.png)
![[Diagram]](../../diagrams/1/ac1f22e09706baf8c15d03d942ed5eb2.png)
![[Diagram]](../../diagrams/4/835167af6ac7980eeca6e6e4925f57b7.png)
![[Diagram]](../../diagrams/40/5d985c5b85f75b0921eb6d0c239831bd.png)
![[Diagram]](../../diagrams/30/1d5f608ede9915e4180c8bf934e9c183.png)
![[Diagram]](../../diagrams/27/ab90fc14e021e2e8c4f634d5bf70741b.png)
![[Diagram]](../../diagrams/48/c6390c8b6453dd01e23bbc9097eb4ac4.png)
![[Diagram]](../../diagrams/44/199d4436f4e63975bbd25aa5ab45d187.png)
![[Diagram]](../../diagrams/51/07cc014a13b43da29c9d56bbd66a77ba.png)
![[Diagram]](../../diagrams/26/7c32626248f7ec1f92d4b090f4fb7d70.png)
![[Diagram]](../../diagrams/0/5a920d87bc72a553cd9eef4c60be9843.png)
![[Diagram]](../../diagrams/2/173dcac4d8026a1041abc87ff20f0ac8.png)
![[Diagram]](../../diagrams/40/5592d2d05461b273a84a59cec8f51569.png)
![[Diagram]](../../diagrams/1/3b1c5a2e594aef88d584ad76b3d4b476.png)
![[Diagram]](../../diagrams/15/af43137ff1653d0425273dc700783dc7.png)
![[Diagram]](../../diagrams/33/bba5c64c74b5e19706de8a7dc70c2209.png)
![[Diagram]](../../diagrams/48/0198e2980bf3a75635a97476866f4361.png)
![[Diagram]](../../diagrams/10/3c5728bebae0d436936bd3e3758ccb4f.png)
![[Diagram]](../../diagrams/42/bf904a5abee369338d7883d5bafd0c8c.png)
![[Diagram]](../../diagrams/37/8609e17905e1bd2a765b7660a722cd81.png)
![[Diagram]](../../diagrams/30/2917bf956cb071fa50b24751172be154.png)
![[Diagram]](../../diagrams/3/4fa982c971957c6d3c9edbff4dfc807f.png)
![[Diagram]](../../diagrams/47/81f475ebd5f6b0cc8113a451f9ffb31b.png)
![[Diagram]](../../diagrams/47/bd06e5b49a908ab9073f229389462dd7.png)
![[Diagram]](../../diagrams/1/97f8b57b7ab8c85758f9d7bff3131d21.png)
![[Diagram]](../../diagrams/3/1f9230616fc87caceae4c7708299417a.png)
![[Diagram]](../../diagrams/42/9907dc4d6627ab05f1539b8cb092683b.png)
![[Diagram]](../../diagrams/19/11a3d9dd59f9150fa7372acef6b76df9.png)
![[Diagram]](../../diagrams/43/bf02f9a830424a9e9dfc3b0ae02434f7.png)
![[Diagram]](../../diagrams/47/4ac8d150dd791b5e653afdcf327a8a23.png)
![[Diagram]](../../diagrams/33/5f65121df4d3b0a4ee9c3e3cb3586a62.png)
![[Diagram]](../../diagrams/10/54966f0892ea2a49a994d53905e64559.png)
![[Diagram]](../../diagrams/16/b0e586f5aff50efa546a1f2825f6f024.png)
![[Diagram]](../../diagrams/0/33dc5b5aca04dc9b594eb3130a290fe9.png)
![[Diagram]](../../diagrams/14/72ecb6e43cb7269fb39e9d96f2fb4016.png)
![[Diagram]](../../diagrams/34/a7ebf2f883e72780c05ba69f2b9256ec.png)
![[Diagram]](../../diagrams/10/a48c406dd778612df4322d5acf5e4a5d.png)
![[Diagram]](../../diagrams/50/43545fdcf2256657e59ddc2b8ad37633.png)
![[Diagram]](../../diagrams/6/8fb84083b3d2dcb95382d0cf2ed9480a.png)
![[Diagram]](../../diagrams/17/4d122d162d69091dbce7685afb819ab7.png)
![[Diagram]](../../diagrams/39/f01f4bdddd87f1462ffcb7519d710cf7.png)
![[Diagram]](../../diagrams/0/66cf8bc79cd499155f02476fd883c6d6.png)
![[Diagram]](../../diagrams/47/e04c9aa5b792d79ea20e222c0f599873.png)
![[Diagram]](../../diagrams/43/913bfa1eac273e2d3b0c9617795ea292.png)
![[Diagram]](../../diagrams/24/97f396061a6f5b9fe9e7c6780c542c75.png)
![[Diagram]](../../diagrams/50/9e12169f12b37045f808d303cfe4cf73.png)
![[Diagram]](../../diagrams/23/11665052883e3630f2fbdcf7f452bf1b.png)
![[Diagram]](../../diagrams/30/876f8c7e8d43189ed123ce8f27711cc8.png)
![[Diagram]](../../diagrams/12/4cfba51acdaae0a638935575fd9a4fae.png)
![[Diagram]](../../diagrams/7/fd2cb7dbdc3f218c066228b09bf24661.png)
![[Diagram]](../../diagrams/49/ec06736e2959069fad9c827d5cd93617.png)
![[Diagram]](../../diagrams/39/daa2e9d04a579c4ed1a765911effcfad.png)
![[Diagram]](../../diagrams/22/324f0ff8ab0acf17c6723e22fd7d944f.png)
![[Diagram]](../../diagrams/42/e1e2ff38ffa9263696c7f4d71103f43d.png)
![[Diagram]](../../diagrams/48/a993fd872bc322c710ee80b5d94fe96e.png)
![[Diagram]](../../diagrams/18/9558a754c8e305c1c58d44aba8ec1226.png)
![[Diagram]](../../diagrams/37/7fc9ae4ffa9a364cdf1f23f66983eba7.png)
![[Diagram]](../../diagrams/44/e245db2e9ced9c61ecfc8bcf066cd3f3.png)
![[Diagram]](../../diagrams/32/b8c9d05d0e2b3061d7ae50a9a14ec252.png)
![[Diagram]](../../diagrams/20/b258130f6854628e8c73d81f03cd3b11.png)
![[Diagram]](../../diagrams/26/148021c97b650698dd8de00bc1a06d10.png)
![[Diagram]](../../diagrams/22/ac0c34aa5f4d20e2d9afd7d6d518a622.png)
![[Diagram]](../../diagrams/40/6faa20687989399849c8228286f2b450.png)
![[Diagram]](../../diagrams/47/b758e43c785d5b4ccf448f96f3c6ca7c.png)
![[Diagram]](../../diagrams/19/e936158db574af757923a96527c67e62.png)
![[Diagram]](../../diagrams/26/a0a9e43e904ab0841a3b896f97cd980a.png)
![[Diagram]](../../diagrams/6/8294f30e5f51d8ffe08b42f9248310d8.png)
![[Diagram]](../../diagrams/48/e85c4d458c543ff474327157fb8065f3.png)
![[Diagram]](../../diagrams/23/67ca9a3757f0156fb960983ed9033c5e.png)
![[Diagram]](../../diagrams/0/02a53b24ca44a98798e265f14da7e4c9.png)
![[Diagram]](../../diagrams/35/cf5d5d77605935b918f523b18d6a2416.png)
![[Diagram]](../../diagrams/22/d71a5405b5801544c4ee1fa24fe9b2a9.png)
![[Diagram]](../../diagrams/24/8b19f60a35fd0ae80e90c76395ec04ee.png)
![[Diagram]](../../diagrams/35/80532723313bdc09cd3815cf2420968c.png)
![[Diagram]](../../diagrams/35/48702a27b952025354a9943927a98c7d.png)
![[Diagram]](../../diagrams/31/c36821d2f8b9e539c83eb7b72da59ecc.png)
![[Diagram]](../../diagrams/14/eb2fa68f536597197bd1b1f61f50c938.png)
![[Diagram]](../../diagrams/52/3335f0e967532bb670d7a56e908132af.png)
![[Diagram]](../../diagrams/7/09040ca4d76ca8bf798e2ab5ef853987.png)
![[Diagram]](../../diagrams/47/c110fb7f86185cf0f44251b89ba4bc8f.png)
![[Diagram]](../../diagrams/27/e62914700f9207210a6c59d379a1fa97.png)
![[Diagram]](../../diagrams/17/4cca4d53da68cf524f5b04edd95e40fd.png)
![[Diagram]](../../diagrams/1/96ae6cbc2f6f2dd4171cba0454a59209.png)
![[Diagram]](../../diagrams/36/ae75f23008ff894cd9f7d294af74c4ea.png)
![[Diagram]](../../diagrams/15/d825f2c19e6b41224abd8360fb61ea62.png)
![[Diagram]](../../diagrams/10/3faa52fe7cb21711dd881d2dcfabc0fb.png)
![[Diagram]](../../diagrams/21/b7c13c013ed7c186edb3f362af191f4b.png)
![[Diagram]](../../diagrams/15/121339c0a66000a06fd43364ac039290.png)
![[Diagram]](../../diagrams/1/181b847ab74796b40a3b924467359a4b.png)
![[Diagram]](../../diagrams/6/ef97bad89a620a14e95b1bbfb0f84425.png)
![[Diagram]](../../diagrams/10/ae6a750a1c4daf1f9089ca121744e7b7.png)
![[Diagram]](../../diagrams/20/b5f87a3d2e4227b6c13590af2b721fd4.png)
![[Diagram]](../../diagrams/47/eac55533bb77035ae96e327b917480d9.png)
![[Diagram]](../../diagrams/15/c742113296c97de168b6eb8f195b2b91.png)
![[Diagram]](../../diagrams/36/36f85a2ead638812aedc952053ac51fb.png)
![[Diagram]](../../diagrams/34/4bfd1a5b1209a4ff7eea0450b0d56c80.png)
![[Diagram]](../../diagrams/45/2c34418a0686715841086eac486bb69c.png)
![[Diagram]](../../diagrams/48/05198b897e2152af240420a8ccce5702.png)
![[Diagram]](../../diagrams/28/8e7ebdbcee5bc40003840ef1da4edd23.png)
![[Diagram]](../../diagrams/36/ca80763649e319fc9b03110412ad37e8.png)
![[Diagram]](../../diagrams/12/968ae1c3d44fbcd6458dbc24444ace81.png)
![[Diagram]](../../diagrams/43/560026f8b31875632a99199390c26f00.png)
![[Diagram]](../../diagrams/35/7011af20ff18f384025205fc97b3764d.png)
![[Diagram]](../../diagrams/15/117ae8f83385d4e85fd6ef1938c1a683.png)
![[Diagram]](../../diagrams/41/a6cc147a2b0cab5529a8e907620eba20.png)
![[Diagram]](../../diagrams/35/81422b7fc1c47481c11c013e5fb40efe.png)
![[Diagram]](../../diagrams/17/6eefee47981c42cc5e2d54a018b7a196.png)
![[Diagram]](../../diagrams/46/dc291da1d085ce8a81ffb783c452fc9d.png)
![[Diagram]](../../diagrams/6/25427e988e864597c7991546984ccec8.png)
![[Diagram]](../../diagrams/46/eb2feefe3883486f3b7518799c90bf99.png)
![[Diagram]](../../diagrams/14/7793ef5d9f65e3da375c245d7fa496e7.png)
![[Diagram]](../../diagrams/21/92b1e0117c7cb18987a75e5acbff6b1a.png)
![[Diagram]](../../diagrams/27/fa9f1c666c4991eba71a9bc06b756021.png)
![[Diagram]](../../diagrams/32/44cead66cdae4c6ba217f2c3589b3096.png)
![[Diagram]](../../diagrams/51/a526d0804b836ca7b2a5da83a750b6d7.png)
![[Diagram]](../../diagrams/47/ecff27510224595cf918dc44b383f3ec.png)
![[Diagram]](../../diagrams/45/beb20d6f6ad511172ab70b4516dd5524.png)
![[Diagram]](../../diagrams/43/55a60d742126a9ad5f085e0d816b0adc.png)
![[Diagram]](../../diagrams/36/a4b5575233f23d4cbd909353fa6cda74.png)
![[Diagram]](../../diagrams/29/87d212ff21ea81bc2b85e4703774114e.png)
![[Diagram]](../../diagrams/4/b4bf7092cd7ef2639b3e9d2b748deb1e.png)
![[Diagram]](../../diagrams/48/10e8403fbb6b07206be3d9e512d29301.png)
![[Diagram]](../../diagrams/26/4c9b7b86c0365e416bcff69fbf837e8c.png)
![[Diagram]](../../diagrams/32/3e24ac3c81c4d84f81ff61d20356f0c3.png)
![[Diagram]](../../diagrams/6/40ce6ca9b2b2df1dd1660e93ffb3d2ea.png)
![[Diagram]](../../diagrams/49/0048c4b1d72ca8a9f3ae4ddbb2bfa51b.png)
![[Diagram]](../../diagrams/20/41f81b92e87b24a8738cbf5b9d20ea4b.png)
![[Diagram]](../../diagrams/26/0f277382a8031b320189ae873c905ca3.png)
![[Diagram]](../../diagrams/29/175cf078fc0d3b660ad0c8c12cf81210.png)
![[Diagram]](../../diagrams/7/9b7c2985ca5c00b20e478a2134c60a1a.png)
![[Diagram]](../../diagrams/1/a3f01e0e7528ea4c01f1546c469bf1c5.png)
![[Diagram]](../../diagrams/9/d8e6da743932a805458e4ad89db227ef.png)
![[Diagram]](../../diagrams/2/82b0b812dfea7bc27c9ac55fce1a4533.png)
![[Diagram]](../../diagrams/25/6c18fcbf7edb7d1e9f830193bf69161f.png)
![[Diagram]](../../diagrams/20/0d345011428b4c9db81bf801914813cd.png)
![[Diagram]](../../diagrams/16/e956ccee54944710670c10f611043c63.png)
![[Diagram]](../../diagrams/35/db1dc7c695477b7648ccf2fc25cde15f.png)
![[Diagram]](../../diagrams/5/f46a9c2f987d26b8d59670590e8dcdc8.png)
![[Diagram]](../../diagrams/32/6ae91b87fd63af5e8133918d8017d8b4.png)
![[Diagram]](../../diagrams/49/f4be575c4f6dd47c6e40e35cc266d9f7.png)
![[Diagram]](../../diagrams/9/e33b90272b5f596ea947a41f659346b3.png)
![[Diagram]](../../diagrams/28/879ecee5121c7be578c1816ad6a9fd62.png)
![[Diagram]](../../diagrams/52/318b41367cc16d114ae9b40687ab486f.png)
![[Diagram]](../../diagrams/48/4fe9f7d9fed3ed882bd28ecfa65fb095.png)
![[Diagram]](../../diagrams/50/f3c0cf1e8b004103ebcf0aeeb923420f.png)
![[Diagram]](../../diagrams/29/72cfece57e534e79f087f0d7ec8b2abc.png)
![[Diagram]](../../diagrams/40/a55165c494c888368b1c815b7a0bc6a6.png)
![[Diagram]](../../diagrams/18/2ad257858478b32c48d016beedf0c402.png)
![[Diagram]](../../diagrams/10/180968d879d84ebea25adfae6e2676c4.png)
![[Diagram]](../../diagrams/19/c7c8fec73d39b8d588b79c7f33e6cf76.png)
![[Diagram]](../../diagrams/18/7aad6c44ac2cc8040e7c7ee896058f65.png)
![[Diagram]](../../diagrams/20/8fc8a0c7975ce80bc77e510d926e8f38.png)
![[Diagram]](../../diagrams/14/0405aec5335abcf90501f3aa325d0a20.png)
![[Diagram]](../../diagrams/17/6e8b432ce0c6c2e07862bae0ea916c29.png)
![[Diagram]](../../diagrams/28/336a91ce9d881e870cb650db1c264809.png)
![[Diagram]](../../diagrams/49/90f5c39fbba66fb146de0669a9967f2f.png)
![[Diagram]](../../diagrams/7/a471392fccef3168b0cddf6c6b87c8ee.png)
![[Diagram]](../../diagrams/50/f58012508f890e90be0d11701cf70fc2.png)
![[Diagram]](../../diagrams/6/48709642403dcafa9d74fdac85945d86.png)
![[Diagram]](../../diagrams/48/ba41c3bdb5af14e1cfb8fc56bde79965.png)
![[Diagram]](../../diagrams/28/197fd278fadb14261c7d5617ba6537aa.png)
![[Diagram]](../../diagrams/45/d43802d25349b3401ec710030b0feda6.png)
![[Diagram]](../../diagrams/25/d2b646cd9389d6dc4c4a9f25fc7280b0.png)
![[Diagram]](../../diagrams/38/5aae315db10d4d0245d6438e1b0502c4.png)
![[Diagram]](../../diagrams/19/64c7caf1750529fa61b499b2ccda187d.png)
![[Diagram]](../../diagrams/34/51daca311b4ae9cab8fb94862b6b72be.png)
![[Diagram]](../../diagrams/41/a65c821a5988129f16d87932e4e3f3c0.png)
![[Diagram]](../../diagrams/21/37999a26f09bb600f2c191fe157ec9b7.png)
![[Diagram]](../../diagrams/35/3e6ded2613ab1cd3c2e7545b705ad846.png)
![[Diagram]](../../diagrams/35/5eaa2fa71ed415d82e79a1fc471eae8d.png)
![[Diagram]](../../diagrams/52/fc7797bd3cbdd3df4a2f27a08918503f.png)
![[Diagram]](../../diagrams/40/afc1bb795f78f43241a7ff400112e4db.png)
![[Diagram]](../../diagrams/43/8d8d9e0e4f06ebbda1d99b72b0d4499b.png)
![[Diagram]](../../diagrams/9/c03210f50fc179a24cc1fa4194040fcd.png)
![[Diagram]](../../diagrams/45/e4fd462804d1b097ff1355dda860a45b.png)
![[Diagram]](../../diagrams/18/608b87075f94553c9b44895837f4167b.png)
![[Diagram]](../../diagrams/15/c40b24e456e5e1925ed48d165cafee3f.png)
![[Diagram]](../../diagrams/52/d86c180d9ad6becb2a52cd05b88e1222.png)
![[Diagram]](../../diagrams/30/b5b573522b9a10ce4e420a38dd7cb3bd.png)
![[Diagram]](../../diagrams/33/db7d6aa74cf964f1a837efa79846414d.png)
![[Diagram]](../../diagrams/49/cd36969ea0b12a0abaf52a3383a4ec46.png)
![[Diagram]](../../diagrams/17/a074d7badeb69a80963a9b91ec48ac36.png)
![[Diagram]](../../diagrams/21/e13917532dd4f9d8013ea35881f70c21.png)
![[Diagram]](../../diagrams/40/a0b6e35b681b667f46818eeb31df2f74.png)
![[Diagram]](../../diagrams/40/108e04d56a13f6929224ecbed5caf710.png)
![[Diagram]](../../diagrams/50/ad7bf335f3882a83c94db5d47ecc0714.png)
![[Diagram]](../../diagrams/0/aa7884e8c3d00d6db4bd9764f660c671.png)
![[Diagram]](../../diagrams/21/ac10a10c80654c817a570c788bec2ec9.png)
![[Diagram]](../../diagrams/2/2c39f634b9e44e2fd9e62e172f4ce029.png)
![[Diagram]](../../diagrams/16/7ecdccc3800b92478e96832d60a87a46.png)
![[Diagram]](../../diagrams/37/899555bd996ca0c5155638f659e5731f.png)
![[Diagram]](../../diagrams/48/7247f74bb03bc787d18e015e999fdd7f.png)
![[Diagram]](../../diagrams/24/d0880b0f6c088e03f309a138a56e802b.png)
![[Diagram]](../../diagrams/3/668b0fe4de5f07c5a3815a5b9873afe8.png)
![[Diagram]](../../diagrams/41/cee211f201a352b13b515603bad4d843.png)
![[Diagram]](../../diagrams/10/97962e2e623c10d29f730d9d075eefa7.png)
![[Diagram]](../../diagrams/43/a5b979a2e35bd38c0acf593b71c04f15.png)
![[Diagram]](../../diagrams/7/678c1e6192761697932f21d37714cbfb.png)
![[Diagram]](../../diagrams/15/cfe2b4ba55aa6efe016706ce167ef1f5.png)
![[Diagram]](../../diagrams/40/574b18d158f503743759b8e0a17f5c4f.png)
![[Diagram]](../../diagrams/35/bf52c4679008ae42a97eb5e72b2269ce.png)
![[Diagram]](../../diagrams/10/6e305dc5bcb499c856a99c1147637e1f.png)
![[Diagram]](../../diagrams/11/d445dd20e785f482648ca2aed3039fd2.png)
![[Diagram]](../../diagrams/21/b8f9a7b7841f037b414d3545a33307d6.png)
![[Diagram]](../../diagrams/37/1ebd7acc0ea36fcf5daf738c1a75900f.png)
![[Diagram]](../../diagrams/36/e788279b8a028fcd438af952b2a025eb.png)
![[Diagram]](../../diagrams/40/0124d13bcd8a18120b426a1a9ebd012f.png)
![[Diagram]](../../diagrams/43/d604705430ee8951782d01e795f188e8.png)
![[Diagram]](../../diagrams/50/931962a5396afc3d418b76391d165158.png)
![[Diagram]](../../diagrams/16/1cf714912d45c47240f9a81d2cbe7184.png)
![[Diagram]](../../diagrams/14/9c89e7dec0fcc49b0477a1f362f289d5.png)
![[Diagram]](../../diagrams/26/8483410dfdcec2d8712d5b549036594c.png)
![[Diagram]](../../diagrams/18/214c115d03adfe7942b17369b378c822.png)
![[Diagram]](../../diagrams/33/42a4210a48eb4a1d4075658e34d138cf.png)
![[Diagram]](../../diagrams/22/19bf895cb15b63891ac98d55ffd43f27.png)
![[Diagram]](../../diagrams/26/79caadd8ca93d6f1a99e51b45b8f8d59.png)
![[Diagram]](../../diagrams/34/07a9c25fc670d92b673d25d23cac15bc.png)
![[Diagram]](../../diagrams/13/038ceb10f34de7e6e301b85a466055f7.png)
![[Diagram]](../../diagrams/24/64b186f9d019ac27f1e5703039ccc424.png)
![[Diagram]](../../diagrams/7/c365a32e74e11e321aaf652827bd7c7e.png)
![[Diagram]](../../diagrams/33/267259335d526da546394fa2d36bf911.png)
![[Diagram]](../../diagrams/13/d98049299ae4b6756b8720114327cd72.png)
![[Diagram]](../../diagrams/52/081d56666b7801c1f5358e6e98dad887.png)
![[Diagram]](../../diagrams/29/e057df2196c12cb1782fe575d752347f.png)
![[Diagram]](../../diagrams/27/cbb23cb6adfa9f37b94607d0d854d6cf.png)
![[Diagram]](../../diagrams/20/bdf59b130e8e872d50e54e7a39ea6d6a.png)
![[Diagram]](../../diagrams/52/051f767f78e287ad3d7cec3f48f7384b.png)
![[Diagram]](../../diagrams/7/f7860e5f634a107b458253bd97067118.png)
![[Diagram]](../../diagrams/2/36701dff6f938f143c9d971b1d4d45d5.png)
![[Diagram]](../../diagrams/7/b221b7873eedc60b9549bb09975a979b.png)
![[Diagram]](../../diagrams/17/33e50bc554084390dfa5327e98925d33.png)
![[Diagram]](../../diagrams/25/f851e05061d39a6760ed4783be0518db.png)
![[Diagram]](../../diagrams/52/ae1135b8861151f1396972d5586d19d7.png)
![[Diagram]](../../diagrams/2/23b11d228b65a8d43c7861ce86ef50b1.png)
![[Diagram]](../../diagrams/33/5fd09960b55e82fedf8899737bb8561f.png)
![[Diagram]](../../diagrams/40/f9659cb57737fbfa1ea8eecb1a4fb4c9.png)
![[Diagram]](../../diagrams/42/325555a36d0a737574fd36f1a11d7a0a.png)
![[Diagram]](../../diagrams/37/d0b160ac1584882a0c07d5b3f59dd0e2.png)
![[Diagram]](../../diagrams/8/10e0739bfca37314f39f16b3e7e5e93a.png)
![[Diagram]](../../diagrams/48/89e398b169d5f4b9f0fa132b320ab890.png)
![[Diagram]](../../diagrams/18/1e81d9a73bd173fde3c712d2af62c43a.png)
![[Diagram]](../../diagrams/15/32087c337fe9e0307a40f3dc992e727d.png)
![[Diagram]](../../diagrams/34/0d22f521b47bd9da19ba02ac86163713.png)
![[Diagram]](../../diagrams/40/d80a0fb2affc2ae26e6b28e3a88ae433.png)
![[Diagram]](../../diagrams/4/1d372e8774fa536627557111ab027f3e.png)
![[Diagram]](../../diagrams/5/b0f0753b8def5566563dc7619b0914aa.png)
![[Diagram]](../../diagrams/25/16aa6f0ad1f002eec8b883fa36a265fd.png)
![[Diagram]](../../diagrams/15/749aa109d28b3a240c2878767d537dab.png)
![[Diagram]](../../diagrams/29/44722870333b39ecb9e3bdd7ce5b413b.png)
![[Diagram]](../../diagrams/29/1614122a006571e924e331569fb0835a.png)
![[Diagram]](../../diagrams/25/1a3e6e5cf2c6f39e005c43f4ab644ffb.png)
![[Diagram]](../../diagrams/13/83a37e4b518781e864368df1f51ca73b.png)
![[Diagram]](../../diagrams/11/1d1b44a0726ca40864c6ae3e616b31b8.png)
![[Diagram]](../../diagrams/19/5e57d5d6c6a108daa99c0d4a6f1dd888.png)
![[Diagram]](../../diagrams/32/a43f0b08ff6460baf9ba3053506e7fcb.png)
![[Diagram]](../../diagrams/38/2050a20db598680ffb913bbb22ffbbb2.png)
![[Diagram]](../../diagrams/5/0513d22d7f4c8b4360524005ba5552a0.png)
![[Diagram]](../../diagrams/2/fd65d5f832bafefe680041738a7893bb.png)
![[Diagram]](../../diagrams/9/f7f2b026b008ec8a446b6dc7a75a4f48.png)
![[Diagram]](../../diagrams/2/e2682e91e837bb9027416e8fc7467cc9.png)
![[Diagram]](../../diagrams/28/ae3ad836771191b4447a58205a5f5f0b.png)
![[Diagram]](../../diagrams/40/c44d63e1a7a3c6cd8ab2555f52657299.png)
![[Diagram]](../../diagrams/43/51e757043b3eec4fe9dbb20d8f22ea1b.png)
![[Diagram]](../../diagrams/33/01953feec47254b23ceeff7152dab583.png)
![[Diagram]](../../diagrams/23/7a3e0c4eeb140a8cae23686f00f068a1.png)
![[Diagram]](../../diagrams/5/981c10c00568c9a33942f661ccc1deb7.png)
![[Diagram]](../../diagrams/45/dba307bb359e80490af5ebe92445e0dc.png)
![[Diagram]](../../diagrams/0/b5ced04776c83680b260be9d3260e0da.png)
![[Diagram]](../../diagrams/7/a6cec5f6b904f521c036c750400aecc2.png)
![[Diagram]](../../diagrams/19/281f91bfdb5c43653311293fbe09f92d.png)
![[Diagram]](../../diagrams/6/a37c1a450a659dfd7c8be61024de8520.png)
![[Diagram]](../../diagrams/40/a94795bbcef76887203ec90b6c39cf56.png)
![[Diagram]](../../diagrams/21/df7e5ed1d0a68e0da4e346b8d5dc92af.png)
![[Diagram]](../../diagrams/21/dc981c55676b066426fda827b7bbd000.png)
![[Diagram]](../../diagrams/35/3e7ee199df29efe90f25acf84a3c93f7.png)
![[Diagram]](../../diagrams/43/cd3340359c51cef2ffef5c38ade45165.png)
![[Diagram]](../../diagrams/49/ff9e2bba17be33b716c1e3d9390aa5c7.png)
![[Diagram]](../../diagrams/45/95501831901c4f9f9ca658ee2e8bf784.png)
![[Diagram]](../../diagrams/37/dbfbae68ddd3c3c0e28703e2d8129957.png)
![[Diagram]](../../diagrams/45/9eb467eb7b16f7c995b874b97643f212.png)
![[Diagram]](../../diagrams/45/5bc3444c5ae2d5b909a14fa55965d015.png)
![[Diagram]](../../diagrams/36/cb8cefab84d971477d9c4d48396a6d36.png)
![[Diagram]](../../diagrams/48/cef37e1ab5092d9b9b5e0af6d0e501bc.png)
![[Diagram]](../../diagrams/47/0713e3d58bcb3b9a333126f8760cff8f.png)
![[Diagram]](../../diagrams/41/082ba67db49e93a42e709f5235e6ee32.png)
![[Diagram]](../../diagrams/42/254a530f60dc8b256f73ca4117ee9351.png)
![[Diagram]](../../diagrams/17/35417001dc7786cc1e539ef2ab762d39.png)
![[Diagram]](../../diagrams/5/44c347cbdac2d7f09bb8aa5d0e3b60f0.png)
![[Diagram]](../../diagrams/46/a207ce70c9d329af24db227af5960a97.png)
![[Diagram]](../../diagrams/45/d154bee3195421785a0ff1c5929605d5.png)
![[Diagram]](../../diagrams/26/55c07af02ad30652a7ac6ed4f68dff7f.png)
![[Diagram]](../../diagrams/2/4c5a30bcb630e419f8a82682d1eb64b1.png)
![[Diagram]](../../diagrams/4/4950e1093f0846e429076f29bf1722a5.png)
![[Diagram]](../../diagrams/42/32a48b2c7ae5bed75071a1e4ffc138eb.png)
![[Diagram]](../../diagrams/46/af96d2d3f3335d48dbdd6e065d5e91c2.png)
![[Diagram]](../../diagrams/48/686f590952568166bccc67023c9639d1.png)
![[Diagram]](../../diagrams/19/0d05031296a07b1706171f59d39c583c.png)
![[Diagram]](../../diagrams/4/79586191916222caf5f0f5f273961cc9.png)
![[Diagram]](../../diagrams/18/3808b0edd4607fc6e5091b6437518a3c.png)
![[Diagram]](../../diagrams/42/ad1a9083a82b7110cef8f6e81a75a685.png)
![[Diagram]](../../diagrams/21/67e3912f4ea47d64d07c7a2e94c2da43.png)
![[Diagram]](../../diagrams/49/808286242dc3c8c5de699bdf81ac51e9.png)
![[Diagram]](../../diagrams/43/9dd67df779fee9f1473e35972e06d3ba.png)
![[Diagram]](../../diagrams/20/dd9e31f271ded08aac0cbde41f142d35.png)
![[Diagram]](../../diagrams/45/8beb557317cc15b4ffcbf56119099c3b.png)
![[Diagram]](../../diagrams/4/8ad7577cb34f5acca0b72ca4e3eafe37.png)
![[Diagram]](../../diagrams/29/794e88a5926a7d9e6a30ce3c517ea8e0.png)
![[Diagram]](../../diagrams/21/d35804cc36841adb1a039fadcf1c1546.png)
![[Diagram]](../../diagrams/22/201d752c03e58be5d46718a8e1ce7f53.png)
![[Diagram]](../../diagrams/28/a2ad518994204e9e38c897461ab1d04d.png)
![[Diagram]](../../diagrams/1/cdc3be02c6633d7ded68822674a0d698.png)
![[Diagram]](../../diagrams/49/f18407caac355d4b931b2a062628f77c.png)
![[Diagram]](../../diagrams/26/39983107b60870ee86b1c873f78eabfd.png)
![[Diagram]](../../diagrams/31/014ec6e0437c18efaacd7ab2e6e8aa68.png)
![[Diagram]](../../diagrams/6/65289889972453651b240938553bf4d6.png)
![[Diagram]](../../diagrams/32/26c11e9c086e7c9ce6e56bb555474742.png)
![[Diagram]](../../diagrams/34/67a6b4d8987e8329fb7588a311921b4b.png)
![[Diagram]](../../diagrams/48/fe6c2b1438257e5800064b806d418651.png)
![[Diagram]](../../diagrams/39/5b0411346b7415fefeb12506f89e20d1.png)
![[Diagram]](../../diagrams/52/654369bbc40a04b788ae46bb3608ebb4.png)
![[Diagram]](../../diagrams/9/e95b5d37b0a30af6adcc19c1e71e12b3.png)
![[Diagram]](../../diagrams/14/b3e8107c751e21c3129437c9a04eee12.png)
![[Diagram]](../../diagrams/23/81ec33020072717e38a49e4584ede5a9.png)
![[Diagram]](../../diagrams/37/9de9b3abcda48516c8156803982c3881.png)
![[Diagram]](../../diagrams/36/d02e346ef55be5a87477023e614c5777.png)
![[Diagram]](../../diagrams/18/de8b4cf6cb74c8603a650e1bdbc7ecce.png)
![[Diagram]](../../diagrams/12/5abbc6bf43584a86d002a2adafe88ec7.png)
![[Diagram]](../../diagrams/4/95a12dc8f81cef026f8576ca86d6f03f.png)
![[Diagram]](../../diagrams/23/4536e2ca4dbf111da32324368200bcaa.png)
![[Diagram]](../../diagrams/16/aa318b8cca4f732ace749c04d5289112.png)
![[Diagram]](../../diagrams/50/f60a3aac60d6c8903223e1caa1826129.png)
![[Diagram]](../../diagrams/20/c7814dd71689f5de31b9e7419603e2af.png)
![[Diagram]](../../diagrams/6/d82fc5003bb7673e0569ef0d5a9968d6.png)
![[Diagram]](../../diagrams/34/807994227ea3bbc59f254ebd133a9391.png)
![[Diagram]](../../diagrams/28/817dda996c6736da1ca10c92a7b43f54.png)
![[Diagram]](../../diagrams/1/1a1670adc7261f01c5a2c59eb9f8cd53.png)
![[Diagram]](../../diagrams/31/e200b6ee0678a253aff7d8287defad57.png)
![[Diagram]](../../diagrams/8/798c1c4f8b5e42e6d9688d0cf4d30f34.png)
![[Diagram]](../../diagrams/24/50555625dcd51308262fa774d8d328eb.png)
![[Diagram]](../../diagrams/40/2cef3aa2b3a3300920eb5bb8fd7c225b.png)
![[Diagram]](../../diagrams/26/22fd33a68d24b216868ef8a97676268a.png)
![[Diagram]](../../diagrams/51/37c963790629dee1aa76750b088680fb.png)
![[Diagram]](../../diagrams/1/b2c481124c11f46610ae3b57c347c324.png)
![[Diagram]](../../diagrams/28/a82998618d72c55de57a2de3fd32e097.png)
![[Diagram]](../../diagrams/14/16df27aa52a81c36584789445ea7af08.png)
![[Diagram]](../../diagrams/38/b83bf2b887eeddb693c956249975000d.png)
![[Diagram]](../../diagrams/17/89da5b4420db65f87feb8035cf0a9088.png)
![[Diagram]](../../diagrams/19/c6c2cf6d3537473e3f6f5cb057762f72.png)
![[Diagram]](../../diagrams/1/1a4cfabf339f31d2f26f16d5b962ece0.png)
![[Diagram]](../../diagrams/11/84c9f8177b143f1f4aa4c80b4de140fa.png)
![[Diagram]](../../diagrams/38/dd797cbdfc2d23fc6928eda3fa8bf177.png)
![[Diagram]](../../diagrams/38/6ac927a9482b714ec9fbecffbdbf0df3.png)
![[Diagram]](../../diagrams/16/58246ad4a62db790fe0f99cb8f36b3a7.png)
![[Diagram]](../../diagrams/34/dea41e467cbea44e74bc335ff56862fd.png)
![[Diagram]](../../diagrams/19/1ceda34af31147e5b29376ae6658cb36.png)
![[Diagram]](../../diagrams/49/c3c8740415ee5196422c8ecf8749fd20.png)
![[Diagram]](../../diagrams/10/2b01247cffb9c46463b7a05bbd1d8edb.png)
![[Diagram]](../../diagrams/34/746bcba981b0c43de8d095f31bba9366.png)
![[Diagram]](../../diagrams/4/c253e88a525efbf27b10ad6a05169d94.png)
![[Diagram]](../../diagrams/6/981ea8d3b990573d75d0ad6776e40e52.png)
![[Diagram]](../../diagrams/1/7d97b76a09096c85f9799f6c42be4b62.png)
![[Diagram]](../../diagrams/37/a6790cc626dee1a51999287b1428c547.png)
![[Diagram]](../../diagrams/40/be3603414d97e28c102e52fb9c99fa16.png)
![[Diagram]](../../diagrams/24/0ace92577472d865b121f6fcbd041687.png)
![[Diagram]](../../diagrams/9/cede493d58fb39319d7bc031121096eb.png)
![[Diagram]](../../diagrams/15/b283093acde4d6bedba14babe2bcaefb.png)
![[Diagram]](../../diagrams/47/b0ca49d37e1ede13fb5d703ba6137e5c.png)
![[Diagram]](../../diagrams/14/9ac7db34e5f5c6dd810ca4043ff14547.png)
![[Diagram]](../../diagrams/21/df04daf05869c69dbccfc694211b87ce.png)
![[Diagram]](../../diagrams/39/b700cdf9e90354c7dc055e6aa2151b22.png)
![[Diagram]](../../diagrams/27/4ed2a7ae0fa3f832ef5f21d3e55fc0ce.png)
![[Diagram]](../../diagrams/14/d4095ae30dc9add65865d385463e05bb.png)
![[Diagram]](../../diagrams/3/1e7bf7e19704e2aa1dad0b27e3d80759.png)
![[Diagram]](../../diagrams/38/e1a05b1fa43293ab10ceb4abbd73ccab.png)
![[Diagram]](../../diagrams/14/8c868c3c9711360707623bcc11a11625.png)
![[Diagram]](../../diagrams/29/e483389f3891e0e8259f6df9ddb3fc95.png)
![[Diagram]](../../diagrams/36/455fd1cb2932b06f4cb20a834b80616d.png)
![[Diagram]](../../diagrams/28/7bc556d36ee05ace51173838add8e752.png)
![[Diagram]](../../diagrams/34/2fb1af61aa50ad9c4f917060793da6f8.png)
![[Diagram]](../../diagrams/47/37497e33f21ebae7b511adb2ef94e7ab.png)
![[Diagram]](../../diagrams/51/df3ffe840dffa26b494fec208c6d0317.png)
![[Diagram]](../../diagrams/1/8424c813fd6b38dc90faaab5f822d6c3.png)
![[Diagram]](../../diagrams/3/20a9e0958271bbe037ad105698793907.png)
![[Diagram]](../../diagrams/50/09d92e4438193d25d030049c319d06a9.png)
![[Diagram]](../../diagrams/5/80fb1cae8e579ed2228ab6e7ff01bb7d.png)
![[Diagram]](../../diagrams/21/05f68ba77352160d3d03b5bb40550006.png)
![[Diagram]](../../diagrams/34/93f41db7476afa9763bab128406ab27f.png)
![[Diagram]](../../diagrams/20/ad5bf01d3c0046b506e985c588699ef4.png)
![[Diagram]](../../diagrams/48/b3ff6435c74ab6e1a8f12c20224a3bb4.png)
![[Diagram]](../../diagrams/21/b39ea6dbb0b1f985e77a9a8927c28ece.png)
![[Diagram]](../../diagrams/5/8eb87b345360fc9568632ecb4c919a77.png)
![[Diagram]](../../diagrams/5/b4ececf1b0254463322cf91dd4993b62.png)
![[Diagram]](../../diagrams/47/002445e7ecbad2745cddd836813abf93.png)
![[Diagram]](../../diagrams/31/aa49c2db5c3a7785f9a04be47730f6c2.png)
![[Diagram]](../../diagrams/44/61f8b804a9b38fb421a032db56013abe.png)
![[Diagram]](../../diagrams/45/2bddff43a7e852a3d6c6e9bff21cfdd6.png)
![[Diagram]](../../diagrams/33/e11022699a000992289d8f982406b2aa.png)
![[Diagram]](../../diagrams/33/4d522c0d34049e947e119be57387ce8f.png)
![[Diagram]](../../diagrams/47/60cfaeb4dd0b4583363ff1c95ea9499b.png)
![[Diagram]](../../diagrams/51/d7990b47fd7f707fb91bea5b52888b2c.png)
![[Diagram]](../../diagrams/3/c3dc34314e94cb97ce371f9b2d8a3bea.png)
![[Diagram]](../../diagrams/19/9fd72f58877bdedd9949f05f082b864e.png)
![[Diagram]](../../diagrams/24/a757d9a5c88775c6a3951d8119c2bbc0.png)
![[Diagram]](../../diagrams/9/d6f220daf3376b77d2bf24019054bd53.png)
![[Diagram]](../../diagrams/39/fff14fd92895f75ae403c312fd7226f3.png)
![[Diagram]](../../diagrams/33/8b241981db54b1426d5599d3ceff4842.png)
![[Diagram]](../../diagrams/16/e682676430946b440aee93272f853af7.png)
![[Diagram]](../../diagrams/28/24504d8f2f7598b2e9e684020b1cc9e9.png)
![[Diagram]](../../diagrams/9/ad94443e7e724901a45916fbaee78e3d.png)
![[Diagram]](../../diagrams/26/46a14f476ca4867e600c6ba6d8077c9b.png)
![[Diagram]](../../diagrams/48/5a3ea9cfa6fa4cc4d9c3ec10951de7b1.png)
![[Diagram]](../../diagrams/44/f51998825213bab3ae71f076f3537122.png)
![[Diagram]](../../diagrams/27/40b5d264a42d58187e1f40c6db39dcf0.png)
![[Diagram]](../../diagrams/52/def4858cb0aa5c0bac6980df55041411.png)
![[Diagram]](../../diagrams/32/04c4a03ae9167ce4d86c602fc79d0d24.png)
![[Diagram]](../../diagrams/43/043df18f6e63a541e92107e2706cbdfa.png)
![[Diagram]](../../diagrams/30/04de97035e1b19da3f593b6b9d6cb1e0.png)
![[Diagram]](../../diagrams/23/a9c635f4a8cb6039dfef3b9877fbcb2f.png)
![[Diagram]](../../diagrams/2/5836dff4a2d7994db7e664f0da006cfb.png)
![[Diagram]](../../diagrams/19/162a5c7de308c94d85e53a04402da12c.png)
![[Diagram]](../../diagrams/38/62f25e8e84d29fb69990e60141918ef6.png)
![[Diagram]](../../diagrams/51/73a34c4213a7b5ad170f348e15156e1c.png)
![[Diagram]](../../diagrams/44/e03630bf144d97c0038a84bc975d0c20.png)
![[Diagram]](../../diagrams/45/51d49ff9c0c0c48a98b25d7fe7e7890a.png)
![[Diagram]](../../diagrams/2/bdef39ec405e2b395006514218973eb4.png)
![[Diagram]](../../diagrams/12/9cc7569c49fbefcf109a5fb61bf18ee0.png)
![[Diagram]](../../diagrams/28/6c7b2c071cb8a3914d2b443cd45c2379.png)
![[Diagram]](../../diagrams/1/64e3e531f82b5262d123480f53ad6a00.png)
![[Diagram]](../../diagrams/9/574d7b0b98d5154b6539b336637b055a.png)
![[Diagram]](../../diagrams/42/922d38367213a92c70ed251b6ee90c07.png)
![[Diagram]](../../diagrams/2/1c4c420cae9f504c7921a27c03d80c0c.png)
![[Diagram]](../../diagrams/13/d301e6ba9e43caf2eb19cd4f13b8ee13.png)
![[Diagram]](../../diagrams/45/d8356978cd9c54fb6a1ae6151abb0155.png)
![[Diagram]](../../diagrams/8/aa0ea546c9c1d1b12d75060d2b63908c.png)
![[Diagram]](../../diagrams/5/ee768075d1581017da91f292ed5b0d7b.png)
![[Diagram]](../../diagrams/31/efae542ff137a28931ed8db79dd7f150.png)
![[Diagram]](../../diagrams/15/165a6306f05545d1b8c9a06d056e8da5.png)
![[Diagram]](../../diagrams/1/e6ffe6e3d1985525696ff48d935a5ad1.png)
![[Diagram]](../../diagrams/50/0a55ba2fb2b88bf465eeea5bf92380e4.png)
![[Diagram]](../../diagrams/31/3d455c357da184e33bbc39b0369e7854.png)
![[Diagram]](../../diagrams/1/21a84127314d70513dd568aaa8d707d7.png)
![[Diagram]](../../diagrams/44/68c0f43848d2ff7029ae4e2510469a52.png)
![[Diagram]](../../diagrams/16/ee48c197491f9118923e7f2591aef735.png)
![[Diagram]](../../diagrams/11/5e4ddbe90ab66250eeffd4c000c46977.png)
![[Diagram]](../../diagrams/21/2772f049a0ea73257e36c23f0d95d1c9.png)
![[Diagram]](../../diagrams/21/f416af8bf7c30922a4e4f7766ddc1f1f.png)
![[Diagram]](../../diagrams/22/8c779410b59c24874a3caf5a62ac1083.png)
![[Diagram]](../../diagrams/2/3b19a18d9cd66f9dba0224ef0b49f39d.png)
![[Diagram]](../../diagrams/46/99e8a02d63a14cdb5051e53f5cca82b2.png)
![[Diagram]](../../diagrams/40/e7d6a97cb0b31b05955d5504fbe1d21a.png)
![[Diagram]](../../diagrams/50/3430dc530e9c7f04eb754a1c18f73b5c.png)
![[Diagram]](../../diagrams/19/4b71c29a779810b062c49dbbdbaeb42c.png)
![[Diagram]](../../diagrams/49/3706859ffcbce6e1ce5e26e457d10797.png)
![[Diagram]](../../diagrams/12/27a9ec46e81271d1baee0f4d5c52f02a.png)
![[Diagram]](../../diagrams/33/a2c136c3eafd6e21f67f3b4b0ef1d227.png)
![[Diagram]](../../diagrams/36/a7d9e95aa30ddcf543805bd512364187.png)
![[Diagram]](../../diagrams/15/98d5c547a06e6112278a77b410d78dce.png)
![[Diagram]](../../diagrams/11/081c72d6b1d686858483729f02df7f37.png)
![[Diagram]](../../diagrams/12/64b1f7693d17cf07534ef9e8ef4d58ff.png)
![[Diagram]](../../diagrams/52/ab2bf22e9e01def9f4a4ecc3568ee016.png)
![[Diagram]](../../diagrams/6/5f2ab5030af33ac6e3be26139283c72e.png)
![[Diagram]](../../diagrams/32/40793de32748f168ebfcfe6b9be8cd41.png)
![[Diagram]](../../diagrams/13/b93f125b408e5254867213e727ece1d8.png)
![[Diagram]](../../diagrams/29/7843b8224244fe1b7daf55f7144a05b2.png)
![[Diagram]](../../diagrams/16/db64c485ec9a28c0cf3209eda26764e7.png)
![[Diagram]](../../diagrams/12/1ea4b2c588fac42de9ea10f52b1488de.png)
![[Diagram]](../../diagrams/50/e5ea501703a5bb10e384ccb4a5d2a299.png)
![[Diagram]](../../diagrams/9/6e1dc18ea0f150c5ed57812a3e897724.png)
![[Diagram]](../../diagrams/17/43540940b426039cf4a99c89be9a4599.png)
![[Diagram]](../../diagrams/19/cdd76fc8796f83357a83b55cdc956a80.png)
![[Diagram]](../../diagrams/33/bfbef99afefacbd68a90708c3710a2a9.png)
![[Diagram]](../../diagrams/6/bc0d89f3556e87c6b8171d1a38ed43f8.png)
![[Diagram]](../../diagrams/8/074def52593b35a9c3fa11300649e645.png)
![[Diagram]](../../diagrams/12/dd8bb569788ce19e55706af7f3579f98.png)
![[Diagram]](../../diagrams/1/d0f0028c14bf6de55eb23ecb32d22f28.png)
![[Diagram]](../../diagrams/8/40a9162bd8ca1fa76e06d20a6d208dbe.png)
![[Diagram]](../../diagrams/26/a5878f5ceb84bee7b12d94932d573f85.png)
![[Diagram]](../../diagrams/32/955cfa9bb15534a4f5aee7fe1c9b9df8.png)
![[Diagram]](../../diagrams/30/18907940a67952d3fbd814979635e8e8.png)
![[Diagram]](../../diagrams/12/68ded5ed165462b3cec0e25a10d9106a.png)
![[Diagram]](../../diagrams/42/d1e0671f8e2b85d4b4af0a7fe722dadf.png)
![[Diagram]](../../diagrams/21/d6dc43a5438f6c10e2ea22b9695118e5.png)
![[Diagram]](../../diagrams/8/9ac894ddc1684cf86ca90bef4d83cb16.png)
![[Diagram]](../../diagrams/16/f49f3410f145201e729cb7b0d89e652a.png)
![[Diagram]](../../diagrams/19/d916f600019404681e9008408bdae02c.png)
![[Diagram]](../../diagrams/21/8e75e286b61266c95a1d43d0e25eaf9f.png)
![[Diagram]](../../diagrams/34/6f10d5315d991b483f34fb7255626c42.png)
![[Diagram]](../../diagrams/35/8a2a7966b93b501ee18d90eeaa9cd869.png)
![[Diagram]](../../diagrams/39/50c3699fb01ee508aa301a5cfd54a54d.png)
![[Diagram]](../../diagrams/21/b3a5b8c85fe6f18e032c659d06132395.png)
![[Diagram]](../../diagrams/33/7a39847fd6ab0f3a655a4c76e75514b3.png)
![[Diagram]](../../diagrams/4/4a15f0913c584b64e961bb73a09afc05.png)
![[Diagram]](../../diagrams/45/39ba580d231f02eca82fa9dbd0577ffc.png)
![[Diagram]](../../diagrams/27/f4e55aa552741c3f67ca2555b15f83fa.png)
![[Diagram]](../../diagrams/11/33de146b9f2a750d139695bc3bffa7b0.png)
![[Diagram]](../../diagrams/26/f6ce34389f9783c59b3bf4063c004eab.png)
![[Diagram]](../../diagrams/14/c6610eb0f1cb245fedf6ec7f3a7fa4c3.png)
![[Diagram]](../../diagrams/52/9c1928706bf7ed640273e71c1a6fd318.png)
![[Diagram]](../../diagrams/35/ff3f269261504878980fb47d4b6a7f45.png)
![[Diagram]](../../diagrams/36/33351eb1e1024534b86a4e5355627902.png)
![[Diagram]](../../diagrams/50/1523432d631eb5b4ce7ced478a002558.png)
![[Diagram]](../../diagrams/22/eb0a83dc25940ec9d33280b587e9868e.png)
![[Diagram]](../../diagrams/40/124539f7fa5598ff088811a67e1f50fc.png)
![[Diagram]](../../diagrams/43/850c68ea641428c6649d865758977896.png)
![[Diagram]](../../diagrams/13/b080476d0670eef721a281ac4a458663.png)
![[Diagram]](../../diagrams/35/139b303bad7a6a1e226aec8506569345.png)
![[Diagram]](../../diagrams/34/61241a2f39203ff93e3839d93d280d6e.png)
![[Diagram]](../../diagrams/50/8e4b54b2364529879f2dc7a0345d3586.png)
![[Diagram]](../../diagrams/20/8cf4514d3d79160b8bce6e4cbb2b4ac1.png)
![[Diagram]](../../diagrams/2/8a175a4217772555bab1afb82a8cfd6a.png)
![[Diagram]](../../diagrams/21/8051eb8fae8c2543204b30f2555bf521.png)
![[Diagram]](../../diagrams/49/d44d1c0682b73b5ca6d1efe9f9bd8c19.png)
![[Diagram]](../../diagrams/32/34a2d189c9712ff1960853cc03f22b61.png)
![[Diagram]](../../diagrams/45/328bea39c81788fa0be802b78dc830e0.png)
![[Diagram]](../../diagrams/0/c66293c8add5c2dd68253767fb0f1a86.png)
![[Diagram]](../../diagrams/11/8c2c578e80c5e7f52163b451556d6250.png)
![[Diagram]](../../diagrams/14/61947aab74f7683818b0739f067e1ef2.png)
![[Diagram]](../../diagrams/29/e22f8baa1d9321584207e6c1c889b2d2.png)
![[Diagram]](../../diagrams/44/5be6e338bdc32f147069a258414789b8.png)
![[Diagram]](../../diagrams/42/8372cc75ea30d444fc78be456b93202b.png)
![[Diagram]](../../diagrams/8/3e0b7be719e27c6b1deebc6767ca70c6.png)
![[Diagram]](../../diagrams/17/b54229efe35fb4751d13277815807673.png)
![[Diagram]](../../diagrams/11/3ab29f398d4b7f1fc5b41a5518762aa8.png)
![[Diagram]](../../diagrams/18/3b09e2d62bc8f4d6527cf26b8e14561d.png)
![[Diagram]](../../diagrams/37/cc40f2312a323bddf9f329df3209215b.png)
![[Diagram]](../../diagrams/4/b6fede4b96973b8f4cd8c038a5fce090.png)
![[Diagram]](../../diagrams/45/d8376995fbf931cb7e50c78e64506c56.png)
![[Diagram]](../../diagrams/14/e3a14da4c6846a8e70f5196fb4bdd260.png)
![[Diagram]](../../diagrams/28/15d54a43cf1fad347f80ca029f766277.png)
![[Diagram]](../../diagrams/47/070c9910f0de6ce6660c7ab6d98a135b.png)
![[Diagram]](../../diagrams/4/f54d52defec3326a8101b418e8306de1.png)
![[Diagram]](../../diagrams/29/e01116f8cd57f5c77cfcbea0b649d6e6.png)
![[Diagram]](../../diagrams/8/047f93c38fa9b70141f0ae34d08f5aa0.png)
![[Diagram]](../../diagrams/19/1627892f728bd13c789dea69856c78e9.png)
![[Diagram]](../../diagrams/52/eaff5ff983ac848d1ab2d34fb66de82b.png)
![[Diagram]](../../diagrams/20/6ba87a59201587f8c413aea7e3190f81.png)
![[Diagram]](../../diagrams/25/b8bb78611ec8e8acd1b0a6e93392a724.png)
![[Diagram]](../../diagrams/10/1ca9985fa6e1e6d6d5827083846ca4b3.png)
![[Diagram]](../../diagrams/40/160e8fe5d1bb7516458421ed08407690.png)
![[Diagram]](../../diagrams/36/cf2d02de4a671546337a0c4be43224ec.png)
![[Diagram]](../../diagrams/3/fb04b3df0acd4ae9a9127810acd16145.png)
![[Diagram]](../../diagrams/30/091a9640460a6d5c9bf2bee2030f13b6.png)
![[Diagram]](../../diagrams/33/b7cbe977371455616ad9c52ff4dfc174.png)
![[Diagram]](../../diagrams/47/5c53049689485b7adc719e3fcd9412e7.png)
![[Diagram]](../../diagrams/8/88b42a22267ec260aa5e5780e9c4ce9c.png)
![[Diagram]](../../diagrams/46/0d3b00558e13a451dd3f112dd4314d7b.png)
![[Diagram]](../../diagrams/11/cb37225fdbd19fa5a7c33cf4a34c8b08.png)
![[Diagram]](../../diagrams/11/60afa590cc19fbadc53f8ba5e4b3b6f0.png)
![[Diagram]](../../diagrams/20/5d0136af5138618d11b8a50ac83816d6.png)
![[Diagram]](../../diagrams/13/33660d934718ec8787b244776f2c0db6.png)
![[Diagram]](../../diagrams/52/32598b15fa6fafe194c54c1a41950ab7.png)
![[Diagram]](../../diagrams/48/0b1e032abf88d54206a080c94c0c90fc.png)
![[Diagram]](../../diagrams/22/2c5d602209482924c8df6dc4b0ec510e.png)
![[Diagram]](../../diagrams/2/4298741a44c6172a989d7dd2738bf5bd.png)
![[Diagram]](../../diagrams/47/c4a98869200b42fc7502d6f58be9a163.png)
![[Diagram]](../../diagrams/19/fab9a64fa78c3b9cb14389ee6bef5067.png)
![[Diagram]](../../diagrams/36/c109b8af2a1c53b6d5699f88abbb68e4.png)
![[Diagram]](../../diagrams/44/dc61fae9f1bc7b1d8a17d8baabc4c893.png)
![[Diagram]](../../diagrams/40/32adc89d9640a5d280821287777af57b.png)
![[Diagram]](../../diagrams/41/6cb252df63e07ea7fca78a4afe08fc67.png)
![[Diagram]](../../diagrams/17/66d6e43c3008b0693f62ce135cff7943.png)
![[Diagram]](../../diagrams/38/3f05b1334e3ab657e2b58d64049345c9.png)
![[Diagram]](../../diagrams/47/7fa15119949c3c1183a28ec03daf24e1.png)
![[Diagram]](../../diagrams/47/12c297ee5761d051e2015f20fa671daa.png)
![[Diagram]](../../diagrams/18/a8960ab5422e8ed07b81ce12edb4301d.png)
![[Diagram]](../../diagrams/10/656354e31365ec12989cd767bb96c63e.png)
![[Diagram]](../../diagrams/38/506198652daba28770bfa97729b014ea.png)
![[Diagram]](../../diagrams/47/b603c345890643a4c25f9d2e1a6b5a32.png)
![[Diagram]](../../diagrams/46/2055b76f198f3897be0509528b490f3f.png)
![[Diagram]](../../diagrams/42/335771f3bec1272badc6d454ecc30eb2.png)
![[Diagram]](../../diagrams/6/674c415de9be2dabb624cbdc01973003.png)
![[Diagram]](../../diagrams/31/70716bcd9d1d4c709454670b3ad15a05.png)
![[Diagram]](../../diagrams/43/ea92149d40eae0d37e8d44083fafdd93.png)
![[Diagram]](../../diagrams/28/39ba86dd527995593dd3eeab455e0720.png)
![[Diagram]](../../diagrams/38/44a970cbf71d2c0f9f8168a267ea05c3.png)
![[Diagram]](../../diagrams/0/9b401f97a05be504bc9d711e9899d008.png)
![[Diagram]](../../diagrams/8/ae6b44f2ba891f86f5e9e005be8b1f6d.png)
![[Diagram]](../../diagrams/20/0c5bdb56aa89a6539548e7828e15eaf6.png)
![[Diagram]](../../diagrams/10/1c9f00f3480d00059bda77560d3088c8.png)
![[Diagram]](../../diagrams/6/497402c8b4918638f49a4341ad8949bc.png)
![[Diagram]](../../diagrams/41/ca04fd8e7f98714bdc26a2d8be14dc0b.png)
![[Diagram]](../../diagrams/51/6645b6598f912840cc8d966a00ab17df.png)
![[Diagram]](../../diagrams/46/a86e6d12a2575584ce3a580875d72709.png)
![[Diagram]](../../diagrams/50/65a8c72d2cd8518a078e2e19efa5a6ec.png)
![[Diagram]](../../diagrams/47/81cb841160f5e92cbb04125a8eea2083.png)
![[Diagram]](../../diagrams/37/9dc6db3d631e1f51b7fb44ce93b647ea.png)
![[Diagram]](../../diagrams/3/2767b363b6957ae3c075fc74d2503033.png)
![[Diagram]](../../diagrams/14/b111bf77a4347e5aa194c6672e385b55.png)
![[Diagram]](../../diagrams/29/433abfe9a5e57f93324c676168c1bc64.png)
![[Diagram]](../../diagrams/10/07541b2f5cf7c7dd5586da083d39a032.png)
![[Diagram]](../../diagrams/9/8c44453efbc7b3e76adbc73fc53ba900.png)
![[Diagram]](../../diagrams/10/7ec842226b7d4bcbb99ed59b5e496d2b.png)
![[Diagram]](../../diagrams/24/4709a63b11affb89b1f02cb9e7235fbc.png)
![[Diagram]](../../diagrams/8/0d3fc19298b786460f8bce0fb377076c.png)
![[Diagram]](../../diagrams/52/f54b1b0628bf836ae92d0d33a123b2b9.png)
![[Diagram]](../../diagrams/10/b6d66caf0f8228ffb16db2787f0aef12.png)
![[Diagram]](../../diagrams/38/fe3b03582478292fe13266478f2bd4bb.png)
![[Diagram]](../../diagrams/1/ec5ab9767d267963860cc21e79a33e18.png)
![[Diagram]](../../diagrams/26/dc170ad0e1d3f7ca232ab06285b3a7bf.png)
![[Diagram]](../../diagrams/2/794e8a535f51c7ebf1a1a076d9eb0e31.png)
![[Diagram]](../../diagrams/10/8a82a7369c9fe19c05199880356429fc.png)
![[Diagram]](../../diagrams/7/676e0aae8b2d3217c3d3dd9e92d34fa4.png)
![[Diagram]](../../diagrams/52/dd675887751f40ab42eb5b5bdc8d95bd.png)
![[Diagram]](../../diagrams/12/c6730f1df235fb7c885667d4aa31a07d.png)
![[Diagram]](../../diagrams/3/d68984c0b63fe72f81e2f003c848110e.png)
![[Diagram]](../../diagrams/10/02bbd7b5d33c14d5468b51fc54959da6.png)
![[Diagram]](../../diagrams/30/d579c45ab7378e115027a68d12c69d1f.png)
![[Diagram]](../../diagrams/24/b1e72f6cf91d54f9b9f9effd1023de24.png)
![[Diagram]](../../diagrams/14/ce59897ab9db3980ae79a98cf3682288.png)
![[Diagram]](../../diagrams/26/0f6bea8ee946ca447bf87b4afd1cb38b.png)
![[Diagram]](../../diagrams/46/6416dc5c5a31dd174e95ff19c427243d.png)
![[Diagram]](../../diagrams/6/2afbeb5cec02df5af64b663a9c92e590.png)
![[Diagram]](../../diagrams/42/18576ae90b4b21800f63636a6c3f2547.png)
![[Diagram]](../../diagrams/6/33155e1f085b56ca38a6087b2eda61a8.png)
![[Diagram]](../../diagrams/12/4c8434cd3497fcd4d4cd114b4ee72a0e.png)
![[Diagram]](../../diagrams/16/329792c7b4b44222b6114f20af88ee1a.png)
![[Diagram]](../../diagrams/37/c02936a38e59e7e9b2a9d39ab9a6531e.png)
![[Diagram]](../../diagrams/35/5bc30133377f19a5ca1640dafdb33610.png)
![[Diagram]](../../diagrams/34/0a556f02c8fc24058f703f84bbe69200.png)
![[Diagram]](../../diagrams/21/0d4a1ff296bb4f623780e09a86c01379.png)
![[Diagram]](../../diagrams/25/3f419e8bc323b7ca863c10d95aac734f.png)
![[Diagram]](../../diagrams/18/4019e82dbc3f22b3e4b6634a7dab966c.png)
![[Diagram]](../../diagrams/7/9d4c63c40cad3126713757610119675a.png)
![[Diagram]](../../diagrams/34/2ac000d1106add67bad3eeabfb5e91f1.png)
![[Diagram]](../../diagrams/30/80827d95a3044529ca2cbbdc12d611ac.png)
![[Diagram]](../../diagrams/31/b39fb140c5b842664ffea9251b032aca.png)
![[Diagram]](../../diagrams/14/05eab67e12ee5ac9c2807e1ce6372b84.png)
![[Diagram]](../../diagrams/32/a0c2bac2c7cd3fc87cb0dd4e9c976cae.png)
![[Diagram]](../../diagrams/37/815927753f3d60c6176e470f3f2710f4.png)
![[Diagram]](../../diagrams/44/ca9b8a976df8f96ab6d50654b0478a55.png)
![[Diagram]](../../diagrams/34/e6486d4be32f88231de81fb1a3b6d38e.png)
![[Diagram]](../../diagrams/49/c67ab131cb07127ad76ec1247bd399b2.png)
![[Diagram]](../../diagrams/21/0c093167f929425d136adc9c9487a292.png)
![[Diagram]](../../diagrams/8/f4cfab87081d84c3a3407ed9e48364ad.png)
![[Diagram]](../../diagrams/14/37cb87bb95cfbbaf7191d6efad96371a.png)
![[Diagram]](../../diagrams/36/37e9508675bad2e01afcc176a780aff1.png)
![[Diagram]](../../diagrams/4/2000873d8965619258509f4174499f6c.png)
![[Diagram]](../../diagrams/8/75c45fd5da00950e7bea59257ae75372.png)
![[Diagram]](../../diagrams/5/7f99404809c4bbd21b458bd1032fd406.png)
![[Diagram]](../../diagrams/21/80764e901153a274ba622dc1801d5ec8.png)
![[Diagram]](../../diagrams/27/02d01815e0f421130bc16717f5e54fb4.png)
![[Diagram]](../../diagrams/41/744c82e82e12c81fcae5214f7b4039c2.png)
![[Diagram]](../../diagrams/16/4c5d5a3506039ae6ef5c0abe31ea0f4c.png)
![[Diagram]](../../diagrams/40/9872c5d200e34890afbbf3f8f76f20ce.png)
![[Diagram]](../../diagrams/52/86704a1466e908c6c843e3c19de6c802.png)
![[Diagram]](../../diagrams/40/9bfcedff5f638fe4567104903dbdaff6.png)
![[Diagram]](../../diagrams/21/bf281db2d0afe7806a4ea83da263e9c1.png)
![[Diagram]](../../diagrams/15/42c64ed1ef8c19c112721fa897238321.png)
![[Diagram]](../../diagrams/24/ec906c5f7d5fc56287fe6f0528691ec1.png)
![[Diagram]](../../diagrams/22/b2739dd0445d392a5765fd3e0dc689c1.png)
![[Diagram]](../../diagrams/32/0611bb34238e7768eda34546c9ea1009.png)
![[Diagram]](../../diagrams/7/7e4dca403a25ce71dbb0de20d179e71a.png)
![[Diagram]](../../diagrams/21/30ba111d84622c620fd53503c905ed5f.png)
![[Diagram]](../../diagrams/17/dbd30e0be9f465b0a4fd07c871455119.png)
![[Diagram]](../../diagrams/44/02de483949a7d0a5aa7f781f5cfb5d0d.png)
![[Diagram]](../../diagrams/39/b1fa4223003d26e167f4c7cac6d74121.png)
![[Diagram]](../../diagrams/45/cf5c0fc8c1c694cd6e1b81691b0332ea.png)
![[Diagram]](../../diagrams/42/824ac241cbb6d409f9c019c274ed40f8.png)
![[Diagram]](../../diagrams/11/3cc73ba6b6739e9f0c0ab54ab9255c1f.png)
![[Diagram]](../../diagrams/30/c9fb41997fa4f1b05ad9838e1142760e.png)
![[Diagram]](../../diagrams/15/8999a88fd215d78f95e2c890f8c5f8c6.png)
![[Diagram]](../../diagrams/31/82d08586b9dbd116b3ea730a9d2b4fdd.png)
![[Diagram]](../../diagrams/11/9dd705cb06434446e4c50064dff70a4c.png)
![[Diagram]](../../diagrams/7/31f4c69a88e3d1e2c984e00dfd6ae122.png)
![[Diagram]](../../diagrams/39/266aa5c027b80a3ceed6d692a29ea973.png)
![[Diagram]](../../diagrams/3/da95ed3d403580b41e83679ee540583b.png)
![[Diagram]](../../diagrams/26/2cbd26f7c6a703d0a2fa3f54d193d2de.png)
![[Diagram]](../../diagrams/39/14527940a22d8ced7ff00981c1fd1de5.png)
![[Diagram]](../../diagrams/13/8799925c102456df2ea7e14727c994e1.png)
![[Diagram]](../../diagrams/20/deab2716e41450475411c365bf28c4ce.png)
![[Diagram]](../../diagrams/43/fd1be5ca34e4d53c4424a9e4f699ff99.png)
![[Diagram]](../../diagrams/40/604733aacc87375931a0ce5e81dfc3c3.png)
![[Diagram]](../../diagrams/47/2ad74d091125ce014da1d472284fed9e.png)
![[Diagram]](../../diagrams/20/0b99dea388347811c1deba67fa5ab27a.png)
![[Diagram]](../../diagrams/7/1e333f2a76f6b93ba6cc27997fa67d5e.png)
![[Diagram]](../../diagrams/36/2724c338a834ad5f808f0255baa39765.png)
![[Diagram]](../../diagrams/19/fcbec57cbf45f2245881f785beb87697.png)
![[Diagram]](../../diagrams/38/60f02c844dab786752b7d03895c0eb0a.png)
![[Diagram]](../../diagrams/36/55b292501a4a86228b00ed5db2fb2218.png)
![[Diagram]](../../diagrams/8/dcea30eed617ff731e660f5e46ca19ac.png)
![[Diagram]](../../diagrams/38/94e9f20ca2384e434ac0e4854d10bf91.png)
![[Diagram]](../../diagrams/44/e96a1f9437079778d60d36c2471a26f4.png)
![[Diagram]](../../diagrams/10/38bfd793adbf3ab5cd741698e8b75b3a.png)
![[Diagram]](../../diagrams/33/13296a1006325e07f51d2303745577f6.png)
![[Diagram]](../../diagrams/52/4859bc53e0010de567ebe829f0be68b4.png)
![[Diagram]](../../diagrams/42/c6a7b949a64a9551c7d5391f4e7a527a.png)
![[Diagram]](../../diagrams/30/0d93542498df5548070a06c87d4ef82a.png)
![[Diagram]](../../diagrams/45/f36028e6c7f183092659c0f7f74f902d.png)
![[Diagram]](../../diagrams/11/a365825f244f6527834cc4806f6a82a2.png)
![[Diagram]](../../diagrams/37/4aaea0546f4feb85764a1d449b836d31.png)
![[Diagram]](../../diagrams/34/0c4b8b941c53485dc0b28d96e28340a0.png)
![[Diagram]](../../diagrams/31/2fcdc5adf424dae0b01662dcc2fdf780.png)
![[Diagram]](../../diagrams/11/aeef364d7a7f1a54f344349241211d14.png)
![[Diagram]](../../diagrams/26/8e3c0089bc1f506c0fac8435a7d76a97.png)
![[Diagram]](../../diagrams/13/1da810e9497db3bb59dfa36edd37a25b.png)
![[Diagram]](../../diagrams/6/ae6939ca4bc18f34d4e3cb8fd5624de7.png)
![[Diagram]](../../diagrams/3/1f972765fb8c6191532f8deef0b3abf5.png)
![[Diagram]](../../diagrams/3/24ca7eb6b3eb29d2beb09a738f61f513.png)
![[Diagram]](../../diagrams/37/0125361a41cb4b05d32e0536d7b0249a.png)
![[Diagram]](../../diagrams/8/3a772d90c7332c567fc4370860a1f6a9.png)
![[Diagram]](../../diagrams/41/605d1bb0326ee3ad112867b7bb3e68f7.png)
![[Diagram]](../../diagrams/14/5d73c8f79ff64e1047ec3dbd98126169.png)
![[Diagram]](../../diagrams/14/1e06434fa551421c7dca4b2f4f405370.png)
![[Diagram]](../../diagrams/0/c730af3aa7c138107659d4606febb603.png)
![[Diagram]](../../diagrams/27/ad821a78cb2761511b4be0322a723a92.png)
![[Diagram]](../../diagrams/21/6220fc9c7ac34b36eb3f305c098aa255.png)
![[Diagram]](../../diagrams/41/92c6214111e2276916e1471a0e5273d0.png)
![[Diagram]](../../diagrams/29/01c17d72df53d7fafcdbba0f371d34b4.png)
![[Diagram]](../../diagrams/48/9b4d4c4a9a58e7da276c1c79f9cfc439.png)
![[Diagram]](../../diagrams/9/a933f0399d84500986e74b009f71e838.png)
![[Diagram]](../../diagrams/3/deaa9ddb8887bf7bf72f938716c002dc.png)
![[Diagram]](../../diagrams/40/f517fec9ff16ac86c993c04b3d1047d4.png)
![[Diagram]](../../diagrams/52/d1c1c866171379bc840b16c303166a6d.png)
![[Diagram]](../../diagrams/14/025c4dbe84083fe0b3e1ae021237f755.png)
![[Diagram]](../../diagrams/4/86497182636a9089b3b3cdadc7db9020.png)
![[Diagram]](../../diagrams/0/26b7a200c0b9b4ab433c92050ab3e9cb.png)
![[Diagram]](../../diagrams/23/d189a8c292b260edb00e4a9cff0151ad.png)
![[Diagram]](../../diagrams/22/f0565a63074adaf3ef9d0bddd5ba6b25.png)
![[Diagram]](../../diagrams/28/4f4198853776743a8e09f37507c349d4.png)
![[Diagram]](../../diagrams/31/c8331d39fe956586bf740a1e01e7248b.png)
![[Diagram]](../../diagrams/10/64665a0b4aee8e98e5976164d3ca0a97.png)
![[Diagram]](../../diagrams/45/948af58b782077fb7844f02a80e058b9.png)
![[Diagram]](../../diagrams/52/6d6ccda9e84fc3f5a35d8b4b48bd7b6d.png)
![[Diagram]](../../diagrams/11/9a150549e88ec06b844fcfb5c5601cce.png)
![[Diagram]](../../diagrams/48/d84842520d697a5b14cf9720fc81c3c8.png)
![[Diagram]](../../diagrams/26/e8b1235e455626d84dba8cfb4ac95d32.png)
![[Diagram]](../../diagrams/2/6fcf6be7926096efc18c160270b74b23.png)
![[Diagram]](../../diagrams/20/f1a58f438cc6a3836ad62edfc2cd9fc3.png)
![[Diagram]](../../diagrams/29/7ef813d84cae74ed9c049b13b5b53230.png)
![[Diagram]](../../diagrams/10/ea11ae4032478f97fd7f675effd08ed1.png)
![[Diagram]](../../diagrams/6/c800e554a7662fa62ed3e8c63b5cb063.png)
![[Diagram]](../../diagrams/1/12848865a1c0224e0c70aa0b1a4fcb9f.png)
![[Diagram]](../../diagrams/51/6dfeba6713ca6309c309b33723c148c3.png)
![[Diagram]](../../diagrams/39/695ad84182518b9006b248c33d1e60d2.png)
![[Diagram]](../../diagrams/9/21890a3bd972e9a665f0d82e8429886d.png)
![[Diagram]](../../diagrams/50/340c9b5efd58c67dff7c5e10c0617264.png)
![[Diagram]](../../diagrams/21/4e09320203b5aa66e0acbe869c92a6ba.png)
![[Diagram]](../../diagrams/43/71b274b98ff1db556ba3b667cc7bf68e.png)
![[Diagram]](../../diagrams/10/2132d27a9e24438af55131e19f6f3236.png)
![[Diagram]](../../diagrams/0/ea4951ce4f529b24da3eb90cf90eb0e5.png)
![[Diagram]](../../diagrams/46/83179907d024aed90a15adb27b1a1433.png)
![[Diagram]](../../diagrams/13/a4080db0b45cb44283a1c93d25593da2.png)
![[Diagram]](../../diagrams/21/5b59cda988624271f51da2a263394089.png)
![[Diagram]](../../diagrams/30/4f082523aabfceeb0e11cd819e2fc5a0.png)
![[Diagram]](../../diagrams/41/9230d9d75928c4dcc6bda8a0d5337f55.png)
![[Diagram]](../../diagrams/19/f0db4d3c5020d8616e8fb6c858009772.png)
![[Diagram]](../../diagrams/40/67351ad134582f07e838e7e7520a3650.png)
![[Diagram]](../../diagrams/24/1c610183a1f949865016e0dbf1ff94ef.png)
![[Diagram]](../../diagrams/1/dd960c28be9e8c0dbb9edc393e5dba77.png)
![[Diagram]](../../diagrams/32/eda6ed013f1a7d087cb7ea7bd090d4ad.png)
![[Diagram]](../../diagrams/22/92163c5fe228388cf39f096557bfd839.png)
![[Diagram]](../../diagrams/0/6c187c6a599bd5239888f94391d7010c.png)
![[Diagram]](../../diagrams/41/22324dd08b224b5e1baa9e417ed7f47c.png)
![[Diagram]](../../diagrams/1/e5c1a524a7457e670d72e046ccd2f580.png)
![[Diagram]](../../diagrams/34/f246f1bd2c93a8a969017b953e4ef0e7.png)
![[Diagram]](../../diagrams/23/51d356bdbb67e7826bd21c6ab82423ab.png)
![[Diagram]](../../diagrams/19/60a7d0fc73a6f36649c61d1ba6a727b7.png)
![[Diagram]](../../diagrams/25/a0703431ebf197a937f7765ed6c1f075.png)
![[Diagram]](../../diagrams/8/570db858bf321cd2a3edac2f8a273d23.png)
![[Diagram]](../../diagrams/12/4a5767b1711c3de7354aa2ae71d2a4b7.png)
![[Diagram]](../../diagrams/9/d2ba4ad815ce6799774e90fed598e2c6.png)
![[Diagram]](../../diagrams/35/7d3322a9467a1afd9e2a82394c7371b1.png)
![[Diagram]](../../diagrams/36/49f48714641dcfcb098511d6a70b7749.png)
![[Diagram]](../../diagrams/43/471cbe7d4080c64165430d184860b571.png)
![[Diagram]](../../diagrams/5/23831123d7685ceffcaf7b0eab5bcc6c.png)
![[Diagram]](../../diagrams/47/6726bd4d1f01625f35463f304da2a673.png)
![[Diagram]](../../diagrams/0/d5f1797091d08d51e7fc920b2d107c6f.png)
![[Diagram]](../../diagrams/45/f3c707162c662c4cefc6bb7c4e5f53e8.png)
![[Diagram]](../../diagrams/16/bf5395383e72c9427525563e801c2502.png)
![[Diagram]](../../diagrams/36/eb9e7a3adc0e44693c1fc1a769ce1fa1.png)
![[Diagram]](../../diagrams/7/3faf87b16c99a8bc502cd3111b86f19b.png)
![[Diagram]](../../diagrams/42/8624b6052029c0ac94887a0e15dece54.png)
![[Diagram]](../../diagrams/52/85d812cefd4e656ff63b78f42c14edc4.png)
![[Diagram]](../../diagrams/49/a6655e408ea7d89f8e8ee6f4cc7655f6.png)
![[Diagram]](../../diagrams/35/5159ba14fe8842a3385617290a053fb7.png)
![[Diagram]](../../diagrams/14/fab6004dafcf9c2c54b26d9d6d226994.png)
![[Diagram]](../../diagrams/52/5571f1db9d9c761b0fb0f950c65a4989.png)
![[Diagram]](../../diagrams/48/f812e4238c677882015421ea09eb4d76.png)
![[Diagram]](../../diagrams/45/8400b40fa449617019172f590f7cc74c.png)
![[Diagram]](../../diagrams/19/3ea8d0dd9880a522416a81d11103dfc3.png)
![[Diagram]](../../diagrams/31/810679470dde5590d4733f578e418959.png)
![[Diagram]](../../diagrams/34/cb4d20a9671046df2c0969d56d0875b3.png)
![[Diagram]](../../diagrams/46/b0721a39df7fc3b703c490e260ab1c1d.png)
![[Diagram]](../../diagrams/24/00c45328aff0dda549aa884cf9da6768.png)
![[Diagram]](../../diagrams/32/2792383b4db6eab12cf7894b0e137d87.png)
![[Diagram]](../../diagrams/43/320085303b15d24ac49ad9a58540fe92.png)
![[Diagram]](../../diagrams/8/fb89ae8464285972873190910270f5b8.png)
![[Diagram]](../../diagrams/21/b236e129ebc2ff6bf8ac9f1b1699dd79.png)
![[Diagram]](../../diagrams/49/b5fb93cf24e9eb3bcb73904cada97786.png)
![[Diagram]](../../diagrams/9/1cc762f63f5f777a23760eb5c78b9bfc.png)
![[Diagram]](../../diagrams/28/1fd98790f62c2add3de65abccf309c3e.png)
![[Diagram]](../../diagrams/22/0f238a3119afce780684f9d8ad388848.png)
![[Diagram]](../../diagrams/43/ecdf704534fdc08aaaa2e57361dfbb38.png)
![[Diagram]](../../diagrams/27/4645296d9de24007cc5ddc001befe822.png)
![[Diagram]](../../diagrams/34/ea9ce377986d5147134d545da284429c.png)
![[Diagram]](../../diagrams/51/e0477c9b8aaabfae6127f535ec9b69d2.png)
![[Diagram]](../../diagrams/20/9e62c8bde581680b7380777fe83d2f66.png)
![[Diagram]](../../diagrams/26/c49f443e9fd6da92fd0a8a9e4763ec60.png)
![[Diagram]](../../diagrams/23/0245bb52a6736e5f448b1bbabc13f19e.png)
![[Diagram]](../../diagrams/1/92c6698c42656fe05abd748f3106fc42.png)
![[Diagram]](../../diagrams/10/6caad18b0af806cd7feb763cdc836859.png)
![[Diagram]](../../diagrams/23/b8ef75c12d3a61fbd5f788edbea9ce47.png)
![[Diagram]](../../diagrams/7/8c016f1906ab5307117c2e33908b7ca2.png)
![[Diagram]](../../diagrams/5/d5ecc88d96ad0be34f5998b6ed86cdca.png)
![[Diagram]](../../diagrams/40/2012c00a4fd04e64c36d77d388621e07.png)
![[Diagram]](../../diagrams/25/e018b0ca12715af4fad83c6d491728fe.png)
![[Diagram]](../../diagrams/50/e76422be7459aa8d1d97cc757b82adb0.png)
![[Diagram]](../../diagrams/3/1e15ae2d884ee00299fe4e76421596d0.png)
![[Diagram]](../../diagrams/44/bcf34c060697d08334bd812980a2f5e9.png)
![[Diagram]](../../diagrams/49/da8e5c631eef7428c93961105ab082a8.png)
![[Diagram]](../../diagrams/45/7cc2586af5b6dfa30b65b01090f2ab1f.png)
![[Diagram]](../../diagrams/50/99bbab44561ba91ec7f6a8be56449ff0.png)
![[Diagram]](../../diagrams/51/ddf19a372d1da0fec60086035c4205e2.png)
![[Diagram]](../../diagrams/16/1c3805f8250f4503c97898bf93849aec.png)
![[Diagram]](../../diagrams/36/070352cb036b1649d925cf9b247bc8ba.png)
![[Diagram]](../../diagrams/44/40b82e9ecde4532c5465d218b1437f85.png)
![[Diagram]](../../diagrams/34/552e2544a1dd2b3c3abbbd2cff45cd2b.png)
![[Diagram]](../../diagrams/27/05b8ee0b47ab912b00bc91e4b2d36715.png)
![[Diagram]](../../diagrams/10/b08ad96bd29516d459bd63d4641ab94b.png)
![[Diagram]](../../diagrams/33/443edc60dfc844e651665d1f3357c1a9.png)
![[Diagram]](../../diagrams/9/0005eeb7a547e4e7082087df271421bf.png)
![[Diagram]](../../diagrams/12/126d3da67eb79b8fcdebea4e4b3ca792.png)
![[Diagram]](../../diagrams/12/7ede67004eda5786c22367f49944ac8c.png)
![[Diagram]](../../diagrams/30/8b7cccb640a15ed120c45eaa2b3d06d8.png)
![[Diagram]](../../diagrams/18/a1b21f776b2ebffe7c1868ddb6e076c0.png)
![[Diagram]](../../diagrams/28/5c213f7585ce14a765f858f45ff35b73.png)
![[Diagram]](../../diagrams/11/970f47a44686d1037fc932507274d2b2.png)
![[Diagram]](../../diagrams/16/257b006b978fa8624d859e1d9e625e91.png)
![[Diagram]](../../diagrams/26/bec2bfd9d102b61a0d86908b2abaf214.png)
![[Diagram]](../../diagrams/17/36d119c466cddf69758ecdc6d7955c2a.png)
![[Diagram]](../../diagrams/4/f4d9af600819b8e7dd94b9c406dff8b6.png)
![[Diagram]](../../diagrams/42/db500e2d51af9b969922b3c49fa6f211.png)
![[Diagram]](../../diagrams/45/e771a8696431002cedf3449b28a94e96.png)
![[Diagram]](../../diagrams/23/e7805da1dca13620b87713de7bc7394e.png)
![[Diagram]](../../diagrams/42/2e5061f49c302afe7ddb6f4c7f868717.png)
![[Diagram]](../../diagrams/10/968e93ac1eaf533e6922f0b220125d82.png)
![[Diagram]](../../diagrams/10/964bf4581c784a763769b667e688438c.png)
![[Diagram]](../../diagrams/19/dc6fe71edb27c5650a357016a0a88521.png)
![[Diagram]](../../diagrams/42/70198b05b6839745ced45ce8df4bb318.png)
![[Diagram]](../../diagrams/12/b7f07e161ccc0babb8c8a4805fb4b552.png)
![[Diagram]](../../diagrams/3/81a239db1ce761f93701c7bd91017ce9.png)
![[Diagram]](../../diagrams/19/8017703e55dfec1161939d54bd19f110.png)
![[Diagram]](../../diagrams/39/0c58fc69c650ed561766040f59365610.png)
![[Diagram]](../../diagrams/32/ae6343ef8c5c01d08cdf46a4de9b95a2.png)
![[Diagram]](../../diagrams/26/0e95c3ab397b9529293da2077dc3ecdb.png)
![[Diagram]](../../diagrams/43/574d2ee8ec2b3a2da0e5118ad0d5faaa.png)
![[Diagram]](../../diagrams/49/471cbcebec11f0c20175d5229b792cc3.png)
![[Diagram]](../../diagrams/19/d06e3b5ca3d1f696fccc6957b491c091.png)
![[Diagram]](../../diagrams/46/3acb66d9b3d2a4ea24658a45cf47ca80.png)
![[Diagram]](../../diagrams/32/b2dc75e9c07665382fd1f62e09731814.png)
![[Diagram]](../../diagrams/32/1751daebbbe015180bb1dd9d62868f6c.png)
![[Diagram]](../../diagrams/0/05b3a1323ff04a5ef819dcd440d8b4f4.png)
![[Diagram]](../../diagrams/18/1b8bdfe417b2b95e8cccb8e02801b5e9.png)
![[Diagram]](../../diagrams/51/c1c5c6661047b2235c1e9651ebd02a23.png)
![[Diagram]](../../diagrams/33/29005203cb48b45b9acf1191b81e22b3.png)
![[Diagram]](../../diagrams/5/53911d535ab927ab8da54b41b2faa300.png)
![[Diagram]](../../diagrams/21/43682f9b0cf4b175b8440f0325d066d6.png)
![[Diagram]](../../diagrams/5/f757aa619e99142e22d451a7eeccee1f.png)
![[Diagram]](../../diagrams/13/2e45115fbcaf75be03747745af2f9497.png)
![[Diagram]](../../diagrams/37/4879a1922f7878b43e98a00382304390.png)
![[Diagram]](../../diagrams/35/dc9e9ebf514591d9a231cc13b6e034f5.png)
![[Diagram]](../../diagrams/16/4a4f849ace36fabe98d21051ec441c00.png)
![[Diagram]](../../diagrams/0/e5cd7de11e0e0e3459799a0af9af0009.png)
![[Diagram]](../../diagrams/16/3389955f819a67a4d889c76b655aa315.png)
![[Diagram]](../../diagrams/1/2aa4a79ba60a97f21cf03ff24c12203f.png)
![[Diagram]](../../diagrams/22/436889f9750a93193df970b579e2d8f1.png)
![[Diagram]](../../diagrams/2/c00172af7a516ccb85bbbc2ef88fdde7.png)
![[Diagram]](../../diagrams/40/17a5bda20178a44f5552f1b48fb58f85.png)
![[Diagram]](../../diagrams/32/86509a085a061f8508b4f3984fba0394.png)
![[Diagram]](../../diagrams/50/67f439501921cfbfaca6dcfd574e1d94.png)
![[Diagram]](../../diagrams/6/a82693a71fa15b7cf4c1f30555527bf7.png)
![[Diagram]](../../diagrams/8/8833666349d42142e9fa2afabde86955.png)
![[Diagram]](../../diagrams/24/115cf34af36890aaeea6390294787fe6.png)
![[Diagram]](../../diagrams/49/7e9e782b331f9998f85bda16bac24d0c.png)
![[Diagram]](../../diagrams/23/b7e79c08fcecd8ac1a1e951ee42b8b2e.png)
![[Diagram]](../../diagrams/45/ea199bd652727c37b787f1d0679840b1.png)
![[Diagram]](../../diagrams/10/3a3a5ab8ee28b0380f62c592e5431e50.png)
![[Diagram]](../../diagrams/0/9834a6b91b15ac677fb404a81d34d215.png)
![[Diagram]](../../diagrams/24/2787b7707552096865e1b5a6f162b5a3.png)
![[Diagram]](../../diagrams/47/5db865036d745d6bfe906a41b868b60e.png)
![[Diagram]](../../diagrams/37/c51178ae0c8b11f45c365b5a007a2e69.png)
![[Diagram]](../../diagrams/44/df193d56a052542563aa907bbf5588af.png)
![[Diagram]](../../diagrams/51/bdd6bf42233bd2c974744d75596efc8a.png)
![[Diagram]](../../diagrams/19/100105489eab58a66092f5805806b6ed.png)
![[Diagram]](../../diagrams/20/8c522ae5f480705db1d891de94008c8f.png)
![[Diagram]](../../diagrams/48/a73829f8d33d29124bac262a598b3890.png)
![[Diagram]](../../diagrams/8/3264ed200e1bf2befd838c0e3aacba7d.png)
![[Diagram]](../../diagrams/36/757011a411213474e12d3b0720de26f5.png)
![[Diagram]](../../diagrams/35/bea7f0e6894842ab8a30396b71aab808.png)
![[Diagram]](../../diagrams/1/d2e30f45ba3f0c3db4156b820333c7d0.png)
![[Diagram]](../../diagrams/6/22dd32ec98638e08c5ca7de66a3c41ec.png)
![[Diagram]](../../diagrams/21/7e4ce9ef1f909a8cb324288e8efec41b.png)
![[Diagram]](../../diagrams/29/0b4139e4ef32e8c8c33c74d897f69c64.png)
![[Diagram]](../../diagrams/25/ce28db571738ff84bd6a9176eed83e64.png)
![[Diagram]](../../diagrams/7/eac7708a9716583bd914644d632ea4dc.png)
![[Diagram]](../../diagrams/13/788cd012ce0f6dffe12055cf29bc01a6.png)
![[Diagram]](../../diagrams/31/2736ae382f6d427e92f2fede371983c0.png)
![[Diagram]](../../diagrams/41/665ab9c9d9864f0f6cb5bb55789fb2f4.png)
![[Diagram]](../../diagrams/51/4c4d702f17f28e7ce0f8d345b201165c.png)
![[Diagram]](../../diagrams/37/55a6791bd9a381fd819f64b108ac474b.png)
![[Diagram]](../../diagrams/41/ed8b34a12df5409db1d2b573376cba7e.png)
![[Diagram]](../../diagrams/22/05c7545bdd9d7696a4edc69b5f46db24.png)
![[Diagram]](../../diagrams/28/11fd6814545dbe2549c5191df406974c.png)
![[Diagram]](../../diagrams/13/35d04d87f041be1bb302bac5bf299742.png)
![[Diagram]](../../diagrams/10/90b554c813b484d83d7a4240ecfad574.png)
![[Diagram]](../../diagrams/22/b0c0494efc95fe967f0f8a1394062f8e.png)
![[Diagram]](../../diagrams/29/da983bd570fe3acdba786ad64de94651.png)
![[Diagram]](../../diagrams/40/7423d1606e9ac2c09bdd16b01a0dc48f.png)
![[Diagram]](../../diagrams/16/e0f69b36273e02f16f33985dc4cc2a0c.png)
![[Diagram]](../../diagrams/6/b2160ce7df6b2c1c856a9da36f005b97.png)
![[Diagram]](../../diagrams/35/e5ff329657bcd5493d6ac1917e84f0aa.png)
![[Diagram]](../../diagrams/35/ac76a5fe8b0e37954ff8d1cd9030630c.png)
![[Diagram]](../../diagrams/23/22ba5bf6a58061079e9b70cc6c6710d0.png)
![[Diagram]](../../diagrams/0/e557a6a375947661b19211e2b42645f6.png)
![[Diagram]](../../diagrams/4/7acf80fa02a217fe0a44a7b40a7f1854.png)
![[Diagram]](../../diagrams/19/597257496f1843ad6cce8d7ea277b049.png)
![[Diagram]](../../diagrams/51/18cfd3ed67d7869791051ce6f8ab5dc7.png)
![[Diagram]](../../diagrams/34/38c84e5b882166e394ed7ba69997e030.png)
![[Diagram]](../../diagrams/47/5af813a9751e2bcf247ca3232e73fd4b.png)
![[Diagram]](../../diagrams/20/09c3c265248e1d791646fbcb610a8a31.png)
![[Diagram]](../../diagrams/51/1b18e0967db9956bd4a1c866031e658e.png)
![[Diagram]](../../diagrams/28/ad5928d68774e590a820710db642c48c.png)
![[Diagram]](../../diagrams/21/5c86c0297b6cc0687d5e67f39e9929da.png)
![[Diagram]](../../diagrams/40/9c99b59f98ba78f7f072df183a69db7d.png)
![[Diagram]](../../diagrams/29/b60fa3f2b6df6b86b2d3a15871b01a9a.png)
![[Diagram]](../../diagrams/50/51cb4418db8b518e10d121ab2fe7ecbd.png)
![[Diagram]](../../diagrams/24/c574e7643307bf710ef73482e03180dd.png)
![[Diagram]](../../diagrams/40/174989399327afc0ee14960ee478eb4a.png)
![[Diagram]](../../diagrams/13/dd52672b0d723429a26337c43219af7a.png)
![[Diagram]](../../diagrams/3/6e98149084c5ce88a74d5c318f4ad4d4.png)
![[Diagram]](../../diagrams/34/ba3651c57385e43644a0e223e96446c2.png)
![[Diagram]](../../diagrams/19/d6e1ab7e6ec86cd2bc5703a7ef7128a8.png)
![[Diagram]](../../diagrams/50/5ee2b75173ec1086c86d71fb82fcaa48.png)
![[Diagram]](../../diagrams/46/265c06f9babf779c906eff16e5177d74.png)
![[Diagram]](../../diagrams/22/0d0f7c8e92abf1eb0238d0740151aa3b.png)
![[Diagram]](../../diagrams/34/c24f0643940844eb969bfdb99571ca03.png)
![[Diagram]](../../diagrams/19/fd6813a2997797c427de7bc77d4c5dfb.png)
![[Diagram]](../../diagrams/25/ec0292d0ce0ca9a5617b45277bd3f6d9.png)
![[Diagram]](../../diagrams/32/cf1cb2a81d6997fb988c944c22f0f465.png)
![[Diagram]](../../diagrams/19/47b37850f147d090d6b623d025dab3cf.png)
![[Diagram]](../../diagrams/27/5b4cd95d8bcf27cceaecfa539baefb69.png)
![[Diagram]](../../diagrams/10/fb7ef898f1c960271dd5042ee87715ef.png)
![[Diagram]](../../diagrams/21/21b186abecb9f96e05b1130c561ba14e.png)
![[Diagram]](../../diagrams/51/726adcc268aa770bf562116259883e53.png)
![[Diagram]](../../diagrams/15/cf04dcfc2c81158d679b8f00382f1826.png)
![[Diagram]](../../diagrams/11/eec281a4c5499a1642e38a1804b1a15e.png)
![[Diagram]](../../diagrams/0/565583a44f4124454b73d0f8d3ee9e0c.png)
![[Diagram]](../../diagrams/38/961bb32a604f2abbf57bed71dc64a64b.png)
![[Diagram]](../../diagrams/28/c4e8702dcc27aab5ac75f544fb9c3a35.png)
![[Diagram]](../../diagrams/42/510e223b8cc1798d466883016835e706.png)
![[Diagram]](../../diagrams/6/dea8428b1c5df4b619826c21795dc7e3.png)
![[Diagram]](../../diagrams/37/ffc8e37576df90bec9fb935385ff9841.png)
![[Diagram]](../../diagrams/29/bc976d2dedfc3b5f6405659e649c33d3.png)
![[Diagram]](../../diagrams/44/fc656f45a76fd51f22472fdb5c122e74.png)
![[Diagram]](../../diagrams/21/b34a633cd7a2885646d0aebde0957747.png)
![[Diagram]](../../diagrams/34/70ecf438d1dd94d595d71a466eefc222.png)
![[Diagram]](../../diagrams/24/ac6602943c5cde12bd2045e83df9e306.png)
![[Diagram]](../../diagrams/18/1a80cfe9f04f0d9b4c75ee4c6fcebd62.png)
![[Diagram]](../../diagrams/8/35df9893dfaccaa42f6bc5a40634af60.png)
![[Diagram]](../../diagrams/48/481d15c2d0f5001d2a4d7f40df77cb12.png)
![[Diagram]](../../diagrams/31/018452289ba0bdc426bbfead397f6402.png)
![[Diagram]](../../diagrams/34/59e1185964df2f12d2ef1585f690a0c7.png)
![[Diagram]](../../diagrams/24/89cda52b3c9798f746cf933d027b9522.png)
![[Diagram]](../../diagrams/8/c9bc19531714953d33fdc122e90ad1bf.png)
![[Diagram]](../../diagrams/40/da39d763fd8f203f99c3f4da168677f6.png)
![[Diagram]](../../diagrams/12/c5bfa5da6bcf2099c704ffc1665f7071.png)
![[Diagram]](../../diagrams/5/0ef15ac9a06e1c5acf2da81e4cdc6665.png)
![[Diagram]](../../diagrams/38/31cc1ab1e1bb22e8e2fd9c0512e4a6ef.png)
![[Diagram]](../../diagrams/42/cfb7168bd1c9d6816b437c412c262fd7.png)
![[Diagram]](../../diagrams/19/fd1b829354e70250ebab065bd813f134.png)
![[Diagram]](../../diagrams/42/ab9de63edad57b62840237c1b20109e0.png)
![[Diagram]](../../diagrams/28/7e9e0c01f55362a76d4d2de319e887d5.png)
![[Diagram]](../../diagrams/5/2847db7033f4920c357bc79d5627bdc9.png)
![[Diagram]](../../diagrams/16/cd8685e641678a523f5fdef51a1dcaad.png)
![[Diagram]](../../diagrams/24/4fb9e1b756ee0dc6adccc4a9d8dd88c6.png)
![[Diagram]](../../diagrams/18/9c68886637c3d36d56fa1dbb5d52287e.png)
![[Diagram]](../../diagrams/9/6c7d33ef6301aa4eaed1f490c10d6972.png)
![[Diagram]](../../diagrams/40/21713c5f444d96512e40badf2e6c18e2.png)
![[Diagram]](../../diagrams/29/aa50ca144975e4811645677654e9f5e0.png)
![[Diagram]](../../diagrams/10/f5b8cfe53f0a90d05ed12ceeefc85464.png)
![[Diagram]](../../diagrams/51/009f74fbffb69ab3d0d079b79b58b988.png)
![[Diagram]](../../diagrams/23/2523a23959290c544b1a526c10ac62df.png)
![[Diagram]](../../diagrams/7/44a98b27c3b1381387f84bf9ab6e8323.png)
![[Diagram]](../../diagrams/37/95991272eeac99c87fdc3f3097948c92.png)
![[Diagram]](../../diagrams/31/910d5368259e5359f00ffc1f29e29245.png)
![[Diagram]](../../diagrams/16/52a2138c0f2cd9a6371e1c4a19c6954a.png)
![[Diagram]](../../diagrams/17/befb0d12a05dc50f4bb633e0a90114a2.png)
![[Diagram]](../../diagrams/8/74cf2a8f9f1c9931aeb316d92726dd5a.png)
![[ext]](http://img488.imageshack.us/my.php?image=beautifulmindgo350sp.jpg) http://img488.imageshack.us/my.php?image=beautifulmindgo350sp.jpg
http://img488.imageshack.us/my.php?image=beautifulmindgo350sp.jpg![[ext]](http://img218.imageshack.us/img218/7017/blindspotgq2.jpg) http://img218.imageshack.us/img218/7017/blindspotgq2.jpg
http://img218.imageshack.us/img218/7017/blindspotgq2.jpg![[Diagram]](../../diagrams/44/98adda9f3ea649a658923cc096d214c0.png)
![[Diagram]](../../diagrams/11/6c335a52bfc34af04c18fe033979fc72.png)
![[Diagram]](../../diagrams/28/741794bdd321b00147ebe855ca3f3f26.png)
![[Diagram]](../../diagrams/11/7c330bd607089ef74efd17c893427af7.png)
![[Diagram]](../../diagrams/50/df33ff8c314fc3da6c6ffe3baf732502.png)
![[Diagram]](../../diagrams/3/dc01f67be05340a17aca057fb071ec92.png)


![[Diagram]](../../diagrams/47/4eb14b3bc4f633f3af839c166536df9c.png)
![[Diagram]](../../diagrams/14/b917554afe3eb7d15903617eec0fae79.png)
![[Diagram]](../../diagrams/34/754d4b4aeceb92264c63b52bd367d2b6.png)
![[Diagram]](../../diagrams/47/cefb6faf3f0eda59ee643683d370ba21.png)
![[Diagram]](../../diagrams/0/1c892f500b804c863f705a919f95b995.png)
![[Diagram]](../../diagrams/33/a82d76b97a9257f9b357c35973a02575.png)

![[email]](../../images/email.png) G.spotting.in.the.bush@gmail.com
G.spotting.in.the.bush@gmail.com
 This a list of the books I've had or read so far:
![[Diagram]](../../diagrams/52/6256b188d4d6b10a11997b343d4f32aa.png)
![[Diagram]](../../diagrams/30/2823834463344eff30da5817dea85c8c.png)
![[Diagram]](../../diagrams/43/ed34b7d5eb8fed9147dfa034f7917358.png)
![[Diagram]](../../diagrams/11/42755054ea736d715842a12dcddf63cd.png)
![[Diagram]](../../diagrams/13/7164d4d0e156049eec4922bbc1d5d1bd.png)
![[Diagram]](../../diagrams/22/9645a00f916406b75a2b9448005fa950.png)
![[Diagram]](../../diagrams/28/2b65982b7d15b1dc8c424949a6038151.png)
![[Diagram]](../../diagrams/40/050148f50b07e13fac9b13eae81e556d.png)
![[Diagram]](../../diagrams/4/2790b0ea94e53710e24b433d8ff590c3.png)
![[Diagram]](../../diagrams/16/84a0e462a8477bc602b9aa07e5b90445.png)
![[Diagram]](../../diagrams/35/d5509b3f43ad719408b20a79ee792286.png)
![[Diagram]](../../diagrams/18/37e7f05982a272aab370dc57680d6118.png)
![[Diagram]](../../diagrams/7/cdee06052f7809e35ddfdb3ebfa3d55e.png)
![[Diagram]](../../diagrams/31/52cb42e254b0e2f4d5490308ff0ee3f5.png)
![[Diagram]](../../diagrams/38/b4e7ebd6b2a1df20f03081e685ebd832.png)
![[Diagram]](../../diagrams/10/d52ea2d77ec9074ae1b81dcb891eaf7d.png)
![[Diagram]](../../diagrams/50/7c903dc38215ee835f5a8c6cb0511af5.png)

![[Diagram]](../../diagrams/32/f972722bef179661a9a2fda964801ec8.png)
![[Diagram]](../../diagrams/27/274cd8ea1320bedb92288ddf6e047b77.png)
![[Diagram]](../../diagrams/26/36a2e9d5d87b7d0762a4d76ded861c3a.png)
![[Diagram]](../../diagrams/44/8af2a20b738e8ac8bc3e5f0be00abc87.png)
![[Diagram]](../../diagrams/35/bcad9a5c9bbd7029816a48c55ee296b4.png)
![[Diagram]](../../diagrams/52/3b773046a4922415f27653184f270e17.png)
![[Diagram]](../../diagrams/10/511b15bb83492b0dbaaabcce144c266a.png)
![[Diagram]](../../diagrams/24/07f0eb8e60459a4771b9b9285cb78a30.png)
![[Diagram]](../../diagrams/14/65bad3a9960d56a586c686a6172e01a3.png)
![[Diagram]](../../diagrams/7/187fd7f65381f9ed8274321240bcf13f.png)
![[Diagram]](../../diagrams/37/8639d250fea9ab3d54a93fd44dc29652.png)
![[Diagram]](../../diagrams/20/2842a7c360a97d6dddbfe179adc94c01.png)
![[Diagram]](../../diagrams/8/77b9f241ad5fde21aee2c1dc4bb70f8a.png)
![[Diagram]](../../diagrams/31/13004006dd00e07bf67dd233990bce31.png)
![[Diagram]](../../diagrams/49/afd48aeffd2d0f69e7e86dde6918dbee.png)
![[Diagram]](../../diagrams/21/e9683513bcd664d96305c041d2d5076c.png)
![[Diagram]](../../diagrams/33/0da958d1bf5e69bdd3ee67f0927c0bd2.png)
![[Diagram]](../../diagrams/28/d21fd342b683e192bab7b8f7f272a26e.png)
![[Diagram]](../../diagrams/5/edd90fdf0887a3da836ba3c33281de9f.png)
![[Diagram]](../../diagrams/0/c5b53d233dd3968070dc419c205208ac.png)
![[Diagram]](../../diagrams/49/2634db01b89d5590859c51616e26e805.png)
![[Diagram]](../../diagrams/52/a339c92ff9e213fbe440d777323360a6.png)
![[Diagram]](../../diagrams/26/f16419e0f925e6ca113c41eecccfd36d.png)
![[Diagram]](../../diagrams/1/d1253088e068a9aea2350166b9902f34.png)
![[Diagram]](../../diagrams/29/c18aff7fecebd5dac05a633491c89a28.png)
![[Diagram]](../../diagrams/37/e29899153f19a6b42f31bacb285e169c.png)
![[Diagram]](../../diagrams/3/e0dc99ebeee275f853696087e60f2dbb.png)
![[Diagram]](../../diagrams/49/b8a693e4b2f93304680ead7beeb3ceb8.png)
![[Diagram]](../../diagrams/47/3d42fdeadc1f40d161dfaf0578bb354e.png)
![[Diagram]](../../diagrams/51/250a48386f1dafb3000e9812196203fa.png)
![[ext]](http://www.gokgs.com/servlet/graph/Aivonix-en_US.png) http://www.gokgs.com/servlet/graph/Aivonix-en_US.png
http://www.gokgs.com/servlet/graph/Aivonix-en_US.png![[Diagram]](../../diagrams/35/f065db2a71fdddb8202aa66ebefef387.png)
![[Diagram]](../../diagrams/52/5d1986b429c8e37213a62e6bc83a8c57.png)
![[Diagram]](../../diagrams/19/5b83e0ceee882c3a484bb5898de90c0e.png)
![[Diagram]](../../diagrams/0/9af21f67bb77631d41555759a0a2447d.png)
![[Diagram]](../../diagrams/27/c434fd906de03eca2b5ac006d3dc1a00.png)
![[Diagram]](../../diagrams/34/75702f43a5951aeab68dcada0643eb99.png)
![[Diagram]](../../diagrams/46/f05d6994364d3589e2ba9c6390a76847.png)
![[Diagram]](../../diagrams/3/8c9fab7e6299cd3ad1329f52e9f02bde.png)
![[Diagram]](../../diagrams/52/6bd2a59632dd3bb26d4c69aeaece228b.png)
![[Diagram]](../../diagrams/28/3118b8a62d589cfcd3660b3ef76afecd.png)
![[Diagram]](../../diagrams/41/a9a4f6f85179e21a4a0d313233894d2a.png)
![[Diagram]](../../diagrams/28/fa49add1bad3fba0de9f4caf8a611fe0.png)
![[Diagram]](../../diagrams/10/0f99d41757d81807db70bf65ab132a24.png)
![[Diagram]](../../diagrams/22/a6f493d7222d6ef375aff0da86c06375.png)
![[Diagram]](../../diagrams/5/c8fefe92671dce022931b3f79f386fe1.png)
![[Diagram]](../../diagrams/12/79e6fdd2d50fdb1dfb62c45474d089e5.png)
![[Diagram]](../../diagrams/21/e46c07f45ec8d7c3ed2ed55c36c6a853.png)
![[Diagram]](../../diagrams/35/a6e9909a187777495de72054ed8663a6.png)
![[Diagram]](../../diagrams/2/be29afdca0d1ae1b609dfbf4d272f85b.png)
![[Diagram]](../../diagrams/18/0f514a26d9b2146985968c4fc3527dd2.png)
![[Diagram]](../../diagrams/22/57d2539f26f6162f39833f95528f01f5.png)
![[Diagram]](../../diagrams/31/b2af800bbe30a1acd5aa7df3e7461e26.png)
![[Diagram]](../../diagrams/49/6aa8cf5e20f9b98318154a7308013dd0.png)
![[Diagram]](../../diagrams/31/e63e31d45cf63a4d1d9406fcaa857d7c.png)
![[Diagram]](../../diagrams/26/62884d49aa16bb970fc95cd0dc862440.png)
![[Diagram]](../../diagrams/20/3a4d51f668ccd473b6b9c4d70670b840.png)
![[Diagram]](../../diagrams/31/ba2b1fe787fcabcab5739715d5516c3b.png)
![[Diagram]](../../diagrams/14/6b62ab0557df9995014157529a5b502d.png)
![[Diagram]](../../diagrams/2/cc5dfc47d46e0bb05801c25a82559561.png)
![[Diagram]](../../diagrams/31/1a2d2dcb0279da4559c304866669ccfe.png)
![[Diagram]](../../diagrams/37/f62a8d279717a8cbdc9e6a4897212847.png)
![[Diagram]](../../diagrams/38/766925f639776eae018c94d58ea666cd.png)
![[Diagram]](../../diagrams/40/9d65192ccd9455d08ea2ad2c57fd7fc6.png)
![[Diagram]](../../diagrams/1/d5678b7cfc236884688f0bac82dc39d5.png)
![[Diagram]](../../diagrams/10/4af4ae7fca4480ab807deca2b9151949.png)
![[Diagram]](../../diagrams/11/10afc17c52f0f10a79c4c1baa4600f6a.png)
![[Diagram]](../../diagrams/26/30ce7c4624c0b029aff8fd0e90f903c7.png)
![[Diagram]](../../diagrams/42/2ed50ff660f882f39ec9a8da898ef5c5.png)
![[Diagram]](../../diagrams/23/92b80fba502e1dcaa586dae1cae7c0a5.png)
![[Diagram]](../../diagrams/10/08427e99187139e9049a9fb1894469dc.png)
![[Diagram]](../../diagrams/21/18b3bcba2b399fd8f97d4ef71640f246.png)
![[Diagram]](../../diagrams/38/ea01ebe2cac89d007d4bf1a03a53238b.png)
![[Diagram]](../../diagrams/51/16cd15953934cbe78849cadfd063b0f9.png)
![[Diagram]](../../diagrams/29/62014b409aaaf6910bc44abd87f99837.png)
![[Diagram]](../../diagrams/25/0b707dd776cf4426fd15f690c354bf51.png)
![[Diagram]](../../diagrams/40/77a7457d2b84283706e74288372f958c.png)
![[Diagram]](../../diagrams/4/1586d3f6e9d2591893d1b00b5a2a153c.png)
![[Diagram]](../../diagrams/34/11a5f425f1b1b29bd05e8f434b027d47.png)
![[Diagram]](../../diagrams/50/5dfcc9a19be3c6e0049899bfafef071c.png)
![[Diagram]](../../diagrams/26/90f575c02c3a453798d54e82fe45656f.png)
![[Diagram]](../../diagrams/38/510e2475a4e7d32cddcc7d6de0cd6f3b.png)
![[Diagram]](../../diagrams/28/1f7ba8ffde278b2203e1fb81d449e1d0.png)
![[Diagram]](../../diagrams/49/f6c1cbc5472207a86811e4e0a7d87d6f.png)
![[Diagram]](../../diagrams/43/dbb8f8dee0e27355a92288a7c6760400.png)
![[Diagram]](../../diagrams/25/8a6883995eba0156cb643c0eb992b184.png)
![[Diagram]](../../diagrams/50/d023c4bfe0c25cbdb67a568c1af930df.png)
![[Diagram]](../../diagrams/44/cd16a043114fafe122ddb7f782b3a706.png)
![[Diagram]](../../diagrams/11/c450bb6f168b477e1ca5543304171014.png)
![[Diagram]](../../diagrams/18/24068e281f63b287da3c2505e3db4cc5.png)
![[Diagram]](../../diagrams/1/691c59ff685d81247d664bb9d517b0a9.png)


![[Diagram]](../../diagrams/25/b8640acba9cc6bcb82668c51a8708d54.png)
![[Diagram]](../../diagrams/3/d898376736fc8ffdb1b6103ab92c7d1a.png)
![[Diagram]](../../diagrams/18/d0a9146f7505c5cbe80a62e7db172b1b.png)
![[Diagram]](../../diagrams/39/ca0add93b92a0c0cfa65bad1ce50e3e0.png)
![[Diagram]](../../diagrams/26/f277162fc748dd83e892f45c5316e818.png)
![[Diagram]](../../diagrams/15/b025879b9333b6f6606759fd4c4f2f07.png)
![[Diagram]](../../diagrams/27/a1458bc73e81ebc08d3e77ae5a4f405a.png)
![[Diagram]](../../diagrams/4/565e884107cc2dc76e874de8e82bb876.png)
![[Diagram]](../../diagrams/45/a880e69149c691296c16ab0cc0feb453.png)

![[Diagram]](../../diagrams/17/e09339a830fa4779ae2fa5eeef7410d8.png)
![[Diagram]](../../diagrams/46/bbc330a9a1fcef6ffb246e2c6b172edd.png)
![[Diagram]](../../diagrams/49/c969a0ae4b28f253994f236cab0e535f.png)
![[Diagram]](../../diagrams/35/cda878ab50ad2bcec45bb8887c12afab.png)
![[Diagram]](../../diagrams/8/c64ddccde954ce4c0fb9fc5f2cbbac1f.png)
![[Diagram]](../../diagrams/6/3d9e26a0b60fa9e1e22ddb322d1e10b8.png)
![[Diagram]](../../diagrams/22/e2e553f6810740efb08854aceed47afc.png)

![[Diagram]](../../diagrams/6/a8f0c056fa8960fa840434d2e7029986.png)
![[Diagram]](../../diagrams/38/ccb63b317a6aafb7bca373c8402d87b7.png)
![[Diagram]](../../diagrams/16/32e40683503df19cb0dc5e79425efe53.png)
![[Diagram]](../../diagrams/12/fe45b9f1cc5d1ba7a8928c07cc3dcd83.png)
![[Diagram]](../../diagrams/39/27fb759e72776fc7d73c2d64b54497dd.png)
![[Diagram]](../../diagrams/33/d218a2c3773b25f7ca905cd2eb26df52.png)
![[Diagram]](../../diagrams/14/7aa21153d25c549d33ef3a2dcf854e28.png)
![[Diagram]](../../diagrams/15/8b0ef91fda0bbe1e1910c57e12e9d5c2.png)

![[ext]](http://goama.upstream.ru/gallery/albums/DVD/normal_2%20034.jpg) http://goama.upstream.ru/gallery/albums/DVD/normal_2%20034.jpg
http://goama.upstream.ru/gallery/albums/DVD/normal_2%20034.jpg![[ext]](http://goama.upstream.ru/gallery/albums/Champ-of-Russia/normal_DSC_0094.jpg) http://goama.upstream.ru/gallery/albums/Champ-of-Russia/normal_DSC_0094.jpg
http://goama.upstream.ru/gallery/albums/Champ-of-Russia/normal_DSC_0094.jpg![[ext]](http://goama.upstream.ru/gallery/albums/Champ-of-Russia/normal_DSC_0248.jpg) http://goama.upstream.ru/gallery/albums/Champ-of-Russia/normal_DSC_0248.jpg
http://goama.upstream.ru/gallery/albums/Champ-of-Russia/normal_DSC_0248.jpg![[Diagram]](../../diagrams/40/d9dc0fd31c854dd5699bebeed37c9025.png)
![[Diagram]](../../diagrams/25/b2fa96e9b343969e2d680dbe044b7f12.png)
![[Diagram]](../../diagrams/26/a8422ec4d75e5dd97009e35b831fb19f.png)
![[Diagram]](../../diagrams/30/cb28a61c1d9a1026a2a476774c5b5692.png)
![[Diagram]](../../diagrams/2/ed8f9b710c2bbe1c4578f3234e7ade3e.png)
![[Diagram]](../../diagrams/36/cbe882a47f46f91f47ee3fdd252efafd.png)
![[Diagram]](../../diagrams/14/ae5beb0ef39e55db61d60fa26fe8b56a.png)
![[Diagram]](../../diagrams/4/312e9b0aea022918550bd4d56a12315f.png)
![[Diagram]](../../diagrams/28/94d58f48f0dfe3683a6a79e08253d583.png)
![[Diagram]](../../diagrams/36/4a00e92da41831560af1ea6360d6adb0.png)
![[Diagram]](../../diagrams/0/4ef662ede61b19c87e9c1419cafa2bc8.png)
![[Diagram]](../../diagrams/9/b3f23fe76a709fd398dca17fd79f164d.png)
![[Diagram]](../../diagrams/6/a72493cab1fdbbc33335fb1096f0b771.png)
![[Diagram]](../../diagrams/35/a4e1df4fb6fb5582d859aba2ee979213.png)
![[Diagram]](../../diagrams/23/410ba18efc60af17ee55ce086af293e0.png)
![[Diagram]](../../diagrams/43/e89a88edfa32d90185074ae87bba5f6c.png)
![[Diagram]](../../diagrams/0/74069f372aac297a0464363f214c58d5.png)
![[Diagram]](../../diagrams/21/8c4991335be8eeed9a387a50372b93fe.png)
![[Diagram]](../../diagrams/51/9398d0accedd4474e63c7174a0738ae1.png)
![[Diagram]](../../diagrams/11/95537e08850a9569cdfedaf0c1bddef8.png)
![[Diagram]](../../diagrams/36/667b82989320bdff3f62fbc8527fe203.png)
![[Diagram]](../../diagrams/18/3c35ced8c875666313503cf053a9fdd7.png)
![[Diagram]](../../diagrams/2/da862424a7f891842ab698f91bb10f21.png)
![[Diagram]](../../diagrams/12/516bdb0386132f26ed08e979afc88235.png)
![[Diagram]](../../diagrams/2/a04e0ab0be4e2851b53ec88ddf61bf2f.png)


![[Diagram]](../../diagrams/47/24c1d296778ae46e7c494e082cc4dee5.png)
![[Diagram]](../../diagrams/39/2b4f2e95d508f269bad872168fcc8fe8.png)
![[Diagram]](../../diagrams/30/ff7c46672069e9386949ee02102ced9e.png)
![[Diagram]](../../diagrams/23/e84016de4a77437814479d7be2ccc09d.png)
![[Diagram]](../../diagrams/27/22785216c6fc226762114a74df167cb8.png)
![[Diagram]](../../diagrams/49/cb36136be331f0832ce08c11a5919357.png)
![[Diagram]](../../diagrams/39/708facd756b9d41feade4d94cc4a93b1.png)
![[Diagram]](../../diagrams/14/49c77ade88a0c88f28dda44232777599.png)
![[Diagram]](../../diagrams/36/9f71b549232b97494d04a04b5918f578.png)
![[Diagram]](../../diagrams/44/5360723f5c81edd5fbdbd3a3e205b8a2.png)
![[Diagram]](../../diagrams/31/ed594844c429c746c641aeb72df2fb4a.png)
![[Diagram]](../../diagrams/4/2e1578012c732c6e45fe35b5e93d0c65.png)
![[Diagram]](../../diagrams/25/13612f1dc5349918e0123696233fd54c.png)
![[Diagram]](../../diagrams/16/b22ec2d39b5cc56da1a06ccff2e7f2b2.png)
![[Diagram]](../../diagrams/33/5d0dfd5cd6fc079ce951373ed107525b.png)
![[Diagram]](../../diagrams/49/4257c69f512715c0605991f4ebbda689.png)
![[Diagram]](../../diagrams/4/8bbce0870c8359ad4486a3d74418832f.png)
![[Diagram]](../../diagrams/15/bec7ce117b2743f3519d63ff45b2bc85.png)
![[Diagram]](../../diagrams/35/1d05dee83496b5843e93dd47f677083a.png)
![[Diagram]](../../diagrams/26/b43822c961ce3fc273c4835e8cee909e.png)
![[Diagram]](../../diagrams/49/0631a48a3b8547dc036a9c74ef791b9c.png)
![[Diagram]](../../diagrams/17/3b5b58e88e1b3e0eadb3f5a09ae94304.png)
![[Diagram]](../../diagrams/24/fba8eb55078b0716e53a182c460b0e54.png)
![[Diagram]](../../diagrams/11/8c21ca11f4f0cffd0a20b88122b2c644.png)
![[Diagram]](../../diagrams/44/cde1082611af1b1156b9b34fc4ce3486.png)
![[Diagram]](../../diagrams/17/9015051244374106e4292fdd4ee8ecd7.png)
![[Diagram]](../../diagrams/27/f1c92b05a101b58f05027391e9e267c3.png)
![[Diagram]](../../diagrams/18/07dbf20fde16472b0f616cde414c3a07.png)
![[Diagram]](../../diagrams/7/07747e7c3c1764b255ea801c18e88f59.png)
![[Diagram]](../../diagrams/23/f388c2e0f1e45064eb73c42ef9ff054d.png)
![[Diagram]](../../diagrams/29/9f6f468481790fbab8dd4b6f1b99a63f.png)
![[Diagram]](../../diagrams/50/c29bed78a97c5b73b8b0ff8e2659adff.png)
![[Diagram]](../../diagrams/33/9b1ea419964a7970a8a81b377c87d689.png)
![[Diagram]](../../diagrams/16/ad7fc3cbe285a21f080d140352529388.png)
![[Diagram]](../../diagrams/36/193a16304cc2e02274a7a0bbde2d0ca1.png)
![[Diagram]](../../diagrams/17/0361b1075adfc454ee6a4d0563c9ec99.png)
![[Diagram]](../../diagrams/27/0fdf8e75eebfe014f3798c7b2976050d.png)
![[Diagram]](../../diagrams/32/b02cf102b52dfb4f3347b1bf2b502e89.png)
![[Diagram]](../../diagrams/40/8a810551d68c12d46e7d21ee34234d81.png)
![[Diagram]](../../diagrams/52/0d253d0bf2ed02668fc31029a510458c.png)
![[Diagram]](../../diagrams/47/ca071c0a9b4e7de3315a5b2fb09824ce.png)
![[Diagram]](../../diagrams/33/56ada106b1c4daf3cfd7df0ab1966a8d.png)
![[Diagram]](../../diagrams/36/320233b0c5f5d514982aba4604366743.png)
![[Diagram]](../../diagrams/47/69134443d06924500075224c66dcc172.png)
![[Diagram]](../../diagrams/35/7bddeec638ec024742a58bfe194d96df.png)
![[Diagram]](../../diagrams/50/a7915e52308eeec84533c580be70a948.png)
![[Diagram]](../../diagrams/2/ddbf44de81f393cfaf6dcd980ae55839.png)
![[Diagram]](../../diagrams/41/1c9e3fed345d79b1949a4f4c1ea959f9.png)
![[Diagram]](../../diagrams/38/da2dac91222ca21276f2e8405deacedb.png)
![[Diagram]](../../diagrams/50/65d4283bb61ec9ecde84b514969cb5e4.png)
![[Diagram]](../../diagrams/41/1927f3df01e884d629bbcc62480af7b6.png)
![[Diagram]](../../diagrams/42/f7a1d86e1a1e12e2f2987e92b1884f2c.png)
![[Diagram]](../../diagrams/29/8006146e296e5680912c321a84f28105.png)
![[Diagram]](../../diagrams/26/51f93f2176617a26013da167bf544527.png)
![[Diagram]](../../diagrams/13/d8d4e840e5487145ffefddfbc0f335dd.png)
![[Diagram]](../../diagrams/27/fbc3e0eafb681d1f49a4bb8a1682ebea.png)
![[Diagram]](../../diagrams/40/8c4c1a23561495ae0b15f8564fe316f4.png)
![[Diagram]](../../diagrams/1/cb09e8cb4cd174260c5f6474fc15e108.png)
![[Diagram]](../../diagrams/17/6343c79af97b21b3a48d12fa809ecc8b.png)
![[Diagram]](../../diagrams/23/f42f3928a167ae6354dde38a80fb0cd8.png)
![[Diagram]](../../diagrams/30/236f282cc9b66b992aa52b33cee73c7b.png)
![[Diagram]](../../diagrams/14/6a391fe5bf91e56b5070bcba34955c38.png)
![[Diagram]](../../diagrams/25/620a1a808de51d865f212bfab9699098.png)
![[Diagram]](../../diagrams/27/a41827784d2167035161fbd0c940c8e4.png)
![[Diagram]](../../diagrams/15/0ca8a084306e1ad03cbd8eae5ddb8f64.png)
![[Diagram]](../../diagrams/12/3fcc5c298cd1fb7a528baf1f58d756ee.png)
![[Diagram]](../../diagrams/16/03d3306dd1b1bdbc728e0fca3bf42cb2.png)
![[Diagram]](../../diagrams/5/9c05b75e2b439c8fa464791eb03e2583.png)
![[Diagram]](../../diagrams/52/76a7dbf2ccc6c008e2299625fe9224b9.png)
![[Diagram]](../../diagrams/2/93807aaba40eb81fed391498799b66eb.png)
![[Diagram]](../../diagrams/12/0b12e4826e8dc8f2d58e44b94fa8cc92.png)
![[Diagram]](../../diagrams/2/2f9b0e0bae8aac1e14c0ce7c181ddcd7.png)
![[Diagram]](../../diagrams/48/d7c937d3b833e4dc48b5d15f114a575b.png)
![[Diagram]](../../diagrams/4/d2438e880214e1467f6472844e7ef53e.png)
![[Diagram]](../../diagrams/33/44f3480c3d84605b7d0edf425f00e8ec.png)
![[Diagram]](../../diagrams/50/2a76bfe7d1df3b3d4c1f1df7e66114a5.png)
![[Diagram]](../../diagrams/21/5dd7b433db749850ad35a8eec5b187d4.png)
![[Diagram]](../../diagrams/42/ff0bff1470a60f62ac3972d6553a579f.png)
![[Diagram]](../../diagrams/1/b43637c37bf2f16a6cb664d4680d9a7b.png)
![[Diagram]](../../diagrams/19/c301dc50fffade5244d28fc746a584b1.png)
![[Diagram]](../../diagrams/41/77ea4f3f16cec11a2b84e8f6ed2d49cf.png)
![[Diagram]](../../diagrams/8/359bef80d1a850ec09c80464fe0ddd2c.png)
![[Diagram]](../../diagrams/34/e7584c49d20541ed1ca47a0c4b66c264.png)
![[Diagram]](../../diagrams/39/12c84d9a178ea18cfd9a1d1d1517c099.png)
![[Diagram]](../../diagrams/14/7c8238f6a3907b0b0e6de31f9690fe41.png)
![[Diagram]](../../diagrams/41/aad8f2677d1547dd6734dbd914f2c690.png)
![[Diagram]](../../diagrams/11/56c2647c46f58dec6ca684870cb559f2.png)
![[Diagram]](../../diagrams/22/5608210e5fe9058afee04690e87f43e7.png)
![[Diagram]](../../diagrams/0/804cebdca48598c18a779a92d04a97d1.png)
![[Diagram]](../../diagrams/21/5558b31574a4f07784b0927254b150eb.png)
![[Diagram]](../../diagrams/48/381013a80234c52f7f033feda8da6751.png)
![[Diagram]](../../diagrams/37/4c62fd7c1f4cd14c694c5738a4fa79f2.png)
![[Diagram]](../../diagrams/23/55da84deebfe58962f0e740404a406ce.png)
![[Diagram]](../../diagrams/39/233ea423e77e3dd2c10f8673cbbbbf4b.png)
![[Diagram]](../../diagrams/5/1c0c7e94d8d5404d645e35996fdfd673.png)
![[Diagram]](../../diagrams/21/2c091ee225b7042ea67d948e02263365.png)
![[Diagram]](../../diagrams/39/243f41e566b6f83a725616c22c130baf.png)
![[Diagram]](../../diagrams/41/e32c281140192483b736610182b3ee16.png)
![[Diagram]](../../diagrams/38/5d514a3115f700f537ea77009fce30f3.png)
![[Diagram]](../../diagrams/26/1d644ac0461209bed857ab989fdf9319.png)
![[ext]](http://goama.upstream.ru/gallery/albums/Shodan/2/diplomGrishina.JPG#) here
here![[Diagram]](../../diagrams/9/85d5d4930ea3e0b0f4cec123515d7e99.png)
![[Diagram]](../../diagrams/39/22d59dbf312949d0dd4a4fb1ab583283.png)
![[Diagram]](../../diagrams/25/9d178012f68b648a6b690b42e8b3500f.png)
![[Diagram]](../../diagrams/5/5982b69f9a55f989fb7d3e113faee846.png)
![[Diagram]](../../diagrams/9/c25bea0c3f9822e26de68f1e92cac889.png)
![[Diagram]](../../diagrams/33/ecb0f81f1f04fa1f2d3aac2c0a57637d.png)
![[Diagram]](../../diagrams/41/253011a69f5a56a051eaee9ae9e3e15e.png)
![[Diagram]](../../diagrams/31/3311f54851b280ddc0226351e79f5c09.png)
![[Diagram]](../../diagrams/45/b3c93281c4683abaebed7d1c227d8aa0.png)
![[Diagram]](../../diagrams/52/4eb3c6c9ce70935b2bb442e0a61df56b.png)
![[Diagram]](../../diagrams/23/32bfa2a1c3d20fbf4085534e23d516d9.png)
![[Diagram]](../../diagrams/50/870e158da04c2d9bb422a626f5180477.png)
![[Diagram]](../../diagrams/25/bc89da30f7e310d14a5b2a7330b4bc63.png)
![[Diagram]](../../diagrams/10/a80c6e3003a1e0e68e6b4b585e2f241f.png)
![[Diagram]](../../diagrams/26/fab6a40af9e9e2692e1a1f1eaa1f6c8a.png)
![[Diagram]](../../diagrams/2/2bdf04799ee4a3043db20bf706a80ac7.png)
![[Diagram]](../../diagrams/9/395aea10b2b5912a6c87dbb74f729367.png)
![[Diagram]](../../diagrams/47/7900bed306e4259d96faf1bd0a9f1756.png)
![[Diagram]](../../diagrams/44/2311cfefe558ebc9d8ebe5e4aab13b38.png)
![[Diagram]](../../diagrams/39/2f98afb5005ce8ede801c471dc1b2879.png)
![[Diagram]](../../diagrams/8/a3bb7ac65d26fca07b526f44f7295b16.png)
![[Diagram]](../../diagrams/10/50db1fcb282bc4b94f68d3297af4273f.png)
![[Diagram]](../../diagrams/44/72491fc155e4dd1a36355ca03b3e4e2d.png)
![[Diagram]](../../diagrams/19/da9485ff189a2e475a7ed214b12db5f2.png)
![[Diagram]](../../diagrams/43/ab7e1c6b2d57e8d0ae9067cffcc6a225.png)
![[Diagram]](../../diagrams/15/79cbb0be3fa3452addd2b0104a606e3d.png)
![[Diagram]](../../diagrams/27/b77c14aafb7abd3f7732fd9956cc9499.png)
![[Diagram]](../../diagrams/19/c4bc1f79a9b8300b192f2bef00917364.png)
![[Diagram]](../../diagrams/36/46fc2fa273f9d21aa19570d42b1bf3e1.png)
![[Diagram]](../../diagrams/50/8b0bae5a511e6f7dd76353d062c025f0.png)
![[Diagram]](../../diagrams/20/7fcf00e89545ef66fb0f4c22251c5112.png)
![[Diagram]](../../diagrams/50/7bcb5df39d3d3b413c7ce84d56baad3f.png)
![[Diagram]](../../diagrams/22/258a9f6fb19e653ec26eb023591a5d87.png)

![[Diagram]](../../diagrams/30/b1922c1f90c9a1ae6ddd037c78a23615.png)
![[Diagram]](../../diagrams/11/8bbf235e21edea367f8f92ef34a0d35a.png)
![[Diagram]](../../diagrams/21/8bbf7ae0adb369fbbb55fc5cf415db08.png)


![[Diagram]](../../diagrams/35/729f1a6b6f29d0eb8d01e15a7fd00713.png)
![[Diagram]](../../diagrams/22/47b349b4bb5c025ccaf828235df058c3.png)
![[Diagram]](../../diagrams/20/eab1dd83c37298f32aec04da84215878.png)
![[Diagram]](../../diagrams/29/91b518d2b6b8a70ef527d4b32641cef5.png)
![[Diagram]](../../diagrams/45/0e41c2ff5e1035de8156e4abff0784f7.png)
![[Diagram]](../../diagrams/18/00843bf4edcda0c64010e47a257acb02.png)
![[Diagram]](../../diagrams/19/9bb9c9dd024b3f7736f4d2e7f6324e05.png)
![[Diagram]](../../diagrams/39/90a645a3d8e7d3286d6f47ae44fffefc.png)
![[Diagram]](../../diagrams/23/2cfae9b8cb4c04d83e2b5646e54bae37.png)
![[Diagram]](../../diagrams/28/50ad171e7b0cdb5866e33e91773fc15a.png)
![[Diagram]](../../diagrams/6/fd696eef3a114314f515a4ccaeadee29.png)
![[Diagram]](../../diagrams/39/043eff374bc6314333713a3c29922930.png)
![[Diagram]](../../diagrams/8/352215bec2a1cec301788eada97daa06.png)
![[Diagram]](../../diagrams/48/779f25f04c0ea115fc2a3332d0322b0b.png)
![[Diagram]](../../diagrams/9/85174629e788d681624322ac8c9ec7c4.png)
![[Diagram]](../../diagrams/44/cb1e6903024e1ad9f313d9769eab2d89.png)
![[Diagram]](../../diagrams/36/09a175611ac16639c6c4c39237fb2deb.png)
![[Diagram]](../../diagrams/29/f4db035eeb4ce1270aa75b5f1abd8460.png)
![[Diagram]](../../diagrams/4/14af21175391b24af3901871da36a123.png)
![[Diagram]](../../diagrams/49/c6ead267bc0dae1d4d1e70c94134ac75.png)
![[Diagram]](../../diagrams/41/76b43d36c97238cdff68911b35d22caf.png)
![[Diagram]](../../diagrams/5/ab10eeef28f0ff65cb68fad30cb5a476.png)
![[ext]](http://photos1.blogger.com/blogger/2888/1905/1600/Conan3.0.jpg) http://photos1.blogger.com/blogger/2888/1905/1600/Conan3.0.jpg
http://photos1.blogger.com/blogger/2888/1905/1600/Conan3.0.jpg![[ext]](http://photos1.blogger.com/blogger/2888/1905/1600/Conan5.0.jpg) http://photos1.blogger.com/blogger/2888/1905/1600/Conan5.0.jpg
http://photos1.blogger.com/blogger/2888/1905/1600/Conan5.0.jpg![[Diagram]](../../diagrams/4/68879f92e83dc7b99635463033a8de2c.png)
![[Diagram]](../../diagrams/40/0aa71626f26462454660cbd1dc9e674b.png)
![[Diagram]](../../diagrams/49/80a5cdfce5552161f7bc89d63d7ca62d.png)
![[Diagram]](../../diagrams/7/6b6f1a2c01eb0063ae97b09de764a59f.png)
![[Diagram]](../../diagrams/23/cd279e5651f51b13ecea363a68e3de53.png)
![[Diagram]](../../diagrams/10/71508549ccd3a7daf6fd129205953a0a.png)
![[Diagram]](../../diagrams/20/3529b10bfb5ce0e4aae4779f425e49ab.png)
![[Diagram]](../../diagrams/6/22e0f94d8b1ee578b54de8c8203d1d30.png)
![[Diagram]](../../diagrams/31/c51b4156c87908f3bb8931b1ec4b48ad.png)
![[Diagram]](../../diagrams/34/99bb13225b25cc55311f728fc2890645.png)
![[Diagram]](../../diagrams/30/960187e52e40175ed1a8a4a419ce0fe5.png)
![[Diagram]](../../diagrams/21/dc595b5d3f3c0afbf8626d50679622c7.png)
![[Diagram]](../../diagrams/50/cf3d4ef2838d5c288a55f85491495677.png)
![[Diagram]](../../diagrams/46/758d95e241856ff9c35e4bba918a71b5.png)
![[Diagram]](../../diagrams/21/67a9c2ccc6b1eb2d7fc48d8828d411e0.png)
![[Diagram]](../../diagrams/43/198edfc6d85fed29016fc16a22b00dfd.png)
![[Diagram]](../../diagrams/17/8d9ede2878e60cd3630db1c4f0164794.png)
![[Diagram]](../../diagrams/18/fbd1c5f5d3e22747089f74cec5eef04a.png)
![[Diagram]](../../diagrams/1/7503666eefd6d8537af5ae712a9a4792.png)
![[Diagram]](../../diagrams/29/ad0e97fe9d41ff38c17cde437d67f51d.png)
![[Diagram]](../../diagrams/20/9823931bc6571aad54778a70e64f708d.png)
![[Diagram]](../../diagrams/2/778346adc562893552e8d7f7739def98.png)
![[Diagram]](../../diagrams/25/3f5dbe6a8f2184e2b76409235acdef82.png)
![[Diagram]](../../diagrams/31/340745b0a9dc3f6fdf6ec104f77cc6a8.png)
![[Diagram]](../../diagrams/23/b739252f27937ff0a75392b0db36ea3d.png)
![[Diagram]](../../diagrams/51/aad3a29c8f0cf887d538faa6924abb84.png)
![[Diagram]](../../diagrams/30/d9704a08f4576ef2524417089ba47e5a.png)
![[Diagram]](../../diagrams/34/94376aa6f02a2540128f3293c58ce003.png)
![[Diagram]](../../diagrams/12/819be51b1e2d8ee65daf6a9209164364.png)
![[Diagram]](../../diagrams/26/b244c7c6abb7cc742f6f9750d136d4cd.png)
![[Diagram]](../../diagrams/16/197045b1245b5a08630e05982069bfff.png)
![[Diagram]](../../diagrams/42/29fcdc5bf67e9ddcf7ff84d05423c165.png)
![[Diagram]](../../diagrams/20/94bb5090d30885270679e75adccc5e47.png)
![[Diagram]](../../diagrams/28/df1eb710c25e43509c3c23d1ee37f277.png)
![[Diagram]](../../diagrams/34/a28af98c34e8755d51a5baf1144045ae.png)
![[Diagram]](../../diagrams/19/eebde04c71e852decb9472886b5f4167.png)
![[Diagram]](../../diagrams/0/44de011081182dcd2549858cecdafc78.png)
![[Diagram]](../../diagrams/30/072d5f2db713a5b7983e812ab2bd9b22.png)
![[Diagram]](../../diagrams/39/8c2d139492706a06f5872728c777cd02.png)
![[Diagram]](../../diagrams/11/578d332e6b1cb9484400ec11e6f2c28b.png)
![[Diagram]](../../diagrams/1/4146e0e10ed36cbf14c810d3791132fa.png)
![[Diagram]](../../diagrams/41/40182094d1945251116460b2fd0221c0.png)
![[Diagram]](../../diagrams/22/88a48a56deb90b6ced60437b63a0cd45.png)
![[Diagram]](../../diagrams/19/e4013ff6447d1648da3abe71e5b80d09.png)
![[Diagram]](../../diagrams/47/2493d2cf0903acc2bf26ca43e5e54273.png)
![[Diagram]](../../diagrams/20/d43723eaa218d2b3d2a34a7870d28fbd.png)
![[Diagram]](../../diagrams/21/228648ce2fdf50b8b5b3340114455f2c.png)
![[Diagram]](../../diagrams/48/5595f4dccb650b1dff86c6a932a0e0d9.png)
![[Diagram]](../../diagrams/50/590ab3e41d482ba241d46d5b5abb54f1.png)
![[Diagram]](../../diagrams/3/cd44cf9993d6473c281ddeab4f895c8d.png)
![[Diagram]](../../diagrams/35/1f68c6232363f4f6a6cef711628c87b5.png)
![[Diagram]](../../diagrams/5/52905ebe9d357d3eb169f245db86b2f5.png)
![[Diagram]](../../diagrams/7/98aaa43b4f3c2316d23ef9ea8b630f7c.png)
![[Diagram]](../../diagrams/51/c1cb7582079e4a4ace66589869067100.png)
![[Diagram]](../../diagrams/49/51391268a2f3d60a3e6eb137fd4845ef.png)
![[Diagram]](../../diagrams/29/4f2fc58d2526961852a0193ec95f85df.png)
![[Diagram]](../../diagrams/20/ea7bae449eb288c4a0493813f06c5b3e.png)
![[Diagram]](../../diagrams/10/01b2985a4858b91d6139bf62a813d206.png)
![[Diagram]](../../diagrams/38/3dc2eb3b0b62bb72eda00f34ad597fef.png)
![[Diagram]](../../diagrams/11/c4a174122a619afb40502dcd28ac464a.png)
![[Diagram]](../../diagrams/45/ee32c5c4968d50f9c81b1a409553e742.png)
![[Diagram]](../../diagrams/4/33367582f22e0744e68a16e2583874a6.png)
![[Diagram]](../../diagrams/29/ac6df4dba7ad51328c19d32ac06a56e7.png)
![[Diagram]](../../diagrams/0/0172324b1ec2c82ddc1ebfc1956e6ad5.png)
![[Diagram]](../../diagrams/0/d35547340afbb4355756dc8dd0438987.png)
![[Diagram]](../../diagrams/48/1878e7a1d46d0955b91addfb9173b1c6.png)
![[Diagram]](../../diagrams/36/f1a62bed303eadc5c89492856fd828cf.png)
![[Diagram]](../../diagrams/50/c852aff12f0a59929defdc72f1f3d956.png)
![[Diagram]](../../diagrams/34/e651fc44d9abf0f04788a54700236391.png)
![[Diagram]](../../diagrams/22/da6a46a3be5a0809ae98e3e04a9ca61c.png)
![[Diagram]](../../diagrams/28/eb3cbf00d8ef95873bbdc5ef33d3eb6e.png)
![[Diagram]](../../diagrams/4/5af5abbbf0b14be9a023e0f8b306cd87.png)
![[Diagram]](../../diagrams/27/fe0b280511f83f9730af75ea5c490c32.png)
![[Diagram]](../../diagrams/51/cb6a0065b9ef37d96e781b1e97802e79.png)
![[Diagram]](../../diagrams/51/fa3a890d2a9130391b75e3158dd75ec2.png)
![[Diagram]](../../diagrams/7/c35d2209bf3ca592b1f2561b5924e317.png)
![[Diagram]](../../diagrams/35/6d5948c3b1ddc6f69ea7372c5271a4f0.png)
![[Diagram]](../../diagrams/43/5921c93694297169af809e4c802da73a.png)


![[Diagram]](../../diagrams/41/19acf1c778bfacca06ddb92512b5b9a7.png)
![[Diagram]](../../diagrams/3/02a8635a4cb946f871be370b7653e376.png)
![[Diagram]](../../diagrams/43/1cce1f9d47239f26e6484a3917cd1071.png)
 Aphorism is literally a definition and a term used to describe a principle expressed tersely in a few telling words or any general truth conveyed in a short and pithy sentence, in such a way that when once heard it is unlikely to pass from the memory.

![[Diagram]](../../diagrams/50/dabb10b826bf374146a92f871f183a7b.png)
![[Diagram]](../../diagrams/16/1665ba57051f0517a2186633a0840f94.png)
![[Diagram]](../../diagrams/12/2134cea05e0dae844dea7d7c62d507ce.png)
![[Diagram]](../../diagrams/24/970d7a3ca948ee28c340a55e6a5e2a23.png)
![[Diagram]](../../diagrams/18/cd4e8ace88bd10dba0114c5996dfd214.png)
![[Diagram]](../../diagrams/22/5f75befc53119819416b1900f35b815e.png)
![[Diagram]](../../diagrams/24/c4d5d230169f0b870f4e10338874a960.png)
![[Diagram]](../../diagrams/27/3e71adc8542168031097b179ddec1bcb.png)
![[Diagram]](../../diagrams/12/1e31e190f8e2d89172aa3ea8a4ff33b3.png)
![[Diagram]](../../diagrams/24/d0a0c300bfd0df7abb48127ab44d0509.png)
![[Diagram]](../../diagrams/50/f0c31d1b89524b5f61ab46f2b31b8fd8.png)
![[Diagram]](../../diagrams/42/da542d23fc2b3c83e966f51c1c22c6df.png)
![[Diagram]](../../diagrams/0/9b171d80795960a8b0c8704dc8577b75.png)
![[Diagram]](../../diagrams/2/3036c877f9651f03bfa53230a9b6e692.png)
![[Diagram]](../../diagrams/13/9e941ce8363e0790cb96507af7159f5b.png)
![[Diagram]](../../diagrams/1/eaf7d804223a01ae790f5dff3618106d.png)
![[Diagram]](../../diagrams/35/d2e8d866550078e395fb7dc259ad349d.png)
![[Diagram]](../../diagrams/30/90ece08e2fe68927b317820306904fc7.png)
![[Diagram]](../../diagrams/27/368f3b2fe08dd6613d40ed2cacceaf16.png)
![[Diagram]](../../diagrams/20/b1111e56429889bbd566c4923503e2b3.png)

![[Diagram]](../../diagrams/47/c5f0c15560fd5199f5542c50abbbdbee.png)
![[Diagram]](../../diagrams/8/c4ab45c50e4cc8ff59aee58780f37215.png)
![[Diagram]](../../diagrams/3/8ac234eab6772315644ed3872af348bb.png)
![[Diagram]](../../diagrams/50/3729ce5f417e075601051a3535215b1e.png)
![[Diagram]](../../diagrams/40/221a507cc085df3ea87a69a6917fd740.png)
![[Diagram]](../../diagrams/47/28145046bcb99b89e8c0b4a3e1af288e.png)
![[Diagram]](../../diagrams/5/dac08a4b9b2f0c8f65f1f019ae53eac5.png)
![[Diagram]](../../diagrams/13/c2bb141d11d6d61a2bdb49269ae0d357.png)
![[Diagram]](../../diagrams/51/e332547d4ea1f84960e94be678574a52.png)
![[Diagram]](../../diagrams/44/cded81c9056fa0fa8e5e6064df983e30.png)
![[Diagram]](../../diagrams/0/a655efbef13be220769708361def97cb.png)
![[Diagram]](../../diagrams/18/ba6f61154f56fc6652b74140ed4e1225.png)
![[Diagram]](../../diagrams/33/e60bdafa31c84b5089e9b789dbebda23.png)
![[Diagram]](../../diagrams/42/22a5e0ba521f2871ee9a9b16a1b0479b.png)
![[Diagram]](../../diagrams/52/8ffee4debbfbf750d30944759d29e8ff.png)
![[Diagram]](../../diagrams/45/d848f60f16748c9b1ac81fe581fb4040.png)
![[Diagram]](../../diagrams/35/e5d1f10dbac25f3c9ee9577cb3ef009c.png)
![[Diagram]](../../diagrams/14/203e5850a0d91eda859e3ecc49fb9560.png)
![[Diagram]](../../diagrams/6/cc7eff45b8fe8c7be61bf9dbc2449ed5.png)
![[Diagram]](../../diagrams/41/d051e6f51c39d4473327ad2b80b06f5c.png)


![[Diagram]](../../diagrams/32/9a614c236155c7bf2f03ea8fea476344.png)
![[Diagram]](../../diagrams/41/15f2c09f875ad8087217296fa17f4ea2.png)
![[Diagram]](../../diagrams/14/688f7ea7d2a94a168b89578a8a4203e2.png)
![[Diagram]](../../diagrams/48/099c279d2c6898ad6348b165072a475c.png)

![[Diagram]](../../diagrams/26/bb39d05cfcbeb8e71aeed3684631201c.png)
![[Diagram]](../../diagrams/39/06d0227d1c0d24db4798c516ee27b02b.png)
![[Diagram]](../../diagrams/17/4c578f6f3417a7c3f82f423a7a541bd1.png)
![[Diagram]](../../diagrams/41/11e623b645afcce7ff9162ada228e8fa.png)
![[Diagram]](../../diagrams/41/aab2a0a8bc50d5ecdb9c3dcd8928584e.png)
![[Diagram]](../../diagrams/5/d3d8a9083d2db4d84947fe548cf4bc27.png)
![[Diagram]](../../diagrams/0/82d3d9d1fe8a88d667e5b8125d43f45b.png)
![[Diagram]](../../diagrams/23/0c6595be2795028b896e8f931e74b373.png)
 --Arno
![[Diagram]](../../diagrams/20/2255428ba2668328f704a0259142b498.png)
![[Diagram]](../../diagrams/22/f4e9a169d5d9499f1901f97c47b7f51a.png)
![[Diagram]](../../diagrams/33/406ed119194638035bb2e4d4ea9ce081.png)
![[Diagram]](../../diagrams/37/272edac85919147def1ea1037e1e58c8.png)
![[Diagram]](../../diagrams/0/864c3992752e9f030cb734460c178e5b.png)
![[Diagram]](../../diagrams/50/f70f68101b9b8fcf76d43e12562b6fd6.png)
![[Diagram]](../../diagrams/0/681912dcbc2ee0378b238c25e6f8ab57.png)
![[Diagram]](../../diagrams/49/1ca5a0d00a13ab83ccdc6ddc616c6023.png)
![[Diagram]](../../diagrams/51/7d6a090a133f200ad751f65a45578648.png)
![[Diagram]](../../diagrams/32/f3b2b10003be0789a1b955b8a8475048.png)
![[Diagram]](../../diagrams/31/1bfbdb5b6143a398c2db5efa3c1da219.png)
![[Diagram]](../../diagrams/39/35212bb82a8eb099f81656e2a6e4f007.png)
![[Diagram]](../../diagrams/37/ea4fc0ab7518a66f405b21412e0778c3.png)
![[Diagram]](../../diagrams/15/6b0fac43ed6e9de9b3ce12845a259911.png)
![[Diagram]](../../diagrams/21/d42ac957961a66e2c3209276c12c5b00.png)


![[Diagram]](../../diagrams/14/4cbffd7ca4e03290c1fb2cd6d8b72820.png)
![[Diagram]](../../diagrams/13/644661098771b1ac0ab0c8d33a96b242.png)
![[Diagram]](../../diagrams/4/5092fe07a1d2b5c434fbd0831f80e09b.png)
 stone has only one breathing space left (at
 ![[Diagram]](../../diagrams/52/e9a86f63ebc4b07a6672858b20f0ab13.png)
![[Diagram]](../../diagrams/28/09c2bbac5290e9c0e9bdf1cb5a0764c4.png)
![[Diagram]](../../diagrams/16/9bff8cb38cbf238e8570cb5bfe768662.png)
![[Diagram]](../../diagrams/4/1b1043e51892d69141ed3544277942f7.png)
![[Diagram]](../../diagrams/6/1baacfc554f21c08a0b1cc8a82feba17.png)
![[Diagram]](../../diagrams/38/bceebc30e38a051248dfb418aa75a22a.png)
![[Diagram]](../../diagrams/13/abdb6895a4feb5d3c0e85ba31117d0b0.png)
![[Diagram]](../../diagrams/0/091682aaf25971895b27e9750ca3944a.png)
![[Diagram]](../../diagrams/33/b4a24989241bc062cb62d81d148da30d.png)
![[Diagram]](../../diagrams/35/97770c54626ed61cb5c53e6cb81173c9.png)
![[Diagram]](../../diagrams/11/dd5f14ed3efb29a6bc74635f90966d12.png)
![[Diagram]](../../diagrams/1/64ee8ecc3b8baae7768eece39ea8fd72.png)
![[Diagram]](../../diagrams/12/feb7c2383371c45604c55950c626a15a.png)
![[Diagram]](../../diagrams/46/3d23f64a2286637ca92aabe911f9cf06.png)
![[Diagram]](../../diagrams/40/8da3e9a64d0f11ad7ee86f9f8ad4ac93.png)
![[Diagram]](../../diagrams/37/a8ff0c0a32c2138acfb3b0983db26f84.png)
![[Diagram]](../../diagrams/41/5efcbe969b7645688baf70ecf19cbbe9.png)
![[Diagram]](../../diagrams/5/7bf851ffc735cf4492814e8625c1af08.png)
![[Diagram]](../../diagrams/31/8bf2d9c1c003bba23ba92c2720cb6fc4.png)
![[Diagram]](../../diagrams/23/84317c7b287fe9b3ae1f96b3a01ab5e5.png)
![[Diagram]](../../diagrams/20/f38c70e4ef2cd70d81d7688230673399.png)
![[Diagram]](../../diagrams/33/9952b8cf6fdd0b5a921eae61476c3b93.png)
![[Diagram]](../../diagrams/1/f32e26bbc20fc65d2199ccbde3a2d0ef.png)
![[Diagram]](../../diagrams/17/1310a1182e8fd00ceef0fa34309c2184.png)
![[Diagram]](../../diagrams/1/c30647da97e2762135ef2bc09d4affeb.png)
![[Diagram]](../../diagrams/31/ee760c6b4438d719aa4a5a2b1d9df79a.png)
![[Diagram]](../../diagrams/37/35e5848b6baaf6f9ae138507beaf2d90.png)
![[Diagram]](../../diagrams/4/dbf888c5963cdffcc4ed3b594262800a.png)
![[Diagram]](../../diagrams/17/480e303b41e4c636e0966cea0a8e7ffe.png)
![[Diagram]](../../diagrams/35/4e5f803f8bf8ece62b712520de84da73.png)
![[Diagram]](../../diagrams/12/608cd3366426a139a1f12a74fcc48ef3.png)
![[Diagram]](../../diagrams/22/d127e326197bf11b8684b39be95fce06.png)
![[Diagram]](../../diagrams/32/4b0ea4cff982ba756a5b3d3540972cb0.png)
![[Diagram]](../../diagrams/45/d497a28b0ea3ab7df9d7f319b08327af.png)
![[Diagram]](../../diagrams/37/0e41a9c39d0d925e1580d22051a3b5c4.png)
![[Diagram]](../../diagrams/14/58fb9d7a18a2421fcbb3af4bc6f14e53.png)
![[Diagram]](../../diagrams/48/efb0d07fb0aeac534ea7476f15c23f95.png)
![[Diagram]](../../diagrams/10/9ef8a5f0917127545cd90afd75004ca4.png)
![[Diagram]](../../diagrams/38/ed0318b8b477eccc3f4e4c256831f6af.png)
![[Diagram]](../../diagrams/30/3d0abb8234aff91a8332b5c315e4ca6c.png)
![[Diagram]](../../diagrams/48/4ee1acf89cffc0e9f0762b11c6a2c04a.png)
![[Diagram]](../../diagrams/42/f3a7f4f25b96a0e95d355af2f52201e3.png)
![[Diagram]](../../diagrams/28/8fcbb0fc11e4d9075036129fe19284f6.png)
![[Diagram]](../../diagrams/19/dca04e168e135b294997ef9e8764f94c.png)
![[Diagram]](../../diagrams/39/dd33cf46759efab93b9e47ed1a07b55e.png)
![[Diagram]](../../diagrams/26/ae6b6a553cbf2b4e6d7f82263a48539b.png)
![[Diagram]](../../diagrams/37/9bed707520626a585d4752160039cbfc.png)
![[Diagram]](../../diagrams/26/7f8bd5da762ffcb01244dc56e418b4b6.png)
![[Diagram]](../../diagrams/45/07a10c91e449de1717a9c12e3edb365a.png)
![[Diagram]](../../diagrams/25/acb2cec683fda92e9868f45f20efbb58.png)
![[Diagram]](../../diagrams/27/45f53cad70d117943eed11ba3eee9d65.png)
![[Diagram]](../../diagrams/52/69b1840c77fdce864fc1d1b31a5f5860.png)
![[Diagram]](../../diagrams/48/c0e75821383e94a5b283bd0176c38925.png)
![[Diagram]](../../diagrams/42/cda488ac858bf4ca520e5766096c656f.png)
![[Diagram]](../../diagrams/8/f8ee3f2e98b995e55a4d0761f1aeec6d.png)
![[Diagram]](../../diagrams/7/ed0170fa53243a3499335796ba337ccd.png)
![[Diagram]](../../diagrams/4/0372e7e206d2dc5bd70e4f1f5d352468.png)
![[Diagram]](../../diagrams/51/ba757c06af5af891fb445f985aa99c38.png)
![[Diagram]](../../diagrams/52/2a50feaa28403b81dc4a7640b9e78780.png)
![[Diagram]](../../diagrams/26/2e00167a40e42d2f282f59bf2ecf65f2.png)
![[Diagram]](../../diagrams/12/90de2e75e9d2e2f0d090f959892bfd68.png)
![[Diagram]](../../diagrams/10/0623b01ce801db6f68d2abeddc8d4efb.png)
![[Diagram]](../../diagrams/27/ed82daebfc1e0be081a2b3b63ef41809.png)
![[Diagram]](../../diagrams/24/dfb6928541b78a4d3c5c3ccae794d3d8.png)
![[Diagram]](../../diagrams/8/1388e1fc8c521f10884434419e3fcd1e.png)
![[Diagram]](../../diagrams/9/dbd5b8a42bf5623f25678e7e00837b8a.png)
![[Diagram]](../../diagrams/8/1240c9aa0e50d706c0fc8f193c797a50.png)
![[Diagram]](../../diagrams/11/4da5951373cf4bee1e36cba4cf770aa9.png)
![[Diagram]](../../diagrams/5/f9aff685e8f6d9b8ed4ca7f86ed9fa21.png)
![[Diagram]](../../diagrams/22/e04ee5605a6463944b97f812b7fbc95a.png)
![[Diagram]](../../diagrams/4/b41da8ccb44f42b3a01e5ecbf744e978.png)
![[Diagram]](../../diagrams/43/e1b0b0d07dc95f02331520f2c0081afb.png)
![[Diagram]](../../diagrams/34/6497ad425a502b625f9fe4ce9cf97c38.png)
![[Diagram]](../../diagrams/12/2a403415ba7a95d753636035ce2d1121.png)
![[Diagram]](../../diagrams/47/d2178c25c9dd1cc69d472e085a352f6a.png)
![[Diagram]](../../diagrams/26/573b7809234fcf7428992266cf10bb77.png)
![[Diagram]](../../diagrams/40/1fb849a50a690167a48056859d359b9e.png)
![[Diagram]](../../diagrams/24/36007254b0ea5e006697f3606e4acb63.png)
![[Diagram]](../../diagrams/21/7bfc969967548bea8f1ad8db1abe03a2.png)
![[Diagram]](../../diagrams/34/7e0083de12878c3416a2b7bca04d7bcf.png)
![[Diagram]](../../diagrams/45/6b627752df7ef12cbee8463885efc729.png)
![[Diagram]](../../diagrams/18/7448b706d81e8acffa6118c8598b42e6.png)
![[Diagram]](../../diagrams/49/8967438ca553c81a6ef4f2269c605db1.png)
![[Diagram]](../../diagrams/39/0b117d43ed86bfabecf0e5a15c4482db.png)
![[Diagram]](../../diagrams/2/93a8e108faae8ff3fbc895000837acec.png)
![[Diagram]](../../diagrams/12/9f78dbe91f9b3cdacde426c084170ce5.png)
![[Diagram]](../../diagrams/50/b6d90a580cb8af7f3138a34f6d8fa269.png)
![[Diagram]](../../diagrams/33/f3b212da4b56b52524f627b8fcc5fc8b.png)
![[Diagram]](../../diagrams/35/279681f5f8324dd2fbbefe820b4b613e.png)
![[Diagram]](../../diagrams/42/848a32d1d707c66bae4f2a6044eaee4d.png)
![[Diagram]](../../diagrams/10/85a74ea2c6fdd3e7763dbdc2ee6306fa.png)
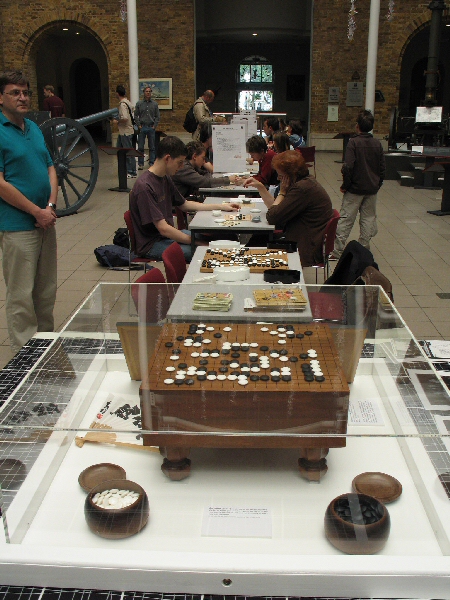
![[Diagram]](../../diagrams/44/9f6bdea1ab68ae4e7e47deee1ff73280.png)
![[Diagram]](../../diagrams/16/69cc367b49c54f04cca5cf7793a02414.png)
![[Diagram]](../../diagrams/29/e35746d3867c25cdf55908a959ac95a8.png)
![[Diagram]](../../diagrams/38/2c8884148f99b725a52844324d61b7bf.png)
![[Diagram]](../../diagrams/22/5448edac930d51c30c5aa80175dde99f.png)
![[Diagram]](../../diagrams/2/61a7de80408d90bd8437cbd000a785be.png)
![[Diagram]](../../diagrams/37/16259840a443fd585028ed44610ffe8e.png)
![[Diagram]](../../diagrams/17/a2c7a883979b1e14605a8dd521720e8a.png)
![[Diagram]](../../diagrams/51/3f508a541c9973f846840a36b6c54444.png)
![[Diagram]](../../diagrams/15/82532c895610e227ab0d94428c02e1b3.png)
![[Diagram]](../../diagrams/47/7c80c9d696576d836ca5529bdef8811c.png)
![[Diagram]](../../diagrams/7/c6f28c812da2554efd1d3a5512e14a7a.png)
![[Diagram]](../../diagrams/50/76ad7b1dd5e279631cd7c74072230592.png)
![[Diagram]](../../diagrams/44/720edea6aac99413fcee13c8ec38055a.png)
![[Diagram]](../../diagrams/6/801d5b1120f5a2ce26fe62e092857958.png)
![[Diagram]](../../diagrams/20/3dbcfa4d7c67e26a7005fa178430528b.png)
![[Diagram]](../../diagrams/28/8a789131f70a2aa89f5940d77afcee13.png)
![[Diagram]](../../diagrams/15/35eea389e03b805e6e32b173e62cb1d0.png)
![[Diagram]](../../diagrams/26/5ba61d7a5167a757dc5f8317bc7ae872.png)
![[Diagram]](../../diagrams/22/da07e78be000adddb21a46a5618e34c9.png)
![[Diagram]](../../diagrams/17/304a6f6eb8cd94d1db6a3306be051a5c.png)
![[Diagram]](../../diagrams/4/cd51623011486d72c0056dedbc2d7862.png)
![[Diagram]](../../diagrams/14/7ed42df98f3ce12c2cf7791a85ee581a.png)
![[Diagram]](../../diagrams/23/16c7ca5b379b5651e931d997caa7ded5.png)
![[Diagram]](../../diagrams/48/a8e3c3c9142b4ef26fe68be245a00a23.png)
![[Diagram]](../../diagrams/2/48330ca066c2cd704cd2840cf6bd608d.png)
![[Diagram]](../../diagrams/51/ff95a224aae89bf3216b95d55be45e5f.png)
![[Diagram]](../../diagrams/20/82379167534e4f92e29e77faf83ffdde.png)
![[Diagram]](../../diagrams/41/c0b7b58c889b7508f4da8f1753eb1e8f.png)
![[Diagram]](../../diagrams/46/1b667943970145101e05d692eb28e946.png)
![[Diagram]](../../diagrams/32/af4fdaca5a03177f19840537e299c84f.png)
![[Diagram]](../../diagrams/23/3e24516906a9222d8e21fd105c118852.png)
![[Diagram]](../../diagrams/17/f06a5000107698eeeb252543c9699aaf.png)
![[Diagram]](../../diagrams/19/4d5b7e6cb93d2600a16a1a7944d2e1cb.png)
![[Diagram]](../../diagrams/39/dae5143241f096e40a0c7f6d8b5af726.png)
![[Diagram]](../../diagrams/27/5b552d5712954329118884ce6ed83600.png)
![[Diagram]](../../diagrams/17/a6d7d1570a2beb4621bd3f7f8455c0c3.png)
![[Diagram]](../../diagrams/42/2e8e0b16e646f2fe82c93921ad3e4053.png)
![[Diagram]](../../diagrams/49/e9e201579087985a86af5811a0ae2254.png)
![[Diagram]](../../diagrams/5/b11758e6a143eef182ef750e5b43d0d1.png)
![[Diagram]](../../diagrams/9/eaf18ac6a6b9d71f097d3ccbb0292bb1.png)
![[Diagram]](../../diagrams/35/ec43a81306818cc41bfe00ca6bb4cc4c.png)
![[Diagram]](../../diagrams/13/2def0d4d913e928fe6c8d0ba440b8ad5.png)
![[Diagram]](../../diagrams/30/69f45ca4c0181394be5c857030a7d823.png)
![[Diagram]](../../diagrams/45/58430564e1a051a02cf3b75f46b787e3.png)
![[Diagram]](../../diagrams/22/d9f330061852a89efef92018e7a83365.png)
![[Diagram]](../../diagrams/7/1a14e97e96eeac8913e078efa10a4626.png)
![[Diagram]](../../diagrams/7/8e0d689fa4c033bf4967e0024136d6ef.png)
![[Diagram]](../../diagrams/16/61406088df361744973386cd0b03ea3c.png)
![[Diagram]](../../diagrams/49/b80d39a14aabcb1242d8622ac7be3c21.png)
![[Diagram]](../../diagrams/50/cfdb2e892dde58b3541fe26bffc8567b.png)
![[Diagram]](../../diagrams/40/11ec4dcb8500cfba79b51e93fd0ca79c.png)
![[Diagram]](../../diagrams/27/9787a53457ff72fb179fca45a8a81318.png)
![[Diagram]](../../diagrams/2/da584652c102e5f9489f512d5ce04f08.png)
![[Diagram]](../../diagrams/14/dc8ced8c363bd2a28af25803d51dbc7b.png)
![[Diagram]](../../diagrams/16/53e125801b496da061e16ac60e27f008.png)
![[Diagram]](../../diagrams/35/f073ac27648378a1950c440c6119367f.png)
![[Diagram]](../../diagrams/47/90285f3f9d33f03ecb780c1d60d9b051.png)
![[Diagram]](../../diagrams/13/cb8d4e6ad93ec76b030c79b7eaf799ac.png)
![[Diagram]](../../diagrams/52/51299aefb55f969c7c51e920f3f41c04.png)
![[Diagram]](../../diagrams/50/49152fada0e5adc5cf44db6ce47d2ea1.png)
![[Diagram]](../../diagrams/26/87ce69da3fb049353d2368cd6b7e495a.png)

![[Diagram]](../../diagrams/2/e3ee41ad7b5c8617165fcdddc4c33ff7.png)
![[Diagram]](../../diagrams/11/52cb75c8e6283a786dd5a0e5a938f09b.png)
![[Diagram]](../../diagrams/16/1496dc9dc9ef697a819a60d329dff09f.png)
![[Diagram]](../../diagrams/35/048c362ec6defa40c22c0a61a24fd14a.png)
![[Diagram]](../../diagrams/49/ef1798f87d31cc19e1a30c895b28ef4e.png)
![[Diagram]](../../diagrams/6/4000ee0309073c5ddbb15a6970c598a0.png)
![[Diagram]](../../diagrams/5/3b8d5135aab35d00605a12b1aba8c874.png)
![[Diagram]](../../diagrams/32/38d81d75c4020459206eed38fd34c716.png)
![[Diagram]](../../diagrams/16/7ab5c74dc4c66a9f8dafaff2c5f44cb0.png)
![[Diagram]](../../diagrams/27/bb614cd2d80e22ffa0fe42639b5b636c.png)
![[Diagram]](../../diagrams/15/0d7239b194763479eb078d4f9e41ebaa.png)
![[Diagram]](../../diagrams/34/67bb31577228fd2b83ea90ce326ae079.png)
![[Diagram]](../../diagrams/32/2385c04b767485ac036a85e2cbb3609a.png)
![[Diagram]](../../diagrams/18/64b3596d646013f2f8658655cef69a6b.png)
![[Diagram]](../../diagrams/18/bbb664e741046a92f7b4ce74ba1aa13c.png)
![[Diagram]](../../diagrams/10/8437fee44f0769dd10cad2f60e8c0b6a.png)
![[Diagram]](../../diagrams/29/ba9dbc875b890bf3c30d96107cab5e2d.png)
![[Diagram]](../../diagrams/18/996f05fdcf0c2a50bdeed8cb658201ae.png)
![[Diagram]](../../diagrams/22/e7bfc74252ee5c67c14bfe2e971fd807.png)
![[Diagram]](../../diagrams/20/a90c9dd67f4a2131ca7de817320d3cbc.png)
![[Diagram]](../../diagrams/30/a94d48a7eed6f6a3dcd5d212c38d5efe.png)
![[Diagram]](../../diagrams/9/327aca1d90b7357737a44615a47374a3.png)
![[Diagram]](../../diagrams/23/a2c7c9002bcc5e0fdd5acacb2bf09466.png)
![[Diagram]](../../diagrams/47/a30c3840f2340cb366c3dd43d346ca58.png)
![[Diagram]](../../diagrams/4/e2d7163f2fda4a990e2aa8c099cd4811.png)
![[Diagram]](../../diagrams/19/6d52321d090ba8e4635e6c3ee7adf678.png)
![[Diagram]](../../diagrams/0/e0f6c1a8f1fb12a11005702d4d468ac4.png)
![[Diagram]](../../diagrams/39/2be87afcd17ff7934d0aee78f55c9715.png)
![[Diagram]](../../diagrams/4/bf70fc4e2924a753d566e73612851597.png)
![[Diagram]](../../diagrams/41/ee91d391188453ce603cf34f6955e7c0.png)
![[Diagram]](../../diagrams/21/a58f80afc7666639de197570abdf9266.png)
![[Diagram]](../../diagrams/16/93702c349ef7cf28f4ef42552a5e66c0.png)
![[Diagram]](../../diagrams/0/01c6feacb9074662e9bbe8aea1102284.png)
![[Diagram]](../../diagrams/2/f8b4c70b9ff64f27fbcec6bb188cd23f.png)
![[Diagram]](../../diagrams/18/17329baf0fbd0944adfe6c17ca806b3f.png)
![[Diagram]](../../diagrams/42/6f5125febd10179e074713b9229fb165.png)
![[Diagram]](../../diagrams/51/f672fc27638fa51ffbadbdc94241dd62.png)
![[Diagram]](../../diagrams/4/44d5a8db34445670d21d687025d9d1b4.png)
![[Diagram]](../../diagrams/6/d104fb507d096e5a7175ada8d3a0e614.png)


![[Diagram]](../../diagrams/4/9b6d41530f31ccf89e75fbcac8b458d8.png)
![[Diagram]](../../diagrams/40/f5bebd2e9d19df6168f55db525760c6b.png)
![[Diagram]](../../diagrams/24/a7d9b66c53bf117c2949f64b9e408be8.png)
![[Diagram]](../../diagrams/52/b3563f4c0115edfeae7feaeafe7bf3d0.png)
![[Diagram]](../../diagrams/39/edc7253dfcc3bcde8b1ed0c28e7230be.png)
![[Diagram]](../../diagrams/13/d81dc5933a42e76f93e6787bba565650.png)
![[Diagram]](../../diagrams/2/b95a41de04ec2ca4c1628bc3e52ccdc8.png)

![[Diagram]](../../diagrams/13/beac3f80bbc98da5de7574c5de395360.png)
![[Diagram]](../../diagrams/41/d1aca4219ace8c355a365fa3b2948c0b.png)
![[Diagram]](../../diagrams/23/0d9525062939258a1caccfc96f39882b.png)
![[Diagram]](../../diagrams/7/764c1494984b1230d350aab9823bf362.png)
![[Diagram]](../../diagrams/48/787ac63d2ad1485dc068eea2595c4e83.png)
![[Diagram]](../../diagrams/31/0bc2222033639f6aa88350c84dda6769.png)
![[Diagram]](../../diagrams/4/f83f2334a163271a74e14622fdc3309e.png)
![[Diagram]](../../diagrams/17/ddd56dd8cb7d2fec471e6d8aa0832b49.png)
![[Diagram]](../../diagrams/23/d20ed9c8993f5075168af902b185c7b4.png)
![[Diagram]](../../diagrams/16/30fa2170a934d7ee0f3edcdea18170bb.png)
![[Diagram]](../../diagrams/42/9b1e60c147d0578b32d06b4ec94da5c4.png)
![[Diagram]](../../diagrams/1/614556b6f0c36658d29c378bfdac4558.png)
![[Diagram]](../../diagrams/30/0a2214dd6d1b0da8132feae7991d1071.png)
![[Diagram]](../../diagrams/0/fa04ae1057d0e2c2c466b0404a7b6281.png)
![[Diagram]](../../diagrams/35/064a8bd03859aa3fb0137ef797522d53.png)
![[Diagram]](../../diagrams/45/cf87187d0931d1dfe836ae14f04c403f.png)
![[Diagram]](../../diagrams/33/7543eebd38d25e732ab3082887fa0031.png)
![[Diagram]](../../diagrams/20/0ccb82f4e64e16e574d8144bcb8705a1.png)
![[Diagram]](../../diagrams/9/ecfda76eeb05fe19810d230fa37cff15.png)
![[Diagram]](../../diagrams/30/e3680982c2031be6096538dded338aec.png)
![[Diagram]](../../diagrams/7/84934fb11aed33ce7e944f1b877b14ed.png)
![[Diagram]](../../diagrams/7/72b97dcf920489c30f92c7748f5bf318.png)
![[Diagram]](../../diagrams/18/bad5c1fa5234b66ca17a988625f15f2e.png)
![[Diagram]](../../diagrams/23/91d1942e7c2c629fd4842f0dd1b0fa9f.png)
![[Diagram]](../../diagrams/37/a0dbfcf6614dbd86f4c57a3ec85b874e.png)
![[Diagram]](../../diagrams/24/d33fdaef624e81d27f8c64b832ff9502.png)
![[Diagram]](../../diagrams/11/4e13d09ce90615e11f167586103e6f2f.png)
![[Diagram]](../../diagrams/26/3dcb430c2b22633d479372edb398124f.png)
![[Diagram]](../../diagrams/47/b411836e5805cc9543a6288f720375bd.png)
![[Diagram]](../../diagrams/47/ac43c9a4ef6c5f245c523d2d6ecd66f0.png)
![[Diagram]](../../diagrams/10/ce40cd8e4fa48a8bdaad0c088a5fcb12.png)
![[Diagram]](../../diagrams/12/3997862852efc8a4b6c2693c7b9b9bea.png)
![[Diagram]](../../diagrams/20/b6065719b5c24330eef8ade91deda666.png)
![[Diagram]](../../diagrams/38/3520d78b070b04c95d4159c393b5d604.png)
![[Diagram]](../../diagrams/16/4458c7110d0d418ed8a11c00acff3984.png)
![[Diagram]](../../diagrams/36/9706946d247b5eeb306a474e2647fb79.png)
![[Diagram]](../../diagrams/9/8ab3c36f446c05dd59fef1238700bc7e.png)
![[Diagram]](../../diagrams/25/abb368b596599046e5ca9c52bcfe10c7.png)
![[Diagram]](../../diagrams/1/f9f9f2d874e7452dcc4d3254e52c010d.png)
![[Diagram]](../../diagrams/5/cf94308f377fd49e260558c1ae9a683b.png)
![[Diagram]](../../diagrams/22/d108c76a9df4d65271a931772ff8b8c1.png)
![[Diagram]](../../diagrams/12/341b268f1fc60658af63b9aaf1526902.png)
![[Diagram]](../../diagrams/26/acc172bcb7fc508726c3fab29424d533.png)
![[Diagram]](../../diagrams/5/6ca735490d8b4f461a3d8f164fb6ffeb.png)
![[Diagram]](../../diagrams/38/d46c0d77c9b59753f4950375625169be.png)
![[Diagram]](../../diagrams/37/6a11603d93dd6584b82d51984bb70135.png)
![[Diagram]](../../diagrams/20/af9936273decd38a8bc4bdb47795bb85.png)
![[Diagram]](../../diagrams/19/20dfef3323a3ea53d017407e2b8fefa0.png)
![[Diagram]](../../diagrams/25/6fd5f5abe50f386d6284d969edda7c28.png)
![[Diagram]](../../diagrams/5/fa94d2047abb5f2db4f37adb2e804249.png)
![[Diagram]](../../diagrams/49/e4c0843fcd901ca1e8a6857f73516a8c.png)
![[Diagram]](../../diagrams/31/5a082b68763fb9918e455cd6b3e04b02.png)
![[Diagram]](../../diagrams/44/930c2b1396216b547f073d0a9ba1a102.png)
![[Diagram]](../../diagrams/37/fac56d0a1b08c9aca154dcbe5f4c8c0b.png)
![[Diagram]](../../diagrams/26/7a81ec17fa864a604e2264144d4bf832.png)
![[Diagram]](../../diagrams/45/2b091677a771177858f1e057b7435a01.png)
![[Diagram]](../../diagrams/11/bef7afcb2529c7dfb02b4f717a7a3357.png)
![[Diagram]](../../diagrams/20/d47782d4516a0b8d5f5b6b0951102d24.png)
![[Diagram]](../../diagrams/11/da62079efbd02f2a468f20d1ae858197.png)
![[Diagram]](../../diagrams/14/7fab1e583ff2b12d5351a6fa6f890a86.png)
![[Diagram]](../../diagrams/52/937c89c1dac9f1ad0f70942eab9f27e8.png)
![[Diagram]](../../diagrams/25/737da44d3175f6c0e664f3f929ca8f74.png)
![[Diagram]](../../diagrams/20/2644708c548d1d0d20bc19d04f30711e.png)
![[Diagram]](../../diagrams/18/0572d6d1c3ad142c0eece5b18d537740.png)
![[Diagram]](../../diagrams/43/7c688d387dfc8f20da68767fc12b3d41.png)
![[Diagram]](../../diagrams/42/bda930b749b1646437262155d5227ea5.png)
![[Diagram]](../../diagrams/22/53c29ae0a633824fa944501f22802506.png)
![[Diagram]](../../diagrams/6/ec77a790684c777ed5d94b55c0186474.png)
![[Diagram]](../../diagrams/27/a3ab3686c4c00c2cd3a2532406ef8c48.png)

![[ext]](http://photo.hankooki.com/gisaphoto/20051103/ensor200511031927311BADUK2.jpg) http://photo.hankooki.com/gisaphoto/20051103/ensor200511031927311BADUK2.jpg
http://photo.hankooki.com/gisaphoto/20051103/ensor200511031927311BADUK2.jpg![[ext]](http://photo.hankooki.com/gisaphoto/20051208/ensor200512082116420baduk1.jpg) http://photo.hankooki.com/gisaphoto/20051208/ensor200512082116420baduk1.jpg
http://photo.hankooki.com/gisaphoto/20051208/ensor200512082116420baduk1.jpg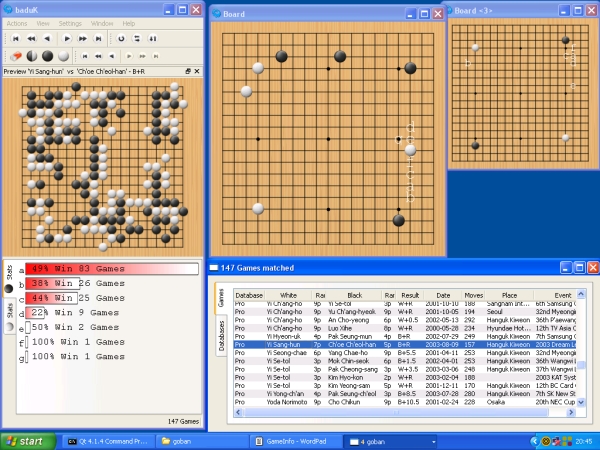
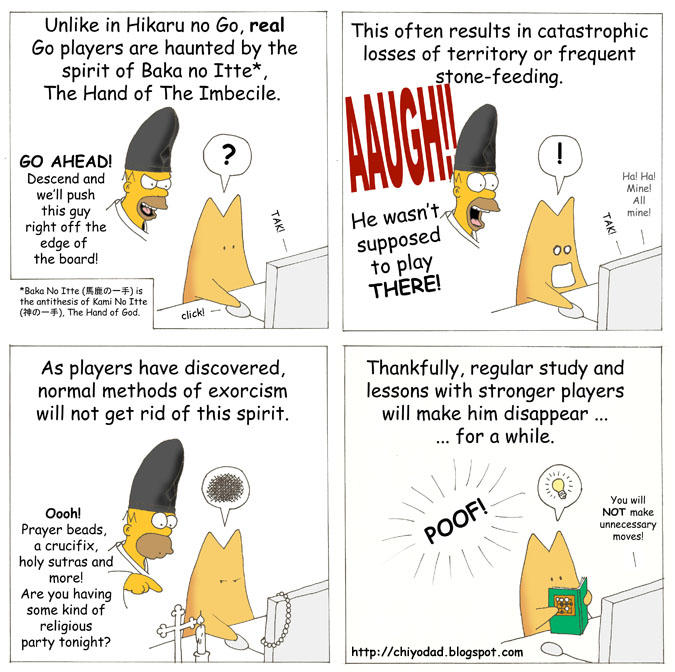
![[Diagram]](../../diagrams/21/f72f1fbec6d1904fe9cbc34663c77cb7.png)
![[Diagram]](../../diagrams/44/cd80ae94f598a595a964fcf18236f840.png)
![[Diagram]](../../diagrams/3/62c1b587a09c39fbf819b9f3ec05bc5d.png)
![[Diagram]](../../diagrams/28/3bbda62c35ecbfc725d5a2b95c491967.png)
![[Diagram]](../../diagrams/45/0fb194ef4b1cd741c3bda5f682647842.png)
![[Diagram]](../../diagrams/22/906721f9824495d4539738f0e9a4dbe0.png)
![[Diagram]](../../diagrams/18/455a9e10a86fb9fb0c1b1dfc3c69952e.png)
![[Diagram]](../../diagrams/52/aeae75a90bcd374202ed78e3860cf3cd.png)
![[Diagram]](../../diagrams/17/bcdbddafd11e6a1b4c1c1fb42adf82e7.png)
![[Diagram]](../../diagrams/9/1bd11c8d31273ba01be7b92641e9398e.png)
![[Diagram]](../../diagrams/39/c9d63be70514ed103cf134a375569c3f.png)
![[Diagram]](../../diagrams/20/06e68cce117354e3143b7bd6fcdfea6f.png)
![[Diagram]](../../diagrams/27/760e14f363b30c5a3974ba4c4d5a98bb.png)
![[Diagram]](../../diagrams/49/d840d80182c98ae81cdb0c4e482000b3.png)
![[Diagram]](../../diagrams/26/2e3c4f2b9ce1d91b86b49a42decd28f7.png)
![[Diagram]](../../diagrams/29/1669294c293de377eab0b782b7e700f1.png)
![[Diagram]](../../diagrams/27/460dc9e8bb31c85c80bc859d7a1280b9.png)
![[Diagram]](../../diagrams/52/6f0db7960547f1dd1680f1e5ddf0b3f8.png)
![[Diagram]](../../diagrams/13/373ce784c4093616d7d67a07f65905a5.png)
![[Diagram]](../../diagrams/50/cbba2936de89e3641b59debd84b25c98.png)
![[Diagram]](../../diagrams/23/3359c8c2aa1a1ddfe37594fe03f11e0c.png)
![[Diagram]](../../diagrams/49/80c3baaa7a25a87b0057825ba30a0b6e.png)
![[Diagram]](../../diagrams/11/1b802b61508027501b670aeccfa1babc.png)
![[Diagram]](../../diagrams/19/19280d57430f89a8121e518ea611986c.png)
![[Diagram]](../../diagrams/42/e435e4552278d95272e903d8e9988995.png)
![[Diagram]](../../diagrams/28/7cb57af17f025ceb247b56107ad972d7.png)
![[Diagram]](../../diagrams/14/d66d9949b7a102241a884c5dae9766cc.png)
![[Diagram]](../../diagrams/29/790b5a2343e5c94be26c87f3b8ba44f6.png)
![[Diagram]](../../diagrams/31/ca08c82a68e074afdb412f7fac980257.png)
![[Diagram]](../../diagrams/29/255e8bde312c17b87fca415f2c214611.png)
![[Diagram]](../../diagrams/23/47082fcb7b9b4c501dd7b3ef94ba9da5.png)
![[Diagram]](../../diagrams/38/a1f3d4038242e8bc02dbe8132f20dd2f.png)
![[Diagram]](../../diagrams/47/31da446813699bcf3e6ab2f41ce55992.png)
![[Diagram]](../../diagrams/24/19a4fc3c3ceb7e569edf8e6886d8b707.png)
![[Diagram]](../../diagrams/0/e872adc7db8c7561cc7a8e6c79417f34.png)
![[Diagram]](../../diagrams/18/8c1ed93ea6421375eb09eb36494c48ae.png)
![[Diagram]](../../diagrams/16/5a4d75619d99680de7f4db64c10261aa.png)
![[Diagram]](../../diagrams/5/a3f696122a61ab29ee39cf98717684ed.png)
![[Diagram]](../../diagrams/32/55bbbfa9733f09d799370164dfcbf656.png)
![[Diagram]](../../diagrams/31/7cd12fb1c05266c27b870666f6f67f88.png)
![[Diagram]](../../diagrams/5/89b16d1c81716e66d63db4ab64149583.png)
![[Diagram]](../../diagrams/6/90f554c73695eb867de56792c0f643ca.png)
![[Diagram]](../../diagrams/19/91e456c19eb3bf1ec919823eeda9ee12.png)
![[Diagram]](../../diagrams/22/b19026970975daadeb333596ba237283.png)
![[Diagram]](../../diagrams/7/01d7a02e5174dbc6ec95f2e53e31f4bd.png)
![[Diagram]](../../diagrams/46/4261948ed7050982acbfea5531d97281.png)
![[Diagram]](../../diagrams/3/4f64a78b9114ce7488d7838fae0e5189.png)
![[Diagram]](../../diagrams/2/8b3656f57aa5b75a9188355f389a8966.png)
![[Diagram]](../../diagrams/15/def4bb02307d53f08c0f3c92b4d8bdb2.png)
![[Diagram]](../../diagrams/42/e664938e038d475e741e5730a6a9660d.png)
![[Diagram]](../../diagrams/37/55b214fbed65758a767268c2789245f8.png)
![[Diagram]](../../diagrams/11/5a2e0eeb57b4a400e0401ae10488d0f0.png)
![[Diagram]](../../diagrams/8/87526ea354c9ddd961ab4e264e68cc07.png)
![[Diagram]](../../diagrams/41/152a319c391e7dd4ce2f9c12ae86c70b.png)
![[Diagram]](../../diagrams/2/17ab9db048e48e39981ecdcc6b4da9e2.png)
![[Diagram]](../../diagrams/24/49c8c73dd89846c91215aaed179f9e76.png)
![[Diagram]](../../diagrams/25/1adeb04e08875a3e4f403ff14278f0dd.png)
![[Diagram]](../../diagrams/41/cd57c7824a0738151ab53f9e99e86c38.png)

 = Bashan [13k]
![[Diagram]](../../diagrams/30/633d26dc83de517e63b227b259f5fad5.png)
![[Diagram]](../../diagrams/28/d34b587ba776d45ce97ed2f74b38b640.png)
![[Diagram]](../../diagrams/6/851ef658a27bea61479f05cfe648b4ac.png)
![[Diagram]](../../diagrams/30/196cfa3ec5b7b22f97d2c57be1a9d9ca.png)
![[Diagram]](../../diagrams/36/d37d2c5444f26f2784ad4fda5a900480.png)
![[Diagram]](../../diagrams/50/6c166b6f50d60cc62dee1a74d96dfeeb.png)
![[Diagram]](../../diagrams/12/68d363962023ad81ecbd03fb498fa0ee.png)
![[Diagram]](../../diagrams/33/205ef8114084d5f101447c1470d8b704.png)
![[Diagram]](../../diagrams/10/29946074f6e45655c70d9a013802b62c.png)
![[Diagram]](../../diagrams/42/7f9530b53e720f9101b1faf9830cf7c2.png)
![[Diagram]](../../diagrams/30/9b1dcbcb05f4d99a49bca27afefdd545.png)
![[Diagram]](../../diagrams/2/baf9b9cac28d6de076fff1568dd44fce.png)
![[Diagram]](../../diagrams/15/688bd35352f085206b3552526087e367.png)
![[Diagram]](../../diagrams/15/1d7405d3958b5c6fbda668cca73c32ee.png)
![[Diagram]](../../diagrams/18/3a752212513992a85861d1c02e110852.png)
![[Diagram]](../../diagrams/1/7904a303551400fbcb08a96af62c98c2.png)
![[Diagram]](../../diagrams/16/4d1f792735dab94dd4cc17a69b0472ea.png)
![[Diagram]](../../diagrams/5/f65a37a1eb221444a5dc2eaba9333689.png)
![[Diagram]](../../diagrams/32/c668c9593c1499b041647e7cb2473d25.png)
![[Diagram]](../../diagrams/29/b4336debb2645dd0d6802d0c9e2136af.png)
![[Diagram]](../../diagrams/26/0fed2a4c31cdaeadecabe6dc690efb80.png)
![[Diagram]](../../diagrams/41/2253956f364a89f311912107bdff6f8d.png)
![[Diagram]](../../diagrams/51/3df5b0e2d75db2482dd9467e18dfeb2b.png)
![[Diagram]](../../diagrams/29/9457cae4206d53db5b752b9b195fc53f.png)
![[Diagram]](../../diagrams/34/94f14d23a7d9b6919bca506037a1a8fd.png)
![[Diagram]](../../diagrams/26/8dded05f61c9cfb0591b9aec3d6f8a7a.png)
![[Diagram]](../../diagrams/2/3768241c54a0c4109aa899e39278f44a.png)
![[Diagram]](../../diagrams/9/19ac6651dc2633acf8f99e1039a818ac.png)
![[Diagram]](../../diagrams/17/30323121e2d86532d36f49353913263b.png)
![[Diagram]](../../diagrams/17/6aafefc28e25d31c0619186a16487eb2.png)
![[Diagram]](../../diagrams/1/22e714573b53938761fff1616c31acca.png)
![[Diagram]](../../diagrams/43/eeb0579391311462ba21423429fe4107.png)
![[Diagram]](../../diagrams/21/536efb2dbb4cb576a154cd99c5ca1618.png)
![[Diagram]](../../diagrams/18/06771c4d409ce189cd6a49c1d1438334.png)
![[Diagram]](../../diagrams/25/e76cedbb2d5f3621841bd82889db72b8.png)
![[Diagram]](../../diagrams/28/49e407cbb85deb309f8e6a4092beb486.png)
![[Diagram]](../../diagrams/29/069304fddfe9ee2e93fe25335aba186d.png)
![[Diagram]](../../diagrams/17/64277c4422c524a4e5f334cf4358b295.png)
![[Diagram]](../../diagrams/48/8647390d10e4b8fe308a65d21f5a32a9.png)
![[Diagram]](../../diagrams/25/a309e4a5b8e9426a8cfd34bbca9b77f8.png)
![[Diagram]](../../diagrams/20/ebadea131cdd4f6383cfe7c007b4c788.png)
![[Diagram]](../../diagrams/40/160276ecd04d9f6790352d473c78ae5d.png)
![[Diagram]](../../diagrams/21/0d0fd54c12fa88a48a6b547a3e3e40c3.png)
![[Diagram]](../../diagrams/14/f94671c598e9fbe7f37e9f7a6f9e737a.png)
![[Diagram]](../../diagrams/2/508fd1ebf426a0e76c8f7d59b4111833.png)
![[Diagram]](../../diagrams/1/503be288d3cb97244b0983dc8b2ecbc8.png)
![[Diagram]](../../diagrams/38/6d7faa0b71c16b16e4d6ae34f856d07f.png)
![[Diagram]](../../diagrams/36/65065ea343c371c32dd8fe6d84e997eb.png)
![[Diagram]](../../diagrams/32/8ec38a04797ec72f7f4f5dd0ea210dc1.png)
![[Diagram]](../../diagrams/2/ca015b4e52b8935b5a9d75c12c668028.png)
![[Diagram]](../../diagrams/38/3ac77760879ea795e284630b6ea0d861.png)
![[Diagram]](../../diagrams/19/b18f45a584ed474d02533b3642d4f3cb.png)
![[Diagram]](../../diagrams/39/de762d747101935cd72ac8e5f06b1c47.png)
![[Diagram]](../../diagrams/9/58d09d2432d30ba663a42f58d9c8cfa7.png)
![[Diagram]](../../diagrams/41/4eed2d4bf0a741a24d42610a87af3050.png)
![[Diagram]](../../diagrams/33/13a897ebfee93832ab213dd4501d1038.png)
![[Diagram]](../../diagrams/9/b593a885356ae29cb816dd005459b3c0.png)
![[Diagram]](../../diagrams/10/fbd9999b88dd06f31ec94f89cb13af70.png)
![[Diagram]](../../diagrams/32/7491ef0b8a42fe44b3debd2616841f34.png)
![[Diagram]](../../diagrams/9/6d62dd11657a2a201d9a6a8727a70ff1.png)
![[Diagram]](../../diagrams/28/361c7532ae5080c07ba737d92fed03df.png)
![[Diagram]](../../diagrams/47/37ac608ca5856612758be6fa85ec7fab.png)
![[ext]](http://www.students.tut.fi/~ttgok/kuvat/pelaajat/TuomoSalo.jpg) http://www.students.tut.fi/~ttgok/kuvat/pelaajat/TuomoSalo.jpg
http://www.students.tut.fi/~ttgok/kuvat/pelaajat/TuomoSalo.jpg![[Diagram]](../../diagrams/19/68e978fd3b17fc139c1ff4ebb5527211.png)
![[Diagram]](../../diagrams/27/ee20e15aaa5314a4b12295654f6521d6.png)
![[Diagram]](../../diagrams/30/08a0e18e1976c2792f70f41a99e4f269.png)
![[Diagram]](../../diagrams/52/2f1dfc7969877a4971204aac61ac684e.png)
![[Diagram]](../../diagrams/31/6f0d1ac40d0af551c6b33e0cd0af1db8.png)
![[Diagram]](../../diagrams/30/ab6ee90e0c8e0014592848e9938b5be7.png)
![[Diagram]](../../diagrams/40/d864b33a0146771900400fbc4569be6f.png)
![[Diagram]](../../diagrams/41/6a121c1ab5737016f467f7f62a743393.png)
![[Diagram]](../../diagrams/27/747fc6cf4554f098e2dc94a3e6f9cb8f.png)
![[Diagram]](../../diagrams/39/4de8b9d1f8b84c9748e6c80b4bd8553b.png)
![[Diagram]](../../diagrams/46/5602c55d7c3d25894b1209d01373865e.png)
![[Diagram]](../../diagrams/7/26576439c05264f50b75fe892db8fe2f.png)
![[Diagram]](../../diagrams/25/e38aa5c24f82a3cecddc1bfbd32376e0.png)
![[Diagram]](../../diagrams/12/b77e6ef855a1219ad4548c6c4bbd111b.png)
![[Diagram]](../../diagrams/21/534d489b04b74bb1f2eddfa7d8cd2636.png)
![[Diagram]](../../diagrams/2/0e3fd218e34f8e503b64145be0a05353.png)
![[Diagram]](../../diagrams/16/5509c8476f25cb31dbc83e851aad2533.png)
![[Diagram]](../../diagrams/34/e26eb7b344397d26e6cc1f436d80ddf0.png)
![[Diagram]](../../diagrams/9/8f5d49005f22b650b65d2b41ae5db48a.png)
![[Diagram]](../../diagrams/52/50f7c47eb93ed9322bb46e2169c8f4c7.png)
![[Diagram]](../../diagrams/33/4167abfd17cc5a057e4a472b49e421c2.png)
![[Diagram]](../../diagrams/20/85f4585f867763b3cc248065c7716f86.png)
![[Diagram]](../../diagrams/2/68f8a905604479b453a478d7f42daae4.png)
![[Diagram]](../../diagrams/33/4b02428fedcdba7994edebcd4b921bc0.png)
![[Diagram]](../../diagrams/29/70b4fc103c7e809b8ce03c23125d474d.png)
![[Diagram]](../../diagrams/15/38dec668cb006d16b32a8322ce39fc31.png)
![[Diagram]](../../diagrams/49/3f2cdd9f05d3f9eae23a271796ad4d30.png)
![[Diagram]](../../diagrams/16/b82fc81251d398e9e6b364f5569c4b19.png)
![[Diagram]](../../diagrams/49/7a0ac4911980754b82458ca197465030.png)
![[Diagram]](../../diagrams/22/3ae13713b5176fe47c123af0e9ca9e2a.png)
![[Diagram]](../../diagrams/52/5d53453b44df500cff6f9561221534ff.png)
![[Diagram]](../../diagrams/42/477740b78b7663e20393b983009a2131.png)
![[Diagram]](../../diagrams/44/beaff00fbaaea8e7f7bc968bce9fdb34.png)
![[Diagram]](../../diagrams/20/3b65231937af28bacbdddde4cac89af8.png)
![[Diagram]](../../diagrams/38/1fafe320299adbd91c00fac0989997ad.png)
![[Diagram]](../../diagrams/6/65612d636a64a9b0d450f7b3fd4c4c39.png)
![[Diagram]](../../diagrams/48/22e22d70c83f26fac370e7cc08ce90f8.png)
![[Diagram]](../../diagrams/28/c0e02e37c89adb9d147e5d265100dafc.png)
![[Diagram]](../../diagrams/3/c2e0de92c4e048aa981eeaf2d1e2f1cd.png)
![[Diagram]](../../diagrams/3/60cd38c1ba609392057e19f55cb53bb5.png)
![[Diagram]](../../diagrams/49/2191c25cb00a5efbd10470f15b3b5711.png)
![[Diagram]](../../diagrams/22/588a2eed2b86db7f3c75d5fe8c135ba4.png)
![[Diagram]](../../diagrams/10/d25c620f41d0eb3086dcc7fc5dab943c.png)
![[Diagram]](../../diagrams/40/e807db01329d5bbeb5652fb30bf733c7.png)
![[Diagram]](../../diagrams/12/989bb40421f073538d6f12d7ecdfb43d.png)
![[Diagram]](../../diagrams/4/b85f38f227593d24fc7f747a458bac74.png)
![[Diagram]](../../diagrams/45/32abe68813026490fad8fbefa5e01f0c.png)
![[Diagram]](../../diagrams/37/13d7d13be49975624e5b292a4c465c02.png)
![[Diagram]](../../diagrams/31/0956819d0f8a89ebbd49af2f8d8dde7d.png)
![[Diagram]](../../diagrams/3/aa892152812ba39089665dd1035044fe.png)
![[Diagram]](../../diagrams/13/588bb4817b170517bbd48b69bfd5c0f3.png)
![[Diagram]](../../diagrams/4/dcaf3972d7e6bb1f8f6cf435f816d8cd.png)
![[Diagram]](../../diagrams/37/85f20ced1c7680295be674372092e6c2.png)
![[Diagram]](../../diagrams/9/25fef4e40a0ba715a92de2342b16c457.png)
![[Diagram]](../../diagrams/25/e95fac3715c032d7ebaef039dd9d77eb.png)
![[Diagram]](../../diagrams/5/b3dc1b9d63e1a1f8452d3ead8edfe0d9.png)
![[Diagram]](../../diagrams/23/10c76d6cc8ad0c887f4c60f36ef145d8.png)
![[Diagram]](../../diagrams/38/5e07f8476e9657fa7f71cd1c675e5b9c.png)
![[Diagram]](../../diagrams/34/10e9964239132ddeb1fbb8c3cf21b3cc.png)
![[Diagram]](../../diagrams/48/40ae8928aa21f3aa3aedc03584b91e52.png)
![[Diagram]](../../diagrams/18/cc05879384c305d96b67c953f49ebb46.png)
![[Diagram]](../../diagrams/24/21649c021206d8efa7aa1f4043daec02.png)
![[Diagram]](../../diagrams/43/7cd30ce50e8c3f9be75b6a0a81949328.png)
![[Diagram]](../../diagrams/11/506e25cb092972810e3db4c6fbeaf11d.png)
![[Diagram]](../../diagrams/10/66bd44567523ffb249fb811c1dbd4637.png)
![[Diagram]](../../diagrams/0/4e52e494d670813144483713c947f634.png)
![[Diagram]](../../diagrams/38/17e57b77cedaced11154e33c6bb6e62a.png)
![[Diagram]](../../diagrams/45/c2178314a2e44785186df929fa95be28.png)
![[Diagram]](../../diagrams/13/a88592d8b658757b403c1b829d4f12e4.png)
![[Diagram]](../../diagrams/19/be1648cd6abbc848c4ac7d4f296337a4.png)
![[Diagram]](../../diagrams/47/cb9826108927ec7b545c706a4ec7e6cb.png)
![[Diagram]](../../diagrams/40/8700308f9537e7a56d4c5062ef995040.png)
![[Diagram]](../../diagrams/22/d8fbb13f769b176e9a4d8203c3c3f8cd.png)
![[Diagram]](../../diagrams/37/5c26345ef09781e4f7f1ae776d2640ea.png)
![[Diagram]](../../diagrams/2/2cce82322fec54937ec4ffeeb39e5c31.png)
![[Diagram]](../../diagrams/5/bf050017065664dc21edeaa0e4110a38.png)
![[Diagram]](../../diagrams/13/533caf2ce4d4375485e735dcfafad872.png)
![[Diagram]](../../diagrams/8/99ab51ee967e670273b1840f02cb7ee2.png)
![[Diagram]](../../diagrams/19/59ba89f76706349c04ad872cbaddc1de.png)
![[Diagram]](../../diagrams/40/d1c9dd0d10f3ede71fdc8ff79e8623b7.png)
![[Diagram]](../../diagrams/22/e6d71f2be60450a8d820624e58ba4849.png)
![[Diagram]](../../diagrams/36/2d7ee0e930e0c30edbd5428ad69400eb.png)
![[Diagram]](../../diagrams/41/66935927cb9cf9288ea3b46b5a0980c2.png)
![[Diagram]](../../diagrams/20/8bf567b9f5c49fd334e376908ac419b9.png)
![[Diagram]](../../diagrams/27/4666a55d7fea6e3a1137cc0294439b92.png)
![[Diagram]](../../diagrams/49/ba7d07adce4490f1bd3fdf5e85d7c598.png)
![[Diagram]](../../diagrams/39/c7d3324f61d0ea76144d90e345e5e178.png)
![[Diagram]](../../diagrams/42/83b752a42461c6be38c3b95093d2e16d.png)
![[Diagram]](../../diagrams/7/a75c8ea3c42d5d5738c0e66bdb660223.png)
![[Diagram]](../../diagrams/23/34b789d243b57e9c8af2fb4d71966285.png)
![[Diagram]](../../diagrams/18/3d1fb3ca0cfe8cdd18f72dd9aad56e2e.png)
![[Diagram]](../../diagrams/2/105938283dc5ac87e64a9ce1f323fe9e.png)
![[Diagram]](../../diagrams/32/7696432a9a8ef387379fc85100845bdc.png)
![[Diagram]](../../diagrams/48/8bc105bc1e242c3cfffec52184889bcc.png)
![[Diagram]](../../diagrams/32/283aaf8b3adda9bd7485419f40d2b4b0.png)
![[Diagram]](../../diagrams/45/09efb18596067f339322d009270a58cf.png)
![[Diagram]](../../diagrams/23/bb16175bde23c8fa27242e0ee925ca1e.png)
![[Diagram]](../../diagrams/48/aa428a7095e473a6d74a195c22c3f5b2.png)
![[Diagram]](../../diagrams/25/8f4bb877ec1bff9baaa55210a98b87b2.png)
![[Diagram]](../../diagrams/15/f35c0362c82599426cc09c2b55d23ff7.png)
![[Diagram]](../../diagrams/40/f3a03d7700a1062c7ef40b5871a5ef07.png)
![[Diagram]](../../diagrams/45/fd766759aed66c6827091b19d42ad69e.png)
![[Diagram]](../../diagrams/29/8be244d867ff11a8042f7f1aa31cf72d.png)
![[Diagram]](../../diagrams/14/3ac6b41925ebb8ee2ebe05112bb4c8ad.png)
![[Diagram]](../../diagrams/50/77ddbc53d0c78ff43d1773a1058fe336.png)
![[Diagram]](../../diagrams/11/1db7043ac59b700f5a4cdfcb1e3dd53a.png)
![[Diagram]](../../diagrams/35/ff94cf3162e611d456fd853c573870e7.png)
![[Diagram]](../../diagrams/35/806da1a8818ab96b6466449031d27283.png)
![[Diagram]](../../diagrams/51/4588a6d3791f6b64fa52ab35029daeea.png)
![[Diagram]](../../diagrams/25/88dbd4ae6092f39b0dca0ff0159a9f69.png)
![[Diagram]](../../diagrams/0/a33eedb55d82f4b1e1658bd652395f8c.png)
![[Diagram]](../../diagrams/5/ffa245f33cfe09ec3dfba53e3b11c388.png)
![[Diagram]](../../diagrams/43/4c0e0795c95ff1a025beaa7869ec7480.png)
![[Diagram]](../../diagrams/11/481e15999d25a38c10981889e38bea1f.png)
![[Diagram]](../../diagrams/23/5483470647c6aed17fe49af7d668a79d.png)
![[Diagram]](../../diagrams/21/c88758aaa5cc2e465fb7cbb138876594.png)
![[Diagram]](../../diagrams/9/ebdac30aa41f5a5da9f7f43e690c3466.png)
![[Diagram]](../../diagrams/38/fc245e5d0d26aec84b277b1186d3bf40.png)
![[Diagram]](../../diagrams/28/7b02caae9aa25713d5476cb4cda5eae1.png)
![[Diagram]](../../diagrams/7/075a351016963eefc46f22201b85d220.png)
![[Diagram]](../../diagrams/44/6bec6e03d42f17a2e12d260f196c72c9.png)
![[Diagram]](../../diagrams/48/7a68cc58c757de6f720dba2d62c8021d.png)
![[Diagram]](../../diagrams/44/44636f52538082dae2e6d3bb3d47bb46.png)
![[Diagram]](../../diagrams/5/adbe8e9a0f12c505758aa83719078cec.png)
![[Diagram]](../../diagrams/35/4225d5253460f874997bde18431e2d70.png)
![[Diagram]](../../diagrams/47/9f20d9dc8213808708ba19ec99577738.png)
![[Diagram]](../../diagrams/23/f6e907a9915fa51d998938fe2a2e019f.png)
![[Diagram]](../../diagrams/35/a0c17d2ead36c0df22e75368d7de56c3.png)
![[Diagram]](../../diagrams/30/c6880b559f782c7a4211b6660ce09142.png)
![[Diagram]](../../diagrams/5/d55f2575e2263db3422d1b2ffa6e1c6b.png)
![[Diagram]](../../diagrams/6/d64528f2128ff12440772c34442e3c54.png)
![[Diagram]](../../diagrams/18/2482d1dcd19bb3a65cc73a5fa7236052.png)
![[Diagram]](../../diagrams/3/27aed65115342fb9f1e873b8298ea62e.png)
![[Diagram]](../../diagrams/21/7357a36a60ceee42d6b200343205eae3.png)
![[Diagram]](../../diagrams/13/bc5bbef8b281c4d901b2a57ca19d3280.png)
![[Diagram]](../../diagrams/50/30b116ad7127a06a739a6d24ea61b7bc.png)
![[Diagram]](../../diagrams/49/3c4b3695868fecd650a4b8148b5803ff.png)
![[Diagram]](../../diagrams/36/0ddf87fd2c3fe927b6b41c89a80783d9.png)
![[Diagram]](../../diagrams/25/e2c5aa8a6fa9796468cdf203f74984dd.png)
![[Diagram]](../../diagrams/28/46408af1b23e9500894aee19436bab33.png)
![[Diagram]](../../diagrams/2/cc5420b80c49dd8038f9569851743757.png)
![[Diagram]](../../diagrams/2/f6dafd46f7ebf280c95cb43fd6d3ea1d.png)
![[Diagram]](../../diagrams/11/a0e0abd8a69f7563ad994e67b822e80c.png)
![[Diagram]](../../diagrams/44/1ffc04bced03ddc75d71b6fe43bf4932.png)
![[Diagram]](../../diagrams/10/d1c55922538e00576c7df1a9fa4bf892.png)
![[Diagram]](../../diagrams/31/ec408549397962744e56446b6f152286.png)
![[Diagram]](../../diagrams/52/39c4f74975060b537d6709cb9a658556.png)
![[Diagram]](../../diagrams/21/bc364d380739983bc960f5eb00405ca2.png)
![[Diagram]](../../diagrams/29/0dffd2ff3ef34fb6f89fd502299acaac.png)
![[Diagram]](../../diagrams/2/78b882a187e8fc75e8774d3367770953.png)
![[Diagram]](../../diagrams/34/a4bf9b432ef176817547b6f8e2c7510d.png)
![[Diagram]](../../diagrams/40/27f9e6944bc10281951998ea98148b40.png)
![[Diagram]](../../diagrams/42/13ae4c2a58ef4645f95d3e048f571edc.png)
![[Diagram]](../../diagrams/40/44cbebec8d26b0a357eb0ca62b762ec2.png)
![[Diagram]](../../diagrams/9/7db03bb6d838f71e241a116cd331ced1.png)
![[Diagram]](../../diagrams/49/a8af5b96ee8b4ef41ef3eeece2702995.png)
![[Diagram]](../../diagrams/2/82d3ba4a81984e54825949fb601b90b2.png)
![[Diagram]](../../diagrams/38/8aff8a07d3b7049e6ac73296c1015b91.png)
![[Diagram]](../../diagrams/9/7c18c000b04cb4075aedc1a005c393d0.png)
![[Diagram]](../../diagrams/0/ef68711c3694591a3e3a2d86dab75661.png)
![[Diagram]](../../diagrams/35/ddf5a3985607ab58b66512f44bf98184.png)
![[Diagram]](../../diagrams/46/54647fc3b326afd280a1650f28d78955.png)
![[Diagram]](../../diagrams/28/4c9cf076eb440e964a8c7bb33db22a24.png)
![[Diagram]](../../diagrams/17/2337d0e9b0dd623dfb64b6a411becd97.png)
![[Diagram]](../../diagrams/5/4fa2174d48daa797cfa45660d35ba066.png)
![[Diagram]](../../diagrams/29/6fb17adf62470eb0aaf045ef1a537cca.png)
![[Diagram]](../../diagrams/0/ff31011b5f8a4b4b809f0e84931b55db.png)
![[Diagram]](../../diagrams/18/44f953786d61a20ab5af0e3befa0f2c9.png)
![[Diagram]](../../diagrams/27/52c1c27e0783aea52c9976023d463dd6.png)
![[Diagram]](../../diagrams/1/99492af7ce45dc896553dd21a625a3fb.png)
![[Diagram]](../../diagrams/14/e26536d18939e84f3578a6b240748a2b.png)
![[Diagram]](../../diagrams/17/293573cbc3f62102de90ce81336d1cde.png)
![[Diagram]](../../diagrams/5/a1e01040a963f7a2af39f26a0c4533db.png)
![[Diagram]](../../diagrams/37/b26a581ea92529a2e623d60146752c53.png)
![[Diagram]](../../diagrams/10/6ee6523416c30167b5af0dcd23704a01.png)
![[Diagram]](../../diagrams/17/e385ca324281642eff67f9bb0aecb2a0.png)
![[Diagram]](../../diagrams/2/55c15ef128c6d0f3c49216f5ff5b824c.png)
![[Diagram]](../../diagrams/34/57b84083351e51c1856b18bf996884f0.png)
![[Diagram]](../../diagrams/34/0c29fff7870452802edd7c6da43ee021.png)
![[Diagram]](../../diagrams/17/60516ce2a94dfdea9f86e8396dee9cf4.png)
![[Diagram]](../../diagrams/0/c35c42e8860f535720a76f5639741794.png)
![[Diagram]](../../diagrams/52/509aeb35d70a90bc876d556130046386.png)
![[Diagram]](../../diagrams/10/4900d75eca527aaadcf6abdeb59d519e.png)
![[Diagram]](../../diagrams/25/57085658146588f8ab889008ff41b363.png)
![[Diagram]](../../diagrams/27/418756aaf0d169615d55bfabae733e20.png)
![[Diagram]](../../diagrams/36/f214774033aa0cfe107277368781338f.png)
![[Diagram]](../../diagrams/5/26acefa4175d42257560e850a34681ec.png)
![[Diagram]](../../diagrams/37/959f89fef867f63d349199eef81b11cd.png)
![[Diagram]](../../diagrams/20/6603b02e9e488ba98dc55843850f676f.png)
![[Diagram]](../../diagrams/36/a68df530f6234fe4f280ed0f60bc461b.png)
![[Diagram]](../../diagrams/38/ebc179efc04e5a618a5a9ce304345e74.png)
![[Diagram]](../../diagrams/9/c48369fc0be873214043fe218d78cb8c.png)
![[Diagram]](../../diagrams/20/a47fe23b04eb438a0e06f31d65030189.png)
![[Diagram]](../../diagrams/38/6b6eae562fe822bfd357b3480c0a81b7.png)
![[Diagram]](../../diagrams/25/f20ba51ac0b605ea5cbf6a9694bbfb0a.png)
![[Diagram]](../../diagrams/48/6690978904956f5f17166da497be4a54.png)
![[Diagram]](../../diagrams/13/05aaaaa1beb663c889546d3b2ad62a30.png)
![[Diagram]](../../diagrams/32/09065fccb7ed6a9a5d0e7ccfab8eb6f3.png)
![[Diagram]](../../diagrams/38/e224c77903962a4a336cad835767e278.png)
![[Diagram]](../../diagrams/25/42766d10bb990bf24230e1fe8ff331f5.png)
![[Diagram]](../../diagrams/50/199d0bf46a07238f0b915636aa1cef64.png)
![[Diagram]](../../diagrams/13/47176723702dacf0a3e944a8995a6f3d.png)
![[Diagram]](../../diagrams/39/f132580dfbcc1d7f5dcdb002fd98d086.png)
![[Diagram]](../../diagrams/44/1d4dc9144d97231aeec77d297d0674f3.png)
![[Diagram]](../../diagrams/50/d3888db3f9483c3c18598ea65812d095.png)
![[Diagram]](../../diagrams/46/4538ac92d94782f00ba2ab4e2daa84fd.png)
![[Diagram]](../../diagrams/49/c1395804d97564fe57dab417e082fda9.png)
![[Diagram]](../../diagrams/38/493d1f071f78a3e081e23215a460ff81.png)
![[Diagram]](../../diagrams/15/a957830136c82d3ea0b3a92d58dbb0f2.png)
![[Diagram]](../../diagrams/14/4833f6599bcaf417eb7081327172aacb.png)
![[Diagram]](../../diagrams/16/b0168a55b894ed238ed8d2a77987863f.png)
![[Diagram]](../../diagrams/19/7f8c49fbebfc2a366c61bcca2533629d.png)
![[Diagram]](../../diagrams/34/2e8fa27d0491297c8f438496f2e05c9d.png)
![[Diagram]](../../diagrams/35/6ea427568bd71be5b50b3fb677aed6a3.png)
![[Diagram]](../../diagrams/21/df0495b0f9b3c73f02b78b86c4055b99.png)
![[Diagram]](../../diagrams/26/b23d033f070ea101483ad6b859088361.png)
![[Diagram]](../../diagrams/26/3b5d69572ec82b84172ceafd6331552a.png)
![[Diagram]](../../diagrams/12/f9fd346104c7818dc8db173f983ad613.png)
![[Diagram]](../../diagrams/2/0513dd14c1b1a07f90a16838c1f8d2a2.png)
![[Diagram]](../../diagrams/12/33a44cc0f7b5a444b123914d6e787f95.png)
![[Diagram]](../../diagrams/19/33d91114be33eab3dffe67466b58bedc.png)
![[Diagram]](../../diagrams/41/7d6aac68875940567685f07f9863b164.png)
![[Diagram]](../../diagrams/4/6146b8e98380321b0722dab05190ee64.png)
![[Diagram]](../../diagrams/29/95669bcf4de1835a83ae66ea474bba12.png)
![[Diagram]](../../diagrams/34/6911d051399371c0d03427e298c976a4.png)
![[Diagram]](../../diagrams/48/f828ae00716f4d499195cb791cddeffa.png)
![[Diagram]](../../diagrams/40/018c876698f5d18a4bebfa9fb6c3172e.png)
![[Diagram]](../../diagrams/39/4e65a937782220af97bf974d1a7cc817.png)
![[Diagram]](../../diagrams/52/c64aa2bf242456c906ac4a4baa282ef9.png)
![[Diagram]](../../diagrams/47/42ef40d4c208205ca658e455fb4bd81c.png)
![[Diagram]](../../diagrams/43/4a2b90f544910e90518ce986885347ad.png)
![[Diagram]](../../diagrams/9/3a831fe6c53646534d8dac450415cc6d.png)
![[Diagram]](../../diagrams/2/b659ae04ba37a6bc717b9b2a48bbf431.png)
![[Diagram]](../../diagrams/44/c07c608f61bc682ba694b42820bc4ed3.png)
![[Diagram]](../../diagrams/45/62a8820040689c7996a5ab1aceb7b5e1.png)
![[Diagram]](../../diagrams/1/e17df3184161d8696b1e9d4c55db6633.png)
![[Diagram]](../../diagrams/30/124ce06d8fb87394d7bc16e2219df949.png)
![[Diagram]](../../diagrams/17/4542c434b1ed292ff969a0585e4ac19b.png)
![[Diagram]](../../diagrams/52/2ea1e37eb1b8913aa881c6e2f650e4b8.png)
![[Diagram]](../../diagrams/30/ba12558f821343d79d845ee64f7b5e25.png)
![[Diagram]](../../diagrams/7/6cbbc7ff14e1ff6d8520d6a5a5076e7d.png)
![[Diagram]](../../diagrams/33/64d367a42cea71ab12e38e29ddb1ca11.png)
![[Diagram]](../../diagrams/51/8961c3a5074db456a21047108cd8b493.png)
![[Diagram]](../../diagrams/30/2d62daea51a4a29fbe524e7505cf03c4.png)
![[Diagram]](../../diagrams/48/974e557d953305b515d7a9706fdf886f.png)
![[Diagram]](../../diagrams/30/44fd2327496a80ac832d319e3bc4078c.png)
![[Diagram]](../../diagrams/29/dc96f4263eead10a172c25152cd34500.png)
![[Diagram]](../../diagrams/7/7d19cb7c1081a3234abe0a730eab1089.png)
![[Diagram]](../../diagrams/36/ecc293913ce515c0b582e0522e82e2ab.png)
![[Diagram]](../../diagrams/43/61d2535aeb8b7a6db4a1bf3bd1cc614a.png)
![[Diagram]](../../diagrams/11/8cbb16b18f48395dc06b3f2bafeaf3b9.png)
![[Diagram]](../../diagrams/37/b859cbdb49672cc93d276b0fffbe7567.png)
![[Diagram]](../../diagrams/41/b880596dfbfdbe550073c565bf56a8e6.png)
![[Diagram]](../../diagrams/6/8a52b474b2cc5fee22f781282bef576b.png)
![[Diagram]](../../diagrams/48/b5ddd53a10b7daf95be2a4aef2147e27.png)
![[Diagram]](../../diagrams/39/3b8dd0f3e375b9c9395edc930413cb5a.png)
![[Diagram]](../../diagrams/3/0edd29197632f984765c3186f76ec3dd.png)
![[Diagram]](../../diagrams/18/4f82f8262274af5e345fe7fee828f232.png)
![[Diagram]](../../diagrams/28/a8de33bdaf5a9b24decccdf516d2e0f3.png)
![[Diagram]](../../diagrams/0/835fc3cdac3fb2999b28a3e8cc90a2cc.png)
![[Diagram]](../../diagrams/21/063c2c9d78d95c257b67aeafae6a483a.png)
![[Diagram]](../../diagrams/1/f19c03f74723e24cb9bdf1e02fa902ed.png)
![[Diagram]](../../diagrams/10/395091e6a30a9b5f1f9741b2764d2136.png)
![[Diagram]](../../diagrams/16/8a420191275955947caed698b53af89e.png)
![[Diagram]](../../diagrams/16/302afd571ad0a79de6dac54698087333.png)
![[Diagram]](../../diagrams/46/16d4f0b17cd95dc84df67c6381e26484.png)
![[Diagram]](../../diagrams/26/80c68b46ca06442374c5b97fca567f3f.png)
![[Diagram]](../../diagrams/13/7429143b48740bb053dbde3e71c69e8d.png)
![[Diagram]](../../diagrams/8/9d6b332fb6b42a549e023a75b9d00ec1.png)
![[Diagram]](../../diagrams/35/64cb207253bb22c130dd04471281ccc3.png)
![[Diagram]](../../diagrams/39/e59e4a85dea39a0621d754fbdfd58e96.png)
![[Diagram]](../../diagrams/12/404994dd478a3e7c871377ab6f578470.png)
![[Diagram]](../../diagrams/37/f430f6f04c5838dee2ed277cf895ba77.png)
![[Diagram]](../../diagrams/32/e987c170ffe93c3d8f62d2c23fe17e64.png)
![[Diagram]](../../diagrams/10/21a56f1c04168ba7811d8ffdcfe1f039.png)
![[Diagram]](../../diagrams/5/ef4265e492c6723b9244056cb0324409.png)
![[Diagram]](../../diagrams/22/99bc40dbb3a874cffa463e8f7006cd1c.png)
![[Diagram]](../../diagrams/26/b7b953a484306e260fc47c36ebb5069b.png)
![[Diagram]](../../diagrams/42/bb917bc9a2dbd3ac4e3c400e7243fe0e.png)
![[Diagram]](../../diagrams/43/8241ef0ec5a90577b2be2c2a4f6e177f.png)
![[Diagram]](../../diagrams/5/fd072a5f7c0c6d80ce4969bee5149210.png)
![[Diagram]](../../diagrams/3/0d1c2d4a6e84dad32d559faa7235dd2c.png)
![[Diagram]](../../diagrams/21/783be533956884350c7142976f8c4c7c.png)
![[Diagram]](../../diagrams/25/ee2a24d38c3c48265c0da1188297368f.png)
![[Diagram]](../../diagrams/41/7ac814a708f6a7c7d7ccae0dc2c182ba.png)
![[Diagram]](../../diagrams/18/aa09402353c14b50d1fa14ea8cec5184.png)
![[Diagram]](../../diagrams/50/c9448be2af4347125f0ec374f2be9b57.png)
![[Diagram]](../../diagrams/30/9ce66f8366a7f654e9ca17a04af51096.png)
![[Diagram]](../../diagrams/0/6ff1eea8a93c1fedc579fbfd9af916eb.png)
![[Diagram]](../../diagrams/52/caf66121815d0dca29835c4f3a088a4f.png)
![[Diagram]](../../diagrams/2/8ba6a9671cf59e26a6a368e86b028965.png)
![[Diagram]](../../diagrams/34/e3247b9922c6bda0130530d0e38b2e07.png)
![[Diagram]](../../diagrams/19/6dbee85c2d0969f1067d35d3016b1762.png)
![[Diagram]](../../diagrams/36/041ff0457a2285b2629621b9f3f5c286.png)
![[Diagram]](../../diagrams/51/c93e0ae32f35be4f99b3e639f0902c59.png)
![[Diagram]](../../diagrams/10/f2639fd0576c7fc3f9a30c29ff4d1196.png)
![[Diagram]](../../diagrams/12/6bf6c30a9041553bdb57abe1183c583f.png)
![[Diagram]](../../diagrams/2/5dd8a3eb374550021b48d1a4096bb4b5.png)
![[Diagram]](../../diagrams/51/98d36d06f63c266f9d16db2e585853b6.png)
![[Diagram]](../../diagrams/43/b1c700b5470b17a1c24fa6c9ee858501.png)
![[Diagram]](../../diagrams/38/3ba9a62dd57ade360f6c50a0bce4f60b.png)
![[Diagram]](../../diagrams/49/0d15d91596650bb958db7c88acc5536a.png)
![[Diagram]](../../diagrams/46/d57a874e1d4d799ad658a68f1f5ba8bd.png)
![[Diagram]](../../diagrams/27/a8b20bc92b02a2dae58f47c5f9ef7396.png)
![[Diagram]](../../diagrams/3/6fd22eca973c0c0b723cbff10859fd95.png)
![[Diagram]](../../diagrams/52/acce2cd4bdb1e33ec1a80da7bd677279.png)
![[Diagram]](../../diagrams/33/605f44a2072a4e197525928b6650586d.png)
![[Diagram]](../../diagrams/4/1f25cc2d08430d1d657254da67a5179d.png)
![[Diagram]](../../diagrams/8/a76fa0c65185faecd281dd952b16ade6.png)
![[Diagram]](../../diagrams/41/d12fa3b172460c36f28b4f42286d155f.png)
![[Diagram]](../../diagrams/5/226021d5a7e4de4554dcc83f2796ac1f.png)
![[Diagram]](../../diagrams/2/36144c5ee11f639bf7e15ca238e27af9.png)
![[Diagram]](../../diagrams/18/b050fd61cdd6a0fe495fdf42354271c9.png)
![[Diagram]](../../diagrams/23/a49bb576930435ea671ab47f2787b1c1.png)
![[Diagram]](../../diagrams/52/c8b1b33c356f16087d370257c4125dc5.png)
![[Diagram]](../../diagrams/31/e6c2f98c9bd95a9b9bb1fee9bf054624.png)
![[Diagram]](../../diagrams/20/7fc7a1beb59356be4ba09b6332db3830.png)
![[Diagram]](../../diagrams/48/e71ba45a26d77e06ff9a3bdd695ae192.png)
![[Diagram]](../../diagrams/49/bb31d580623e4d376ac9e0eaa8e94f4f.png)
![[Diagram]](../../diagrams/44/075509d333e70597940e84d291844812.png)
![[Diagram]](../../diagrams/49/1fcf98890d6cddb95821e357927aa075.png)
![[Diagram]](../../diagrams/38/f66ac4dd88e2aaef58f9b9b1b1bccbb1.png)
![[Diagram]](../../diagrams/30/09303cc52b81360313647aa595d3f1a5.png)
![[Diagram]](../../diagrams/44/a6524b2e1a95bcd2435fe5531a4da3e4.png)
![[Diagram]](../../diagrams/25/bcfec68443ade42ca39726cdf1465792.png)
![[Diagram]](../../diagrams/29/8429ee698f6cf93ce2628b204a9bf006.png)
![[Diagram]](../../diagrams/32/e245b2ee97da1ab615ba363dbef969dc.png)
![[Diagram]](../../diagrams/45/1e7a85b57084669a4574ce7c802f8e0c.png)
![[Diagram]](../../diagrams/34/a7e9ca91c0a2d457fe36dc58ee7f47a6.png)
![[Diagram]](../../diagrams/23/24cc21af5fd8a97fe0ac52b7278b10ab.png)
![[Diagram]](../../diagrams/19/7a7c611cd0c2cd75faf76e2560be60b1.png)
![[Diagram]](../../diagrams/12/5bb4fb59587eb6c9df58d985c8c2fd71.png)
![[Diagram]](../../diagrams/21/e16423708ec64d81e5d91faf62e8ada1.png)
![[Diagram]](../../diagrams/31/7efe2ffaa6d81bc2855ce34bfaf3fefd.png)
![[Diagram]](../../diagrams/24/3297ce5cc795fe0fc422abdede7ee447.png)
![[Diagram]](../../diagrams/29/5cbbeb9316e482a562d4327c2c05e6bb.png)
![[Diagram]](../../diagrams/8/98414e7168fcf255e7a1197aa09cb7c9.png)
![[Diagram]](../../diagrams/32/82268ddc956350305dc67b0161b2ca3b.png)
![[Diagram]](../../diagrams/39/22367f17986e880de7a13ec3889f2043.png)
![[Diagram]](../../diagrams/11/97aea209bd93a92438bf6543f495bf8b.png)
![[Diagram]](../../diagrams/0/368f83f9b23ed7a858ea31fe1d528486.png)
![[Diagram]](../../diagrams/25/0315381242f1bb9b246d0a7bb26d8e7e.png)
![[Diagram]](../../diagrams/23/73937b451a51af45b7d9ae0a53d3308c.png)
![[Diagram]](../../diagrams/11/1e86e89beabad45526e5af31f0e77aa3.png)
![[Diagram]](../../diagrams/13/cfe6446034e5074a087a300c29343b2c.png)
![[Diagram]](../../diagrams/50/1f182b78088c3b123c0efe7ba4a29601.png)
![[Diagram]](../../diagrams/52/0caa24579c6eccdd9e7d1ef427b07907.png)
![[Diagram]](../../diagrams/42/cc4e775daa86ed371129669a8a4192b9.png)
![[Diagram]](../../diagrams/15/08e87bb2cc8a2a94e68d0b8d117667e5.png)
![[Diagram]](../../diagrams/49/106f54a7aeabc317cb7c2aed39c2738c.png)
![[Diagram]](../../diagrams/5/ad9d78f7088f84c7e50b0a7458aabf8a.png)
![[Diagram]](../../diagrams/10/809fafed73871532f7b511cbec6a5cb6.png)
![[Diagram]](../../diagrams/35/f0e29dc360ebe8b6d0f71c365708e4b8.png)
![[Diagram]](../../diagrams/2/6ae059f3be6a31d074a164bbd0a29cd7.png)
![[Diagram]](../../diagrams/21/116d245c99f7055abccdcc6a5bfbc93f.png)
![[Diagram]](../../diagrams/7/4e003bd930b2c2cf4bed0a2390c8b496.png)
![[Diagram]](../../diagrams/15/1c46355c655f644bb01966f4e4879574.png)
![[Diagram]](../../diagrams/28/676666c573ba6adde96d2a5c859bf273.png)
![[Diagram]](../../diagrams/6/3b8cef945519a4fbabd161d730ac2ed5.png)
![[Diagram]](../../diagrams/6/01c41d054666cfb6458a30615f8e7488.png)
![[Diagram]](../../diagrams/38/f552dec57df03c9ac08a5878618e88a0.png)
![[Diagram]](../../diagrams/12/36c449758c447ce5f881c092363e057f.png)
![[Diagram]](../../diagrams/48/ea6b756312b704fbac0e969aee6c18a2.png)
![[Diagram]](../../diagrams/34/7d3d1ecd20d111d0a312393f6a705bc5.png)
![[Diagram]](../../diagrams/17/7e86db1508e79ed30516d273b163a916.png)
![[Diagram]](../../diagrams/35/5f342116cc5f288321886b0117afaca8.png)
![[Diagram]](../../diagrams/11/c6c4cd2a62dd85e88d753f37eae113bc.png)
![[Diagram]](../../diagrams/37/c39517210bbb98c1f4d9feff4a63aaa9.png)
![[Diagram]](../../diagrams/11/1a8fa979611fe4d66c792051f781d33a.png)
![[Diagram]](../../diagrams/2/850c5f00ca19e9b0a49016c01f6eeff0.png)
![[Diagram]](../../diagrams/31/7a761b8a287f7d4dd4b2e91deeb04e52.png)
![[Diagram]](../../diagrams/41/d870a1e25d035c289993712dde0ee1fb.png)
![[Diagram]](../../diagrams/38/6d35da015c69dd93a4c6154c48a1635c.png)
![[Diagram]](../../diagrams/17/212037739557e0860165d0fef7a7ae5a.png)
![[Diagram]](../../diagrams/49/9ccc6944654c733f94a174e7e129d8fc.png)
![[Diagram]](../../diagrams/5/c516e903b5044297cadc7f9ed5835e9f.png)
![[Diagram]](../../diagrams/5/100533b5e883f7fe39461dde86ccd917.png)
![[Diagram]](../../diagrams/21/ed3897f726cafce4fdeda4996ad6d02f.png)
![[Diagram]](../../diagrams/25/f4815b6afb4c810fc8901159fe74c89f.png)
![[Diagram]](../../diagrams/30/4a98b43de46c5fb09b5d5e97c2769f59.png)
![[Diagram]](../../diagrams/47/2c085bb7632a68eac74fc650c7c487a1.png)
![[Diagram]](../../diagrams/9/4dd2e0e857fa6baf5885dbb376f8c5ce.png)
![[Diagram]](../../diagrams/47/c2bb5475637713d939601fb887af525c.png)
![[Diagram]](../../diagrams/20/07aebb137a968a56f3a7c9197b6552fe.png)
![[Diagram]](../../diagrams/7/ad960cc6be92945a280e6594ebd571e4.png)
![[Diagram]](../../diagrams/10/cf73d74a2527de204bb0e9e7bdea95bf.png)
![[Diagram]](../../diagrams/0/87c240ab5aca492473a3665861b0c473.png)
![[Diagram]](../../diagrams/26/1381263c149d63acef6c3b01c4d8abad.png)
![[Diagram]](../../diagrams/25/9b1f7ee0f1bd8ecea2407a16bd479768.png)
![[Diagram]](../../diagrams/8/3181444c32450dc8fe8cac87a8745e55.png)
![[Diagram]](../../diagrams/52/86e76b585b5b9f437f0513b2fffc2523.png)
![[Diagram]](../../diagrams/22/a80b6c22afaf042402cd252432a1ef9f.png)
![[Diagram]](../../diagrams/46/cd5c3b2cebb082e45fb399ecb004dd6f.png)
![[Diagram]](../../diagrams/36/060e942996153364f307da65d44e32ab.png)
![[Diagram]](../../diagrams/5/f0ad276d84837816dd332a71223e18cc.png)
![[Diagram]](../../diagrams/41/0023a76fa24133bd2828c0e9415bed86.png)
![[Diagram]](../../diagrams/10/c52dac78ab561aad7a29dacd05ef76f0.png)
![[Diagram]](../../diagrams/40/190306ea9dd713e6a260f10e1e93f29e.png)
![[Diagram]](../../diagrams/46/6e586238aa0cf0588c4cc7a2ea2c91d8.png)
![[Diagram]](../../diagrams/52/8051ae6b8ea192d023c1b00045acfa29.png)
![[Diagram]](../../diagrams/2/8190f268bf27c436e2538baae1c27600.png)
![[Diagram]](../../diagrams/30/5812bcd658a0a1992c96cc6692bc93e6.png)
![[Diagram]](../../diagrams/33/c497905d1537bce2a2b32ba2697e6fb2.png)
![[Diagram]](../../diagrams/12/b6c94cb2456adddc20cfbee6e146e953.png)
![[Diagram]](../../diagrams/43/f2892915e9e95d1cbc01686e45493359.png)
![[Diagram]](../../diagrams/8/c94379ff31a9038a504e43307707667d.png)
![[Diagram]](../../diagrams/16/181aaa68c487e20d44e0bce0687f45da.png)
![[Diagram]](../../diagrams/32/332e63451b626d9bdbd819d5cbbf3ef0.png)
![[Diagram]](../../diagrams/46/0b4201ad1059d2ad8ac038c6e4751d49.png)
![[Diagram]](../../diagrams/34/4dc5020c90717d93201ab53e1313ac4a.png)
![[Diagram]](../../diagrams/32/f23bac00dfa93243abdecbf744196c30.png)
![[Diagram]](../../diagrams/0/47872f727e6df67e2a7652af19b2fa8c.png)
![[Diagram]](../../diagrams/33/7b986e8976a99de9a3c62984bf3aaea5.png)
![[Diagram]](../../diagrams/4/d4314f958b396ff4c952454889919b13.png)
![[Diagram]](../../diagrams/46/99ccc964453066baf1b20aa880244ed1.png)
![[Diagram]](../../diagrams/13/307b9a7cff258b517a07c9213e1e3d8b.png)
![[Diagram]](../../diagrams/14/d223c35f38d18b3308f9cc6960175053.png)
![[Diagram]](../../diagrams/2/f476e62a308f7055bc98077147532a1b.png)
![[Diagram]](../../diagrams/40/db206c51971cb80d2426ac4433bffa04.png)
![[Diagram]](../../diagrams/25/c4ba2148baee176e4d072da9d7137868.png)
![[Diagram]](../../diagrams/18/725809a6773434a5fdda3149323e015f.png)
![[Diagram]](../../diagrams/23/edf7e5b9ab2d336cfad14070bcbd9c9d.png)
![[Diagram]](../../diagrams/7/8f05f9dd47c6876351ab4763d44ebfb0.png)
![[Diagram]](../../diagrams/8/5fa8890570d86273a8248fa517f64171.png)
![[Diagram]](../../diagrams/16/6ddc688b33f2e3b6f061d8724386b0c7.png)
![[Diagram]](../../diagrams/28/61579d6cdea52c85235983f37be4a7c3.png)
![[Diagram]](../../diagrams/41/7ff4d832b7c8820315b01c7643d59b70.png)
![[Diagram]](../../diagrams/29/8a7c1906d11ad4370599cbee336bf330.png)
![[Diagram]](../../diagrams/42/eb6b38fbcedaf31f7213730b5141366f.png)
![[Diagram]](../../diagrams/0/500360f105b60f29b4ae77f17c0343e4.png)
![[Diagram]](../../diagrams/9/843fb5bad940435d7ce728afc45b364f.png)
![[Diagram]](../../diagrams/3/e58bdde3687b68160f3e3ec950d95862.png)
![[Diagram]](../../diagrams/38/8f63c7617a81644e93000a744c70f7d7.png)
![[Diagram]](../../diagrams/46/8fdb7975c8188c8618a8dd0e4b0d45ad.png)
![[Diagram]](../../diagrams/14/2426d34b0f2cfde4b6382ee49e2f0782.png)
![[Diagram]](../../diagrams/37/6443116b758ecdcdd8d78df3735ebbdc.png)
![[Diagram]](../../diagrams/36/0e13429b15b89f629f591670412d4f92.png)
![[Diagram]](../../diagrams/33/6ca8039d565e26f63a5be67311761ebf.png)
![[Diagram]](../../diagrams/32/d98ddbf080182d56bbb509512abe6af9.png)
![[Diagram]](../../diagrams/49/b6aa4687d254c9b42e0dcd7a9d5f6fa5.png)
![[Diagram]](../../diagrams/4/7a41dcbd918b597bddb7d0f31316bf38.png)
![[Diagram]](../../diagrams/40/f86dacffcc86eeae02ebff89c1375967.png)
![[Diagram]](../../diagrams/47/14ca1f37a6ae0c209e401513208ea0b9.png)
![[Diagram]](../../diagrams/17/64aa952624e9084e446d8478cf834081.png)
![[Diagram]](../../diagrams/15/44a8ca14da92e322223e9a46dcf86049.png)
![[Diagram]](../../diagrams/7/89f1514d0e70b4abdcb9086be363286a.png)
![[Diagram]](../../diagrams/44/7c7503ade46a75dd8bb13f93a0db8ce6.png)
![[Diagram]](../../diagrams/24/f23c3736a5f23755e0a5246a39b4f5b9.png)
![[Diagram]](../../diagrams/6/9ac1c3cc73932709fcda87fdcc44af73.png)
![[Diagram]](../../diagrams/33/c670b203ec38b2fdb2687c94980c3934.png)
![[Diagram]](../../diagrams/4/f93e767348e9a9eb3a2fdb1c93a1aefe.png)
![[Diagram]](../../diagrams/26/a7c3f615311e5a9b20bfc473ad6da8bd.png)
![[Diagram]](../../diagrams/51/3c11a591dad69595bdb93fb95f971b87.png)
![[Diagram]](../../diagrams/26/5fb441509a977b631ec33128a5697025.png)
![[Diagram]](../../diagrams/24/a7aa62a84f0a79d38374eb55c332dd7d.png)
![[Diagram]](../../diagrams/17/b73d9ae88fc59c4be3caa54f3757990b.png)
![[Diagram]](../../diagrams/28/b0460fa5f70fb903a440d70c22dc7c74.png)
![[Diagram]](../../diagrams/36/e23ac4c45df7fcad5e1337621b5365b1.png)
![[Diagram]](../../diagrams/33/b7abb09a7f7f8acde13e8bc77682990d.png)
![[Diagram]](../../diagrams/26/631a829066d8307789e0fac00748cb8c.png)
![[Diagram]](../../diagrams/36/e10d8b2260bf83dae8bdf0a790d67339.png)
![[Diagram]](../../diagrams/0/1fdc41f3e1ea10b12e7b7575664c1651.png)
![[Diagram]](../../diagrams/51/5d915281d095be4d43e67e00e8b738f2.png)
![[Diagram]](../../diagrams/12/3e9289d1a006da677e5b7a7b7bd45304.png)
![[Diagram]](../../diagrams/0/3a00d939521eff21a117cbfdabe64c08.png)
![[Diagram]](../../diagrams/8/811789f1e2d96295e371484772f60e94.png)
![[Diagram]](../../diagrams/9/d4f64ce2b82aa8900114a454f9f486b2.png)
![[Diagram]](../../diagrams/28/893382c2ba691a34d2ef94fd7cab256b.png)
![[Diagram]](../../diagrams/3/62e4d618c640715ff7dc3e6436537354.png)
![[Diagram]](../../diagrams/37/b25e2b334080ee3cf4d265c5dcce3055.png)
![[Diagram]](../../diagrams/21/f59b897fc93d9f8c82b47bb1c304fa87.png)
![[Diagram]](../../diagrams/37/036e2ff1560dbf605350d83ce7658759.png)
![[Diagram]](../../diagrams/19/60ae460e4aeb5ebe6cda3a7590a546e5.png)
![[Diagram]](../../diagrams/31/21a6280ba1a4c579afde813693233e61.png)
![[Diagram]](../../diagrams/51/88de00f78383e5f28411fd855f0b964f.png)
![[Diagram]](../../diagrams/38/3a1bc585a599df23ae866d071413eec2.png)
![[Diagram]](../../diagrams/20/9e33e8d52257d2495bc934392969e76a.png)
![[Diagram]](../../diagrams/11/12eead98c7e0a109c180acf1987cd2e1.png)
![[Diagram]](../../diagrams/45/054f2ab326da5b8b04cbdc5dfa10ce9f.png)
![[Diagram]](../../diagrams/33/dca76ae6a50dccd262f7b02364c505e7.png)
![[Diagram]](../../diagrams/34/805e226680222ea59b69c7e3c5e24358.png)
![[Diagram]](../../diagrams/41/593aca2fb9d967d546c93ac581130013.png)
![[Diagram]](../../diagrams/23/2b6567a732761b29ffb0c88a5c346837.png)
![[Diagram]](../../diagrams/43/ecc0f30a374d714ae51c997291096289.png)
![[Diagram]](../../diagrams/21/60a419d95dc67aec522c858d1b7e6a3d.png)
![[Diagram]](../../diagrams/23/0261c2e3b1ff07cdbc59e8d5c75b4ec3.png)
![[Diagram]](../../diagrams/51/61d2e8f0ae3bea2aa7ad86b6cf6bbeba.png)
![[Diagram]](../../diagrams/51/edeeb89edeace2273bf07a90c8cd8eb7.png)
![[Diagram]](../../diagrams/33/6c5ea339325fa1770bfa67e54f018342.png)
![[Diagram]](../../diagrams/20/da025db9785f63a82f32efcd87d1b2da.png)
![[Diagram]](../../diagrams/4/5ccf64b06a09198c87820ba6fc0e9a56.png)
![[Diagram]](../../diagrams/1/8b2ae006d80698c914097c2e6b0f2abe.png)
![[Diagram]](../../diagrams/32/7070daa386de45d29dbff555891a0aba.png)
![[Diagram]](../../diagrams/28/b4c58660caddf05bc17118beb7025e48.png)
![[Diagram]](../../diagrams/12/fa95fb041b10bfe5dc40d33c53b3f93c.png)
![[Diagram]](../../diagrams/22/f5b6be57826642f492b341ca567e85b1.png)
![[Diagram]](../../diagrams/47/6cb8bd4c8c916780d7c79c3469fae1e6.png)
![[Diagram]](../../diagrams/33/434edcd02bc69a30541d0d3e40c09e5a.png)
![[Diagram]](../../diagrams/50/623a6d725bd6aaee020309c79c43df05.png)
![[Diagram]](../../diagrams/18/d5ad5fb289b688191f091d0fcb6c3ea3.png)
![[Diagram]](../../diagrams/33/88d7b46f4fac4c5d8d4aa65e5a56bb04.png)
![[Diagram]](../../diagrams/0/f155f3a05ec61b7f7de89a67baaa684e.png)
![[Diagram]](../../diagrams/2/74b0963900407911e567868ea6f8decf.png)
![[Diagram]](../../diagrams/31/2f318ac0b5d4c705a8709b17131d70fc.png)
![[Diagram]](../../diagrams/27/5aa7351959113e04884644c804f2c3be.png)
![[Diagram]](../../diagrams/22/2bf1eb98204b8a2833d23d6adbef4f40.png)
![[Diagram]](../../diagrams/26/2e9f675b9874a5098b98e5d3f56489a3.png)
![[Diagram]](../../diagrams/49/2a4966f41de8d18dc74a02d0e9f1d927.png)
![[Diagram]](../../diagrams/46/5c6f18bf6e9c7d8ab9dc705b370b67b5.png)
![[Diagram]](../../diagrams/7/5fcfa7bba4e5550a49ed666a374c1889.png)
![[Diagram]](../../diagrams/11/52e8ea0b50d56611af280ac86fe9ab59.png)
![[Diagram]](../../diagrams/44/ba627aaabd01b2b396fac0a58d153bdb.png)
![[Diagram]](../../diagrams/2/5ab7b634b398cbdf632b3e777632bc66.png)
![[Diagram]](../../diagrams/45/c694d2306810ee06bee23f6289bbd3fa.png)
![[Diagram]](../../diagrams/44/f7d18244b113a75d185081590f074392.png)
![[Diagram]](../../diagrams/12/34bffdb715e4c5cfb09fa27579686100.png)
![[Diagram]](../../diagrams/34/2690e408a94e2a795dc2955633055d99.png)
![[Diagram]](../../diagrams/7/5c4f44c8616f11d78fd98f80e5c3974b.png)
![[Diagram]](../../diagrams/4/96e1ba0a1067cbe2e2203fa73a96932a.png)
![[Diagram]](../../diagrams/27/114d9a3c7866e494cbaeabae587be04d.png)
![[Diagram]](../../diagrams/22/720c8705f7ad8755e426943916c3977d.png)
![[Diagram]](../../diagrams/31/35c5197d05ea1a06d6afa83adc64c012.png)
![[Diagram]](../../diagrams/52/595c282073b7f8e04c4f9e8cf4bc6504.png)
![[Diagram]](../../diagrams/2/aaa7f3c4334480a60b5ffe0040224534.png)
![[Diagram]](../../diagrams/42/851552c9e68eef8eb0b41b8904950a40.png)
![[Diagram]](../../diagrams/8/a04078376570a5ed64ed4edf508f5f9e.png)
![[Diagram]](../../diagrams/48/0c7abedbb32a4d34d9d9fbbee48ab3e3.png)
![[Diagram]](../../diagrams/19/d981ad4bb32213d7ec8dc60d70250c18.png)
![[Diagram]](../../diagrams/34/152aac56d9eaebdcb2f9c1b16be9431d.png)
![[Diagram]](../../diagrams/50/8d26d8946a4caa819d43547f2f6b6bd9.png)
![[Diagram]](../../diagrams/29/01454cb4397f9040922976956ec6e7c7.png)
![[Diagram]](../../diagrams/44/ba8195c2d19560f926ead1673676ec9c.png)
![[Diagram]](../../diagrams/8/8e0800de0c12bb6fe6583e24d65d704c.png)
![[Diagram]](../../diagrams/31/52d6b1456347d7e3dcab95d579a54db6.png)
![[Diagram]](../../diagrams/50/73a75a1f20ab22af9edc320e32ce20f0.png)
![[Diagram]](../../diagrams/3/8ee63705b89856e0ffcb47fc9fca8f0f.png)
![[Diagram]](../../diagrams/52/0c2c815a460b1255b3b33561851f0381.png)
![[Diagram]](../../diagrams/37/f9efbcb450776be673fd95a448425f19.png)
![[Diagram]](../../diagrams/3/5f75bf9797bddb1de1f20b4da6a9779f.png)
![[Diagram]](../../diagrams/20/8a7fc8f02dc59767ab0d77238dcc96b5.png)
![[Diagram]](../../diagrams/48/21388e2664351f4b937f418ec0411166.png)
![[Diagram]](../../diagrams/41/3256c353f53fae8d9ec1f00de1afd669.png)
![[Diagram]](../../diagrams/39/dbf1764ab4bc3bd14cf13b185c352ca0.png)
![[Diagram]](../../diagrams/16/2e57196b24c807dc17411de361ee15c7.png)
![[Diagram]](../../diagrams/34/6dcfeee302af664cbad3a90bede18997.png)
![[Diagram]](../../diagrams/39/0f3d2bcb4ca5fbcb468f7eb7adcd1ea0.png)
![[Diagram]](../../diagrams/28/d6197eb93d14e8b12664d2770241f6a9.png)
![[Diagram]](../../diagrams/0/01544b69b2fd599599fa1cd11c3dcd78.png)
![[Diagram]](../../diagrams/28/ebf7a743d7e7cb6b0ca545583fdfddee.png)
![[Diagram]](../../diagrams/48/5a788f6023906fdc9380b556ff161672.png)
![[Diagram]](../../diagrams/31/3e976929ac3d00a08e1d910963f1ed8b.png)
![[Diagram]](../../diagrams/1/13725af8ddd25630be142447e0b0d177.png)
![[Diagram]](../../diagrams/39/ca20f43bde29676088398843231516ba.png)
![[Diagram]](../../diagrams/18/3393d446f372d2e9a8344bf7f4668111.png)
![[Diagram]](../../diagrams/8/8ffd81b542b6dd9dcc4f399500ddb7af.png)
![[Diagram]](../../diagrams/3/a7be2878d6deed86fc05de9f3024df88.png)
![[Diagram]](../../diagrams/2/925121e9398f7484e845b97951c994d0.png)
![[Diagram]](../../diagrams/23/c1a927879f02faa175d3c0f59971b69e.png)
![[Diagram]](../../diagrams/13/d0cb12cd20f7ed8957896df5b17ad1ff.png)
![[Diagram]](../../diagrams/26/1ff15562c8259143c9fe4ffd732275db.png)
![[Diagram]](../../diagrams/38/b0933575e66e3edb7d69db05c14d120b.png)
![[Diagram]](../../diagrams/29/d2932627debbb79c8df4a9d8e53243c7.png)
![[Diagram]](../../diagrams/43/a63b329821d1f422a44fbade25b6346b.png)
![[Diagram]](../../diagrams/45/a179ba8a7bfaa5baf2d1f8abf15ad0b5.png)
![[Diagram]](../../diagrams/11/c176061934254fee86caa1abd97e4186.png)
![[Diagram]](../../diagrams/8/dd14cd3ab95b0f42ef02540e2a0490bc.png)
![[Diagram]](../../diagrams/37/f1d2f4e019b217d265a68076d7035946.png)
![[Diagram]](../../diagrams/10/9dbe712c45bf969a8ddb6195702ba73f.png)
![[Diagram]](../../diagrams/28/83b7f7f57a87867f146903d3ef7ed2d0.png)
![[Diagram]](../../diagrams/27/55bead7f49435132af3c84a2f3c3b884.png)
![[Diagram]](../../diagrams/8/77e356a0d25972cc950afe13ae9a9724.png)
![[Diagram]](../../diagrams/22/59138fb7babc2eed9772a17ccad43e0e.png)
![[Diagram]](../../diagrams/34/44b5574e951466f53f5e68776c3ffea5.png)
![[Diagram]](../../diagrams/48/8b6132a688695efbe6d5c551c58d4085.png)
![[Diagram]](../../diagrams/27/79c8b03cc86a2597d208f13131cf3029.png)
![[Diagram]](../../diagrams/32/609a5330a04eee17dea3394b5a9dd422.png)
![[Diagram]](../../diagrams/15/c2afedb4fa35645d12416f2cbeb71dbe.png)
![[Diagram]](../../diagrams/21/07fae6ce28cc8d8df0bbc957d6a30c6f.png)
![[Diagram]](../../diagrams/38/318ded1ba9b0217d0abc5443a92c67a9.png)
![[Diagram]](../../diagrams/20/17694d5462d43ec702cef25522ff9e17.png)
![[Diagram]](../../diagrams/32/cb3850553a17b3fa1ed93ce171296e5b.png)
![[Diagram]](../../diagrams/26/fe7e92a1c5a69b79ac33c3fb983e0986.png)
![[Diagram]](../../diagrams/2/1567e87747e522be7aab844fb4f1cacb.png)
![[Diagram]](../../diagrams/34/2bd91b5b05421ffe1631d020177ceebf.png)
![[Diagram]](../../diagrams/3/2bf41251120e552afa0db6135f64feec.png)
![[Diagram]](../../diagrams/52/ba0799cc877a665173df86f1b7beabeb.png)
![[Diagram]](../../diagrams/51/166150dcf3d6c7957e46529974ea70ea.png)
![[Diagram]](../../diagrams/27/0b5454e57cab15cd970140116c64ac3f.png)
![[Diagram]](../../diagrams/17/9ca1b0daaf9674bc37d82bb9fbb97285.png)
![[Diagram]](../../diagrams/31/d446cc700b68be4bc84d2404f8a039c2.png)
![[Diagram]](../../diagrams/24/5298e9d945c67f222ddae1f28246940d.png)
![[Diagram]](../../diagrams/16/5386701072e1aab3e0eadbcb7f090a95.png)
![[Diagram]](../../diagrams/15/e060744221e10540a8376e4c672f644d.png)
![[Diagram]](../../diagrams/3/c5c2681a85659967d89a23e8eabbffbb.png)
![[Diagram]](../../diagrams/33/2ce5fc9c8f02bea1f0c4ece2f8eaa562.png)
![[Diagram]](../../diagrams/45/cae4f992908b94ccb894bd141be4295a.png)
![[Diagram]](../../diagrams/51/6eb79b156d354ad0176df1055a9df93e.png)
![[Diagram]](../../diagrams/16/86175b14fb114c313d20a4f9791c5b67.png)
![[Diagram]](../../diagrams/19/b30d4726ea2c07733202982932f98b54.png)
![[Diagram]](../../diagrams/27/dc2792f3923c4ab4e001c95c63642db6.png)
![[Diagram]](../../diagrams/10/057d7f0b4a389fce238e8525c81d2f63.png)
![[Diagram]](../../diagrams/36/a2469424845d499282fa049fd0708329.png)
![[Diagram]](../../diagrams/12/63f3176c62cfdad6ef618f4584e95f95.png)
![[Diagram]](../../diagrams/11/119dbf1447d0b579adb1d13b63d44ce8.png)
![[Diagram]](../../diagrams/7/7e9d3678b2f0ce0764d38b95043ebec3.png)
![[Diagram]](../../diagrams/6/9f3daabe8c8c9089966c090ca2721d6d.png)
![[Diagram]](../../diagrams/19/9ecd5c8dae8f889f92f3a8addb3933be.png)
![[Diagram]](../../diagrams/50/28925794cb70466e17c6d426d469e96d.png)
![[Diagram]](../../diagrams/45/42158084a91baccdefc44fb878d61b1e.png)
![[Diagram]](../../diagrams/26/78e627c9eb194100ce514b893bb646e0.png)
![[Diagram]](../../diagrams/4/ba1aad73e989c3c448a16c86a539b5d9.png)
![[Diagram]](../../diagrams/12/8dcafa08fb5238843cd6572136a50bda.png)
![[Diagram]](../../diagrams/2/427a05ddc455cefa3e5983dafdd0a472.png)
![[Diagram]](../../diagrams/33/5c8b47f99c9a62cfcfd101cffb1d9a6b.png)
![[Diagram]](../../diagrams/6/f36d7ce2dcd5c2b33aafd1e83038f7dc.png)
![[Diagram]](../../diagrams/15/63b2820acfd947682e26fa1a85053ec4.png)
![[Diagram]](../../diagrams/0/8391601a5ea4a91323f66c6f5d99f4b4.png)
![[Diagram]](../../diagrams/16/8d495051eb90831654b51f667a89d137.png)
![[Diagram]](../../diagrams/31/3d3966c623de342662f57245c93c410f.png)
![[Diagram]](../../diagrams/36/dd053a5d090fde2b3165dd65d2efc008.png)
![[Diagram]](../../diagrams/46/adc1d5a734345eba7847375c65686db9.png)
![[Diagram]](../../diagrams/24/d920be2f25cda75b8aab92a16dc22653.png)
![[Diagram]](../../diagrams/16/c7219359b725915bd55646affbd2b69a.png)
![[Diagram]](../../diagrams/8/4e43e63739663ce8051f427b5c31834b.png)
![[Diagram]](../../diagrams/43/3fcad11f87da204242604fef3261390d.png)
![[Diagram]](../../diagrams/23/6110367bc8ecde9569715c06b6aef303.png)
![[Diagram]](../../diagrams/4/ea5ec96a2229faf725e6f612edd4aefd.png)
![[Diagram]](../../diagrams/51/b1c48d660358716829c85c4d12a9314a.png)
![[Diagram]](../../diagrams/4/1b708402b64f903434d603cb84a68669.png)
![[Diagram]](../../diagrams/12/20a983d3644b46416ba3ff359b471404.png)
![[Diagram]](../../diagrams/14/b5fcd95a7e9384b63f4fea1be9a12a7f.png)
![[Diagram]](../../diagrams/46/192bc720689b7ab7401e296de9962872.png)
![[Diagram]](../../diagrams/26/3ba68b9d555d21698affe812d78c7fe0.png)
![[Diagram]](../../diagrams/37/707a0851c02b4046275464d1b7e4d856.png)
![[Diagram]](../../diagrams/5/977f32f26cc99cccb7906e9af7d437a5.png)
![[Diagram]](../../diagrams/17/087afa9cd6a19d2c9ed12b77d2377d0d.png)
![[Diagram]](../../diagrams/1/596abea66eb25437605f401b71b88b33.png)
![[Diagram]](../../diagrams/39/5bef39c7a3a27cc602fb8655e780d1fe.png)
![[Diagram]](../../diagrams/49/a7e7a7dee4f90f07ae6ef3edd80b3a59.png)
![[Diagram]](../../diagrams/50/22b95b10fbbd78c921a93a9c082826ea.png)
![[Diagram]](../../diagrams/15/9c325f45e7cae538ce58f9475f2343b0.png)
![[Diagram]](../../diagrams/46/65af14c16a75de64ab277cae55d3d4b4.png)
![[Diagram]](../../diagrams/44/8656678f7d0badbb1d4da17d017bf7ae.png)
![[Diagram]](../../diagrams/49/e438989646bc9244cf57277f7d5b32d3.png)
![[Diagram]](../../diagrams/9/de24023bc242a17b46d1df00a9b27dbf.png)
![[Diagram]](../../diagrams/12/463bea0401afb102c53b2267cc42937d.png)
![[Diagram]](../../diagrams/19/8ee17691cf953680a2e4e94011be5a61.png)
![[Diagram]](../../diagrams/43/ec9649fe77b93bd2660061a48462ca95.png)
![[Diagram]](../../diagrams/37/729e7edb206c1480652eae12ccae3d5a.png)
![[Diagram]](../../diagrams/52/5958d7dc3392fc6e4085ad5d6a661d2f.png)
![[Diagram]](../../diagrams/3/55732261ae62c18ebd4b7484a9c2b4f7.png)
![[Diagram]](../../diagrams/22/df0d67eba4062d64dc373b27587b1915.png)
![[Diagram]](../../diagrams/5/825c2ec93246b11367765607442ab48c.png)
![[Diagram]](../../diagrams/35/525d3dbd631ea7b50a9eace6aabd3ff2.png)
![[Diagram]](../../diagrams/30/3440e837447740fe2a1ff8ea91c82a56.png)
![[Diagram]](../../diagrams/42/5a12ad84dc4d287a420332dd614f2696.png)
![[Diagram]](../../diagrams/24/e7d93f2d27aa60a6e4d6884fd52c417e.png)
![[Diagram]](../../diagrams/3/569ec87a89619dd615f96d56fed21f3d.png)
![[Diagram]](../../diagrams/52/b84051beb0cea08cd28e8163fc904d32.png)
![[Diagram]](../../diagrams/22/615c89ad7e152c2c1d6798b0e08a6a2d.png)
![[Diagram]](../../diagrams/5/c252a3de2d4ef021adbd01cec8447e76.png)
![[Diagram]](../../diagrams/48/7de94811853ef67cd4139c51f141fdd7.png)
![[Diagram]](../../diagrams/0/cf3033cd6d86c551de805159e49363b4.png)
![[Diagram]](../../diagrams/44/0504eadcb4c643ec9834a81aff2a2014.png)
![[Diagram]](../../diagrams/39/50a033003a06ded593f245d094588609.png)
![[Diagram]](../../diagrams/19/481737e54d477227c150af9ba87443c9.png)
![[Diagram]](../../diagrams/49/9b286facb8fedcbf1c68ec8d3dc63d78.png)
![[Diagram]](../../diagrams/33/25b184fcbca36ec4131e92a4b96b9eec.png)
![[Diagram]](../../diagrams/4/64c9354c1f2d6ed29a4ee82eb2ade17d.png)
![[Diagram]](../../diagrams/1/10d25798e87ae12dd2fb80d541c4f7cf.png)
![[Diagram]](../../diagrams/44/4bfd90c28f258126f8c742a2ed16f436.png)
![[Diagram]](../../diagrams/37/aa4902f0bbc2812866593a0916ea1041.png)
![[Diagram]](../../diagrams/9/5c9725c392ce28b5fdbc619bbd223d34.png)
![[Diagram]](../../diagrams/25/6b50db7ac5eac82e73c20aa2b4c3bda8.png)
![[Diagram]](../../diagrams/46/59176d960d70c06aca33cf3742873eec.png)
![[Diagram]](../../diagrams/52/910a9a8a5b594a61b604632e648995aa.png)
![[Diagram]](../../diagrams/15/4287e4ae936d9705dee808ca0f64d711.png)
![[Diagram]](../../diagrams/23/e79f391ea7b62da67cbe658545998a5f.png)
![[Diagram]](../../diagrams/36/17d7cabe513d18959f051bacfda1042a.png)
![[Diagram]](../../diagrams/23/9413c2e6275cbfce37be14a59c7d33e4.png)
![[Diagram]](../../diagrams/30/fdd95f70d4858b7ad0c75d70508a9d44.png)
![[Diagram]](../../diagrams/17/0bc354ad93fb7d0adaae76cf96056138.png)
![[Diagram]](../../diagrams/29/41ae65c87ef34bb8ca072df9aff5c470.png)
![[Diagram]](../../diagrams/24/f062ca9b21a0b77fc4fd94a642af7f7f.png)
![[Diagram]](../../diagrams/42/d0bce2332853920c62e781db09e62d46.png)
![[Diagram]](../../diagrams/5/5e666d22e14a6f19d57c924a7aea5322.png)
![[Diagram]](../../diagrams/20/4249a0c7067ba53f81c015440fdf4a3e.png)
![[Diagram]](../../diagrams/52/da5fd69c04374a3ae975574a4ba29d0b.png)
![[Diagram]](../../diagrams/20/83c40ba665e5e14552e9fbc7ac503c05.png)
![[Diagram]](../../diagrams/11/b5e33be0ba3948b819082733bc1a1e62.png)
![[Diagram]](../../diagrams/20/276d0dbb86f757eeabc6cfd6492248ba.png)
![[Diagram]](../../diagrams/17/da981d1b57df58e930805eb5c0936bda.png)
![[Diagram]](../../diagrams/25/ed50c632902e0413a92bec3ba59bc785.png)
![[Diagram]](../../diagrams/39/ed818416a55a9fa8bf44e5bfe7603813.png)
![[Diagram]](../../diagrams/14/d71ee50831cdd04b5250d5bffef60819.png)
![[Diagram]](../../diagrams/46/8da1c5aac10d8885a6d5730c91c5e5db.png)
![[Diagram]](../../diagrams/14/6efc587751be0a674d3cf2d1042686d0.png)
![[Diagram]](../../diagrams/18/d063f3850b22c2711d8e40b4b784bd92.png)
![[Diagram]](../../diagrams/44/3d28e9e5195d058b49032c2fc842195e.png)
![[Diagram]](../../diagrams/19/6179fb5fead00c07003214e430783092.png)
![[Diagram]](../../diagrams/16/a6496ba23bda5f84c43e40421c510cee.png)
![[Diagram]](../../diagrams/42/5b1ce1784878856fd1a53be96241a7d4.png)
![[Diagram]](../../diagrams/26/64e6e2d6ab633934a264e8a190e19234.png)
![[Diagram]](../../diagrams/6/b2cb1c178cf719a5c5cf5918b2c50a21.png)
![[Diagram]](../../diagrams/30/96f5abc3e130cbe59f33d463b52f78d8.png)
![[Diagram]](../../diagrams/36/3cbdc29436f366912157112071f59413.png)
![[Diagram]](../../diagrams/45/b66a9ea1b8e7e6c5c1c4d7a66937caf0.png)
![[Diagram]](../../diagrams/24/814f2adfa895503a577afd646dd04153.png)
![[Diagram]](../../diagrams/43/0ad8abb971665bf397c2e2728a3d0c0a.png)
![[Diagram]](../../diagrams/25/bc75234b93fb69a46ea069c5d8586df0.png)
![[Diagram]](../../diagrams/11/56221ea1b170f49598d00411f46d38a8.png)
![[Diagram]](../../diagrams/7/8fe9786650147e6b2af0576ae4bed43d.png)
![[Diagram]](../../diagrams/52/5106b3045ba4b243a9df3a1f4002aff2.png)
![[Diagram]](../../diagrams/22/d4a1365e59cedbe7848350514f78dd7c.png)
![[Diagram]](../../diagrams/34/76c429a0bbacd6d286d8cdef85319e93.png)
![[Diagram]](../../diagrams/45/0768ca24e69d4bfda5c31c39b6ed9867.png)
![[Diagram]](../../diagrams/16/e2f6d7a213e4e724aee0428d1ca6a6af.png)
![[Diagram]](../../diagrams/16/696b291685797cbd4f19c0a7320291c5.png)
![[Diagram]](../../diagrams/1/75fe1a33f6fa3eccf76e838dd0ea9eda.png)
![[Diagram]](../../diagrams/40/a6045c0a8820965f0b394af32f84af79.png)
![[Diagram]](../../diagrams/27/4d9a1393c5b3961314346900353d2d5e.png)
![[Diagram]](../../diagrams/44/88d2fb4592d1ee499021badc84d6355d.png)
![[Diagram]](../../diagrams/16/a16416d1344b2006a022bc85740bb5a6.png)
![[Diagram]](../../diagrams/31/5a111ec1d32f6724532dcc091b3cc9e5.png)
![[Diagram]](../../diagrams/49/a3d0052808a3e3ecfe498837752ee8d3.png)
![[Diagram]](../../diagrams/22/87a5abd0fc56f9e572739c21d9a51041.png)
![[Diagram]](../../diagrams/16/526ce4203d38e69d79734d5161217d46.png)
![[Diagram]](../../diagrams/51/817e76e792acb0068fcceff673aecb5d.png)
![[Diagram]](../../diagrams/25/b49580b2c0ea54834f2dadbac36b6946.png)
![[Diagram]](../../diagrams/9/0550a1cd6460ad12841415dafb373e7d.png)
![[Diagram]](../../diagrams/4/9aa2cce26be9a66a1ebf66f94d5a2d33.png)
![[Diagram]](../../diagrams/31/8e063c737c68ece34d8bf416d6779dfd.png)
![[Diagram]](../../diagrams/51/afb6de58eceb685d390178bfb84d37be.png)
![[Diagram]](../../diagrams/42/5188f62e424f546c1ad50aabf243bea8.png)
![[Diagram]](../../diagrams/9/569a6c68fa316d8b5a3f377d8b6835fc.png)
![[Diagram]](../../diagrams/22/483723321135346dccff4c388d02ffcd.png)
![[Diagram]](../../diagrams/21/b02b0b4befbcf2b95a1f1a2716cc772d.png)
![[Diagram]](../../diagrams/47/22fe78f75c422b58d8243a7a3991c343.png)
![[Diagram]](../../diagrams/29/301bbca7dddc844cb61c4ec1ba66898f.png)
![[Diagram]](../../diagrams/21/710d4030c641e1a511973499017dad9e.png)
![[Diagram]](../../diagrams/51/8f09c6e9f73050d7308008939ade5bd4.png)
![[Diagram]](../../diagrams/16/3290cdc6243252b5ae34f89b86496039.png)
![[Diagram]](../../diagrams/44/d791e881b501d52a57d224b3d4059a0b.png)
![[Diagram]](../../diagrams/26/b6b8bd8862722e8eba6901bac6baefc9.png)
![[Diagram]](../../diagrams/49/88be6378eff2c388c4b6f1d346f92dd3.png)
![[Diagram]](../../diagrams/32/a035bb48b59c123b443e2a06be5e3c92.png)
![[Diagram]](../../diagrams/7/67766919ea2205cf6ccc5d5de1e99cf9.png)
![[Diagram]](../../diagrams/2/32be0940bcd905916a19039fabe9f04b.png)
![[Diagram]](../../diagrams/28/ec02a90ec82b63e0b6a88e390a2de40a.png)
![[Diagram]](../../diagrams/15/8d2d235c3caf6ead85498ac7603faeb0.png)
![[Diagram]](../../diagrams/11/4370551a0df0651e5e59c12712b2a011.png)
![[Diagram]](../../diagrams/10/9f5e21783b585893a259b156914fd562.png)
![[Diagram]](../../diagrams/13/68657907e92a5ce074aaaa4915227020.png)
![[Diagram]](../../diagrams/15/241cbe5904e91c12a48f7116360108a9.png)
![[Diagram]](../../diagrams/15/b963d35b057b80f13f31530920b99837.png)
![[Diagram]](../../diagrams/24/37c665b2cf5fdd9eda6e30e297a40fa4.png)
![[Diagram]](../../diagrams/29/098d1063fc43855d679ff13f391ae208.png)
![[Diagram]](../../diagrams/4/ade9df81dffdeb92a6701130f3232402.png)
![[Diagram]](../../diagrams/27/586035d3daccde32888491e2e0c29553.png)
![[Diagram]](../../diagrams/30/dac5f0f564f43d5f6a3d9fba2578a2b1.png)
![[Diagram]](../../diagrams/25/92b6b22f4793fb637b4916266417c216.png)
![[Diagram]](../../diagrams/17/c652354daa6bf24d1b932a55edfd65e2.png)
![[Diagram]](../../diagrams/50/cbc4b1b8b37be946aae9aad4875b5c18.png)
![[Diagram]](../../diagrams/31/95c92128c7838e83ace316aa135fc6d5.png)
![[Diagram]](../../diagrams/50/edf556fd94202a371398a1ad687cc96f.png)
![[Diagram]](../../diagrams/48/cf735cc6f5d8499e01c1192147881a5f.png)
![[Diagram]](../../diagrams/41/00c0a8e67d97b86e04b16b372545b195.png)
![[Diagram]](../../diagrams/52/a011147d576392fb89dafc1159e4d34f.png)
![[Diagram]](../../diagrams/46/677f72c6e14760ef5b0ce4e6a7175577.png)
![[Diagram]](../../diagrams/45/9669fa6068d9f46fa80b83ab781509cd.png)
![[Diagram]](../../diagrams/41/72dcd6112befc863571afe7da0701837.png)
![[Diagram]](../../diagrams/36/eca32ccc650ca713be2110a4431cd756.png)
![[Diagram]](../../diagrams/44/cf759a5cea7ba0a3bffb3630e60f83d7.png)
![[Diagram]](../../diagrams/2/32704acd4787f3210bb38001c35c663c.png)
![[Diagram]](../../diagrams/49/3011d74918a5018ef03e1c049f81dd23.png)
![[Diagram]](../../diagrams/2/8742f8c848764d717e234b087b2d47ac.png)
![[Diagram]](../../diagrams/31/605fd7d906fca69ae8b321864f47feb1.png)
![[Diagram]](../../diagrams/33/f77649dc4e5c3a71a756884022272d95.png)
![[Diagram]](../../diagrams/43/6d3f8a528cfd7f83da71cfc784b9843e.png)
![[Diagram]](../../diagrams/2/b74f58930a6a80cf19f3940fbbf0b5d7.png)
![[Diagram]](../../diagrams/43/da8adaa9b54675c46b10af7555a00c88.png)
![[Diagram]](../../diagrams/48/e6afcb6927691fc90b6701c4c5bad64b.png)
![[Diagram]](../../diagrams/17/6aa3353e5f154bca2966e810350d2071.png)
![[Diagram]](../../diagrams/27/ebf4eb2ef1060363119ef1b83201b335.png)
![[Diagram]](../../diagrams/21/ef166f7701f4fa3422140e0012e8d2ed.png)
![[Diagram]](../../diagrams/44/fcd7e4312095e6a109ba6276020e956c.png)
![[Diagram]](../../diagrams/27/b6f0dc91657f55266c55536a0e71407c.png)
![[Diagram]](../../diagrams/4/0528d5f2d71c56bcb85cc19c714d5e70.png)
![[Diagram]](../../diagrams/52/a591c8647a97e2e201e043084beec403.png)
![[Diagram]](../../diagrams/18/d34f319d7a3c3c5394fc37c31ae43a6f.png)
![[Diagram]](../../diagrams/29/645bf3b26a86f288b122964b5d523875.png)
![[Diagram]](../../diagrams/39/3e560b09e0df94d9e302b830c80256f5.png)
![[Diagram]](../../diagrams/16/42b6e9828f809e59920cd089eab1534a.png)
![[Diagram]](../../diagrams/30/5507513ad1fdd99730b4109ead5c6cea.png)
![[Diagram]](../../diagrams/49/5cf982a2404b1e7163ba98ee6e55fdfb.png)
![[Diagram]](../../diagrams/36/646e268f019c36b5919ebf93abd9281f.png)
![[Diagram]](../../diagrams/10/550518bc7961dc1a8535146183441502.png)
![[Diagram]](../../diagrams/48/f14089da45970598a04001226e536aba.png)
![[Diagram]](../../diagrams/1/2973c78a4d572c42d53ca611046e5444.png)
![[Diagram]](../../diagrams/18/2c11e11741e8ccbf6795376164446700.png)
![[Diagram]](../../diagrams/18/37d1e8b852bad83e0a975043f497ee71.png)
![[Diagram]](../../diagrams/23/984c4e3bb73e481fd0c1c066bbd361b0.png)
![[Diagram]](../../diagrams/31/2a927a3a08c5ae6c5c59fa05a66fe1cd.png)
![[Diagram]](../../diagrams/20/e4fa9065d7bb968431ed5d058db53684.png)
![[Diagram]](../../diagrams/31/48c2bf345828f6240c52234bc85103d2.png)
![[Diagram]](../../diagrams/31/948fea1018ae939c62861431f2cd0524.png)
![[Diagram]](../../diagrams/44/ed9688532a3bb34ed81f3a04fb6a231c.png)
![[Diagram]](../../diagrams/30/410f1122c105e990cde6afaa5ec7c42f.png)
![[Diagram]](../../diagrams/30/082f67d0493e9927f3e2f1b5b09d9965.png)
![[Diagram]](../../diagrams/7/92e7caf0e5bd012f827c78817afe849b.png)
![[Diagram]](../../diagrams/34/128df9b01aad92de82fde11dc0fffa4a.png)
![[Diagram]](../../diagrams/30/c244481e4013519c8e72c82bfc1c0247.png)
![[Diagram]](../../diagrams/26/d4b3102f672c8d9cee4b241592ea0275.png)
![[Diagram]](../../diagrams/8/de4639dff4ed8d3c117e4719292283bb.png)
![[Diagram]](../../diagrams/11/1640b0c139e8bbc40bca6a6249b09d64.png)
![[Diagram]](../../diagrams/35/24c7e65a0b2ebacb2dfe070b13e653ca.png)
![[Diagram]](../../diagrams/32/53010184e314a0b4a7da1701e38f068d.png)
![[Diagram]](../../diagrams/43/a221b846a99e09c0a308b9e9dc59d238.png)
![[Diagram]](../../diagrams/19/5f4e118c170a1876f6cbc02b0e4d76db.png)
![[Diagram]](../../diagrams/34/eb16fcea8a8e803b9c5b237657c64ae3.png)
![[Diagram]](../../diagrams/50/c692c7936b4451ae2155240a22291b48.png)
![[Diagram]](../../diagrams/25/09f2f6769aea8110714a613dd1b9acd1.png)
![[Diagram]](../../diagrams/3/090cbd7898c782ce9094faa76b4026e1.png)
![[Diagram]](../../diagrams/12/d1e66dac286711a8f503b7b2069274d5.png)
![[Diagram]](../../diagrams/33/938416dfa030433330c30eae1ad12845.png)
![[Diagram]](../../diagrams/22/09653cc4021b37220f968211f875591f.png)
![[Diagram]](../../diagrams/7/23d1b2fa82b79be3cc892bc9df23e6f4.png)
![[Diagram]](../../diagrams/33/00136d9e8a76ee9ffddc9fb6814b41e0.png)
![[Diagram]](../../diagrams/2/ae27c8c03c1f5bca37f8594851b155d9.png)
![[Diagram]](../../diagrams/48/1141fab6cd7ac94cc22293ec2d3dc17b.png)
![[Diagram]](../../diagrams/31/e09009f45626bb31410c9d49869ca8fb.png)
![[Diagram]](../../diagrams/37/960203fbcd52320694ff8611bc12c95f.png)
![[Diagram]](../../diagrams/47/4d6be47c73294e1b542ba8655f6df00e.png)
![[Diagram]](../../diagrams/1/fe09d44923ee4280dc3cf743c55fc5d6.png)
![[Diagram]](../../diagrams/43/a4c9af8b0bfb852bd05ddc26e82a438a.png)
![[Diagram]](../../diagrams/9/290b1ef0d44a8956adba121dc25c4806.png)
![[Diagram]](../../diagrams/47/e6891b5baa9686704ea216010332ea49.png)
![[Diagram]](../../diagrams/10/475fe9db2e4ee8ed30fb3baf9bcc13f4.png)
![[Diagram]](../../diagrams/0/e003085b00f61015df3566151af8a120.png)
![[Diagram]](../../diagrams/27/921a1654b953f5ed73b4d6bed335606d.png)
![[Diagram]](../../diagrams/22/76092f91ffb381843888db226d08ebf4.png)
![[Diagram]](../../diagrams/13/1bf0e1eb5c3ef6dfd0aaddc49539e878.png)
![[Diagram]](../../diagrams/43/c266efdb18b5cd55d875d5b54374da39.png)
![[Diagram]](../../diagrams/21/bd445cfd602467c131a666cd8a06f78a.png)
![[Diagram]](../../diagrams/28/a08ea7638d7797f9313c6534a18883ed.png)
![[Diagram]](../../diagrams/20/01691c0a0ce88aef17a650d0500b4239.png)
![[Diagram]](../../diagrams/49/72442cc6d8a7b8631a3f480006a6b1a7.png)
![[Diagram]](../../diagrams/14/6b9e4c55bb8d14ecae58cbd80813cce4.png)
![[Diagram]](../../diagrams/36/6305ade6073e4f0ccd679af3856629bc.png)
![[Diagram]](../../diagrams/47/32c2efec0037580d5b463a52e7c26d92.png)
![[Diagram]](../../diagrams/37/66bd7e014749e326e4cd9bacc1a4a9c8.png)
![[Diagram]](../../diagrams/47/a067465bb6ee8d246db69cbfea4b5a2c.png)
![[Diagram]](../../diagrams/36/fc6197b68d0891dc5c6c388e513d04e0.png)
![[Diagram]](../../diagrams/47/56bd316223bcf76760c544d3fb3d1688.png)
![[Diagram]](../../diagrams/29/b1eaa4030893007d1f79433823d91a3f.png)
![[Diagram]](../../diagrams/40/60f53c37aa631f2312151a1daf9b3ac4.png)
![[Diagram]](../../diagrams/51/7859344e70e16bfddb0f8dfb06d40c11.png)
![[Diagram]](../../diagrams/15/760cb885d0916fbcfcb25fec70856641.png)
![[Diagram]](../../diagrams/43/2b1413fc648fa521b1febc1d1c0dcb52.png)
![[Diagram]](../../diagrams/38/4dbc4763c9725cd6628568c360194ccb.png)
![[Diagram]](../../diagrams/4/ebfff24d4ff745f26bb5dc99309e1d68.png)
![[Diagram]](../../diagrams/40/a20a712d7db1afe5360ed9fcb0e300d5.png)
![[Diagram]](../../diagrams/52/8821b23daa13c86f65147e8f66188722.png)
![[Diagram]](../../diagrams/0/e10f021a218aaaab328a331085eb227d.png)
![[Diagram]](../../diagrams/6/f980de92e05e3949baad6175c0e2f340.png)
![[Diagram]](../../diagrams/19/49f9f54b250782aae4c8966cd6e407ab.png)
![[Diagram]](../../diagrams/45/a1e23e7dcd0ff0a9c17179524c5eda86.png)
![[Diagram]](../../diagrams/47/f94e439186fcf94cb2036da54dfb96ee.png)
![[Diagram]](../../diagrams/35/6d14b4f656beea3cc0cd703b3a85607c.png)
![[Diagram]](../../diagrams/6/0c4e2bfc9abdc790fa11210ae8ddfc38.png)
![[Diagram]](../../diagrams/19/4de39f6cbf1d7e79504a1ac4f1766acf.png)
![[Diagram]](../../diagrams/43/16afb46033290c4ef32d52671c68e2a8.png)
![[Diagram]](../../diagrams/13/08266d347f4eb609ccba4b292f5e5491.png)
![[Diagram]](../../diagrams/29/e6a36119ff31f14f2431811d2c9376ee.png)
![[Diagram]](../../diagrams/43/27997d4d2c1a473a7e7121488dac719e.png)
![[Diagram]](../../diagrams/33/4cc5e9009f0dbcb492a0abf4250a67c5.png)
![[Diagram]](../../diagrams/20/65a4380bed24416f7eb8d02d1db7f1a9.png)
![[Diagram]](../../diagrams/10/55ad27a4a9e8c5a880706e79a57ca8cc.png)
![[Diagram]](../../diagrams/22/5e567a5901c07f5aec2da7c77e853d65.png)
![[Diagram]](../../diagrams/20/41c5901cc74c82ec8f9031bff08d37f5.png)
![[Diagram]](../../diagrams/13/5f57df4252841e583184e7b334d6b1b4.png)
![[Diagram]](../../diagrams/47/f141c2b4cc804ac18e56e5355776fb39.png)
![[Diagram]](../../diagrams/43/6cf9b50788007a4a83c668d47016f617.png)
![[Diagram]](../../diagrams/49/024283dbc7d25ca5a19532ae48d55b2d.png)
![[Diagram]](../../diagrams/39/4894da3591332acd3897086feecf060f.png)
![[Diagram]](../../diagrams/10/0f4fc89a785cc644471dd4c7b480040c.png)
![[Diagram]](../../diagrams/47/e4bcc08255a680f7564e8e0cd2f04e74.png)
![[Diagram]](../../diagrams/20/1fff215a0a3a80a733b28356988d0ca9.png)
![[squared point]](../../images/es.gif) are
are ![[Diagram]](../../diagrams/25/0c54b53723012df27a8cdc673fce01ff.png)
![[Diagram]](../../diagrams/7/dca90890b45aad08bca42d85454d4364.png)
![[Diagram]](../../diagrams/36/2f4d001316b2b452a6be173a306c04e0.png)
![[Diagram]](../../diagrams/3/438ff159c5b1ac2f2cdf929dcf5d2e1b.png)
![[Diagram]](../../diagrams/25/e52f7a1e149a4e4a08461d9f0a9c3c76.png)
![[Diagram]](../../diagrams/15/820d9c0c069338c002df23d187f763a4.png)
![[Diagram]](../../diagrams/8/0b0502ddc9d75d713ababd76e172c43b.png)
![[Diagram]](../../diagrams/33/5b3effb0fde3c58a1afbd133660b583e.png)
![[Diagram]](../../diagrams/24/3a1a14dbc436a41d11583050831be069.png)
![[Diagram]](../../diagrams/45/f0d7549e84ab0ca2e30dd4eee355d23d.png)
![[Diagram]](../../diagrams/27/c68668a786f88bc5763011c8fc9f4202.png)
![[Diagram]](../../diagrams/34/9e50bfc09c4a2bbe442b5dbfa0bf674b.png)
![[Diagram]](../../diagrams/38/5e657ca1b7fbb25370c48e7128ca084a.png)
![[Diagram]](../../diagrams/29/97d369070f82b50e125da39532950d6a.png)
![[Diagram]](../../diagrams/35/5159110f4a3f3644eb83094c1d74ee21.png)
![[Diagram]](../../diagrams/1/65d3a647f07f6d83bfa9c670bdc77fc4.png)
![[Diagram]](../../diagrams/23/9b3c98ba8514d9032eee3f1909f69a5c.png)
![[Diagram]](../../diagrams/44/b3c64d39fdf851eb18349138eaf7c6d1.png)
![[Diagram]](../../diagrams/20/a17a2835531b3781f6867efd45c91d97.png)
![[Diagram]](../../diagrams/19/882b82b7e39c250f11e44ce6677ad670.png)
![[Diagram]](../../diagrams/13/b8e0eb1883287d80b76034014908c956.png)
![[Diagram]](../../diagrams/10/48e65643b2ccbe8578f78685b078cc2f.png)
![[Diagram]](../../diagrams/12/7595c345ce3af91568c1c9bdbd15340b.png)
![[Diagram]](../../diagrams/19/5491fe6cfc677a6032e76f01c7eaec35.png)
![[Diagram]](../../diagrams/33/1964fc1a7cd3e5b9f27de66fd75d4631.png)
![[Diagram]](../../diagrams/36/1be119fa106f6b086f9ded7bacd4f394.png)
![[Diagram]](../../diagrams/14/1676d8c5850c4ba3fbb663fb431e2e0b.png)
![[Diagram]](../../diagrams/14/fc0ad80971957656428d86de52805eb1.png)
![[Diagram]](../../diagrams/25/979fac47021d69cdf84f70376562e231.png)
![[Diagram]](../../diagrams/12/9715f7ef709af6e31096d85bafd6598b.png)
![[Diagram]](../../diagrams/30/940899be52544abc8c59cfa8742c8b7c.png)
![[Diagram]](../../diagrams/17/2a830a69701cfb12447b3434b1ee684d.png)
![[Diagram]](../../diagrams/1/f989a4a13a2432d273e041794f86e20c.png)
![[Diagram]](../../diagrams/49/54865d6738e86a790757ff3de59880f4.png)
![[Diagram]](../../diagrams/40/0e2c66229b799331c1014914a903c465.png)
![[Diagram]](../../diagrams/12/18c58f9a9eb3e791017dc8060257f0c4.png)
![[Diagram]](../../diagrams/22/53bcd6f91662208c93ae40edc35e6fe1.png)
![[Diagram]](../../diagrams/23/9dea86e3aee07a6ca813411a2cf7b7cf.png)
![[Diagram]](../../diagrams/28/19969de27d78d0624b47ea5a8a8c2c0a.png)
![[Diagram]](../../diagrams/12/c32efed2dc1df2be806828bfa1efba9c.png)
![[Diagram]](../../diagrams/50/1d15686181b4db1f67ee6d7b58373f89.png)
![[Diagram]](../../diagrams/26/50d79c4f01bce15b64a0251b9a172792.png)
![[Diagram]](../../diagrams/51/1aec1204175ab1361c397490909d5ea0.png)
![[Diagram]](../../diagrams/3/7a9ad8d958a8a3ddbe6ee9e2ba6e8efc.png)
![[Diagram]](../../diagrams/51/05f683f6b5333debb374855d6d2b78d6.png)
![[Diagram]](../../diagrams/15/122becd6869ed8911c38b9fc5208d86b.png)
![[Diagram]](../../diagrams/5/5b42a2de9764e065abde29c5eedaedda.png)
![[Diagram]](../../diagrams/14/0a4ac515876ab96aa6198b1e5b736800.png)
![[Diagram]](../../diagrams/16/80911b1c2b962fa37cb88c397e5b117e.png)
![[Diagram]](../../diagrams/48/cdf2b2857671c74a52cbcea06fb6c5c4.png)
![[Diagram]](../../diagrams/15/483447d64acba7ee96adcadf96e55ecb.png)
![[Diagram]](../../diagrams/50/32f9909c7e7423e2cd5a8c0c5a1a6bcc.png)
![[Diagram]](../../diagrams/49/27294a2a45504865ba0f3652f77c0b5b.png)
![[Diagram]](../../diagrams/22/e17013af5a47e6ca789b734115327d66.png)
![[Diagram]](../../diagrams/15/d945a3d85239edb33078c35a0096bb8c.png)
![[Diagram]](../../diagrams/14/40788dfea5f5e6c7eb512a124c14f4d8.png)
![[Diagram]](../../diagrams/5/f9bd3c884417aca6d0184fd3182a5957.png)
![[Diagram]](../../diagrams/19/beba4f3aab6bd6e659bf83c0b2f9a079.png)
![[Diagram]](../../diagrams/29/534a7db46fc67db5bb68accaf17a4a06.png)
![[Diagram]](../../diagrams/23/b6ab66ab6b56789ace45b64bc892191b.png)
![[Diagram]](../../diagrams/11/ca9fab1f4a37934ff8846558392efb7e.png)
![[Diagram]](../../diagrams/50/dbfad481d085d81276bacdfda872c567.png)
![[Diagram]](../../diagrams/46/7965326d81eb66cab6063fca0fa3b02e.png)
![[Diagram]](../../diagrams/35/c13b252f45fd8511d688bec2fa0eda07.png)
![[Diagram]](../../diagrams/3/aeaf0af84ece5cc048cc8046cc0eb66a.png)
![[Diagram]](../../diagrams/37/633c213880d9ec311c4c973935f64515.png)
![[Diagram]](../../diagrams/38/d15f40b7b30208da2de22aeff03b3c64.png)
![[Diagram]](../../diagrams/28/8a52c77b7984a6ee9b7b78354271f8dc.png)
![[Diagram]](../../diagrams/30/70ee86273faa080534849aca06b205d2.png)
![[Diagram]](../../diagrams/25/975387b0a8e1b5e0804c43a77ccd67ef.png)
![[Diagram]](../../diagrams/42/e7994aef6e2efdbc8888ade0a4512d83.png)
![[Diagram]](../../diagrams/13/9f540c3dcd8c838fd5ee57a36b9cb93e.png)
![[Diagram]](../../diagrams/12/c4c0e685cd9d419f2ae8b8c6fa74d173.png)
![[Diagram]](../../diagrams/50/be738670d6d6113b5bd5d6d1e9c95c7b.png)
![[Diagram]](../../diagrams/34/7a82fdd23f2ac8e69b87055e17bbf4cc.png)
![[Diagram]](../../diagrams/20/ea7f34b41772480fb3eb2733088e7fc1.png)
![[Diagram]](../../diagrams/10/aeb471c8d71e7ea1507d707adf94d6ec.png)
![[Diagram]](../../diagrams/48/cec064ea2d53a827e9558b97fec8c469.png)
![[Diagram]](../../diagrams/0/e8f7c684e801fbb71e7bf0902db1d4e1.png)
![[Diagram]](../../diagrams/0/4e2de77e99f56600146634fc6b5f1c12.png)
![[Diagram]](../../diagrams/21/8588ea5260b6afb4eff4dd78017ed2cc.png)
![[Diagram]](../../diagrams/2/2a2ffa2b245523f51023b05c911b7762.png)
![[Diagram]](../../diagrams/29/a571e2d3861081229410e0676f63f034.png)
![[Diagram]](../../diagrams/28/203557e2f6a330e966890f28692dec43.png)
![[Diagram]](../../diagrams/35/5ad9c11a46ff7a0917746f9737e630f2.png)
![[Diagram]](../../diagrams/34/7a0a7dc8714773ad845861427bf01b71.png)
![[Diagram]](../../diagrams/32/5de1568303668f97f406e373a4fb28fb.png)
![[Diagram]](../../diagrams/6/8a86f0c681eadf56e2ccdb62c012a714.png)
![[Diagram]](../../diagrams/39/54b5d11ddeaabfb759eb3268a40faa18.png)
![[Diagram]](../../diagrams/10/d19886d1a64c7845c8f04b49ff687837.png)
![[Diagram]](../../diagrams/30/8a40f7f15ca9d0bdab67ce17f3f72cd4.png)
![[Diagram]](../../diagrams/38/b04cd1db0a3270be6ae161b1e2c8ca6a.png)
![[Diagram]](../../diagrams/24/dca02630a31ddde30d2fdc382cac6a9c.png)
![[Diagram]](../../diagrams/27/14691992916865b7ecb4da550e635ff2.png)
![[Diagram]](../../diagrams/33/8f4f5ce8733febc1b67eeb739060be30.png)
![[Diagram]](../../diagrams/18/6a6671c0d25ba1a9d7219796a8b54677.png)
![[Diagram]](../../diagrams/24/7fb382a80e12e3724686283667ae12ff.png)
![[Diagram]](../../diagrams/2/8e7763e500b0280cf7673d1c1a34341f.png)
![[Diagram]](../../diagrams/35/4042c88388048d212c73488ad2dabd49.png)
![[Diagram]](../../diagrams/23/4644c1f429fd158f27a7148b2461564d.png)
![[Diagram]](../../diagrams/37/107f302f59bf9c44201d096d3e788312.png)
![[Diagram]](../../diagrams/40/2f59ef97f4e944eed4ed73ab72c0fdcf.png)
![[Diagram]](../../diagrams/9/7e70cfa058b6763e169f3601b07adb50.png)
![[Diagram]](../../diagrams/36/70d719dd2dc3864cef86ee6fd64c1843.png)
![[Diagram]](../../diagrams/36/ea005ef8b425c533122810b6ce8c2605.png)
![[Diagram]](../../diagrams/8/7fb5c6934f78b0c9364b0135a547577c.png)
![[Diagram]](../../diagrams/4/8e366f198b899cb007df49285e960e4e.png)
![[Diagram]](../../diagrams/18/7dc82c8423b056db5ef6bb0e7ba11f05.png)
![[Diagram]](../../diagrams/50/e93712df5d94164db7d118806c0a6b5e.png)
![[Diagram]](../../diagrams/15/04b462664541226a961e018e5bb0639c.png)
![[Diagram]](../../diagrams/20/7fa3552f2c46730b287bf3d99a569104.png)
![[Diagram]](../../diagrams/17/dba6a47dbaf6f05b6082ff6a442c3a92.png)
![[Diagram]](../../diagrams/52/a8fb297123e3db2ca5c618b096f07162.png)
![[Diagram]](../../diagrams/12/8166ab555622cd0c21c8555ff426f3ac.png)
![[Diagram]](../../diagrams/15/0340c801f7a65f29b210a33cbf295aef.png)
![[Diagram]](../../diagrams/15/9ae8d621bdc38426586768b9e1a6bdcc.png)
![[Diagram]](../../diagrams/48/92b20b03440079317963a4325120549e.png)
![[Diagram]](../../diagrams/25/fd1ab3416ec2bba7d67fea094b9e06c0.png)
![[Diagram]](../../diagrams/29/0bde43e9e2d9a3054bdff225d01e6401.png)
![[Diagram]](../../diagrams/15/75e0af22c0323ca5f66f6482e1a0d32b.png)
![[Diagram]](../../diagrams/45/73e00c080cdad348ea5e9f6758f581be.png)
![[Diagram]](../../diagrams/2/17bc59f37464937c6702229e72fd2641.png)
![[Diagram]](../../diagrams/47/1c1419fab4fa0ee16acaa460d8a3b909.png)
![[Diagram]](../../diagrams/40/bdd2514b439ad3b0b345a8200f53573e.png)
![[Diagram]](../../diagrams/18/c57952a62aa172c6b927f4c71c552ad2.png)
![[Diagram]](../../diagrams/24/9830d6e05f0c2fb16c9f3166dc584053.png)
![[Diagram]](../../diagrams/30/43b98549147c08e2781197f9de491dc7.png)
![[Diagram]](../../diagrams/24/361b1e651da5079ecc181f7a6a09ce13.png)
![[Diagram]](../../diagrams/32/f4216e8ccbbb2bff7ea22b6fae5ef59f.png)
![[Diagram]](../../diagrams/48/590e2a94fde567e7c64596f4b4fbfbae.png)
![[Diagram]](../../diagrams/20/9c87adbf94a01f52125886c92a2a6644.png)
![[Diagram]](../../diagrams/25/2f973b8fc52ea0dfb8cafffb968b02cd.png)
![[Diagram]](../../diagrams/18/f1f04cfc8eef8bfae1588b4bcb2c486a.png)
![[Diagram]](../../diagrams/3/1e27a5864860480cac76cfbff6a4ba70.png)
![[Diagram]](../../diagrams/45/8553473e1341076f99679f51fc27dd00.png)
![[Diagram]](../../diagrams/2/528a5bc8d42a7d93605e5713c0a40000.png)
![[Diagram]](../../diagrams/18/4e84ba56890370d21647d275cb0d07df.png)
![[Diagram]](../../diagrams/2/5a1d0a50b230c508d2b2c787879ebeab.png)
![[Diagram]](../../diagrams/40/7c4046bea44dcba4ce3e2f1671c744c0.png)

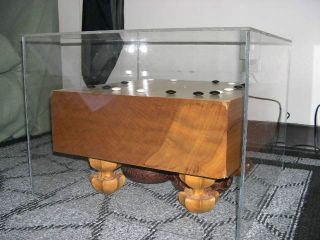
![[Diagram]](../../diagrams/6/bf14503c34252e3905fe6152078ff111.png)
![[Diagram]](../../diagrams/10/fd7502594b98865226b8fa0129ae8023.png)
![[Diagram]](../../diagrams/15/98a13e75a0979ab5db6ce279325e83fd.png)
![[Diagram]](../../diagrams/24/2fecb902c87277698205f5f7ffc040c6.png)
![[Diagram]](../../diagrams/21/3f4280d38dfb58279dd89be6e205f7c4.png)
![[Diagram]](../../diagrams/2/adc93f9ecb369aa223c5dc9d831bddad.png)
![[Diagram]](../../diagrams/18/84a2a39f83568b89eb999f94808a123e.png)
![[Diagram]](../../diagrams/23/19b4e87e978f18de0261a68d2e0b5f88.png)
![[Diagram]](../../diagrams/21/1d0e21faa5bc2767af3f8ac50df7463e.png)
![[Diagram]](../../diagrams/35/22323532afd554c68718bb379a940e10.png)
![[Diagram]](../../diagrams/13/11ca062da6674eafbe2cbde95bfa2bee.png)
![[Diagram]](../../diagrams/37/8f06308367125eb4ceb3dc65acd419e2.png)
![[Diagram]](../../diagrams/45/517fd742fa2f17bab00d6f7ad88f9b52.png)
![[Diagram]](../../diagrams/4/c25cd1018a24fe3523c1c8133df363b9.png)
![[Diagram]](../../diagrams/33/fea71708cc9fe3756c29a848c57fc9e4.png)
![[Diagram]](../../diagrams/22/82c1f03ab907f88948167de0be0be3c6.png)
![[Diagram]](../../diagrams/11/5d863e8e7dde181fb57d5a60cde3e3eb.png)
![[Diagram]](../../diagrams/28/844d1381a4fe4b8ba4ce016cbe0e07b4.png)
![[Diagram]](../../diagrams/46/57f0349a9fe9dba8bc64e0664999051b.png)
![[Diagram]](../../diagrams/19/336cc296928bbc38185703a74c402d69.png)
![[Diagram]](../../diagrams/10/9ab1379a17b4271b7a290faf8b97f224.png)
![[Diagram]](../../diagrams/25/b1b2a3a054cdf28957782ac830f1b30f.png)
![[Diagram]](../../diagrams/13/94bdde80d6c51ef5b5d2b8c1e0e1cf01.png)
![[Diagram]](../../diagrams/36/088e24b245aa221fddabbee0dee1b5c9.png)
![[Diagram]](../../diagrams/42/9d68def7f8fc9a74a9bb213e2490b9d3.png)
![[Diagram]](../../diagrams/23/5a0dd3786eb887e8d71a57d9e2aa41a0.png)
![[Diagram]](../../diagrams/24/8517401473be1777f38ba59238673c54.png)
![[Diagram]](../../diagrams/31/caaf27f00318e80e2dc629a870a2c9e2.png)
![[Diagram]](../../diagrams/5/99cc9603f9cb5e06fecf704ba571138d.png)
![[Diagram]](../../diagrams/51/93c5eaedcd132f4fe1540415fb1356b5.png)
![[Diagram]](../../diagrams/6/8965301018e9c6f2ebcd361859b8753b.png)
![[Diagram]](../../diagrams/21/08912dd8089522b09616b55c1a38068c.png)
![[Diagram]](../../diagrams/52/a013caa88f9f06bd1ad5249942c52c31.png)
![[Diagram]](../../diagrams/26/946f0433e4e3fb0998c978057c1541cc.png)
![[Diagram]](../../diagrams/38/6b9cf89c6c88e4824e467d3d4ab2ee6a.png)
![[Diagram]](../../diagrams/11/3783bf71c755fdd39209eb698f5d206e.png)
![[Diagram]](../../diagrams/6/c4d5e28414bd7a3532dabbaefccb8044.png)
![[Diagram]](../../diagrams/51/060b0ed1a1290d5e67b563b683a96beb.png)
![[Diagram]](../../diagrams/52/60195c55a33628c9cb6dbeebcb187053.png)
![[Diagram]](../../diagrams/33/a0f5e277904836fb244d4101ee266039.png)
![[Diagram]](../../diagrams/36/49a224cc3e5614988baf2aedfe15d3c8.png)
![[Diagram]](../../diagrams/51/c28ffd70002e3827fe5cd4349fd3d695.png)
![[Diagram]](../../diagrams/33/72d75b334f81a61e5d10f84949e45834.png)
![[Diagram]](../../diagrams/23/61a6c94730580af48542ca4290c3e8aa.png)
![[Diagram]](../../diagrams/1/6a0726c3407b2226a1165f7e0d11fe93.png)
![[Diagram]](../../diagrams/52/0c7d2b035e2bfcd5702b008edea304b0.png)
![[Diagram]](../../diagrams/7/fda812b526cd2f04cfc6e1d5b5325943.png)
![[Diagram]](../../diagrams/28/0997efd9255f9109bac2bfd0fedc80a7.png)
![[Diagram]](../../diagrams/4/293c4456ab06ef8d766555bd7fee8440.png)
![[Diagram]](../../diagrams/32/87d9d00886e6334f3dfd15c6d6f134db.png)
![[Diagram]](../../diagrams/5/d973ff2f84053b609a7a2645bb055973.png)
![[Diagram]](../../diagrams/47/c52cf5686431128e7d0f2b3107b4109f.png)
![[Diagram]](../../diagrams/30/59567c41fa883a64a6c7f423682c8f20.png)
![[Diagram]](../../diagrams/11/2de79b54a5c6bee98243835626b49874.png)
![[Diagram]](../../diagrams/42/a6f2847f4adb3427f96e2401b5003828.png)
![[Diagram]](../../diagrams/29/aacc8e2650cbd46a276eb2521a4cfcfc.png)
![[Diagram]](../../diagrams/11/c1b234f1d05181cca501e2634c79ef39.png)
![[Diagram]](../../diagrams/39/fa6325af628da772a3ca13b9b38390a7.png)
![[Diagram]](../../diagrams/34/82464b49027171507991b6d6cf1214bb.png)
![[Diagram]](../../diagrams/27/9ec8a9ffad9bb5927c7a9cd3e5f21bab.png)
![[Diagram]](../../diagrams/45/2cf29b8267bb491446b68383db17ffb6.png)
![[Diagram]](../../diagrams/3/f0c6ae6053abf0892c23766f6c4af24e.png)
![[Diagram]](../../diagrams/23/fc6a82db816f5cb260b184eda3866574.png)
![[Diagram]](../../diagrams/47/fa19d069793918237a3a7bf2aecba8de.png)
![[Diagram]](../../diagrams/36/4e946f7cf305cf016e1dedf37eeb03ea.png)
![[Diagram]](../../diagrams/19/eef6fb216010513e7fd3d44ad886da36.png)
![[Diagram]](../../diagrams/12/00b2bd7aa0d9975277e438afb241bab2.png)
![[Diagram]](../../diagrams/13/7509f86db895f0677a43094be472d00f.png)
![[Diagram]](../../diagrams/26/84ecd1d5823be3c2a43a27655dbe2962.png)
![[Diagram]](../../diagrams/10/4eaf18ea5e2db232840dc3087b7ef91e.png)
![[Diagram]](../../diagrams/5/0293fd5879ad10bbae40e9ca7b370922.png)
![[Diagram]](../../diagrams/23/2c7dddccfb1610e3d7831000101853ca.png)
![[Diagram]](../../diagrams/22/631877cf41db8e92b8d36cf2d1d0a931.png)
![[Diagram]](../../diagrams/15/368c84633fdbff5919410a0a732b9a16.png)
![[Diagram]](../../diagrams/14/6a87df2d5d9350d61daacdef545e95c2.png)
![[Diagram]](../../diagrams/0/fa007fcda4dd40baa32066e6a0390d63.png)
![[Diagram]](../../diagrams/3/21c9a4ae6df4994a30f9eda18f8ba29b.png)
![[Diagram]](../../diagrams/35/e0d721e547e5aa46e22626e5c6a91fbd.png)
![[Diagram]](../../diagrams/32/75139cbd8ec23e5cd9a2ee9b4b2e08e9.png)
![[Diagram]](../../diagrams/40/9980c09ab71bd7f9309996d37669d51b.png)
![[Diagram]](../../diagrams/52/652e2ad0879e410b57ee43b085db80a4.png)
![[Diagram]](../../diagrams/16/121692205ccb9a0578b73bcb388f604e.png)
![[Diagram]](../../diagrams/42/d0f89ed46feddb25837f71b1f755470e.png)
![[Diagram]](../../diagrams/19/972662819fa3489d24f5427cee042072.png)
![[Diagram]](../../diagrams/37/28ee65f8cb3e7e7df6872e4674e7e811.png)
![[Diagram]](../../diagrams/43/a8dbf6e05dfa0ca759874b334452f39b.png)
![[Diagram]](../../diagrams/46/18af4d4f5a8ce611d2b085cb623ad1f3.png)
![[Diagram]](../../diagrams/12/c027323e5fab6258d82dafc5093320ea.png)
![[Diagram]](../../diagrams/2/05fd53cd5cb362a79daa09a8d067cd88.png)
![[Diagram]](../../diagrams/16/15ee218cbf668baad0cac8fdb1cd1403.png)
![[Diagram]](../../diagrams/12/b0ae35e55b903941b5d937db828b3c9e.png)
![[Diagram]](../../diagrams/15/db10e50ee224c167235df64500475252.png)
![[Diagram]](../../diagrams/3/2e41b89b587b658e95882dcf7524227c.png)
![[Diagram]](../../diagrams/44/af76850b405a323ff24f1055282663fd.png)
![[Diagram]](../../diagrams/28/634a8d76a444c1aa7560a644ed4c5949.png)
![[Diagram]](../../diagrams/37/e84739ffd486ba1c224da47ee70bc373.png)
![[Diagram]](../../diagrams/47/d743410eeb798fee404143f9a16dccf7.png)
![[Diagram]](../../diagrams/9/24d0779426e0f8ae5c3353e8f6399818.png)
![[Diagram]](../../diagrams/30/f75f0e28f87ebc1123d20ddf6ca5566d.png)
![[Diagram]](../../diagrams/33/cc4e4a6467b8737d78ccf9e714d32b34.png)
![[Diagram]](../../diagrams/42/333934fa9107369e84c133482a667080.png)
![[Diagram]](../../diagrams/48/cc911da998a1dc30b65471ce650b4d70.png)
![[Diagram]](../../diagrams/41/3f7f1158afb4845c14728e93f2783c38.png)
![[Diagram]](../../diagrams/27/fe46ff2ca02fd6e96a7d92d303d1be9f.png)
![[Diagram]](../../diagrams/22/64fa4c223596fc4c02d901b0878c928d.png)
![[Diagram]](../../diagrams/4/47b3840a6d7edd21bcd15fdce7744fa2.png)
![[Diagram]](../../diagrams/27/87b4017553004bf1a30270fdddc9e710.png)
![[Diagram]](../../diagrams/2/869ac7c2034c6f7694b0011f01079f69.png)
![[Diagram]](../../diagrams/34/c8dc37182cf1ff20fb32d112c853bf8e.png)
![[Diagram]](../../diagrams/34/2b6a136503b2ed944da53d722c5a1bd9.png)
![[Diagram]](../../diagrams/43/fc1c71dcd0341c391ba2f8ca7b7e0f83.png)
![[Diagram]](../../diagrams/35/b511eaf640e2cd25ad0c00d04fa8077f.png)
![[Diagram]](../../diagrams/39/949003b5469517bd1696bd0e218e653c.png)
![[Diagram]](../../diagrams/9/4db31f77bbffe73bbbf575ef3d6d4461.png)
![[Diagram]](../../diagrams/46/0689ae2af70456512b2598f02d59fb34.png)
![[Diagram]](../../diagrams/42/b87feaac3a4f8a8c68321f9d3b2a167f.png)
![[Diagram]](../../diagrams/31/30a2a852d7eed16078b3e49553860529.png)
![[Diagram]](../../diagrams/9/f28b32dc8ad18bc8f0d0be4d3f2c618e.png)
![[Diagram]](../../diagrams/9/9e6f222627ba49be656efad1f0597942.png)
![[Diagram]](../../diagrams/49/c62c7e81d3cc2b2a62960d396eed35a6.png)
![[Diagram]](../../diagrams/31/399ad9d5cfa0c09b7989ebf80a0bbda2.png)
![[Diagram]](../../diagrams/25/ef4117287977c65d162e7dde628a1548.png)
![[Diagram]](../../diagrams/5/7dc511fe920e069e10ca52368066e92a.png)
![[Diagram]](../../diagrams/21/6653495313460a8e4ac264606e9a544c.png)
![[Diagram]](../../diagrams/3/bf5c4bc98e6eb51808300afd78f2c4d0.png)
![[Diagram]](../../diagrams/10/03cb720e94b440d49ccd1715b2c5deae.png)
![[Diagram]](../../diagrams/20/524124b3fdd878b366615273bdbf8e65.png)
![[Diagram]](../../diagrams/20/1f4225bb53d2c932b859c6037512a989.png)
![[Diagram]](../../diagrams/9/4019faff48fcc5ef1145b835449efe6c.png)
![[Diagram]](../../diagrams/44/ccba4c3897f0686e54ba3a3c30593c9f.png)
![[Diagram]](../../diagrams/43/f6f76f4cedd677dcd23ca48d84d109f3.png)
![[Diagram]](../../diagrams/5/9b48a2d01640a64f894c50ceb8b6670f.png)
![[Diagram]](../../diagrams/11/1ba113dbc2fa4cb6b18885f88a63ba65.png)
![[Diagram]](../../diagrams/36/cf22ec8fae3aa440aca58795a5dc342e.png)
![[Diagram]](../../diagrams/38/3de6e6b59e1fed84810a1ef27685f8e5.png)
![[Diagram]](../../diagrams/7/b4579b256456c35f96db350eebb57c7b.png)
![[Diagram]](../../diagrams/50/5e201f4825a2a565116303d832ed752f.png)
![[Diagram]](../../diagrams/42/4b46f751bfe2a5ebf8eb5fa4b85d83fc.png)
![[Diagram]](../../diagrams/29/4ca32b1d3741ebab3ecfdff31869a76f.png)
![[Diagram]](../../diagrams/52/f7f7f905126108b8817e18426c9d6109.png)
![[Diagram]](../../diagrams/45/64cf0df874145155662d9bde574728c2.png)
![[Diagram]](../../diagrams/47/e61292db73f3bfc9bccbd29f1de77300.png)
![[Diagram]](../../diagrams/40/487c8141c923c9a1f9e40cf65d692932.png)
![[Diagram]](../../diagrams/50/a51538b6313f7f0a9f3af8b65da1c5bb.png)
![[Diagram]](../../diagrams/13/5dd12c60245b0c1c31cc84cb0f31ec03.png)
![[Diagram]](../../diagrams/41/01d5d90d6143ea8de2f83b6f2158c5b4.png)
![[Diagram]](../../diagrams/18/ac472e744c08098bef7a1fb8ec2adc8d.png)
![[Diagram]](../../diagrams/21/779fd22555a310830957d5034d9868fa.png)
![[Diagram]](../../diagrams/44/71dcb8aebf6323543953dd187ec59705.png)
![[Diagram]](../../diagrams/51/f45b75dbfbc791c628ebe25bbfa3a442.png)
![[Diagram]](../../diagrams/9/0e11cea33bedf65827b6cd8c934a9631.png)
![[Diagram]](../../diagrams/47/2ed0a76341c74642998c3b1168abf02a.png)
![[Diagram]](../../diagrams/36/a5e8a0091ed693c7dfa944cab4259bc7.png)
![[Diagram]](../../diagrams/27/4c2b9588d85a8a89c67bca203e306d57.png)
![[Diagram]](../../diagrams/7/1d0d655643258e271ca10ff309a6f4fa.png)
![[Diagram]](../../diagrams/27/a3b4fa11ea89676018de54ba008c1364.png)
![[Diagram]](../../diagrams/27/4f37ba8332978a8bb2723eefa09aaeda.png)
![[Diagram]](../../diagrams/52/f2cd022105d0e210ac376412481ead72.png)
![[Diagram]](../../diagrams/23/57954a830e38d22056a0b166539e0990.png)
![[Diagram]](../../diagrams/35/11f4f885e5b1d32fd5f8925f01d5b40c.png)
![[Diagram]](../../diagrams/11/64f9320c621823d2edf74de2b8c6ad48.png)
![[Diagram]](../../diagrams/43/e4b78075abdd9f707afc0cbbeccdd9e5.png)
![[Diagram]](../../diagrams/4/f7a7b57268c52c59a6f2ae19fb7e6f0b.png)
![[Diagram]](../../diagrams/48/1a4e95431d076f3e33798cc12e198a6e.png)
![[Diagram]](../../diagrams/41/83c90b49907ef530acae75bb14e70b42.png)
![[Diagram]](../../diagrams/21/c541a1dc345252714932303aae8b1423.png)
![[Diagram]](../../diagrams/36/1e06b5a568f0cc6709ad333ad860605f.png)
![[Diagram]](../../diagrams/32/a4c3ddb376c55a627416835a9748c3ed.png)
![[Diagram]](../../diagrams/39/0dbf2d252148d7bf0b649b2a303df72e.png)
![[Diagram]](../../diagrams/22/13aa340ee0f4094982225150bd68f5d0.png)
![[Diagram]](../../diagrams/26/aac0bc0595ea0889640fd65b77d31050.png)
![[Diagram]](../../diagrams/27/1b5083d26f1cd9c2b827c34a317530df.png)
![[Diagram]](../../diagrams/0/37b8310de3f858b97a8cb43e8c400982.png)
![[Diagram]](../../diagrams/40/f32cb9a5e4a58f091582267b48b94520.png)
![[Diagram]](../../diagrams/29/cc7003ff0ebd81751ba5104a1c477fbd.png)
![[Diagram]](../../diagrams/13/ead24346774fb82b0c57173008c0889a.png)
![[Diagram]](../../diagrams/27/f80c7a80f301f5fbdcdc7864e64aaaf1.png)
![[Diagram]](../../diagrams/17/2dd8407d4d53ef923c9c425d777e527d.png)
![[Diagram]](../../diagrams/52/bd880ac34c1c3ffa4c33e366c333ac8f.png)
![[Diagram]](../../diagrams/51/385e2acec4dc7ef5224d70b97d4d7658.png)
![[Diagram]](../../diagrams/22/9881cc4734afb2381d67d7616bfe598f.png)
![[Diagram]](../../diagrams/12/31a69224b28ab56a9093dca26bb32b31.png)
![[Diagram]](../../diagrams/50/66b07ce9f0473232e68fe4d28aceec99.png)
![[Diagram]](../../diagrams/42/65c273dae2c5d038e95474fdbd172ed0.png)
![[Diagram]](../../diagrams/44/484c62a719a823333d56cfe40649ee38.png)
![[Diagram]](../../diagrams/29/983845de67c602a6f2f45aeabc6b26ed.png)
![[Diagram]](../../diagrams/28/fdae097099c486fd6de28edd307e2d0f.png)
![[Diagram]](../../diagrams/11/4879ad76ec8a6c031dc2298f3d3c2aa9.png)
![[Diagram]](../../diagrams/1/857cf56996e8b52f41a682488725196f.png)
![[Diagram]](../../diagrams/42/1dd50aad8a17b1d1021d714c1a996bb8.png)
![[Diagram]](../../diagrams/52/7b99b1d436de13f6d67d1fc74a74c199.png)
![[Diagram]](../../diagrams/1/824908062fded63387a5be635315e4fc.png)
![[Diagram]](../../diagrams/51/2d15feed2f00be0e2e226a1bd8c54806.png)
![[Diagram]](../../diagrams/36/210dcec59ecc8e2c7dc165094874dfc8.png)
![[Diagram]](../../diagrams/44/97cb3497ddb365b93926ef54cb0ee881.png)
![[Diagram]](../../diagrams/34/2e3577988eefb1f7cb2177875317e4b4.png)
![[Diagram]](../../diagrams/23/da19e3943249584734f089049e4e11d4.png)
![[Diagram]](../../diagrams/46/0b908ebd7c0cc71960b80de98f979f87.png)
![[Diagram]](../../diagrams/48/cafa3f6ecdbfbff55fe582f82c33d7f9.png)
![[Diagram]](../../diagrams/50/61ed8fad86a728bd84a71999a8260aa1.png)
![[Diagram]](../../diagrams/25/0a2ad4b87771474fd945037452f10ba7.png)
![[Diagram]](../../diagrams/47/a4da795f11c88c3f3df79b71901a56fa.png)
![[Diagram]](../../diagrams/12/0f7d3b548927b2a23f5254245bfdb7e9.png)
![[Diagram]](../../diagrams/13/f13b53f2d95bf44ca7d5580b0925dbd2.png)
![[Diagram]](../../diagrams/31/18916622cef45a9c23127178c5832aad.png)
![[Diagram]](../../diagrams/16/19c84371828354d40f32487fb9bfeffb.png)
![[Diagram]](../../diagrams/52/b95b9504f2f52561f95e2f5d9b392e8a.png)
![[Diagram]](../../diagrams/47/df1df476ce9edcc0ff847d11f1a65cf2.png)
![[Diagram]](../../diagrams/29/f10054049329e0049bc93f7ffe08de28.png)
![[Diagram]](../../diagrams/32/975fa3b97cdcd600330bc601171cab9d.png)
![[Diagram]](../../diagrams/26/4a7c8f71c6dd5fa19f461a84141dc19b.png)
![[Diagram]](../../diagrams/20/0c3e92cbd9ee30de9a045f90b3397be0.png)
![[Diagram]](../../diagrams/26/8b14b1e606719eca9c512c276b605e00.png)
![[Diagram]](../../diagrams/25/2a100f9002e2d4decc71901b51873ce4.png)
![[Diagram]](../../diagrams/9/20016123474218675f5833c002061f40.png)
![[Diagram]](../../diagrams/33/041bcdb19a467c8209cfb47e880c7c6b.png)
![[Diagram]](../../diagrams/49/710c490e20aff837c3f81bc2cbbbe450.png)
![[Diagram]](../../diagrams/52/907767ee2f612475d5328623da369d15.png)
![[Diagram]](../../diagrams/31/50fb5d6470031d55fe8395d933ff987e.png)
![[Diagram]](../../diagrams/49/bcf4b949a84ce863fcd7f3a0c460f26e.png)
![[Diagram]](../../diagrams/2/b6d9c3535f7e81aa0340ec0fb72fba68.png)
![[Diagram]](../../diagrams/0/7124d1b247388b61727e798f803800f6.png)
![[Diagram]](../../diagrams/31/769242161ea1b7bdcf6dfa935cc1fe57.png)
![[Diagram]](../../diagrams/46/6bae0cd8e703a1a2df3d28ee49ba448d.png)
![[Diagram]](../../diagrams/34/11f3467d935c1d2ee2e113ed176408c7.png)
![[Diagram]](../../diagrams/41/b3802bfec17df75b9428fcee52ed9b15.png)
![[Diagram]](../../diagrams/14/6e8b080771beed3c1a7e084d6679fe22.png)
![[Diagram]](../../diagrams/13/61b08310c35f3a4b2fcaab801c313d42.png)
![[Diagram]](../../diagrams/6/03edd534d700d83202e0137b2db81153.png)
![[Diagram]](../../diagrams/8/5df285be78e3c73965fb1a70b9e16e8f.png)
![[Diagram]](../../diagrams/30/6ea25a31951e42ee5def81349d993a76.png)
![[Diagram]](../../diagrams/35/7cdad791f165420ef41acae6626c6ae1.png)
![[Diagram]](../../diagrams/32/346c68f0a36ac36028bfe937dc12e63b.png)
![[Diagram]](../../diagrams/26/fed12d73169fa4368353b27e626ad0c7.png)
![[Diagram]](../../diagrams/17/2e0cdab147e7293d1bcaad40ccfe8a64.png)
![[Diagram]](../../diagrams/6/f0bbc8dfb4e9aaf23a9878a1fb0d1a77.png)
![[Diagram]](../../diagrams/29/a76a4bd6c93a7718d483bb8b82efc3c6.png)
![[Diagram]](../../diagrams/35/600d20103a16f752aeabcd1e34dc2dc2.png)
![[Diagram]](../../diagrams/43/365dcaf87b47471e853697107e40ab85.png)
![[Diagram]](../../diagrams/8/4e73121f557ba28a1d9ae014be800948.png)
![[Diagram]](../../diagrams/8/01a546980092c245fae3e4a3cce560c6.png)
![[Diagram]](../../diagrams/48/9857610db70329b6db3ff9e27ca06b17.png)
![[Diagram]](../../diagrams/41/75a75dd20e9a07f79abe5a61474d2032.png)
![[Diagram]](../../diagrams/6/7a871fb592edf7490ce05d62874c89cd.png)
![[Diagram]](../../diagrams/30/63e5b0b12e3340fef3a077454ab3691b.png)
![[Diagram]](../../diagrams/39/b6ef30259870a572210d2cb41e83df19.png)
![[Diagram]](../../diagrams/31/3e01141d57bf327a95ecbd95a414d5a9.png)
![[Diagram]](../../diagrams/20/a75a78d2f306435f3dcc0afb8884d22b.png)
![[Diagram]](../../diagrams/38/f41526dc744cc3e9108d206644caf5d9.png)
![[Diagram]](../../diagrams/32/d0d9f5581f25a08f5ae6cd631ef9b3cf.png)
![[Diagram]](../../diagrams/39/3665f6c46b584bb8c63d57bee60cc9ce.png)
![[Diagram]](../../diagrams/17/4a3d02a25fb458c136e9ba482651bc96.png)
![[Diagram]](../../diagrams/38/a641831c716433b612437738574ee2b5.png)
![[Diagram]](../../diagrams/12/1c98e09f8fc15d698110e59fbaa8efb0.png)
![[Diagram]](../../diagrams/0/cd82e1062f1254abec0b317b47a8f482.png)
![[Diagram]](../../diagrams/27/e2c81f99f02b23e9ed8ee8ec029af9d6.png)
![[Diagram]](../../diagrams/21/340099ad563bb8e716aa8bf88fec23a3.png)
![[Diagram]](../../diagrams/38/98e888d0b6cfe7c2b6c03d8e5874ed29.png)
![[Diagram]](../../diagrams/51/9cc17343372b998b54b8f30d388f8aa1.png)
![[Diagram]](../../diagrams/5/12d77d4073e29d1f02096b89c7d30dbd.png)
![[Diagram]](../../diagrams/24/3cd5906a95b9c622a5651c1e5c4c689d.png)
![[Diagram]](../../diagrams/44/027a7a8b0847ce57b90b2776bc712302.png)
![[Diagram]](../../diagrams/4/015ddcde4a7a87b1a952dac36aaab128.png)
![[Diagram]](../../diagrams/1/5a711670ac6580d8ee9c25c1e50d6596.png)
![[Diagram]](../../diagrams/37/5da69eb44f5c201717aa4057ec5290fb.png)
![[Diagram]](../../diagrams/3/044457d22866c9f57e3d13a71c2472c5.png)
![[Diagram]](../../diagrams/25/32f94c7fa3826071f662da46f6ad4bb4.png)
![[Diagram]](../../diagrams/16/38decc3e7eded9076e0224c7fb87bfb4.png)
![[Diagram]](../../diagrams/12/3bcf685caa4d52b023903ceba3e57388.png)
![[Diagram]](../../diagrams/8/faf65c9420ce006eec78235f3941fb09.png)
![[Diagram]](../../diagrams/45/2abc509e65cdfa69c8be44575e208443.png)
![[Diagram]](../../diagrams/24/7881b5d2f553deb7857d66803d282cf1.png)
![[Diagram]](../../diagrams/35/bfea788f3f15d559d4a2ea1cc30ac6bc.png)
![[Diagram]](../../diagrams/8/8d9beba70f558a926f8455a6c6735a04.png)
![[Diagram]](../../diagrams/4/48d1dace4136379999e235510075b71b.png)
![[Diagram]](../../diagrams/0/bf8e6adb0933500d637467f2b3656ce2.png)
![[Diagram]](../../diagrams/9/0a481cf5e7ff20924c3f6f26a0775142.png)
![[Diagram]](../../diagrams/27/a0f498c5afb5147656c81739d607f034.png)
![[Diagram]](../../diagrams/36/5c838db9c4901324b8f4262353c70fce.png)
![[Diagram]](../../diagrams/11/b91a38862f39dcf3f79c62bcdefd40cb.png)
![[Diagram]](../../diagrams/18/705597613045de35eb6d305ba4c1bb93.png)
![[Diagram]](../../diagrams/9/0c61fa947b361b5cca2df87d70f7a11c.png)
![[Diagram]](../../diagrams/15/05848d53e645414ad389e6e0b331adfc.png)
![[Diagram]](../../diagrams/29/662b5f17a0671eeb7ee776e85773cf1d.png)
![[Diagram]](../../diagrams/45/402a8b006a082a1cfe1fa80405c993c5.png)
![[Diagram]](../../diagrams/30/0428154057c631102d0f59f794a6f246.png)
![[Diagram]](../../diagrams/0/bd5926adf17765792e54ef326bf0a08b.png)
![[Diagram]](../../diagrams/6/dd4bce188f08fedd87907f52bdbb3e88.png)
![[Diagram]](../../diagrams/9/4eda07463f57dc62d61f0babc622ef9b.png)
![[Diagram]](../../diagrams/44/b377b7ab14b38f3c01617cf0f6015ea3.png)
![[Diagram]](../../diagrams/16/ba8fe7f4eb540bef3dcb9a864554d11d.png)
![[Diagram]](../../diagrams/25/865ed3122e37e5f01eb88af448fecf13.png)
![[Diagram]](../../diagrams/30/9fcab6a9112ff67a2a89d5f783d44ed0.png)
![[Diagram]](../../diagrams/34/519086f9e8090f9d2ae3c9deca4d973f.png)
![[Diagram]](../../diagrams/3/8edb4f65a4c515ff0c42de17c77e9cea.png)
![[Diagram]](../../diagrams/42/ed64e66e8725f1be258d12024ba2be90.png)
![[Diagram]](../../diagrams/15/9f48ccd29351023d0b6aff6245260c89.png)
![[Diagram]](../../diagrams/20/34949b5463904786fa95e7cf1deb5424.png)
![[Diagram]](../../diagrams/17/cb323f67f630877579d0897e47f49a41.png)
![[Diagram]](../../diagrams/41/d4cae22f63cbbe2d36b73393f10118c0.png)
![[Diagram]](../../diagrams/16/1fccbc01d644a2d487e4b76a8a1361df.png)
![[Diagram]](../../diagrams/42/8716ff407ddbe2d597804cc30fd7c3e4.png)
![[Diagram]](../../diagrams/22/497bcda463bbbdd18c877171569d48ae.png)
![[Diagram]](../../diagrams/47/53c8ba69d22ef5354c5227ab17a7a352.png)
![[Diagram]](../../diagrams/44/892844907d198d964c31a4d326574ce2.png)
![[Diagram]](../../diagrams/5/db24daabf7d2c0c00cfd64afbdd9ba17.png)
![[Diagram]](../../diagrams/30/3c928cb5dc4c74ee81e28ab2abd67e82.png)
![[Diagram]](../../diagrams/8/f804ccaf5d92a975216c17234ece7039.png)
![[Diagram]](../../diagrams/52/c6894ef02647e2c2068d0849c4620b88.png)
![[Diagram]](../../diagrams/3/16d86c22f4f0499ed4e78dd8053bb137.png)
![[Diagram]](../../diagrams/17/efe759d7daf8d157ff606081ec5fcba4.png)
![[Diagram]](../../diagrams/7/385b2245d4cb8c9fce39450e5fc8e769.png)
![[Diagram]](../../diagrams/24/7fb3bda45d27e943c5f13cdaaf6993e3.png)
![[Diagram]](../../diagrams/23/8830bef3c9cf7b8f5f5218a8aef1f337.png)
![[Diagram]](../../diagrams/19/99985b70b9c62f2eefca5ea642c4e469.png)
![[Diagram]](../../diagrams/5/74e8d263ffa63239b95103c0c959388f.png)
![[Diagram]](../../diagrams/38/b4b7e692f4864612040398613e1982ce.png)
![[Diagram]](../../diagrams/47/c2ad51b9777eed489753593f7610ca7a.png)
![[Diagram]](../../diagrams/38/9e61b21953c90bb0a3a25fa60770eae6.png)
![[Diagram]](../../diagrams/36/eca0ec50a6d209c57dbe7269d0530b8d.png)
![[Diagram]](../../diagrams/52/5708c3ca6323c872c74183be60073f55.png)
![[Diagram]](../../diagrams/49/056e8d5951500ee1848ddfdb95799fae.png)
![[Diagram]](../../diagrams/51/d531945316a978764aa9ea7d5d530aa4.png)
![[Diagram]](../../diagrams/4/29229f2c7ee35f5e767ef79730dff4f6.png)
![[Diagram]](../../diagrams/39/61c366f9b3f06ffa82bbeb5b5904f159.png)
![[Diagram]](../../diagrams/44/e48282141618832ef8af988da89bcf7f.png)
![[Diagram]](../../diagrams/3/33471357648f09d60442126de157fee1.png)
![[Diagram]](../../diagrams/20/bf03d26065bb2d3679ebea8b92b14545.png)
![[Diagram]](../../diagrams/44/420eea0298fab4b4a249163e641d5b0a.png)
![[Diagram]](../../diagrams/28/0fb5e1e0bbdb8b6156c9e572b4628205.png)
![[Diagram]](../../diagrams/25/e3ecc987522efa12317ae0677059c19b.png)
![[Diagram]](../../diagrams/52/be5175dc163c845a618f5b9e703c1d06.png)
![[Diagram]](../../diagrams/10/b158f2ebed16b23cd6c9d816388ed4fb.png)
![[Diagram]](../../diagrams/30/6ac5dd9bbecf38786fcc93ffc06fa358.png)
![[Diagram]](../../diagrams/26/a914a92b1c53cc061b2c994769ee867e.png)
![[Diagram]](../../diagrams/23/c9b941553f0869ef0085b94ea77be40d.png)
![[Diagram]](../../diagrams/13/453a3e3ded7b90a8e4abb736d83acf1b.png)
![[Diagram]](../../diagrams/51/461de875aec1dd1bfdb106c8cc29cf1c.png)
![[Diagram]](../../diagrams/11/196cb19682568953882fe675993b5bd9.png)
![[Diagram]](../../diagrams/38/acb2e031ce6626fcd7f84d49f2bb2967.png)
![[Diagram]](../../diagrams/17/6f343ee10c355590016bce9fe0d8e1bc.png)
![[Diagram]](../../diagrams/0/0bf03209d3f46ba4722e2f8e5339d8f3.png)
![[Diagram]](../../diagrams/11/6487ec5bd413221917a39c460045edf8.png)
![[Diagram]](../../diagrams/52/6ef1291777ac89408d3d13a6f6db6b23.png)
![[Diagram]](../../diagrams/17/78e6c596631762c239fe49debf3dfc89.png)
![[Diagram]](../../diagrams/13/986dc8ef53f000683c9a9bb76f446099.png)
![[Diagram]](../../diagrams/47/50ea5f6586418f490ff7dddefd25f61b.png)
![[Diagram]](../../diagrams/48/27f86ffae9799b6a2f33c7f3cf727fcc.png)
![[Diagram]](../../diagrams/23/9dfa43f39fccd7ab5ddd419a793b64b8.png)
![[Diagram]](../../diagrams/26/5f600299939d193b9f266d03e9fd2516.png)
![[Diagram]](../../diagrams/24/4776567be00a6ad422de3231e4a973e6.png)
![[Diagram]](../../diagrams/14/461da4b56c816183a0a3ffe91bc7521d.png)
![[Diagram]](../../diagrams/31/b2d71e3629e9863a1c577bb114b1e295.png)
![[Diagram]](../../diagrams/27/4178fb086af548522750c6ef6e45961d.png)
![[Diagram]](../../diagrams/25/1c239ef27b1e0b75944926bd3b6e0c83.png)
![[Diagram]](../../diagrams/39/1f23c5ea14069a0e82a7106c15de6fd3.png)
![[Diagram]](../../diagrams/50/3ccb5e6bbb1940e049be4d37db491d99.png)
![[Diagram]](../../diagrams/27/1b6b7524fbdc532115b04fb94e9652a2.png)
![[Diagram]](../../diagrams/3/aec6efdbcfe4c335c185251449313e77.png)
![[Diagram]](../../diagrams/21/feb0be90c90908f20242d5535d544d52.png)
![[Diagram]](../../diagrams/11/56829c3af8b5dff1e72de43399716b86.png)
![[Diagram]](../../diagrams/48/fb1c11dba27dcc1527d16ba169410855.png)
![[Diagram]](../../diagrams/15/39b3d6bc1537a175ed2004058abb604a.png)
![[Diagram]](../../diagrams/11/b3182b5049bccd4fc4ab1c8b78047892.png)
![[Diagram]](../../diagrams/22/8b51752263ce1e4038fa00bc8dd83ee9.png)
![[Diagram]](../../diagrams/18/bece2b3e67a345f271f2ea2e52e2f479.png)
![[Diagram]](../../diagrams/14/7607d7c312f7c7c25e6702c2f16b2cf8.png)
![[Diagram]](../../diagrams/5/17c9a5de3bfe5e8496c6b9cf6605d66b.png)
![[Diagram]](../../diagrams/12/5f9d941f487732fcd6c392955907dbab.png)
![[Diagram]](../../diagrams/19/dc4f637529acd58bc72859535535cd53.png)
![[Diagram]](../../diagrams/2/2e55a0b90dc3b845a0977e764fcedde7.png)
![[Diagram]](../../diagrams/50/993bcfded8fe8c8620aaf25f23a30c34.png)
![[Diagram]](../../diagrams/12/5cc30a00fd1f7155f64c55a5f3de25f9.png)
![[Diagram]](../../diagrams/27/01724d05261f24e04278448bb363fe80.png)
![[Diagram]](../../diagrams/31/6c11569c674368c69fe4046f83461ea1.png)
![[Diagram]](../../diagrams/16/155f337f11e1a9c0978b6dec5ffca3df.png)
![[Diagram]](../../diagrams/24/f7645fa423164fb8271ebd0856d6fd5c.png)
![[Diagram]](../../diagrams/32/def272899addaede88171da65dd426d8.png)
![[Diagram]](../../diagrams/50/f6c319d18e5f9499fb75e856009c57ac.png)
![[Diagram]](../../diagrams/29/c7eabc3ceaf2d9d99c880713412a222c.png)
![[Diagram]](../../diagrams/32/2a8f472309dda21298f8a13ceed09357.png)
![[Diagram]](../../diagrams/3/b9494f383435bcd00f6e3d493ba81cee.png)
![[Diagram]](../../diagrams/51/e0d37550e7785dde61200581edb71a36.png)
![[Diagram]](../../diagrams/1/323fc5672ecbf57037ca3ae013485c2c.png)
![[Diagram]](../../diagrams/51/d0b9e12343c07f69da7ca3e945c7faf6.png)
![[Diagram]](../../diagrams/33/613e574f4ab2cf240a97905851d3cba2.png)
![[Diagram]](../../diagrams/49/42d610cdad75204f25c236aafce1b1a1.png)
![[Diagram]](../../diagrams/30/3fafba346b58b5b27802deff239375ae.png)
![[Diagram]](../../diagrams/18/c35f27c1ef78e8957d33ee2cd30ac664.png)
![[Diagram]](../../diagrams/22/3431f89095e1431bee7db32e93aaf362.png)
![[Diagram]](../../diagrams/27/89c25b9e00532fbf130d4a7394cc7917.png)
![[Diagram]](../../diagrams/22/37da1ccb40df8ae00517eb68af825c67.png)
![[Diagram]](../../diagrams/26/f07d1779baeb739979b23a54f60ab8e7.png)
![[Diagram]](../../diagrams/47/491df5a67e415df9f564973e8823bf80.png)
![[Diagram]](../../diagrams/32/407903c994ce413df7365ae29f227d25.png)
![[Diagram]](../../diagrams/9/cb48d4b73054b66787f9edf0d26d5f7a.png)
![[Diagram]](../../diagrams/38/237621d1cdb69aa9907d008d8b9a9ddb.png)
![[Diagram]](../../diagrams/16/f33888947b89e6ab66d0c02397751192.png)
![[Diagram]](../../diagrams/22/97851b605add43966009cf39aa033ce9.png)
![[Diagram]](../../diagrams/7/c3bb53961f22ff4c5f4b585e55ade1b8.png)
![[Diagram]](../../diagrams/25/4e1e043f8572d4ad251ab89999df267d.png)
![[Diagram]](../../diagrams/3/73a6e0fdd6226fe3a29d02eb1bb724c7.png)
![[Diagram]](../../diagrams/20/06bf45cd7e57ab8fb7637f1a195e7a40.png)
![[Diagram]](../../diagrams/9/64661041ef12558ca99f59eef7a07c77.png)
![[Diagram]](../../diagrams/31/63a430d27226c181adc070ef86a058f2.png)
![[Diagram]](../../diagrams/6/ee04aac569168e1ecc96733b7e08ea55.png)
![[Diagram]](../../diagrams/26/2ef913253e1235901ad6ff5c66b7c820.png)
![[Diagram]](../../diagrams/20/773ad9382f64c3ccf4736bcbea1838c6.png)
![[Diagram]](../../diagrams/45/e7e4ff47d03e7eac955a2484c7a0c2cb.png)
![[Diagram]](../../diagrams/40/18de5535b38eabf422287c9bff812c33.png)
![[Diagram]](../../diagrams/24/94d87763e995332745d559040ae8c49c.png)
![[Diagram]](../../diagrams/11/563f0e1648b1da07c7f7c315c33db9f9.png)
![[Diagram]](../../diagrams/51/4c0e087ecfd4d4edef0eaea90e09c93f.png)
![[Diagram]](../../diagrams/28/971d71df910c01bc7dd91fdff5242c2a.png)
![[Diagram]](../../diagrams/20/09df01e0fb1f9f8cb91d7e367a872e8e.png)
![[Diagram]](../../diagrams/46/05df7fbe8f97d57fdd397a8ecb5beb54.png)
![[Diagram]](../../diagrams/38/1b8ae55f87d5c0cddb42d491ceb83ac6.png)
![[Diagram]](../../diagrams/14/83fa6fd6c666cfe62d827266f0c3512a.png)
![[Diagram]](../../diagrams/50/f2ab376e423e4265e6f21b5eda74d5e3.png)
![[Diagram]](../../diagrams/43/7695f0ca3fe5fa37739da4856c7054da.png)
![[Diagram]](../../diagrams/5/de700ac1c2b9600f54c71b9bc747f418.png)
![[Diagram]](../../diagrams/28/f393af22c7cd18fc7999a6ceee5ce8c0.png)
![[Diagram]](../../diagrams/22/18c303867d5bb723e1bbac297a514217.png)
![[Diagram]](../../diagrams/32/46d1f5f662a38d3725b0e3cf237aaa86.png)
![[Diagram]](../../diagrams/44/de83b70709485a8e0b97b1e1f70fd826.png)
![[Diagram]](../../diagrams/36/9a3c8a2e108f0d5ae6783cb6d0679fc1.png)
![[Diagram]](../../diagrams/30/f3f013db7db7330b050f26a0731b64a2.png)
![[Diagram]](../../diagrams/28/402b490559c91239c6d8f21c07ea60e7.png)
![[Diagram]](../../diagrams/34/35d1ca55a07fed87436b236082e7fed7.png)
![[Diagram]](../../diagrams/10/5e124bb2a917fd09ccd70d6ffea44d5f.png)
![[Diagram]](../../diagrams/44/cf9d7fe3a959f44ba74eb32a8eeb658c.png)
![[Diagram]](../../diagrams/51/04f4ac0a9acd6e52139479b07357590f.png)
![[Diagram]](../../diagrams/5/8e933e4d5c711cd15d64aa2bdabe81b9.png)
![[Diagram]](../../diagrams/35/07265b08ae6a58659e43b8e766891bb2.png)
![[Diagram]](../../diagrams/24/93ce95eee1bc4307f04aa41c346145bd.png)
![[Diagram]](../../diagrams/34/9ba23cc50eb6c80197848499d279c063.png)
![[Diagram]](../../diagrams/21/9c499bf7622c9adf6232922704977363.png)
![[Diagram]](../../diagrams/38/e1170fd0133151bd16888c3b8ffe72b7.png)
![[Diagram]](../../diagrams/50/fd6c7936844c276a6a246fbc69ce2cd3.png)
![[Diagram]](../../diagrams/24/9c56b3bca77f9e2c6715deb49119527b.png)
![[Diagram]](../../diagrams/33/8456483df50aa861d725f0f1e9aa3161.png)
![[Diagram]](../../diagrams/32/99957755782e4c1a93d730d56049b68e.png)
![[Diagram]](../../diagrams/26/4678302cb13209bbff1bd5b8c128b332.png)
![[Diagram]](../../diagrams/36/4fb26af1ff5c2f8e773941ad2f8cfb6c.png)
![[Diagram]](../../diagrams/31/64005b46392738803bf2e2457247d12c.png)
![[Diagram]](../../diagrams/5/757934d095b33d8c38a38ff34168d816.png)
![[Diagram]](../../diagrams/11/c5fa511c10f09eae4f0087d0f67c4d81.png)
![[Diagram]](../../diagrams/49/c2d43367c804a4a29cc647d55ca00458.png)
![[Diagram]](../../diagrams/50/0f7de247bbfbf20ea409267072afe733.png)
![[Diagram]](../../diagrams/28/7c7571a0dff077f9c4fb7a7ef9782274.png)
![[Diagram]](../../diagrams/19/9bda0f82e8e69279d0d2095fbdaba4bc.png)
![[Diagram]](../../diagrams/41/c0ceb141459b7c4167e147779375120f.png)
![[Diagram]](../../diagrams/20/97455e66b925ccebb08df3c6ec7484f1.png)
![[Diagram]](../../diagrams/33/77cbadce25b0f9a2fc616067ebeba73a.png)
![[Diagram]](../../diagrams/24/07f0ea0553b35452370294caa8cdeda4.png)
![[Diagram]](../../diagrams/37/57662ce64315e3bd2eef7f4b49da6e1e.png)
![[Diagram]](../../diagrams/36/46eb981123f5b9a89b8201f29c83672e.png)
![[Diagram]](../../diagrams/5/b1250050fe49f97c89a8b6bd5442418b.png)
![[Diagram]](../../diagrams/2/8cad8200f9950378ef87df98bbd72583.png)
![[Diagram]](../../diagrams/21/cc556b24e42304032adb994de71cd3b4.png)
![[Diagram]](../../diagrams/43/e4f7bdb10b3368c8dd48b3b325fbf918.png)
![[Diagram]](../../diagrams/30/1c702aa686298221514575b35664ae7a.png)
![[Diagram]](../../diagrams/12/3a6d90448023c0e297deaa801b448285.png)
![[Diagram]](../../diagrams/29/2abf72bd9e1e78757a2d0d4607c9544f.png)
![[Diagram]](../../diagrams/7/dbcab1245953415126d9c07b6ac1f3df.png)
![[Diagram]](../../diagrams/10/c4b772c5a9f30b55215a7704a25904c2.png)
![[Diagram]](../../diagrams/21/c6755bb12d3d48c1a35e09d53d38c870.png)
![[Diagram]](../../diagrams/41/9e946f086303d94661dcf5a0b654b180.png)
![[Diagram]](../../diagrams/34/4cc15c3cb467e4ed4288d855b2131046.png)
![[Diagram]](../../diagrams/3/0a48e59b130e03b185804e9d56fc2236.png)
![[Diagram]](../../diagrams/29/b368c95f2ecbc2a90f22f125d85479dc.png)
![[Diagram]](../../diagrams/32/604f1477fbb7d2f544d117aa332a4ef3.png)
![[Diagram]](../../diagrams/28/37e7594523ccf118a9f6ef353268494e.png)
![[Diagram]](../../diagrams/6/fc70e92408da7ff0c94159178f3dc1ae.png)
![[Diagram]](../../diagrams/25/d62a7bb728a8f34f25639a26e6e65728.png)
![[Diagram]](../../diagrams/43/402d0c5452f9ca008135fc26cc715860.png)
![[Diagram]](../../diagrams/22/52968db58c817bcaf18b68a548e42fb0.png)
![[Diagram]](../../diagrams/46/272973100dfb149de3fae7bcf12d728d.png)
![[Diagram]](../../diagrams/10/fe95084cd95b4c5bdb977ccf4cd126a1.png)
![[Diagram]](../../diagrams/13/24b096c74847c0dd75c8539f009fb4c9.png)
![[Diagram]](../../diagrams/30/9efe637ea9c70cfd3fefab3eb62bf81a.png)
![[Diagram]](../../diagrams/33/7106a9b26978cdea9f7ba3e7ced96c1f.png)
![[Diagram]](../../diagrams/3/beff6b894b1c9e2d6d8d265ad15ddcc9.png)
![[Diagram]](../../diagrams/19/9aebf14b6d120e6ee5c11d271bb809af.png)
![[Diagram]](../../diagrams/36/e91db1aa32d788d12b70b44c40c46600.png)
![[Diagram]](../../diagrams/45/23d7c8ec6016df6955e2bdde0b5e7b01.png)
![[Diagram]](../../diagrams/18/44b3627cb011c4ee6efe7c091e8d6662.png)
![[Diagram]](../../diagrams/8/35a2be2063ff1afce832dd58fe4c6676.png)
![[Diagram]](../../diagrams/47/f1ff75ded8a42c12a5e09518844d3822.png)
![[Diagram]](../../diagrams/9/4bca8c6407f670c6f131e1c4e84d461f.png)
![[Diagram]](../../diagrams/33/626bea6d10ea95a71c9c6b661145ac6e.png)
![[Diagram]](../../diagrams/15/76d5d70db718dae6176205c092af0864.png)
![[Diagram]](../../diagrams/32/08670a7a1ea8fd30f2de5d88fb888d13.png)
![[Diagram]](../../diagrams/44/5379656caf31e70fc9cd4e8fc1fceacf.png)
![[Diagram]](../../diagrams/8/e6c5739ca595deef91c0fe5c903643e3.png)
![[Diagram]](../../diagrams/25/761895d3b1916bf08526c9030017c954.png)
![[Diagram]](../../diagrams/10/e764b3af6509fa93009d54dec098570b.png)
![[Diagram]](../../diagrams/21/88d85c1d2d8c082ce669c5742ae8ca21.png)
![[Diagram]](../../diagrams/11/51a95465aa764c9816dff09befae7673.png)
![[Diagram]](../../diagrams/26/580eb40aa09268e18e62093fbd44c53e.png)
![[Diagram]](../../diagrams/43/30bf8f7f7bf4edd574e091d652f21e7f.png)
![[Diagram]](../../diagrams/51/65ec1bf4bded26c67a41699d95884609.png)
![[Diagram]](../../diagrams/6/e6e59a8d6a59ac6b9dcf4ceec9d5bf2c.png)
![[Diagram]](../../diagrams/51/7e46e2bbc951d66ed05deeae02f88e7c.png)
![[Diagram]](../../diagrams/35/15d3b08e6e69e74afd6866a56d052c19.png)
![[Diagram]](../../diagrams/39/8e5817b282c7b3cb627fa9bdcbb5bb86.png)
![[Diagram]](../../diagrams/31/dad9c392707c9211034a4d7e6daefbd8.png)
![[Diagram]](../../diagrams/30/ac9e83f12dbbb92be453ba86195fe002.png)
![[Diagram]](../../diagrams/3/c8e99b90cdf737c0e5b64f23f8fef8ff.png)
![[Diagram]](../../diagrams/48/0ac6c61e8d66436b26c3640eed3ffd5e.png)
![[Diagram]](../../diagrams/3/9ba75395b2d2427024345de751e9df5d.png)
![[Diagram]](../../diagrams/6/8c27d83c39e73170b4dd5072fc8ab31d.png)
![[Diagram]](../../diagrams/25/6c78aefc0604a7670f1aa52c8bdc4565.png)
![[Diagram]](../../diagrams/14/e564af4c39d94f75b892341faf0d41bd.png)
![[Diagram]](../../diagrams/16/0f7b12a42a34d1d129f8e2c52a5a912c.png)
![[Diagram]](../../diagrams/52/2915e313e7cf08d4a8da6b5185991609.png)
![[Diagram]](../../diagrams/21/07eb5f5ca59df14f432da193a5d9a658.png)
![[Diagram]](../../diagrams/14/7881eb4c6a61dffa0f774f1ce4e1cf48.png)
![[Diagram]](../../diagrams/38/aa5b2c281d5946e4e2d5b1d99141fe20.png)
![[Diagram]](../../diagrams/38/143e464572090858e50b2745b53a1f36.png)
![[Diagram]](../../diagrams/27/05838cde4a3cc928329f66db5b4b0214.png)
![[Diagram]](../../diagrams/21/aa4e2f77cb1cbbefed415fc145192ec0.png)
![[Diagram]](../../diagrams/46/c9d8490e3ab12577cb495a4df1026342.png)
![[Diagram]](../../diagrams/46/337e108a920c1aa9c21d1b7f9c8436a7.png)
![[Diagram]](../../diagrams/39/56a764a45fd18cf64fe43e6630e82a88.png)
![[Diagram]](../../diagrams/3/79571f871a479b4ab522aa462b0f172b.png)
![[Diagram]](../../diagrams/13/4ef0359a7b4e6e9899809c57ed328cb5.png)
![[Diagram]](../../diagrams/40/cdf898072891cab338a61a6090347d1f.png)
![[Diagram]](../../diagrams/30/e82e50de63bdd974f18bf1ae623744e3.png)
![[Diagram]](../../diagrams/7/9f8916cac726e2186ebbd4db2716308c.png)
![[Diagram]](../../diagrams/22/a44ee22dd0750db42a0ce586e3c7362d.png)
![[Diagram]](../../diagrams/8/8f5159abe080e4d19ef2f62f9f1427c5.png)
![[Diagram]](../../diagrams/7/7266f804b95e323c83a62ab9dbd7158a.png)
![[Diagram]](../../diagrams/16/554477e59d4efee6c0a6f50542198236.png)
![[Diagram]](../../diagrams/45/8bf7e1e385459b606e315be79a87a2d4.png)
![[Diagram]](../../diagrams/29/6bf4d0aa02ccff721af5ffb7deb64b7e.png)
![[Diagram]](../../diagrams/44/aed713e6d990d6ccd3308b75937f18c2.png)
![[Diagram]](../../diagrams/5/d11a7742ea20d7d66483feff7868fe59.png)
![[Diagram]](../../diagrams/40/cbf42dee926c37c464165ff20cd90b33.png)
![[Diagram]](../../diagrams/0/3870fcacbfe533cc3888bd46b3cec2f8.png)
![[Diagram]](../../diagrams/17/e26115c0a673a8bc58e704099283d7e0.png)
![[Diagram]](../../diagrams/16/0efa157266d8f80145ea93950c1bb75a.png)
![[Diagram]](../../diagrams/25/05bbab4d40aa39537bcc251aabe059da.png)
![[Diagram]](../../diagrams/32/68304e7c745498df526425911b55e7c6.png)
![[Diagram]](../../diagrams/48/5717f2faf88042e51e03325c6a7f1243.png)
![[Diagram]](../../diagrams/8/ba6dad12e68b11c2702b578bb1b82b90.png)
![[Diagram]](../../diagrams/46/ae02ec0dfb9693066e803a9329ea093f.png)
![[Diagram]](../../diagrams/24/ce3eb1837478ca96cc0f62f2623fa0bb.png)
![[Diagram]](../../diagrams/23/99a68bae5005b5bb2a51a2c02028ec35.png)
![[Diagram]](../../diagrams/24/65ecefe92a753d51999163bae57dea3d.png)
![[Diagram]](../../diagrams/17/4407855d267bfdb9229e43d064bb5ca4.png)
![[Diagram]](../../diagrams/22/50b58f1b14465e6661688f2c18c2656c.png)
![[Diagram]](../../diagrams/40/e9be8073e0f17a21e54161006912aa4a.png)
![[Diagram]](../../diagrams/37/d998e4f60e19b95810ec56d584cc1bd3.png)
![[Diagram]](../../diagrams/39/c6f825c9a2f30b172a141b196d568bd8.png)
![[Diagram]](../../diagrams/45/0e5194083605b95b7b9f621ba3d73838.png)
![[Diagram]](../../diagrams/10/2a57e9961db2c337e56f8de398c19dc1.png)
![[Diagram]](../../diagrams/15/d434c3a6ec958ba794ce7ebe17f765a0.png)
![[Diagram]](../../diagrams/28/bc625ba6fecb551d13260eeabe201fc2.png)
![[Diagram]](../../diagrams/48/bec4a3a99c1f211a7031b4445adb4f54.png)
![[Diagram]](../../diagrams/8/36c54d76f5c4c1c650df8a2d8afea41f.png)
![[Diagram]](../../diagrams/40/17795ab2cf46a601b81fcd9484908c2a.png)
![[Diagram]](../../diagrams/32/5b3f41595c1328f939e292097b46ffc6.png)
![[Diagram]](../../diagrams/35/5dcc7537e34e404760de04d233e17a07.png)
![[Diagram]](../../diagrams/16/cbb966dc2b75c462e5f47a018c14e225.png)
![[Diagram]](../../diagrams/31/18e586c4fdeee7fa021790c4198759d2.png)
![[Diagram]](../../diagrams/9/7418deee84ff50bf30b51af70a53afb0.png)
![[Diagram]](../../diagrams/38/4c8c3a3d6a0e78e4971abc884b8f8b6f.png)
![[Diagram]](../../diagrams/39/bb14a39ddbf8a1d47ae29b833465747c.png)
![[Diagram]](../../diagrams/42/19d9d777013395386f2cbbe084a7259f.png)
![[Diagram]](../../diagrams/38/867682116b4e11ac6a1afeba4f01ccac.png)
![[Diagram]](../../diagrams/19/0a2098167c61405fea21230b88109b89.png)
![[Diagram]](../../diagrams/51/fb6e1b0264d2c8cad759e94a0c990674.png)
![[Diagram]](../../diagrams/38/d39e11399a5d656fcff01ff0e17e0cf1.png)
![[Diagram]](../../diagrams/21/205b3309424d26543238b23b07612491.png)
![[Diagram]](../../diagrams/21/a73a5f0cb0908e1cd7d343762960a612.png)
![[Diagram]](../../diagrams/21/652e651b5185128cecf020486e83004b.png)
![[Diagram]](../../diagrams/12/88e718dfbfa2364edb5f065bae825a70.png)
![[Diagram]](../../diagrams/7/86438bd27960b0e7690b78fff07bcd23.png)
![[Diagram]](../../diagrams/45/1200ba7b4aeb9d8c11bf25690a9accfc.png)
![[Diagram]](../../diagrams/9/9f75b7ee310b9ad714fa043ef54b18af.png)
![[Diagram]](../../diagrams/21/700b9f325502c3cba23fac7732469324.png)
![[Diagram]](../../diagrams/46/2c1b38b9314a8cb7207d65ad97d84360.png)
![[Diagram]](../../diagrams/12/553688e72e61dc67879f3b8a307f76bd.png)
![[Diagram]](../../diagrams/32/296016247680a9804840e8b6cc66cc15.png)
![[Diagram]](../../diagrams/10/7fef44bcca44fb7c71344c49416f7d36.png)
![[Diagram]](../../diagrams/26/7f8e1bc95675aaf6937457e296b7912f.png)
![[Diagram]](../../diagrams/52/59113078bf4150f23cc4de7e3bd5f81d.png)
![[Diagram]](../../diagrams/20/4b438fb68f426846ce7fe63b19e5bb91.png)
![[Diagram]](../../diagrams/31/523dd502cf6d1333dfaf4b7a85b6df83.png)
![[Diagram]](../../diagrams/37/0a564fefd6e8f8673f73a3a9972a3aad.png)
![[Diagram]](../../diagrams/32/b85868e7cc2fad5bf994772fce0dcbf8.png)
![[Diagram]](../../diagrams/6/1f3d987cf656448822c108508b3c4a51.png)
![[Diagram]](../../diagrams/47/2254b1f0ffd23097628f224807b33a58.png)
![[Diagram]](../../diagrams/16/38510fed933b0e2b632562487f16ac4d.png)
![[Diagram]](../../diagrams/11/888ab36a9c0d04b936a14395d44ea747.png)
![[Diagram]](../../diagrams/10/4b6cc0a37a584ee2fca7f32f2612f21d.png)
![[Diagram]](../../diagrams/13/49c17dde918f99df77ea8932ed704d38.png)
![[Diagram]](../../diagrams/20/74623ec435c1f832e46e73492a6e4400.png)
![[Diagram]](../../diagrams/16/7f2ada8a59c964f6e93b817a45bd0fed.png)
![[Diagram]](../../diagrams/49/bdaab3632457c92b24bb1ea1c7046c6f.png)
![[Diagram]](../../diagrams/49/85065539e32798608b499fd5c1010438.png)
![[Diagram]](../../diagrams/42/5f3019614eb5a6d5929f7e28555dc115.png)
![[Diagram]](../../diagrams/16/05b79a58e85614e5575db60828a9e9fd.png)
![[Diagram]](../../diagrams/51/d1643619255b1c1fbb7576cb4c99863c.png)
![[Diagram]](../../diagrams/25/be642208534e128c6c3a5e05bf37781b.png)
![[Diagram]](../../diagrams/3/03bae7afa13f3b5536e3e9debb7cfed0.png)
![[Diagram]](../../diagrams/25/415a0af4416983e750ea9e6b2a6e8d57.png)
![[Diagram]](../../diagrams/52/d2532ca6dd9521de7d4d9cfa05e6a469.png)
![[Diagram]](../../diagrams/0/58ec099efe58cb2bd816dcf28058dacf.png)
![[Diagram]](../../diagrams/27/9eaefd59c0d6e3e339c61057b1c9b959.png)
![[Diagram]](../../diagrams/31/abfe4e02a85a3c26366aeec985abf6b5.png)
![[Diagram]](../../diagrams/17/0de468746136fee29e3c192732ca9392.png)
![[Diagram]](../../diagrams/27/83b5686e2e18d1a01fc5918b0f52a0be.png)
![[Diagram]](../../diagrams/34/6f0a18572e98f3d030a766c286e8c443.png)
![[Diagram]](../../diagrams/35/92bac04150f86f3ead59c9af7f397fa4.png)
![[Diagram]](../../diagrams/25/16ef3c453e83942d5d5fbb33a664b76c.png)
![[Diagram]](../../diagrams/39/3422badf415516d1c94d321041d41df5.png)
![[Diagram]](../../diagrams/47/4148e9d81b0737708a1e93516a868608.png)
![[Diagram]](../../diagrams/31/7e99b02cc4af3d57632e0c5e336c39bf.png)
![[Diagram]](../../diagrams/23/b72ab36c4e9bba17bb366f8d16fd200f.png)
![[Diagram]](../../diagrams/35/4ac20272c3e5402dec2ce68689581f1f.png)
![[Diagram]](../../diagrams/30/5b92a3b3ad8c42f0b4af05c4360db866.png)
![[Diagram]](../../diagrams/49/a622cd40079086de45553e99f6a58714.png)
![[Diagram]](../../diagrams/50/bc813a5869964be07f0af3e1c6ee3a59.png)
![[Diagram]](../../diagrams/20/83d17e520137db1ad506b02640117bbb.png)
![[Diagram]](../../diagrams/18/9dec3239e4116b4355a002864b39613e.png)
![[Diagram]](../../diagrams/39/33b5f3b3bf2da148eafea7dfe48f5f2b.png)
![[Diagram]](../../diagrams/4/e4e9d36abff0969ec42b9ed29f81b2ef.png)
![[Diagram]](../../diagrams/8/06a9fccb58dbaa4e48266cbb0e3ffa4a.png)
![[Diagram]](../../diagrams/52/f8859c04f64553b39601789826b794ef.png)
![[Diagram]](../../diagrams/5/a59c489431cf5a50ff63c38d3356e6bd.png)
![[Diagram]](../../diagrams/33/34f9ee4798fe834ab6f711b37922c0c6.png)
![[Diagram]](../../diagrams/29/6f78e6086120ee47835e5e674b5f71df.png)
![[Diagram]](../../diagrams/10/292530046beaf2f21817a16b1105eeb8.png)
![[Diagram]](../../diagrams/41/bad03a0c663fd14039ad09a1c8e2bccf.png)
![[Diagram]](../../diagrams/13/cceefbb25b88d3526cf1f7e861494d13.png)
![[Diagram]](../../diagrams/7/d756d108c3027c7b5fab5d473d1418e8.png)
![[Diagram]](../../diagrams/45/256d3bac9f853d2dd0bc07ae14ed59e4.png)
![[Diagram]](../../diagrams/29/ab3ad0f950d6251545afc2ddee5880d0.png)
![[Diagram]](../../diagrams/21/e003a6637a5b2cf14f4873edb5154564.png)
![[Diagram]](../../diagrams/11/c7bc3eb67706cb51eb71d2d7d26dba45.png)
![[Diagram]](../../diagrams/48/08c1893513d2cd7527b0716b83d14d27.png)
![[Diagram]](../../diagrams/40/056199141b415f8b65aea28a73f68910.png)
![[Diagram]](../../diagrams/32/69b9d99674860d84c7da64a727fb726b.png)
![[Diagram]](../../diagrams/32/ae407f14cbeff4d1a37b3291b002f5ac.png)
![[Diagram]](../../diagrams/42/c52403dc10cc036e5a6def0ea988f223.png)
![[Diagram]](../../diagrams/36/89e1441f79b09160f25cf9b50426a720.png)
![[Diagram]](../../diagrams/37/722e46e26753206f185947840d271d65.png)
![[Diagram]](../../diagrams/19/40c446c6396cca381fbc48573cc73713.png)
![[Diagram]](../../diagrams/14/932ec1924ece3b6167de23c094a855c2.png)
![[Diagram]](../../diagrams/49/fd81c9162c37370bd65760cc0d18c4ef.png)
![[Diagram]](../../diagrams/21/b6e40bc1e035ec777c3d5e0591c9f866.png)
![[Diagram]](../../diagrams/17/0c97f75a6ef26fec424afa0ebc1e1422.png)
![[Diagram]](../../diagrams/18/b2799b892e1d78cc69fab8135d212d9f.png)
![[Diagram]](../../diagrams/28/731e46c29a41eb43c77fb78a9b7cfe49.png)
![[Diagram]](../../diagrams/38/7dc6afbe9ce8884e4f00cc810c229c28.png)
![[Diagram]](../../diagrams/24/ff6e9e20d284409c58c17d0a3a958711.png)
![[Diagram]](../../diagrams/41/1bb42a877d004f60f05a5fc3686b0c3e.png)
![[Diagram]](../../diagrams/30/8ae7a948215c76f955e3665d4324b67f.png)
![[Diagram]](../../diagrams/23/e8a75582e193e96c9f939e5b3c12ec22.png)
![[Diagram]](../../diagrams/25/0d631c4e7a743f699c6178d956cae4f8.png)
![[Diagram]](../../diagrams/21/4b9ce5263465202b1d37bb36ed48b0e9.png)
![[Diagram]](../../diagrams/32/42bd9e56c486e8d8ef536ddc777528e1.png)
![[Diagram]](../../diagrams/6/566af8b9d2d5f4c82224907c87f8862c.png)
![[Diagram]](../../diagrams/12/9fce92ce9f09ec5b7fdd4022ffd9da8e.png)
![[Diagram]](../../diagrams/30/32acbaa8353b84de15e025fc03092cd1.png)
![[Diagram]](../../diagrams/21/3de61cda309ca4e8574dd6c0f9ab0e63.png)
![[Diagram]](../../diagrams/30/f7b35b2f2d188b8d944062343e92e7ef.png)
![[Diagram]](../../diagrams/8/e47c41eac17dc9b6849700e043b1eeea.png)
![[Diagram]](../../diagrams/24/b32d2175d7df5d8c359d73200605c6f7.png)
![[Diagram]](../../diagrams/23/916f2a0476bcbdd6d5284385a98b2e1e.png)
![[Diagram]](../../diagrams/44/58d03f6d4c8de4b023e0282b79cbf7aa.png)
![[Diagram]](../../diagrams/29/8b77fb9d36a6ea2475a4b9ed939386c8.png)
![[Diagram]](../../diagrams/3/c0b24b6b7d33993b8c45af854275026b.png)
![[Diagram]](../../diagrams/1/7ec6b2fc44bdf68e645138504be76805.png)
![[Diagram]](../../diagrams/0/abb658b44f06be77307c55525983215f.png)
![[Diagram]](../../diagrams/29/9880763b03e56b6d573637865fcd4793.png)
![[Diagram]](../../diagrams/28/124cbf1d49bba7fc71051b67f11f63a2.png)
![[Diagram]](../../diagrams/23/700831bbe32b76477b76bfdce2a0dd1b.png)
![[Diagram]](../../diagrams/46/0e78964f1eb7460b240d84c8584474e7.png)
![[Diagram]](../../diagrams/7/9ad1296fe2fbd7d05024e49af6be53cd.png)
![[Diagram]](../../diagrams/1/be3fecf2def3cc410178383a605c0114.png)
![[Diagram]](../../diagrams/2/a9935be22e35853d12dbf0462b080a1f.png)
![[Diagram]](../../diagrams/17/7f7a5a20484190ad2ee8216dc49c6090.png)
![[Diagram]](../../diagrams/6/13455a87658f646cfa6b759a17faa23f.png)
![[Diagram]](../../diagrams/15/0aa60c9a1d82f6970fb8162edc5c20d8.png)
![[Diagram]](../../diagrams/23/fbc1ba46c83646df8ef92cb544e903db.png)
![[Diagram]](../../diagrams/52/63b04ba74911badd99e097b1fe220693.png)
![[Diagram]](../../diagrams/33/4e94f41b1ba892cd386b679b974aafe9.png)
![[Diagram]](../../diagrams/15/48e0e1f9386a39569d85ec03139bc190.png)
![[Diagram]](../../diagrams/33/13daee43579cc454fe456afec5f841af.png)
![[Diagram]](../../diagrams/18/6bb277517c93df97bc2c3ffc0df63574.png)
![[Diagram]](../../diagrams/34/6c68e466ff37562c84b490a3721470a7.png)
![[Diagram]](../../diagrams/16/aa3fedf2364f74a4c712799e528c15e6.png)
![[Diagram]](../../diagrams/39/1cf814c619586e7615f1848bb6a52bd6.png)
![[Diagram]](../../diagrams/4/dbd174fece82f731fbd8d2f889f29b52.png)
![[Diagram]](../../diagrams/46/9adc31e5aff0156565f3f7983882d48d.png)
![[Diagram]](../../diagrams/15/c3fe37b467f4dedb9bc4a7ef8d9ff498.png)
![[Diagram]](../../diagrams/28/1cb735e4dfe9f6c8e0ce9dc99c07e8fb.png)
![[Diagram]](../../diagrams/38/44d51eaaf10559c41df6cc8b9efe7a2e.png)
![[Diagram]](../../diagrams/48/7fef16ddf976d04cc268cf204ae3c85a.png)
![[Diagram]](../../diagrams/26/87f3c9fe8ace94664eff8d37881a40c2.png)
![[Diagram]](../../diagrams/22/983d372020877af3d09247f54589c6c6.png)
![[Diagram]](../../diagrams/17/62e63dd15437d62bbc2047d532b4163b.png)
![[Diagram]](../../diagrams/29/da3b10de774b8479592ec9950a15357e.png)
![[Diagram]](../../diagrams/14/956300ec76c0b90afb3136de1e1f0cf9.png)
![[Diagram]](../../diagrams/44/dbdcf4739209e8258c49c446c9437404.png)
![[Diagram]](../../diagrams/21/8f59e8363d93e8b2b1665aa1a58dfff6.png)
![[Diagram]](../../diagrams/34/0a489c182a38024e1ee3b325a8c451bd.png)
![[Diagram]](../../diagrams/26/bed848cdca9f69e6503a4d94de268dd0.png)
![[Diagram]](../../diagrams/22/5805d837fc58ec56e245a07adad7e4e5.png)
![[Diagram]](../../diagrams/3/0ba5c2c3fca4a6cdead54ea59c727f57.png)
![[Diagram]](../../diagrams/44/8ed4c7893c474382f23ea0986181073d.png)
![[Diagram]](../../diagrams/35/d37f2ee76629a9c9e14abc424d67db63.png)
![[Diagram]](../../diagrams/40/936ae631bc361cc0b45903d14f0d9b1b.png)
![[Diagram]](../../diagrams/21/2f2d3feb7c97a5b5006d23ace8b7dae3.png)
![[Diagram]](../../diagrams/35/28274713497a1b5f4a0c122a42a61557.png)
![[Diagram]](../../diagrams/35/b4780c50b0c72654e09a83cad94233b0.png)
![[Diagram]](../../diagrams/26/0f7686762be11645e327b6bc837ba47a.png)
![[Diagram]](../../diagrams/32/dce44f31a5a701e2b84bdf448536bfa6.png)
![[Diagram]](../../diagrams/33/c6df97c0fb3d1945081205c10ae6a89b.png)
![[Diagram]](../../diagrams/45/025f025cff758f3c2f8f9473c7c746fd.png)
![[Diagram]](../../diagrams/12/5f51efa0fc68b550240774af99c1bbab.png)
![[Diagram]](../../diagrams/37/a540286f2ee17099f4bcb8a809aaf530.png)
![[Diagram]](../../diagrams/13/42f57592d6b40cfb8c7e66f3dde5eb94.png)
![[Diagram]](../../diagrams/21/4d110e33a888143ce5b4af2e87510f33.png)
![[Diagram]](../../diagrams/17/76ea6164c88dbaea91797d635f119f77.png)
![[Diagram]](../../diagrams/10/2b16ff488bb732a210d92518b9878986.png)
![[Diagram]](../../diagrams/1/b037c305a02900e26b447dba636538b5.png)
![[Diagram]](../../diagrams/20/0a77aedb46d7c747cb88d8668122da79.png)
![[Diagram]](../../diagrams/42/6c0d9c1620dc05ddb8b676fd29adb275.png)
![[Diagram]](../../diagrams/14/44bda393a97999b768a825773528ad0b.png)
![[Diagram]](../../diagrams/12/1c904777ab85176a2216ae91b29a51bb.png)
![[Diagram]](../../diagrams/24/8eb327c930dee0dbaa223f541292ffca.png)
![[Diagram]](../../diagrams/46/24135bf8366a49ead32d743f1b4793a9.png)
![[Diagram]](../../diagrams/16/12414a536a767f62144a0e68e8f5b0af.png)
![[Diagram]](../../diagrams/35/4e0ef28b0044e93f165c86f308615644.png)
![[Diagram]](../../diagrams/5/222b1f0614a06790d8fd8eb057c486c5.png)
![[Diagram]](../../diagrams/49/d8b26cb8644100a3d4677cf86fcb4dbf.png)
![[Diagram]](../../diagrams/45/913467bfee9d6763b748ce5b67c3efbf.png)
![[Diagram]](../../diagrams/7/a4dea5aee12e8ef93d2fc0344e19af3b.png)
![[Diagram]](../../diagrams/18/ba667d7293c686ba33549816b9b43bbb.png)
![[Diagram]](../../diagrams/29/ecf075adc0214f85e6634d7e392a8963.png)
![[Diagram]](../../diagrams/12/8c2b91d1216f2f4495f1fa5ba6810865.png)
![[Diagram]](../../diagrams/12/26c8e5b3103f2d39f292d0ff96da3ae8.png)
![[Diagram]](../../diagrams/2/4c28b5c3b99ae0ac3cb3a5357fc96168.png)
![[Diagram]](../../diagrams/50/7a196797fd558b0300fe55ed832b30c2.png)
![[Diagram]](../../diagrams/50/7e6d86e56f4da5c87a27fef101dee337.png)
![[Diagram]](../../diagrams/52/68809b2b88c453621ba496ca4856cecc.png)
![[Diagram]](../../diagrams/7/f6694d3d540e8caaf5a49a37547f795b.png)
![[Diagram]](../../diagrams/15/ad15a56af969c2af612f8abef2c710fe.png)
![[Diagram]](../../diagrams/15/d0d1e05f02f9c67df6186f0ad0ba3172.png)
![[Diagram]](../../diagrams/35/236b8e07d6df4812bcb432aa2ddc04cd.png)
![[Diagram]](../../diagrams/45/b22d29f91911e64ccd8e4a94f00ecd7d.png)
![[Diagram]](../../diagrams/28/99a2c1e612abfb7dd7569f52f9f572af.png)
![[Diagram]](../../diagrams/20/2c87e50ced05551bf483d02277adeb8e.png)
![[Diagram]](../../diagrams/37/08572721d032bcaed2c3c33ed6e893d2.png)
![[Diagram]](../../diagrams/33/d9957722c9bb2d9f2405244e726436e9.png)
![[Diagram]](../../diagrams/11/9bff91c7ce542e8242a57742c8d3b75b.png)
![[Diagram]](../../diagrams/10/610b33d0d96b616882c85febba09cc68.png)
![[Diagram]](../../diagrams/15/0c13b7c5b0a3676d03155849e3a64b4d.png)
![[Diagram]](../../diagrams/31/209c695b4bbe63c35665c7f17588af36.png)
![[Diagram]](../../diagrams/36/0f29b109dc3fb2ad8463c7ecfbb29b56.png)
![[Diagram]](../../diagrams/6/e3afbed07bfdece0b9d6ce7af0bb2da8.png)
![[Diagram]](../../diagrams/49/69f2dedb3e2dc78ab99d90269d2ac264.png)
![[Diagram]](../../diagrams/4/9c8e7cf7988e4c0c15de9ada661166ef.png)
![[Diagram]](../../diagrams/48/e27a0b85c47ae132dde4559cf57116c4.png)
![[Diagram]](../../diagrams/41/45a1594e8068ee4878d2c39eb4e2c355.png)
![[Diagram]](../../diagrams/20/bb63be0c1d171fd7a93ef6c036badfbe.png)
![[Diagram]](../../diagrams/42/866794cd02810a7a12a139106b89259b.png)
![[Diagram]](../../diagrams/30/4564cbd60a0620921120cd2cfe976960.png)
![[Diagram]](../../diagrams/40/d49aefcbfe1d28ca5db7a2e2001819d9.png)
![[Diagram]](../../diagrams/52/aeae6f4da28bd2fc92a02b27d66a45aa.png)
![[Diagram]](../../diagrams/6/d05045457618ea7c21ea3df349b58676.png)
![[Diagram]](../../diagrams/25/6eb002bdf7bad9cfc8a145b46d94284c.png)
![[Diagram]](../../diagrams/37/bc6945d0e3c1947a75daf668f7539711.png)
![[Diagram]](../../diagrams/12/f19225e677996f04aafd17426cb76dd3.png)
![[Diagram]](../../diagrams/27/3b4198dd85a25a335d0dde1dd702b0ce.png)
![[Diagram]](../../diagrams/10/211a0cced984f11908e1dc2034c54659.png)
![[Diagram]](../../diagrams/51/215eddba0225df9db9fd7bb7fc50dd95.png)
![[Diagram]](../../diagrams/7/18356fdcc4cf35c6112a59dae7113065.png)
![[Diagram]](../../diagrams/9/11f6562f41f81ca217d785ac368b33f4.png)
![[Diagram]](../../diagrams/42/241f912bd649a179aca9f64391dd79c9.png)
![[Diagram]](../../diagrams/25/769162bb2664319bb74ab112c04b3ec6.png)
![[Diagram]](../../diagrams/13/4fea2ca8eccdb55f6f1ba3b1d1fc9cfa.png)
![[Diagram]](../../diagrams/4/da47893333dfd7abb427d9c18c24fae6.png)
![[Diagram]](../../diagrams/52/8ce09b3c4d07ed959d1c89a164d84888.png)
![[Diagram]](../../diagrams/51/f60563066bc40b900d1a8e0bbdf43802.png)
![[Diagram]](../../diagrams/31/10cc70873994e8ef92efe7fb11172aa9.png)
![[Diagram]](../../diagrams/29/a26d8d13ae7823224c2935794a0b819d.png)
![[Diagram]](../../diagrams/12/f303468794d8252be1cfb6515d9b1957.png)
![[Diagram]](../../diagrams/12/90fcf19aa91ad7f9a9e2f67184dd4a23.png)
![[Diagram]](../../diagrams/36/9bd90e1af85022338df6e2faf46a9b5c.png)
![[Diagram]](../../diagrams/22/7371f78b15119abe9beb3bd51645efdc.png)
![[Diagram]](../../diagrams/33/80e292b4e358d673a89870a2bec5184c.png)
![[Diagram]](../../diagrams/34/a72f18d2f22389598f599de37199258a.png)
![[Diagram]](../../diagrams/10/41cbfd57da634706d49a99ad8a952ea3.png)

![[Diagram]](../../diagrams/47/729809b0c2ee9beb259585895afe7678.png)
![[Diagram]](../../diagrams/9/50edd4bf75ed921283ce310c7e113f51.png)
![[Diagram]](../../diagrams/45/81e489a822cb453ea438b17c0f0d1326.png)
![[Diagram]](../../diagrams/18/86dda6904a2056d537ed41b294d3c7cf.png)
![[Diagram]](../../diagrams/35/a0b8fdef8bb5fd77ff62212b54924740.png)
![[Diagram]](../../diagrams/17/6032a8ce63f2b9e8fdf5906c748e21bd.png)
![[Diagram]](../../diagrams/26/aba165720c383256f70800f1f648aae0.png)
![[Diagram]](../../diagrams/32/d54145c66de20f1680d4ad17ade5b7aa.png)
![[Diagram]](../../diagrams/36/e2aad6fd10018fa4bdfe78d70e5b9e1e.png)
![[Diagram]](../../diagrams/14/9302771abbd868260d60a1ebe5911270.png)
![[Diagram]](../../diagrams/23/cfd7b2e13ebf654592b1afecd15cee78.png)
![[Diagram]](../../diagrams/31/b1f37e3dbf7cbaea1fbbd2f1282cb14f.png)
![[Diagram]](../../diagrams/36/c50e5317635764a3f522b2dc1f984e9c.png)
![[Diagram]](../../diagrams/48/5c9a0e2465cc6da92d9feccd644918ee.png)
![[Diagram]](../../diagrams/49/bbc573b0e76f12c6f229c35a49ac326b.png)
![[Diagram]](../../diagrams/29/e21dd3225bc97fe0f3e6e07c440e186c.png)
![[Diagram]](../../diagrams/12/31c57718486aef4afd2da1d3a2c6254c.png)
![[Diagram]](../../diagrams/15/82ccf225c5afa4ffe48f4c45297e0f85.png)
![[Diagram]](../../diagrams/38/bb8fcd95319211671e0c77e4eefb1aa5.png)
![[Diagram]](../../diagrams/15/18cf49eaf92d470a3edb2058ca250dea.png)
![[Diagram]](../../diagrams/34/b2078ce83f2e8409cbfa9f48daab86a4.png)
![[Diagram]](../../diagrams/19/ac26b16bd5dbb8b417220fd1c1c98716.png)
![[Diagram]](../../diagrams/11/33bcfec38c1a73243de835097349f334.png)
![[Diagram]](../../diagrams/16/1f7e2335c7ca7d6339341e2a5d8aa0a2.png)
![[Diagram]](../../diagrams/49/45021c9864531fec8ba44a5d0b61e227.png)
![[Diagram]](../../diagrams/9/8be99075196ebcc973d80fb5e1745c45.png)
![[Diagram]](../../diagrams/14/78a272598b4fedd2b3fcb19c6cf0e511.png)
![[Diagram]](../../diagrams/42/46868247b12dff16ff4cb70e8366a12b.png)
![[Diagram]](../../diagrams/2/948d88a991b68de5e54960ae9a817d22.png)


![[Diagram]](../../diagrams/0/133ad8be7bc1be7d6e84ce4a45d5cbdb.png)
![[Diagram]](../../diagrams/45/c64c0217d5f4d225d678e53aa940b963.png)
![[Diagram]](../../diagrams/2/54c66451d4feffda3a6405c357e94cec.png)
![[Diagram]](../../diagrams/4/e1734ee486b6c6a5caae32794f7d284f.png)
![[Diagram]](../../diagrams/31/5caa52b1526de3c6a86b093f702ae869.png)
![[Diagram]](../../diagrams/15/72bdd88b256c757ae94e61114e71585d.png)
![[Diagram]](../../diagrams/49/58af3b44ba3831c18d788626fddcac9c.png)
![[Diagram]](../../diagrams/15/05724352aac5aedb6bd99cb75fce2d51.png)
![[Diagram]](../../diagrams/46/279008a36bbb5c26f11dbd32f22283d9.png)
![[Diagram]](../../diagrams/41/abc7c3a342e548ffd7c7d6892c22ddde.png)
![[Diagram]](../../diagrams/23/13603f9054616284e01adb744d25bff7.png)
![[Diagram]](../../diagrams/6/507521a599efe2f06ac097b998206117.png)
![[Diagram]](../../diagrams/28/c1ae437b874d13964afeee247c55841f.png)
![[Diagram]](../../diagrams/16/574c3dfcdc6ed4ac444d5fd7374553ce.png)
![[Diagram]](../../diagrams/4/d3a70f728d22ee6bed5e811d8d868b44.png)
![[Diagram]](../../diagrams/40/10632805959f7be1542a313103a216ee.png)
![[Diagram]](../../diagrams/20/968f160edea5b39805c07f3f93fcfc20.png)
![[Diagram]](../../diagrams/17/49d806613731f332da515083f423fabe.png)
![[Diagram]](../../diagrams/16/4a3db63c2601ffb2e470e3eb3d5e5fa5.png)
![[Diagram]](../../diagrams/35/a6151fe1c8ff11078077268037d145a1.png)
![[Diagram]](../../diagrams/17/ff6f12c73a4b5b299a47361e7e514c7f.png)
![[Diagram]](../../diagrams/33/b888e1a560dbb82ad6a1c4fee086e40c.png)
![[Diagram]](../../diagrams/25/cf9aa24fc63f6b33672fec758d74810a.png)
![[Diagram]](../../diagrams/9/0700db4a9007748e80994e187818c47e.png)
![[Diagram]](../../diagrams/47/d9f36dd1e49bd2844165693b1feaeaa2.png)
![[Diagram]](../../diagrams/33/95fb57c0ff42d028500f74428e7b7005.png)
![[Diagram]](../../diagrams/13/633d672145099b69664d134159dc2b19.png)
![[Diagram]](../../diagrams/38/46e330d35c5661870878fea907b3abf8.png)
![[Diagram]](../../diagrams/31/fd79e7baf3f3aa32c19500d60a796c29.png)
![[Diagram]](../../diagrams/22/d280090e828ec29f261cc05ff2fb62be.png)
![[Diagram]](../../diagrams/5/045bdeab2b980d597b815cda70a14fef.png)
![[Diagram]](../../diagrams/51/dbddb4ba0ab42835022cf807254cb8e4.png)
![[Diagram]](../../diagrams/43/9c58279ccc99b5c5e4c65341cf4c6fdd.png)
![[Diagram]](../../diagrams/33/da2cee31e37595058665c79ca67f9755.png)
![[Diagram]](../../diagrams/3/2b5ad04c45cfed1545f5a6278e4ba229.png)
![[Diagram]](../../diagrams/47/758af1fd67c3be8a2e5eb0fecb5dc00b.png)
![[Diagram]](../../diagrams/4/db98bf7be3fad72c7308a529f5b9e7e2.png)
![[Diagram]](../../diagrams/30/13e7d3cbfc4051ec547d9d4d7a7a0d02.png)
![[Diagram]](../../diagrams/15/b758f4aeff88271d376419944dd7eb38.png)
![[Diagram]](../../diagrams/28/f768435381a555c583729dd8922c5da6.png)
![[Diagram]](../../diagrams/28/8116d74939856fa2e393377c0737787a.png)
![[Diagram]](../../diagrams/16/96dfb909d707aadd8a4dbeba8b5d1cc4.png)
![[Diagram]](../../diagrams/50/c9deb8d582a5439056421cd47ea2085e.png)
![[Diagram]](../../diagrams/24/0f79d01d1084e5f10f25cc9a87beceed.png)
![[Diagram]](../../diagrams/32/c9006394f5dd35e18d587a7ec282265a.png)
![[Diagram]](../../diagrams/28/7fbc9c13bb3c5af05b0dd7ed58860078.png)
![[Diagram]](../../diagrams/36/52f26942997d82b193e36a4e5435f9ce.png)
![[Diagram]](../../diagrams/27/d8351bd0575e680541e2120e5d8e70d2.png)
![[Diagram]](../../diagrams/15/c3111709cd13e8eb484200503b970c55.png)
![[Diagram]](../../diagrams/7/b2bf091e5cd9e0516303768cd6a14d07.png)
![[Diagram]](../../diagrams/38/af071df4367ae4246c768c257111ec5b.png)
![[Diagram]](../../diagrams/29/7935ded739318eafe075a82d1547687d.png)
![[Diagram]](../../diagrams/24/f27cae7591c38bfd1ac453b393f5a88c.png)
![[Diagram]](../../diagrams/28/1746e8ee0d678b947d5d1fa34da10fab.png)
![[Diagram]](../../diagrams/42/bd7818796065611e79f9d046f5af505d.png)
![[Diagram]](../../diagrams/41/724320886b774d768d71292aa6265650.png)
![[Diagram]](../../diagrams/13/fd0d31a2e91f1a2b85101b585423abf8.png)
![[Diagram]](../../diagrams/8/315147937aa11ee4e5145f98ddcc9d8b.png)
![[Diagram]](../../diagrams/52/b0828fe2b1fbb2274cf85508d31224c4.png)
![[Diagram]](../../diagrams/43/8559c5acb8bc57974c825aa9b1eb4d94.png)
![[Diagram]](../../diagrams/20/c15e9ecb4e8f40764c91b2e4b31b03a7.png)
![[Diagram]](../../diagrams/22/43088f828abc9f33798bc6c6239e4fc9.png)
![[Diagram]](../../diagrams/27/00310866f89fea8140d94416a77264e7.png)
![[Diagram]](../../diagrams/44/2ca8993a28a7c3b79dd42a3c197bde05.png)
![[Diagram]](../../diagrams/9/374924b1c1f8fffc882a1d3eb9817f35.png)
![[Diagram]](../../diagrams/8/e4000f8a36b714c5696fecf1f8194d6e.png)
![[Diagram]](../../diagrams/1/b93314522203408f170f6af9428c6041.png)
![[Diagram]](../../diagrams/29/cb9323b7b825321e3265f0fd3144d3d7.png)
![[Diagram]](../../diagrams/19/09366128f227bb14b090657fc3026f3b.png)
![[Diagram]](../../diagrams/49/ab957d4ede1c3767a5b4f0611a4dc1f8.png)
![[Diagram]](../../diagrams/42/6931b547c682396cf13e5d24858c3a77.png)
![[Diagram]](../../diagrams/34/9ed7fe1ad5cab0303e22e88559f03216.png)
![[Diagram]](../../diagrams/40/3547a4ae54634cd1af4df6a1cc344c88.png)
![[Diagram]](../../diagrams/18/f24efd9067c66a602abfe40aff81174f.png)
![[Diagram]](../../diagrams/16/0ea58484e23e4c2466da0e82bc22afa8.png)
![[Diagram]](../../diagrams/5/30e77a9c7b82455f9de77a77869be74b.png)
![[Diagram]](../../diagrams/41/11f54a31f36f246fc0ee7d74f51efe45.png)
![[Diagram]](../../diagrams/11/2631c7ebb6139a7c69040b05e6c5fb0d.png)
![[Diagram]](../../diagrams/3/3ddb338dc2d27c2587c76c8f2f7ed967.png)
![[Diagram]](../../diagrams/13/bc005bb99143cbbc27e309ee3608de54.png)
![[Diagram]](../../diagrams/35/0271283997e1582db2cc9d110c96c9d9.png)
![[Diagram]](../../diagrams/41/509d5c7740afbccccf54cbf741561ec2.png)
![[Diagram]](../../diagrams/30/ee7cbac146ef78a4ce40c47fa138923b.png)
![[Diagram]](../../diagrams/3/460c7ac86305eb203d867af904860c9a.png)
![[Diagram]](../../diagrams/39/5676a16d8d4abd7eb424705dae84db04.png)
![[Diagram]](../../diagrams/24/de52a68c418955da56c9b62e60c98e9e.png)
![[Diagram]](../../diagrams/45/32bdc726511176f82dc8fb52d9165e55.png)
![[Diagram]](../../diagrams/40/16599c853a2c6197b7e100b2cd1af772.png)
![[Diagram]](../../diagrams/5/47d54655d70c5b37d164fef312692297.png)
![[Diagram]](../../diagrams/24/3a7c6c23c4e59e7facdac27df4071b12.png)
![[Diagram]](../../diagrams/24/b2f714f61212e40b5ccfd73db35430a0.png)
![[Diagram]](../../diagrams/20/e5605520b102b8c4c6580a7dfc34a2d4.png)
![[Diagram]](../../diagrams/34/d3cbe3f84b8167ccc284e4fd9dd24657.png)
![[Diagram]](../../diagrams/35/8a5655c094a939704ad08d226d20787c.png)
![[Diagram]](../../diagrams/18/2f0ef3ff5f9da850112b6ece22671d18.png)
![[Diagram]](../../diagrams/47/9768af43d6f7c763f5cb0c0ad22ebca4.png)
![[Diagram]](../../diagrams/34/ce12586c57ee70f25a676cc4604a2f06.png)
![[Diagram]](../../diagrams/6/f6c56d923acc7fd0ca4893aca640b96c.png)
![[Diagram]](../../diagrams/28/6edd66d2ed909cd7d39719425c92c952.png)
![[Diagram]](../../diagrams/2/06fc8dd9f105566ba89859ef67217d60.png)
![[Diagram]](../../diagrams/10/663c5db176e0f8af49baab4aa832d746.png)
![[Diagram]](../../diagrams/47/ed115297da09c0a3a5f7b814711b04f4.png)
![[Diagram]](../../diagrams/45/73f03e55a0b855f3cb82bbea2d5c15fb.png)
![[Diagram]](../../diagrams/36/a516fc38b4b59fde26153212bf949e07.png)
![[Diagram]](../../diagrams/6/12c1e35fcf7c828291f6ddb1c21790c0.png)
![[Diagram]](../../diagrams/0/46c91474c60c4a9491717e684212e3f6.png)
![[Diagram]](../../diagrams/19/ffe073f5544848be20b0f2e2f2feb083.png)
![[Diagram]](../../diagrams/41/007637fa089f3f2738a222e088f2e73b.png)
![[Diagram]](../../diagrams/11/dec59864be823299e34d10c86ad3a302.png)
![[Diagram]](../../diagrams/38/b0cff65d9f4d57922c72fa459ca49f5e.png)
![[Diagram]](../../diagrams/24/e5ffff9e50c7a3fc2523a29985c2f3e6.png)
![[Diagram]](../../diagrams/15/1839540b2b6956832676fb29ce967ff8.png)
![[Diagram]](../../diagrams/21/aa4fa888a1dbb514ff80610802b66108.png)
![[Diagram]](../../diagrams/9/6fd3fc5c11d497d62cb3d2b2e929c2fa.png)
![[Diagram]](../../diagrams/51/6e6e50ca9c8b833e39e5e16d6d336915.png)
![[Diagram]](../../diagrams/21/a1f0e516fb17fc68fb0b64a10024856a.png)
![[Diagram]](../../diagrams/51/1131ba2b30b9d12c026b0a32c56453bd.png)
![[Diagram]](../../diagrams/28/857853460bf007523f964b616bca8d1b.png)
![[Diagram]](../../diagrams/46/7e3121c3f7bcfce19128d26bdad7a0a1.png)
![[Diagram]](../../diagrams/28/f9037aff61e875437350aeca82c8bbcf.png)
![[Diagram]](../../diagrams/49/78ab34d72a395f167189aeb3f6bcc17c.png)
![[Diagram]](../../diagrams/3/a3b1a2e02e216d5d70c6d4cd5219d604.png)
![[Diagram]](../../diagrams/49/cae97c2a923e35e5e3712b72d089518c.png)
![[Diagram]](../../diagrams/51/8e8c24e539da3ef7490bd93ecdd59804.png)
![[Diagram]](../../diagrams/17/611face42997ece7c1c52f0aee54e206.png)
![[Diagram]](../../diagrams/5/859921f66bf4cf2bcd8810611879a3f0.png)
![[Diagram]](../../diagrams/12/cd79b930408a27bb675afb77f5fb8463.png)
![[Diagram]](../../diagrams/40/b8dbba8ca10a0db85f55a6fbc66a00cf.png)
![[Diagram]](../../diagrams/9/1563f3d75c589cba06f362481f0846d0.png)
![[Diagram]](../../diagrams/20/1eafe3cd9eda32a63fb73f333588375b.png)
![[Diagram]](../../diagrams/27/2d4e44eb53ec76e036256bcc428e568b.png)
![[Diagram]](../../diagrams/33/aa869e51c16970111e573d036dc1e139.png)
![[Diagram]](../../diagrams/41/d17ce006cf0387a48481e7c8fbe1e984.png)
![[Diagram]](../../diagrams/32/4bc292b479a92dcf0c1500d5570c99d1.png)
![[Diagram]](../../diagrams/51/d4555006e969a0483af399e8f901cd12.png)
![[Diagram]](../../diagrams/18/d14472cdbdad7711bfa40ad3a139c09d.png)
![[Diagram]](../../diagrams/35/b4b3a28cdcc4a972590a874aba90bebe.png)
![[Diagram]](../../diagrams/12/ea4a8c5bfe820d8235af91c650d86b43.png)
![[Diagram]](../../diagrams/16/f82f635a8d60171622cff58a18b1d253.png)
![[Diagram]](../../diagrams/16/c5f42179852d93b0e99ea651bb95b4ff.png)
![[Diagram]](../../diagrams/43/4aab8c8159f3fc7288a7dc08683fbcd7.png)
![[Diagram]](../../diagrams/43/5aacc936496728634af0586d614888d3.png)
![[Diagram]](../../diagrams/31/27941aa137aeb7650c0dbe6b43b49ed5.png)
![[Diagram]](../../diagrams/25/f65257ae1118f75e96e65ab2ba1039dc.png)
![[Diagram]](../../diagrams/35/6bdc20c68fc608e4f7c01a2764c70739.png)
![[Diagram]](../../diagrams/17/7ecd762fc5ba806d1307d26855d37794.png)
![[Diagram]](../../diagrams/52/026c56edc627e1910a800634dbb5ab32.png)
![[Diagram]](../../diagrams/35/6e9d3326810d0717ab7005d8b639c0cb.png)
![[Diagram]](../../diagrams/31/353c111bc31412f750a5c5ac98092f7b.png)
![[Diagram]](../../diagrams/11/edb7b0a25e34f61dd6ebd010e304ee1c.png)
![[Diagram]](../../diagrams/33/93e4563faec783df43ddbc12db622e6a.png)
![[Diagram]](../../diagrams/40/929a52282b54f39e9afe83cec94442b5.png)
![[Diagram]](../../diagrams/39/6cf8219185b56b3d332e1c7c480aef55.png)
![[Diagram]](../../diagrams/47/edb841ed9ed28fffa3d6049a28456ddf.png)
![[Diagram]](../../diagrams/44/d8941e763e9f9e2d9e313866dc12cd86.png)
![[Diagram]](../../diagrams/16/1da80d931962ca42658bf41ca351ca0b.png)
![[Diagram]](../../diagrams/31/683f00aa9597f026bfc40486529111ec.png)
![[Diagram]](../../diagrams/34/d7c759972ef06d1ac6a48244096241c5.png)
![[Diagram]](../../diagrams/14/88f0425bd40dd60c50f51b3fcfdd7b3c.png)
![[Diagram]](../../diagrams/45/2a407c834511cf3901128e690a4cd107.png)

![[Diagram]](../../diagrams/20/cc9bccf665b7f2e7940a8f8f7e8bf346.png)
![[Diagram]](../../diagrams/51/e29dd08d4ecb6f079a4f9e9dd24ed1bb.png)
![[Diagram]](../../diagrams/26/b4dbd769fda5f44c45fe127136dd76a8.png)
![[Diagram]](../../diagrams/45/d7a465c9f2d04ffe303b7c045b8bf148.png)
![[Diagram]](../../diagrams/2/3cb1d786e745d348d571a07f4c19fabb.png)
![[Diagram]](../../diagrams/8/91ab9b6ed6eba742970c01cd7b745d0f.png)
![[Diagram]](../../diagrams/45/708fd4efdf4804c554dc4ae538caa22a.png)
![[Diagram]](../../diagrams/4/e5fc67416898c577a5228cf34fb99acd.png)
![[Diagram]](../../diagrams/6/6f36e4509ca9007b4b2398dda0ae344c.png)
![[Diagram]](../../diagrams/41/eeec2836e13fa62371b40f86aee6287f.png)
![[Diagram]](../../diagrams/38/a7ebe15e0e689a8f00ccee1fca98ee4e.png)
![[Diagram]](../../diagrams/29/07ef091ae4510f913163e215ed13fc93.png)
![[Diagram]](../../diagrams/6/aa1bc97d86a7508276efd387d7c38c86.png)
![[Diagram]](../../diagrams/16/d5050953b0f7b8c07f80ec13a07dc792.png)
![[Diagram]](../../diagrams/43/3468f1cdd5cc28dbfcf5a63b970c2059.png)
![[Diagram]](../../diagrams/12/45252063d73adf5053235f71dd21daa4.png)
![[Diagram]](../../diagrams/6/dab12675613bfce12b7d2acbfd81def7.png)
![[Diagram]](../../diagrams/35/4ed666a4774d7ab3297148c8e75514e9.png)
![[Diagram]](../../diagrams/33/e785f676af18994a31cedbe775bad3a5.png)
![[Diagram]](../../diagrams/12/1357f49308781eaaeb635cc7dc251703.png)
![[Diagram]](../../diagrams/9/6161a46403c4341141a4182ea7cccf14.png)
![[Diagram]](../../diagrams/31/369d6a28d96940d9c7d5b835a215857f.png)
![[Diagram]](../../diagrams/52/7a4e76282508aa552c88cb54701e5858.png)
![[Diagram]](../../diagrams/48/86d2575cea3bd7981de01863078c7422.png)
![[Diagram]](../../diagrams/35/067f411a2ba395d8c8d93152505b97cd.png)
![[Diagram]](../../diagrams/52/acf9e45823eb6208594ceacb1d3a10f3.png)
![[Diagram]](../../diagrams/44/0e90831aead9ce8cb3609e2cddd886a5.png)
![[Diagram]](../../diagrams/15/363bb921d361f260d3ceb6d2ac602b90.png)
![[Diagram]](../../diagrams/5/df24fae56ed991cd03c6fbf45807530a.png)
![[Diagram]](../../diagrams/49/cfcfb2c9c77aaf0db240c19e8e2512e1.png)
![[Diagram]](../../diagrams/17/6c5b3280333b7c16055108bc3e01a960.png)
![[Diagram]](../../diagrams/31/25fbbd18c210bd003f662c47e3d034c1.png)
![[Diagram]](../../diagrams/38/43cd439045547c9100c493d1dd92b86b.png)
![[Diagram]](../../diagrams/26/8896b8aa80ae34a35769c4ef9cc1156d.png)
![[Diagram]](../../diagrams/1/69b9ae47618b36bbea628a619dc3762c.png)
![[Diagram]](../../diagrams/4/de92f51dfed36423a0804c343629e817.png)
![[Diagram]](../../diagrams/52/3d34a95d87c004259628b2f7d1790e1a.png)
![[Diagram]](../../diagrams/21/dccc3096ee431a57dfe5b2a0af6c9335.png)
![[Diagram]](../../diagrams/11/b584809834c02cd5c5976065ded4b0e4.png)
![[Diagram]](../../diagrams/35/d97439b7ca46f2a07b15a8892a29b24e.png)
![[Diagram]](../../diagrams/39/5f89303a0d477a59be660252efcd0cee.png)
![[Diagram]](../../diagrams/0/a42224896b36773ff86d3534f0b2fbbc.png)
![[Diagram]](../../diagrams/30/64414c6c5775faf27f2da346cfc94d60.png)
![[Diagram]](../../diagrams/36/4174b75c439f40d9ba82efcc413a45b5.png)
![[Diagram]](../../diagrams/41/639f9ac056d1a2e653b3941b28219b0c.png)
![[Diagram]](../../diagrams/48/8cdb63215680c324e4d2eeb0015ef1df.png)
![[Diagram]](../../diagrams/36/19cc48cbc06e78f5fd544e21a9119993.png)
![[Diagram]](../../diagrams/52/1ca01f7d06bc76b726b5593d386877f4.png)
![[Diagram]](../../diagrams/37/f8cf81a0968f8301f9ef2af4afe46784.png)
![[Diagram]](../../diagrams/49/6e9a550aad91490635dcd19d358abeaa.png)
![[Diagram]](../../diagrams/42/81a34f286e52f4936dd32e33bf13bd1b.png)

![[Diagram]](../../diagrams/13/ab921b8a26983a04eed3f1dfd84bad7d.png)
![[Diagram]](../../diagrams/21/b8c66dae7d4238e17d3f1b33d303f18c.png)
![[Diagram]](../../diagrams/26/68e79f8e4453f82c800a79d58b6b4876.png)
![[Diagram]](../../diagrams/40/0618b9fea63d61759684265ab3401404.png)
![[Diagram]](../../diagrams/18/1f9c6c72f6c5c2f7a330193f437670e7.png)
![[Diagram]](../../diagrams/1/79ecdca53f467b081a42a69aec4ac06a.png)
![[Diagram]](../../diagrams/40/636426e9406388ec35fdf83d54eb2165.png)
![[Diagram]](../../diagrams/6/8521d19a8ba4f02c79bb0c2757640c91.png)
![[Diagram]](../../diagrams/37/04d220942c14eabda82af4cc89f8d55b.png)
![[Diagram]](../../diagrams/51/07c551b15cd7b3e0f35986eea7f11ed4.png)
![[Diagram]](../../diagrams/12/a0495b796f3dca50674f37732afc6aec.png)
![[Diagram]](../../diagrams/51/e57a52c5123ed30535699d1e37988376.png)
![[Diagram]](../../diagrams/16/39ef96e2a1c5f3d9b298c44a41dc2902.png)
![[Diagram]](../../diagrams/49/93a9530a80207966152a93ce8bffb1ee.png)
![[Diagram]](../../diagrams/15/5cb53630368b1cf63390f8039667d982.png)
![[Diagram]](../../diagrams/6/96d45ce84bc19f67a45d8747b49aee17.png)
![[Diagram]](../../diagrams/10/47d6b9e9525dc99eeae50e6a4c32a6e0.png)
![[Diagram]](../../diagrams/42/204012f6e5d7a2a09e25d20b5cf6601a.png)
![[Diagram]](../../diagrams/14/63c5a22e16a1499430ee3d9e974aa96f.png)
![[Diagram]](../../diagrams/18/f6b92d5bd1d363effc54fd9f8587a82e.png)
![[Diagram]](../../diagrams/34/56379fbbfbd509897a0f1d8c6e2fde5a.png)
![[Diagram]](../../diagrams/38/f40dbdad9a5cb714110fd6194be1a313.png)
![[Diagram]](../../diagrams/47/94801cc7260113c775c5d54dd1b7bf12.png)
![[Diagram]](../../diagrams/50/8893919d15b9cf468a7cab1acf9e00c5.png)
![[Diagram]](../../diagrams/7/b1d63c68390b87c1b64810ac810231d7.png)
![[Diagram]](../../diagrams/21/2264c414f86082ff8a4b11763bd001af.png)
![[Diagram]](../../diagrams/19/c5be0ee4f66a82a16b9337ed105d3168.png)
![[Diagram]](../../diagrams/16/c4d0c2d93b3b4f3111d05ea0c6d024c2.png)
![[Diagram]](../../diagrams/45/6b207493f156e9b83dc0bbdbcf696c1b.png)
![[Diagram]](../../diagrams/48/fba84e983987eb3f63743d4f56099099.png)
![[Diagram]](../../diagrams/10/25fd783caf08afab2f33bf901bc6075e.png)
![[Diagram]](../../diagrams/29/ca0b6ab5d60fccaea3b4f8c0e44eba39.png)
![[Diagram]](../../diagrams/26/4c3ab3df459f552559aa91f52ccbdd54.png)
![[Diagram]](../../diagrams/45/b9a988cd332b4d0ac1f9e728c69ff4dc.png)
![[Diagram]](../../diagrams/43/e9f40a219b6157a2eb63bfe1113f3a2e.png)
![[Diagram]](../../diagrams/9/7e4a6118ec96a8f7f984f5c13f52eefd.png)

![[Diagram]](../../diagrams/7/300ced6ef80d076b6b9ce9ef0fb0a14f.png)
![[Diagram]](../../diagrams/45/3a8ea5d77b5ab424ab783d44042e20ee.png)
![[Diagram]](../../diagrams/34/ebc422230a45845367eb025567c2d583.png)
![[Diagram]](../../diagrams/14/7d94483c4ad64e3c7cb1a0c472c82021.png)
![[Diagram]](../../diagrams/6/086da6622778cb13ac0f6f721e55cd05.png)
![[Diagram]](../../diagrams/0/5eda1269ac6a796f2af6c2ff4d709730.png)
![[Diagram]](../../diagrams/25/65225e8cd3c07f3a5726b606818e6e5b.png)
![[Diagram]](../../diagrams/33/d3212f87d8e063402f0c6ec083ede446.png)
![[Diagram]](../../diagrams/27/d8ad23e399d38b9a73c414c3321aafe9.png)
![[Diagram]](../../diagrams/33/f80a8f5d20dcc8573f6b77e6c9f2607c.png)
![[Diagram]](../../diagrams/26/805b538d80cf7c7773ef9edd20a6cfd9.png)
![[Diagram]](../../diagrams/36/fab60c21769976c8d3e61824a8bc0c6d.png)
![[Diagram]](../../diagrams/48/3b336340455c6063efa9ded13a9f0456.png)
![[Diagram]](../../diagrams/23/afc94cdc95377329d60432748a0bd77a.png)
![[Diagram]](../../diagrams/36/e142fb6c936796599379f84224990ceb.png)
![[Diagram]](../../diagrams/15/5da91134b767569a4a6e605e02ea1c45.png)
![[Diagram]](../../diagrams/47/53667192dda23dde7127804a9b22b7d7.png)
![[Diagram]](../../diagrams/16/e960994216a77a61a4d700ca81f9cdcf.png)
![[Diagram]](../../diagrams/50/4152665af3f0abc0560db6020e224eb6.png)
![[Diagram]](../../diagrams/52/1bf13e526e1387d25a4051fe5870cefa.png)
![[Diagram]](../../diagrams/8/62bcb0a486137dadea106f8defc5c0a2.png)
![[Diagram]](../../diagrams/23/2dc0e69919b5ab66e5f2d7cf8bfa8d01.png)
![[Diagram]](../../diagrams/27/f653a6a60d554e638120b00ed640aa7c.png)
![[Diagram]](../../diagrams/11/5cf0a526685f8b71c31f8db964bfef5d.png)
![[Diagram]](../../diagrams/50/491324de658d87cdf0c2d22efcfdf999.png)
![[Diagram]](../../diagrams/31/dd40cdd7fa7d358d42e82a95c9e4acbd.png)
![[Diagram]](../../diagrams/41/9beeabcc38dcbb7a5b3d3bb8c53517e2.png)
![[Diagram]](../../diagrams/45/c0edb9b048a645c6fdca9a571fe4f320.png)

![[ext]](http://badyk.ru/files/P5190001.jpg/normal) http://badyk.ru/files/P5190001.jpg/normal
http://badyk.ru/files/P5190001.jpg/normal![[ext]](http://badyk.ru/files/P5180133.jpg/normal) http://badyk.ru/files/P5180133.jpg/normal
http://badyk.ru/files/P5180133.jpg/normal![[Diagram]](../../diagrams/5/44289d14f650c4e364cd6635e7ac9ee8.png)
![[Diagram]](../../diagrams/1/a11de3ae87a8a123d36bf73a8935f59b.png)
![[Diagram]](../../diagrams/25/67dbc70a6160f2228579d30be84030d8.png)
![[Diagram]](../../diagrams/51/66ab310507cfe04ee36298fceddbe408.png)
![[Diagram]](../../diagrams/1/febb8d5111879c08683b488e69411dad.png)
![[Diagram]](../../diagrams/40/619a50cf8b679e2b8a76c6af71f422f4.png)
![[Diagram]](../../diagrams/24/af4d93880e6f2e1b9a7eac1726096606.png)
![[Diagram]](../../diagrams/30/4334aa5973d600de7e4f3d393938d847.png)
![[Diagram]](../../diagrams/33/0d9b2392318c09782f8caebbcd158135.png)
![[Diagram]](../../diagrams/1/33d3371235a5c21beb920a29f15577ba.png)
![[Diagram]](../../diagrams/24/7889448a60307ebb962bf2fa91406c57.png)
![[Diagram]](../../diagrams/12/98cd41cc68292cb784dab6c492dd9ee6.png)
![[Diagram]](../../diagrams/36/faf742b7f7431aba7e2c07f4bd05f206.png)
![[Diagram]](../../diagrams/52/486bede0fd73be0ab514db1c19407acf.png)
![[Diagram]](../../diagrams/11/57413be4b8d4d42dc6a13be9e078422a.png)
![[Diagram]](../../diagrams/25/f1f73f3252ad80ae508fb4dd867ba1a1.png)
![[Diagram]](../../diagrams/25/162ad4997aab07f256ab8bf49538ab7e.png)
![[Diagram]](../../diagrams/49/d55682af7c26d710f4993ccadfce40a3.png)
![[Diagram]](../../diagrams/49/29b8eb1c285fc3b20bdc37e526d27f3a.png)
![[Diagram]](../../diagrams/0/20fe56c0cccc3a7ed2716f62c0eda952.png)
![[Diagram]](../../diagrams/44/c084b70d3603f6b2baae3a9efe20f1ca.png)
![[Diagram]](../../diagrams/23/793bb98a00ae27b0244edb7dbe89c444.png)
![[Diagram]](../../diagrams/2/da37b86ede9a37d6be59fdee6d375385.png)
![[Diagram]](../../diagrams/37/848939977298f85908d385ea0ae43da4.png)
![[Diagram]](../../diagrams/5/6da0b9e16f468ad53526159a59e31b49.png)
![[Diagram]](../../diagrams/48/fb7538f5171cb7287008245e601a8e14.png)
![[Diagram]](../../diagrams/12/45bee543fc68853f70e10d396246181a.png)
![[Diagram]](../../diagrams/13/e598bfbef4b8167a0fab89e23be232ec.png)
![[Diagram]](../../diagrams/11/7f3cd8c0a5a1ac8fa40b2e77da1f9544.png)
![[Diagram]](../../diagrams/21/aca3f960f4f10e93a48a8ef5e87907e5.png)
![[Diagram]](../../diagrams/42/347f542b3aa5ff32466985d317ccca7e.png)
![[Diagram]](../../diagrams/13/9bb014973ae57d228ba87b2e78fd55d6.png)
![[Diagram]](../../diagrams/15/f60263e403ef77a8c19f92e1122d0f81.png)
![[Diagram]](../../diagrams/14/c1bbd7c49b77b9dae341391bb171a3bd.png)
![[Diagram]](../../diagrams/44/65230f71ed24ff68239188dafcc41797.png)
![[Diagram]](../../diagrams/4/c9069d4d02ff6c6d878d0edb1a1d0c23.png)
![[Diagram]](../../diagrams/42/35b78843d105aa97ca90bb02bc887a3c.png)
![[Diagram]](../../diagrams/38/de609a48b85216328dd1cc4bd515aafa.png)
![[Diagram]](../../diagrams/34/66278b119055716363ee70b3583bf9cf.png)
![[Diagram]](../../diagrams/45/6ae0c013c2a5c7d71d54d336ac842cbb.png)
![[Diagram]](../../diagrams/45/12c3eef5782c410e86185e9475eac51e.png)
![[Diagram]](../../diagrams/27/78bc9f5f5965ff3cd7c4379b2c17342c.png)
![[Diagram]](../../diagrams/14/5b79360704331fcf1c758a3283ba879c.png)
![[Diagram]](../../diagrams/4/c2a2ccfd222b8320658c4f086c445e65.png)
![[Diagram]](../../diagrams/3/ae8ae8fb07556bb57ad78d692b8d7441.png)
![[Diagram]](../../diagrams/6/6b51f9fdbd60ccfe166b5a76d02ed15c.png)
![[Diagram]](../../diagrams/37/2f778034760a6d733b074e9224b7a42f.png)
![[Diagram]](../../diagrams/21/6781a32a7f92224d010571ba5d7fe5f0.png)
![[Diagram]](../../diagrams/30/86cee0758288bcf79acc872141e1c6bb.png)
![[Diagram]](../../diagrams/30/c2c66acb6ea203296fd76652a494edd4.png)
![[Diagram]](../../diagrams/38/f49153ee87683b32d80146ae7580d99e.png)
![[Diagram]](../../diagrams/18/8473de7316c4f5acb3ce4ebfd564ab90.png)
![[Diagram]](../../diagrams/20/3e0ab31cf7dc9ac61491a615a2dc6275.png)
![[Diagram]](../../diagrams/39/666625548fdba4a04c7df70d3276f6bb.png)
![[Diagram]](../../diagrams/36/693a0d9ea589daee38c65e0d02643e4f.png)
![[Diagram]](../../diagrams/37/3369e49db30a75b9f693eec7ce23409d.png)
![[Diagram]](../../diagrams/40/4f29af6b84405b02f7ba3a1d829f51e8.png)
![[Diagram]](../../diagrams/10/28d60f6bc25097c9f3e0bb9dbef34b4f.png)
![[Diagram]](../../diagrams/44/50eeebb6b9dfd1f41fbb8c7b788931c3.png)
![[Diagram]](../../diagrams/32/85474cbd91a1cee6eac97a4fdeb44c10.png)
![[Diagram]](../../diagrams/31/a636359e7e0694e67e5b39301220c909.png)
![[Diagram]](../../diagrams/38/7f7fa59aa0fc39b0c95485620c81a8b9.png)
![[Diagram]](../../diagrams/38/6048766c918285270816667da0a06706.png)
![[Diagram]](../../diagrams/20/eeeb6f9a3d493249c3101914dbdb99ed.png)
![[Diagram]](../../diagrams/39/f006b90eaab3e16a1f055b054112db24.png)
![[Diagram]](../../diagrams/18/12849f320a8bfedf08a12cf8fd8818f3.png)
![[Diagram]](../../diagrams/12/63bcd6f7915ba60e6a3d58fc281153df.png)
![[Diagram]](../../diagrams/12/bb3449f21ebe9321e63e76dab9ad444b.png)
![[Diagram]](../../diagrams/15/47f6a328fd2d1c3e339b6ff8bbe05a5b.png)
![[Diagram]](../../diagrams/7/0755fa320e4fb9757124217df400cc43.png)
![[Diagram]](../../diagrams/45/89e514b90417a2223539e3c39f29fa1e.png)
![[Diagram]](../../diagrams/15/a56147b91a3f30fce489eccc46ddc3e7.png)

![[Diagram]](../../diagrams/1/f02b8d98636d4edd9d797fc9ee1a01f7.png)
![[Diagram]](../../diagrams/10/6b0c41d0ab74d6ee3468fecc1c961d42.png)
![[Diagram]](../../diagrams/46/d182d2b1bab206cfe139134cd2b9bcd4.png)
![[Diagram]](../../diagrams/31/baddf651c6dc252a6c42bce745845f45.png)
![[Diagram]](../../diagrams/40/60ead91e4d10bb64b87c8cb9274c2065.png)
![[Diagram]](../../diagrams/27/651dba3c3c3425abba2cf1260590ff72.png)
![[Diagram]](../../diagrams/40/9ff1bbeb4bc309c212196c2318c912fd.png)
![[Diagram]](../../diagrams/45/6893f4dcccbef80f6381a0dc4535fe5c.png)
![[Diagram]](../../diagrams/24/0b62edd4949616e1cff14c14a621b522.png)
![[Diagram]](../../diagrams/17/68a5c13eed2578e9cc7b72b71b81b5f6.png)

![[Diagram]](../../diagrams/0/25f50e795d9a01744805a55fa9df56a4.png)
![[Diagram]](../../diagrams/7/035bb5eb7c1816888d9ac74fbfe06b22.png)
![[Diagram]](../../diagrams/21/23baaa3c7ae1408eba83e643947357e1.png)
![[Diagram]](../../diagrams/10/873800cc1640511ee18ffd7361cadda1.png)
![[Diagram]](../../diagrams/44/0be6f9b33a65b3f253954a30e0516e56.png)
![[Diagram]](../../diagrams/14/df1a6719dff6faf3b24f5a212bf47253.png)
![[Diagram]](../../diagrams/47/a5da03f68265c11bf63dcc2ce695d76f.png)
![[Diagram]](../../diagrams/50/7dd364e65ea8a9744c894026119c6dbf.png)
![[Diagram]](../../diagrams/36/0dd2d36ed37cdd62eea83063cdcbe8ad.png)
![[Diagram]](../../diagrams/36/6045237a2a3827ce54dec249a98df04b.png)
![[Diagram]](../../diagrams/51/406db906128aff8a7b205bff8f4d7e59.png)
![[Diagram]](../../diagrams/40/ec7144f63991224a08863d9eeb7fd095.png)
![[Diagram]](../../diagrams/40/b3a260fedbb505b56831667892831906.png)
![[Diagram]](../../diagrams/1/cc593a5cbf0b0a6f73f9dd7b97607dc7.png)
![[Diagram]](../../diagrams/25/9d04a0ecd45e9f3411288430b220886c.png)
![[Diagram]](../../diagrams/5/4a1d726bd5ab1d1e11ffd11e1ac81bf8.png)
![[Diagram]](../../diagrams/46/1e2b6802ba6741eacd84a3dd952ec9a8.png)
![[Diagram]](../../diagrams/32/af685bb5f055ffc3804f7f01b0e2b3c5.png)
![[Diagram]](../../diagrams/2/c9f5c54779540ea4367a21f1b1078541.png)
![[Diagram]](../../diagrams/6/88d5de6c21aacd79238f4484d2d8a03c.png)
![[Diagram]](../../diagrams/12/e6d3830db4a1482fe5fd7b3bc0697f80.png)
![[Diagram]](../../diagrams/12/b0b0ecf4836c53491b6e0d37b378a4d2.png)
![[Diagram]](../../diagrams/25/1d0824323aa1c91f8f159cfe1971a7cf.png)
![[Diagram]](../../diagrams/41/f2332bad2041c7fa2a2b9fa64fd4d08f.png)
![[Diagram]](../../diagrams/1/6e2800d11d51632a09566716876ff682.png)
![[Diagram]](../../diagrams/36/03c488fc9e7007e6497e32d16270391d.png)
![[Diagram]](../../diagrams/38/6d547169e3bc1ce9744ec7fd78ec16e8.png)

![[Diagram]](../../diagrams/39/8e74ca7980f4ee27ab016d33d0b49df3.png)
![[Diagram]](../../diagrams/33/054568baf1d73155c6cd749f9397f8f9.png)
![[Diagram]](../../diagrams/1/594c0c3bcb767e0a617cab148cae7868.png)
![[Diagram]](../../diagrams/23/845e99d959448110549f983acecd7f04.png)
![[Diagram]](../../diagrams/14/11eae934e3e987891749e79c3299738a.png)
![[Diagram]](../../diagrams/41/f3cf007ea5f4e070fb376c425fa609f6.png)
![[Diagram]](../../diagrams/42/b1f2c173fcfe30e24a12cc76ee296b62.png)
![[Diagram]](../../diagrams/28/479c0b781e9a1e243dbc347b6c9db6de.png)
![[Diagram]](../../diagrams/4/9981e2093f784dd1bc0e5b335020dc73.png)
![[Diagram]](../../diagrams/26/182795de86f52e46f957d51f0c8905c4.png)
![[Diagram]](../../diagrams/23/0beb14317ba81c9564a6ed385331cdcc.png)
![[Diagram]](../../diagrams/15/0c5493b45c18fc2b07c0816b36e2dae7.png)
![[Diagram]](../../diagrams/32/d6a0a9970e072fd65e6952f56a4d77b4.png)
![[Diagram]](../../diagrams/6/b3f0913f0f74bc065d3bccd724839fda.png)


![[Diagram]](../../diagrams/5/35943676e2471b5c4aa2aea5d368e279.png)
![[Diagram]](../../diagrams/37/59ec5fb136b691e079d7c80b472926e8.png)
![[Diagram]](../../diagrams/32/9d18125a1109b9975c62a40952b7cc71.png)
![[Diagram]](../../diagrams/22/ca6dcfedf0529c13ac6feeba27f8fa16.png)
![[Diagram]](../../diagrams/29/b1f5e60eec49906ed4f76e7eff726741.png)
![[Diagram]](../../diagrams/2/a6ac6bc7449f5d4a2a1d0cccb1e50e00.png)
![[Diagram]](../../diagrams/15/8d2046961c24a4a8056052fb9fa88c8f.png)
![[Diagram]](../../diagrams/39/73ad13a525824c044c51bae2443eb196.png)
![[Diagram]](../../diagrams/33/8e7d259c7642dc582cac292ad680776d.png)
![[Diagram]](../../diagrams/32/ca5cf87d3399e3d4c0a2cbd2cf3e5d91.png)
![[Diagram]](../../diagrams/35/a2179c326f89bcc2979d6a625c4ac94d.png)
![[Diagram]](../../diagrams/45/26552a87c2fecb72f71563327a4d6322.png)
![[Diagram]](../../diagrams/14/f41370e5fdf6d722917e34fd4519cbc6.png)
![[Diagram]](../../diagrams/12/6ac26e19dd5789230d4e01e318f7e073.png)
![[Diagram]](../../diagrams/9/5ba5a5fcb7a3cbc21611f31bdfc33553.png)
![[Diagram]](../../diagrams/24/ccdad0754e98066e076b1aa0d7665378.png)
![[Diagram]](../../diagrams/42/fb80fa951d5005a96564b1684fe7d962.png)
![[Diagram]](../../diagrams/9/43ab33c34faf5c4045629558c4b0f45a.png)
![[Diagram]](../../diagrams/1/5a61f7041e625764348505b42f2138f0.png)
![[Diagram]](../../diagrams/47/7f3d1c47ba178d14c8a7a8899944980c.png)
![[Diagram]](../../diagrams/44/2e6a011334c926eaaad40e47f84df422.png)
![[Diagram]](../../diagrams/45/3af347a2f93feed8695b056f2c7cab33.png)
![[Diagram]](../../diagrams/35/9ae8dbdf9586559b969e50a56e2311d1.png)
![[Diagram]](../../diagrams/11/6104d021538d04035c2003c4c7673a73.png)
![[Diagram]](../../diagrams/0/2a502fbd35fca550e9600f32fa181fa8.png)
![[Diagram]](../../diagrams/10/aa3ab30bf2d1ca92eb1c180e69f4259a.png)
![[Diagram]](../../diagrams/15/14d78442f16e419afc59b671c5e7316d.png)
![[Diagram]](../../diagrams/20/847448e6de67d431296b1bf31c40e439.png)
![[Diagram]](../../diagrams/3/4b00b79be6844353266f8274b4cd62cf.png)
![[Diagram]](../../diagrams/8/beb58bb77ee4e336d9f36ef5fca6e52b.png)
![[Diagram]](../../diagrams/52/37cdd840d5f86e9a8a5ed6ab6703130f.png)
![[Diagram]](../../diagrams/40/8d03b437df88bbd2e3dc6f169095039d.png)
![[Diagram]](../../diagrams/17/4d4c22a4dcef97909b17584126d659bf.png)
![[Diagram]](../../diagrams/45/689c090b9a2b320f9ce4254abc9cf691.png)
![[Diagram]](../../diagrams/45/858ba3fb15905a6fbea6bfc59d7fff5b.png)
![[Diagram]](../../diagrams/44/f84b64e48eaf7bff46590748fe429230.png)
![[Diagram]](../../diagrams/37/59f3f02f9302fe85d4ad3a344fdfcee9.png)
![[Diagram]](../../diagrams/24/17f6b3caad45b36fa45e63645ad93e8d.png)
![[Diagram]](../../diagrams/49/ef0549e02284cdfcb5536874552e2e7a.png)
![[Diagram]](../../diagrams/28/98d2a45518f366d475fd7d9609c50d2e.png)
![[Diagram]](../../diagrams/17/88b5f40f0ae49a90501a0b0841c01e20.png)
![[Diagram]](../../diagrams/27/383d45b924c3ae13ad691f1608747c0c.png)
![[Diagram]](../../diagrams/3/e03e56a5a35a1ddaeedb7fa8ba5b4eeb.png)
![[Diagram]](../../diagrams/51/a104f1a6de5b0917259462754a229f4e.png)
![[Diagram]](../../diagrams/24/737a1917e3713c051a0247017b81552c.png)
![[Diagram]](../../diagrams/7/911e6d96b5fbc8d459d6678884d1e8f3.png)
![[Diagram]](../../diagrams/11/ce482d1f5c31317aa072b6ef7ee7c207.png)
![[Diagram]](../../diagrams/25/cc2727f135cd6a7d8b90a39e4101b095.png)
![[Diagram]](../../diagrams/4/b5d1674ae2da4be4f85fb0da247546f8.png)
![[Diagram]](../../diagrams/52/856024644d51460db6ded76102b5692f.png)
![[Diagram]](../../diagrams/37/da1b85d8dd6e93fc03025e9077ef4a67.png)
![[Diagram]](../../diagrams/0/f5d2133f6db0d246a1dd9bf04daf9f71.png)
![[Diagram]](../../diagrams/5/0d8c99edb0f86dd3bbce8295fa687e96.png)
![[Diagram]](../../diagrams/6/62c3fd6224148598c63616e5f4844118.png)
![[Diagram]](../../diagrams/6/1fda5248c8559782aed279c764a525d2.png)
![[Diagram]](../../diagrams/9/2c48452f597b681c265dc3f1fd050a27.png)
![[Diagram]](../../diagrams/22/f583c970eb9317f7ccc4631367ea6937.png)
![[Diagram]](../../diagrams/43/024f7a00535692f4f2a11f208b051543.png)
![[Diagram]](../../diagrams/22/1284bc9426db78273dc499bbae604df5.png)
![[Diagram]](../../diagrams/34/0fa6b913573069b3e52c42e78ffa41c9.png)
![[Diagram]](../../diagrams/47/e570c06156d218729f24ac9cc59429b5.png)
![[Diagram]](../../diagrams/24/6d843139f3d889f3bac58dbf82b99f1c.png)
![[Diagram]](../../diagrams/9/74cd4f9205d8ab36ddffdb104f2351e0.png)
![[Diagram]](../../diagrams/36/5701dcf5ce2f79118dba7fd42fdb0859.png)
![[Diagram]](../../diagrams/37/3d229a190abcbd84f5896a0d5aa229eb.png)
![[Diagram]](../../diagrams/11/f2593eae992a03f2d312b09ff896332c.png)
![[Diagram]](../../diagrams/38/7eb3a2c12d534ad8f289608ae47ac3da.png)
![[Diagram]](../../diagrams/45/ff4143445ee0fbdba28d9875893b4cb7.png)
![[Diagram]](../../diagrams/42/4c17cc42a04391519f43bb34fec4df4d.png)
![[Diagram]](../../diagrams/12/6ea02fe479208a4e7f843c6c6d8f7eee.png)
![[Diagram]](../../diagrams/41/f524e73348064020d1ae78276381ca8a.png)
![[Diagram]](../../diagrams/44/ff1e7a96f118bd4c48f9229bb7b035e7.png)
![[Diagram]](../../diagrams/46/a5c2409658158c33bf184b39f0592584.png)
![[Diagram]](../../diagrams/22/9572f570bf5535f6bd8d124b8b47c694.png)
![[Diagram]](../../diagrams/13/b4722386f319b4f14cc9f7dc7f6bef7f.png)
![[Diagram]](../../diagrams/3/ffa7e729b2f64725af225f4605ccdac0.png)
![[Diagram]](../../diagrams/32/8e84fd70ff58a1cd8f59ace2b301fcdd.png)
![[Diagram]](../../diagrams/10/169f2e792435cdc7a288e5500a627256.png)
![[Diagram]](../../diagrams/27/d96b515a265dbe99f807dcf5f5276e16.png)
![[Diagram]](../../diagrams/40/a87dc48f9dd7b79b3387f11dd7726428.png)
![[Diagram]](../../diagrams/50/f20966cdeb879cfcd861bfdf009414d1.png)
![[Diagram]](../../diagrams/18/fb6d3f0520b52a7f8df45cb4382f4c06.png)
![[Diagram]](../../diagrams/35/ee61ac20221d9693acf18e2a496f22b7.png)
![[Diagram]](../../diagrams/0/a22beac59de66553c899d8f653e9580c.png)
![[Diagram]](../../diagrams/37/262a2ded5e592e098ec8beb89d5b1fba.png)
![[Diagram]](../../diagrams/33/35d48fff88f80310401751532e45864e.png)
![[Diagram]](../../diagrams/32/30064d10d458439d12cf00f4b2d8ce6c.png)
![[Diagram]](../../diagrams/10/85aaa9fd2538c4fbd125eb53c9a01525.png)
![[Diagram]](../../diagrams/38/0ecf2242985ead09a1ac081343759973.png)
![[Diagram]](../../diagrams/35/78019038299ea02ebf4918b2e8312c84.png)
![[Diagram]](../../diagrams/21/41249d3abb8171a348027fc79ae523f8.png)
![[Diagram]](../../diagrams/0/540ed863968bf397cb3c316e702ca977.png)
![[Diagram]](../../diagrams/4/306e50b2a6b83c74ed37e31e011c4419.png)
![[Diagram]](../../diagrams/45/9472c7ea0e58e0c258bd23e6ea4e7c24.png)
![[Diagram]](../../diagrams/12/1236a3d0a42c50961c949431045f00f0.png)
![[Diagram]](../../diagrams/29/3575d3d1a4337af43b04d5ad2ab51bce.png)
![[Diagram]](../../diagrams/43/5ea7ed32a06beb8c6cdcea6ebb45e71f.png)
![[Diagram]](../../diagrams/48/7110687bcf99f975beeea5862dc095c6.png)
![[Diagram]](../../diagrams/52/56fba55401f5baec479f8df1f69fddb0.png)
![[Diagram]](../../diagrams/2/670a832851a13052b605b6aee4e14e16.png)
![[Diagram]](../../diagrams/2/d3615d324024d7024090d4343da5ea4d.png)
![[Diagram]](../../diagrams/21/c19690d55cb20ee2a76892b9335af70f.png)
![[Diagram]](../../diagrams/43/df19f012b34a6b1d46cb1f2827641fdf.png)
![[Diagram]](../../diagrams/32/d7081f2061e97c98f2d868914a4b3b0f.png)
![[Diagram]](../../diagrams/7/0f3b5de5aacdf4026d1194b3db0bb975.png)
![[Diagram]](../../diagrams/11/467bc062c6abf81776729e0d5f27a225.png)
![[Diagram]](../../diagrams/47/366d94a3a9a0570b23d561e1a35e5442.png)
![[Diagram]](../../diagrams/0/eb909dc3c919f7185897428761e6b06f.png)
![[Diagram]](../../diagrams/15/d08366ba3df7d3432f4b95268ba261a1.png)
![[Diagram]](../../diagrams/5/9bd3452480640eb9dca68afa001b68ad.png)
![[Diagram]](../../diagrams/11/650902dd0f6772ca2f7e893cfe706d32.png)
![[Diagram]](../../diagrams/44/9e9e90199f11398cc867f5dfac411f73.png)
![[Diagram]](../../diagrams/35/3981d624c79143d6d6ee81a3ecff8474.png)
![[Diagram]](../../diagrams/50/11877079c7c80a4d58c1a11170b362ae.png)
![[Diagram]](../../diagrams/46/c79241b19823a3200771a601aaf307af.png)
![[Diagram]](../../diagrams/19/2508f465e4f7d4fe5e42721a4dd8e264.png)
![[Diagram]](../../diagrams/31/127d30389f34326649528f5a02b10d49.png)
![[Diagram]](../../diagrams/33/1a44cf961e4e79fc008b426ca0b2ab32.png)
![[Diagram]](../../diagrams/49/e956ab0747f4c0889db1edd4f51a11ba.png)
![[Diagram]](../../diagrams/40/a3719d0a78a0fe41841514d8c7f4e746.png)
![[Diagram]](../../diagrams/51/cbcf23d9a9eec7c7dd4d5aadd7194da9.png)
![[Diagram]](../../diagrams/31/26c2ebb0a477068e37767b42769c6a5e.png)
![[Diagram]](../../diagrams/50/ce59cb3f83377b65e226cd73026e6534.png)
![[Diagram]](../../diagrams/5/04c1735f9c2a04b4167467891896f089.png)
![[Diagram]](../../diagrams/6/eb8dfdfa1f78ebc1bbd0e2ab702c791f.png)
![[Diagram]](../../diagrams/18/0ed3b3803df27f98e81a179821837bfa.png)
![[Diagram]](../../diagrams/22/2a93986c4ae53ebeab32ee9a959765bb.png)
![[Diagram]](../../diagrams/9/e02afa9e6a6b89b8643d1f3b5bc06fa0.png)
![[Diagram]](../../diagrams/24/837545bab6df5ca416d82d91eb8bc7fa.png)
![[Diagram]](../../diagrams/3/8b2c107998d3290ac30760ce2d9b2d43.png)
![[Diagram]](../../diagrams/7/a8049b7041343b24ef96e5932eb2bf6b.png)
![[Diagram]](../../diagrams/47/2d426324cf58290f1f2abdd587f1bf07.png)
![[Diagram]](../../diagrams/5/db67d17715379dbdfdb9b1e2e3b0ca37.png)
![[Diagram]](../../diagrams/9/951ef9cf04cbd1f39afd577220548998.png)
![[Diagram]](../../diagrams/36/641ddc60bf16139d95a3b113cd5f504a.png)
![[Diagram]](../../diagrams/32/964dd27db8bf6107e7a82f620df270e1.png)
![[Diagram]](../../diagrams/28/50211f0e0435a05fefeb7ecbcaf3800c.png)
![[Diagram]](../../diagrams/45/55a3d4adefdb8abb7a9dcdcc1207fab1.png)
![[Diagram]](../../diagrams/39/72cfb5ed3cb95f593502d0ccecd797f4.png)
![[Diagram]](../../diagrams/45/ff013a44f4d8f984f7a3fe5bd9e26894.png)
![[Diagram]](../../diagrams/38/37f4650143304bb548024fe7dd25fb31.png)
![[Diagram]](../../diagrams/27/bfc4ab8beb9173bc41dd51610041446c.png)
![[Diagram]](../../diagrams/35/91a409d325b5522fdd2bef1d909f45e9.png)
![[Diagram]](../../diagrams/13/9bf866dbd8b9ef87179c702d1181e1f2.png)
![[Diagram]](../../diagrams/32/2a89d34bb2c1a5c434c35f09b4904de4.png)
![[Diagram]](../../diagrams/13/a27c6b844c2c4275821b0ea7dd5a8068.png)
![[Diagram]](../../diagrams/22/84170675ca491b1f1f965058e0a6bd1c.png)
![[Diagram]](../../diagrams/32/297d7f640df5b359baaafc2dcd1544f6.png)
![[Diagram]](../../diagrams/12/f4fdbec8af1073496a62ef99fa6b7ff5.png)
![[Diagram]](../../diagrams/21/8504d47626b537f2f3ec0892f189c113.png)
![[Diagram]](../../diagrams/38/feb2889ee1e5c3694247891e8fb30d31.png)
![[Diagram]](../../diagrams/42/4f55b66c8210451ee58622df1295f09e.png)
![[Diagram]](../../diagrams/6/3265c016ea9ea3e67634e3eee9979cef.png)
![[Diagram]](../../diagrams/4/fdaa024179decab323a483a755642e6d.png)
![[Diagram]](../../diagrams/13/7650f9cc08f6c89a847cfbadb9143d5a.png)
![[Diagram]](../../diagrams/48/f839292249d0e68b696a0f0d2590bf95.png)
![[Diagram]](../../diagrams/18/a931132db200399f69a8fbeb211ecf01.png)
![[Diagram]](../../diagrams/4/2b6df8442131c21a0c868507088962b9.png)
![[Diagram]](../../diagrams/25/6056f7b6cbaf1e56285037d369170012.png)
![[Diagram]](../../diagrams/3/afa7150184e8e59e36c74ca25cc24d88.png)
![[Diagram]](../../diagrams/15/0e3e0bf6033830a25751ca159fc1ce74.png)
![[Diagram]](../../diagrams/1/31ba7645fad1c8fd07d44c75b24653ac.png)
![[Diagram]](../../diagrams/45/b4ae0e622a0097c2222f667e29bc5fab.png)
![[Diagram]](../../diagrams/1/0e59dad8401261aaf3b7935a46c0e1e4.png)
![[Diagram]](../../diagrams/11/05e0032680f1e048c26c7d7ea7cbd930.png)
![[Diagram]](../../diagrams/8/49f99e3201617a2c615c3a4bcd197ec9.png)
![[Diagram]](../../diagrams/39/8bdbd1091e846d0c74c4701bac586504.png)
![[Diagram]](../../diagrams/27/0b411a49fb665da29bd90b96449f48e4.png)
![[Diagram]](../../diagrams/19/75c8326a1b9eb536a9dbd63fc668ed9e.png)
![[Diagram]](../../diagrams/27/ac1bb14cba6bb26f91c4bcfd9be4889d.png)
![[Diagram]](../../diagrams/19/004fa73d519f404a41931d60a5ca127b.png)
![[Diagram]](../../diagrams/38/59d30ccd8983dacc8cd13cbcd81b1a25.png)
![[Diagram]](../../diagrams/42/b2eeb97d23b1f249666cbc733d6deb94.png)
![[Diagram]](../../diagrams/42/9ad0a23c3b1638ee083e2293f12f31f7.png)
![[Diagram]](../../diagrams/47/6e94d7d8da82cea4cf62cab536f814e4.png)
![[Diagram]](../../diagrams/32/e163cd0881799234ab6a17a12ba113dd.png)
![[Diagram]](../../diagrams/35/eb3bb3f64aefeafef9889116e38a400c.png)
![[Diagram]](../../diagrams/18/7200dc9e73d4a2feea38a8b54b68bcd9.png)
![[Diagram]](../../diagrams/29/87b0bd8c42effb78028884cc3ec3e582.png)
![[Diagram]](../../diagrams/46/7dcfee65044837d872372d6447a45359.png)
![[Diagram]](../../diagrams/30/67dc2813f6d7b75e78b26fd23c867480.png)
![[Diagram]](../../diagrams/47/8921820240c49ab73ea5b3da0b4b06eb.png)
![[Diagram]](../../diagrams/25/5bb1ca1f1863525eda3b54f3635626cb.png)
![[Diagram]](../../diagrams/38/7f7c98251dc7a6da665fa74cf6b782da.png)
![[Diagram]](../../diagrams/39/fe9d996cbe12b3c8b72b913d3466c1f1.png)
![[Diagram]](../../diagrams/17/6edea489023c4d551ad94802cf6f73db.png)
![[Diagram]](../../diagrams/9/a35dd2160f68db1e3c4821f5836949cc.png)
![[Diagram]](../../diagrams/1/306d2fa02927a8ee959eb828e6e84e24.png)
![[Diagram]](../../diagrams/2/09b1b478426c0850d3f214dd470772c3.png)
![[Diagram]](../../diagrams/50/722f47aadcb9a169732781504264d86a.png)
![[Diagram]](../../diagrams/14/f9213ca9858be1089ad72631cf07640e.png)
![[Diagram]](../../diagrams/38/e16da011fdd548c385aba4cdbeccdea7.png)
![[Diagram]](../../diagrams/22/7cd9c7de0a6a2af5919fff126023c9cb.png)
![[Diagram]](../../diagrams/15/cb461bee899a12606c0164cce607b639.png)
![[Diagram]](../../diagrams/13/1ba4a9dfdf9b030bc5ddbb5f719279d5.png)
![[Diagram]](../../diagrams/46/7542a999edc3fb7877ba6b35f8861a51.png)
![[Diagram]](../../diagrams/42/13fd8cdbcf2102a1702d5c14cc3ffd91.png)
![[Diagram]](../../diagrams/37/5817b3e2880f60abebaed970a82773e6.png)
![[Diagram]](../../diagrams/19/72aa1dc2d210e96163bd8c939c9311fb.png)
![[Diagram]](../../diagrams/4/d11efe5488720c2cb15299df8206732d.png)
![[Diagram]](../../diagrams/13/f72bdbcd16ab55fa2136ca1fba7a4401.png)
![[Diagram]](../../diagrams/29/50cdf57186ea98d88c35e23d011c1c46.png)
![[Diagram]](../../diagrams/46/450b9d688e8e4c9fd74d2f86ad09f2d7.png)
![[Diagram]](../../diagrams/44/928e76f199f049f07e74d241657268db.png)
![[Diagram]](../../diagrams/24/42ea2820786f6c8bff6584e25dbd1c3f.png)
![[Diagram]](../../diagrams/47/9172f15582b03334f31087f37bf2be59.png)
![[Diagram]](../../diagrams/27/66263ec1506a3aed1f55015b3a1c135c.png)
![[Diagram]](../../diagrams/25/4e72960031325fc6bc1b800159701b39.png)
![[Diagram]](../../diagrams/1/0b015c03ab1ce0f17a397ccd7ced045e.png)
![[Diagram]](../../diagrams/23/725ee9bda8c1bf2a8f55fd6dfbe92867.png)
![[Diagram]](../../diagrams/6/7e0313775393c59d5c4dd0e46808cb93.png)
![[Diagram]](../../diagrams/11/97cacecde94de12cb45d1399322621c7.png)
![[Diagram]](../../diagrams/14/5e6d26b0f7d45a468c79672d470562b3.png)
![[Diagram]](../../diagrams/38/51057ad7a75c122b8adebc37674f5695.png)
![[Diagram]](../../diagrams/19/ff18932823442b9c2cc4d44bfdb9e6c5.png)
![[Diagram]](../../diagrams/15/ffe3731a93a3e76cd5369999d54b47df.png)
![[Diagram]](../../diagrams/46/3add5a5d75d6f3f25ee1e127c5ea98b1.png)
![[Diagram]](../../diagrams/23/92394fb2dec97c637647cbee1a59e1a2.png)
![[Diagram]](../../diagrams/24/e9bad26bff2ffcd93b4a81274d2d7f5c.png)
![[Diagram]](../../diagrams/27/a32a18fff3190a50aece96e006d160f8.png)
![[Diagram]](../../diagrams/21/81348bda65aa76678381874c91c9c888.png)
![[Diagram]](../../diagrams/40/8071b3a8c4ae8b27ba0eb1e405e32944.png)
![[Diagram]](../../diagrams/20/d152fd6bae1be9cd17c208604f673573.png)
![[Diagram]](../../diagrams/1/bd4c9ee8c67ad07e96742281e8cc03a0.png)
![[Diagram]](../../diagrams/44/f39b0b8dce4624381437ced3de2ae96d.png)
![[Diagram]](../../diagrams/9/adcb70c25f2e040d97bb3d2bee706cd1.png)
![[Diagram]](../../diagrams/28/4f9a82d20c4f32573da15610f3e0f785.png)
![[Diagram]](../../diagrams/36/52c5b2e149d26d0dd827b5b78a01f43f.png)
![[Diagram]](../../diagrams/25/c938878f6e0ca3e7c988a51a025f811d.png)
![[Diagram]](../../diagrams/10/989eba5b95b8fdd7442babeb7ecd40c9.png)
![[Diagram]](../../diagrams/13/6e907d4111108ac9e65efde1a4aad7e6.png)
![[Diagram]](../../diagrams/46/1b26300ea9faba47678dbd1942fd6e89.png)
![[Diagram]](../../diagrams/28/902801d67ac4f3b8d61f3efd9c2c4dee.png)
![[Diagram]](../../diagrams/23/b44d4d361c76219e98561f3ada082acb.png)
![[Diagram]](../../diagrams/45/d9122754011d986fe411966f499aee0a.png)
![[Diagram]](../../diagrams/39/fe89214acddf539d268d6ac0e5db632e.png)
![[Diagram]](../../diagrams/1/8409ac5151bc76738076b681cfab2261.png)
![[Diagram]](../../diagrams/38/53dd84c555c2cf633e3b59a98d37cacc.png)
![[Diagram]](../../diagrams/9/133f87fce9120bcab6604d08e2dee6c0.png)
![[Diagram]](../../diagrams/31/cf6f5d22b0d4f9baf804b09935bf8330.png)
![[Diagram]](../../diagrams/45/ec286ef030304a651a1845779a164e1a.png)
![[Diagram]](../../diagrams/26/edf212a442b28675c3cab53ee2283cf0.png)
![[Diagram]](../../diagrams/13/cf0f2f67112ed13e564cac4af147981d.png)
![[Diagram]](../../diagrams/35/e1bfa2c281e4014b24ac150520013b9c.png)
![[Diagram]](../../diagrams/27/f435e3c9fe2afc1b4a8aab20aa24a713.png)
![[Diagram]](../../diagrams/47/6c180ea296cb2340869fffe74c8e05a4.png)
![[Diagram]](../../diagrams/51/3202bbc8d265bbd2b0335999933ff404.png)
![[Diagram]](../../diagrams/37/19b5418c54044d0ab7e4bbe2c55d8795.png)
![[Diagram]](../../diagrams/18/a4179f4b0740311238746395a04caa44.png)
![[Diagram]](../../diagrams/2/367490666d651e07931a124c98b63db3.png)
![[Diagram]](../../diagrams/13/eb4a7ce38490bb3d38c325b6c7426342.png)
![[Diagram]](../../diagrams/20/0c72c5ee84513509cbbf0dec437130bf.png)
![[Diagram]](../../diagrams/20/aad4117c9fac55802ba06c62455c1230.png)
![[Diagram]](../../diagrams/9/b73df8782bf5ca7710b29c0572d36915.png)
![[Diagram]](../../diagrams/44/bbd27de27b56b8d37ece1896a8198b3b.png)
![[Diagram]](../../diagrams/48/c25c2879e1846c1d083cc2091d6f0673.png)
![[Diagram]](../../diagrams/33/58ac64f5f5f87442a8e5499fc0b70e68.png)
![[Diagram]](../../diagrams/44/44672cc420fca57b4c6a1050065cc912.png)
![[Diagram]](../../diagrams/34/312cb128fd56eb2c727331cfe22dd504.png)
![[Diagram]](../../diagrams/23/0b4a5daa9a3ccf11ff38273b79035c05.png)
![[Diagram]](../../diagrams/31/706b4e1cf81091dbd0fa00a894d7e379.png)
![[Diagram]](../../diagrams/44/6ea644149795bf88c36ed9ba413595dd.png)
![[Diagram]](../../diagrams/5/8be7e736c8d69f278242e825dc76caa9.png)
![[Diagram]](../../diagrams/38/5a52c094e15181654b7cd1122958c629.png)
![[Diagram]](../../diagrams/33/715d121d325e884e04ae7cd3dc76df62.png)
![[Diagram]](../../diagrams/0/eb3779fff91daec63f6cebb614cc8a54.png)
![[Diagram]](../../diagrams/31/d6e081918bebc64717bf0eef4e49d424.png)
![[Diagram]](../../diagrams/3/7f7470bf3060b5e1c3d5034dd029a1f1.png)
![[Diagram]](../../diagrams/4/22546beae160bb1712f1482c5bdbc6ee.png)
![[Diagram]](../../diagrams/48/f74fe580a039ebed5285238d01232d94.png)
![[Diagram]](../../diagrams/38/d6d201db7c8264f4b08b59adf0758420.png)
![[Diagram]](../../diagrams/2/cb8adbac40170b274e4937452c427631.png)
![[Diagram]](../../diagrams/10/42c4f6a0599bd13866dc1db485362b5a.png)
![[Diagram]](../../diagrams/10/08af88d892f93935e9fa65156f2974af.png)
![[Diagram]](../../diagrams/44/63ec28d5fd91f62b1297cdca7cc80b35.png)
![[Diagram]](../../diagrams/8/6aac730d9e5d96deebf71c0a9f9607ec.png)
![[Diagram]](../../diagrams/37/67162c03a120d3cd78e29cd7a57f3dbe.png)
![[Diagram]](../../diagrams/5/83cb23945aa4086cf197cd1068d4d417.png)
![[Diagram]](../../diagrams/10/aa510241df52b8bf404e7d3693dca278.png)
![[Diagram]](../../diagrams/16/8928605f9f04079530ea001a7bdd1500.png)
![[Diagram]](../../diagrams/13/e34d56dfd40773d7490dca11c79ff78d.png)
![[Diagram]](../../diagrams/28/81525fd693b8f6761f384b17fa56d7c8.png)
![[Diagram]](../../diagrams/38/38d9d671d8dd6052b02b001d7bf0348a.png)
![[Diagram]](../../diagrams/52/25a2a5335d383f4d92369fee42f88952.png)
![[Diagram]](../../diagrams/35/442baefa7601db16e43a2d68fc25176d.png)
![[Diagram]](../../diagrams/8/a032fcf3def1f401ae0dac6b6b3ff34c.png)
![[Diagram]](../../diagrams/26/eaae8a982b5687b0034cf69166a94785.png)
![[Diagram]](../../diagrams/6/1b925aaf7dc44622327316b073e8f98a.png)
![[Diagram]](../../diagrams/3/4d118697b76c853ff7ff8858e9aea54c.png)
![[Diagram]](../../diagrams/35/d3253d6329d9766afb4d7bbecef0c196.png)
![[Diagram]](../../diagrams/14/69c8daf05c34ba55f059ce97ce28810f.png)
![[Diagram]](../../diagrams/36/ab315d2e8d813d1e2b2024936f179ed1.png)
![[Diagram]](../../diagrams/46/957005258b9e411dc0261ebcdd5b2cb5.png)
![[Diagram]](../../diagrams/39/6cb98e2665a0ee4855ecc0a2444ce6eb.png)
![[Diagram]](../../diagrams/38/65259bc1b6b5ae5f3d6e36f8f4bff4b4.png)
![[Diagram]](../../diagrams/41/3ab58ace5cd3ca0e786e2d681ab15c4b.png)
![[Diagram]](../../diagrams/28/eb47366ab6a9c12220583ed737d3c718.png)
![[Diagram]](../../diagrams/22/e20318920280000703d8c0be7c50bc2b.png)
![[Diagram]](../../diagrams/24/82137001a9b7ebe1d6ede48d72bae2c9.png)
![[Diagram]](../../diagrams/4/52c76348cafff7e66d0045a32044039c.png)
![[Diagram]](../../diagrams/29/77d69d424be42673b5ee76c4be54bf0b.png)
![[Diagram]](../../diagrams/35/864f2d8acca45e8c1449aa2939b101fb.png)
![[Diagram]](../../diagrams/23/9fab0bd9a898b52fbbd3b22be6be98ef.png)
![[Diagram]](../../diagrams/11/e3b4b2ee9fcd095f7da0e284551e8c2e.png)
![[Diagram]](../../diagrams/4/04c92286094c625ba6b124da48dc0034.png)
![[Diagram]](../../diagrams/41/5142ac8e730bac1103430cac125c4d20.png)
![[Diagram]](../../diagrams/39/2889c391a64a59fa65ce6bb68a57dbc2.png)
![[Diagram]](../../diagrams/18/4c3eee7130e3c3e12551648814f49e26.png)
![[Diagram]](../../diagrams/11/27dbea2e12ea2f5a3011f29946108ccb.png)
![[Diagram]](../../diagrams/43/c3bd55812e6b36b991935355ce5c8e88.png)
![[Diagram]](../../diagrams/10/726fe617330af4bf17821482f1c3f8dc.png)
![[Diagram]](../../diagrams/36/a8f18cbffbe1c50ada6768cd1b57645b.png)
![[Diagram]](../../diagrams/3/68300bd1a35fe8e7317481acb8bdcb9b.png)
![[Diagram]](../../diagrams/29/4a0b0f83411af9c661d05d076fd86188.png)
![[Diagram]](../../diagrams/27/baff895cfe5e4be71b1643a28b27d461.png)
![[Diagram]](../../diagrams/13/ef8bceb5abf971f5f69212c89fc216c7.png)
![[Diagram]](../../diagrams/51/f1792f145ac160371626fe3f5a8b0559.png)
![[Diagram]](../../diagrams/42/7f42414472d062cdcb3974b1057fd068.png)
![[Diagram]](../../diagrams/16/d50802528dc36cd8210bc004149ac1f6.png)
![[Diagram]](../../diagrams/52/747445b8270418314707df76da7e5184.png)
![[Diagram]](../../diagrams/35/cfd247850c9484e6be97bad82fe7e64f.png)
![[Diagram]](../../diagrams/18/4e638cc06caaf454585566693993447e.png)
![[Diagram]](../../diagrams/30/80fc2465118df206676db5c08b8d69e5.png)
![[Diagram]](../../diagrams/32/9d4f9c58fa22802a73e0bdde0649fa20.png)
![[Diagram]](../../diagrams/14/035659fd45ce480eea78446f2c143a1a.png)
![[Diagram]](../../diagrams/23/6d6886cc618bf74c7e9f923ffd183a97.png)
![[Diagram]](../../diagrams/30/1ac48f4676c5203e7823089a5146bace.png)
![[Diagram]](../../diagrams/12/776f36fe584c9169221fd2ccccf8fe30.png)
![[Diagram]](../../diagrams/28/de8de161c3d25ce4a2e2e60ec58c9a6f.png)
![[Diagram]](../../diagrams/37/eefc7dc192b517d12fc1060237d55a1c.png)
![[Diagram]](../../diagrams/29/28d48761e520b0a525fd77dd28f613e2.png)
![[Diagram]](../../diagrams/52/f91c73e67d8fe4197a150c86a3bd55fd.png)
![[Diagram]](../../diagrams/15/6f4c52b58cfa9cb0d2b59de22e59a763.png)
![[Diagram]](../../diagrams/5/e91bb7eb090cfd22ae0af318d182478e.png)
![[Diagram]](../../diagrams/28/e616ca002192f8c1ddd2b932a72843e2.png)
![[Diagram]](../../diagrams/18/952091e95b102dc1388200240066bc0f.png)
![[Diagram]](../../diagrams/20/94c4cff17df3a4f89580767bae70e036.png)
![[Diagram]](../../diagrams/2/884d1f3eb7438a2031996829a293d54b.png)
![[Diagram]](../../diagrams/0/89eba450cba6a2b5c5baf8b7b223dfaa.png)
![[Diagram]](../../diagrams/48/5010fe0b0f47dcd7862c1f66ffa1cab9.png)
![[Diagram]](../../diagrams/0/8004a1ba24fa1ab1b724ac3b7dc87365.png)
![[Diagram]](../../diagrams/9/eac78689c7e3a02390bacdde0f63eb99.png)
![[Diagram]](../../diagrams/18/5033e983dcd027542340962e8163d4ea.png)
![[Diagram]](../../diagrams/11/1d52a0ae0a7a2d92c9d44fd71671d9a4.png)
![[Diagram]](../../diagrams/51/cbc23e550ee5b1cb5d1055deebb35f69.png)
![[Diagram]](../../diagrams/51/944ee0516962c792d24bb89cf2f8f6c0.png)
![[Diagram]](../../diagrams/0/9facc7516c54f08f2adffddbba96aaa0.png)
![[Diagram]](../../diagrams/31/5edf022f4fe648e1e23eee6914ee8a94.png)
![[Diagram]](../../diagrams/22/436d91294f162816987a105ab94a3818.png)
![[Diagram]](../../diagrams/3/8e54d25303aa56f21db90076fdfea9dc.png)
![[Diagram]](../../diagrams/7/9e86f82e74c12518ce470ee28e527d4b.png)
![[Diagram]](../../diagrams/47/43b9641ed4332aae73d31eb0ea189d70.png)
![[Diagram]](../../diagrams/2/63dba7b28270cce75f7a8352139ed604.png)
![[Diagram]](../../diagrams/28/a2fc8e6d5bab3387f1c5962ec36d5d0d.png)
![[Diagram]](../../diagrams/27/8a4dd42f81b21b6b718aa8aea24be6d1.png)
![[Diagram]](../../diagrams/41/07cb41489f73008c7ed6844a4ac98df3.png)
![[Diagram]](../../diagrams/36/908341fdf901256bda6cef9c67188e3e.png)
![[Diagram]](../../diagrams/27/11dc554d21f75ad5aae6723252dded95.png)
![[Diagram]](../../diagrams/43/adfec8cea2f71636daa3fb0079f20e21.png)
![[Diagram]](../../diagrams/31/b9d3badc255d6f55e5841160eb8deadb.png)
![[Diagram]](../../diagrams/7/1d998c640e84717c6bdbb7836a270f05.png)
![[Diagram]](../../diagrams/42/f99b98afc07701ecb1ab8e8dbe39172a.png)
![[Diagram]](../../diagrams/8/3be0e6e6b4a35e9b38eaa776c636a500.png)
![[Diagram]](../../diagrams/47/fa52143eb03dad8f770ab99ef9a60bb6.png)
![[Diagram]](../../diagrams/32/4fae78af4985d843284366e0d4f1e91d.png)
![[Diagram]](../../diagrams/38/c74fda28f014814e6680ce28f369f271.png)
![[Diagram]](../../diagrams/7/6e897d642763817635b59a07a344857d.png)
![[Diagram]](../../diagrams/21/4050ab17eb5c762a0c7f68257711b101.png)
![[Diagram]](../../diagrams/43/2255beb6c55993612c67a438fae701bb.png)
![[Diagram]](../../diagrams/11/88d1e7a8c4ca948c37da195f2ec01161.png)
![[Diagram]](../../diagrams/27/0ad9abee2c53e22b1bfb0383db77cb9b.png)
![[Diagram]](../../diagrams/30/1cdc35a80059cd5b3f4db873093d60ad.png)
![[Diagram]](../../diagrams/8/4d479cd943e568379b51ef50632335ad.png)
![[Diagram]](../../diagrams/19/9551880f99aed8883073bde2283fa1d8.png)
![[Diagram]](../../diagrams/43/db48ca82fca3a7c98a890160704dce50.png)
![[Diagram]](../../diagrams/6/5c246cf3dd3cbb1305d60282a0e5279c.png)
![[Diagram]](../../diagrams/17/cc5bcb162a44b37d127761445676be59.png)
![[Diagram]](../../diagrams/43/3e00627172f5a30a9229e0e1c93a2309.png)
![[Diagram]](../../diagrams/51/f991ec592164f9fe35805aaf6dcdce12.png)
![[Diagram]](../../diagrams/28/60967229a9a791174b2924e341e30012.png)
![[Diagram]](../../diagrams/25/d26b32615b2c1f4b3e0b249e58cdeef8.png)
![[Diagram]](../../diagrams/29/1dafd3be314297f81aa0e6fc56954aef.png)
![[Diagram]](../../diagrams/41/a39114c0236d1ae23834aa47dcc0f72d.png)
![[Diagram]](../../diagrams/47/ce2f6bec7259509289ac8bcdf28d1cf9.png)
![[Diagram]](../../diagrams/44/2f97859d08f721e8aaba8735ccff8edb.png)
![[Diagram]](../../diagrams/18/dea5c9af8d475fae35094bf60b42927f.png)
![[Diagram]](../../diagrams/45/383a052c441191e5ef620a755e17e9cf.png)
![[Diagram]](../../diagrams/33/5422897b0e954694a091e456d280b773.png)
![[Diagram]](../../diagrams/21/2ed8751fd14a164694e9101401abb8eb.png)
![[Diagram]](../../diagrams/38/4d826478e6d57ecf9afe7d4e933111d4.png)
![[Diagram]](../../diagrams/26/2d923a994c6d75d8df1393853220fff8.png)
![[Diagram]](../../diagrams/40/5ed5eda147d0f91e4d1615c1c449f653.png)
![[Diagram]](../../diagrams/44/e1244117f58226eb8c162e75aa8c6632.png)
![[Diagram]](../../diagrams/50/dcb72a9dad20e8103b388e5eb4f0854a.png)
![[Diagram]](../../diagrams/51/eacfe6ea226c249bce16d0c5505912b7.png)
![[Diagram]](../../diagrams/49/829c758cdf3fad409cb122d5665619a1.png)
![[Diagram]](../../diagrams/10/0f07c1f283d985fd15464f1e01710311.png)
![[Diagram]](../../diagrams/38/857ba4e1f0f99de3fef117e29dc7c364.png)
![[Diagram]](../../diagrams/18/788ec65526f5db76caeb5b7674b3f948.png)
![[Diagram]](../../diagrams/4/6008192c2664f9835bc28203bc7eed39.png)
![[Diagram]](../../diagrams/25/4eab5ce9e72793ba2b7ace1e3a96ccc8.png)
![[Diagram]](../../diagrams/2/1b1b50789b864cc7f728a5ec75c7bdbf.png)
![[Diagram]](../../diagrams/13/1d7f36289deb927dc4125da8b42a9a51.png)
![[Diagram]](../../diagrams/0/beb798e79d14ea0dea3738d0978a7385.png)
![[Diagram]](../../diagrams/3/bfc9945935f7171d7420de52d09e5a93.png)
![[Diagram]](../../diagrams/19/5fc3f54d6999ac8f94b4538598cdda2c.png)
![[Diagram]](../../diagrams/31/7f854e4d941918fc2761a64b3c29ebd2.png)
![[Diagram]](../../diagrams/45/4de98adc70b4c52c17223679fe9b8916.png)
![[Diagram]](../../diagrams/52/6de2d749f6359491d3b7cd9cbc28758a.png)
![[Diagram]](../../diagrams/23/d0b090a2fce896e4a7b1afb353430917.png)
![[Diagram]](../../diagrams/44/4cb500a8b5d059a41b1d20cdc34a66af.png)
![[Diagram]](../../diagrams/14/542e2d1a348101c17362ded8e79457f5.png)
![[Diagram]](../../diagrams/29/ad8aa21fda7d70ac339284d0d64a63c2.png)
![[Diagram]](../../diagrams/46/171dba35d9d119685bafe6f2c1706d19.png)
![[Diagram]](../../diagrams/51/4e03aa67071583e7875351c1cea2247e.png)
![[Diagram]](../../diagrams/35/4d2cd7ffccdce687da417b54560247c8.png)
![[Diagram]](../../diagrams/44/3802a904aa9c68f6e278d28df8a53d4a.png)
![[Diagram]](../../diagrams/23/0f4460894a72ad8678e33afe302074c7.png)
![[Diagram]](../../diagrams/15/1c805c0758fc08fffa6bed71ca57b25e.png)
![[Diagram]](../../diagrams/15/5e4a4bba241827a8ccdb029cbf795953.png)
![[Diagram]](../../diagrams/29/9b0109c92e19999e1f5e32fb471e7b64.png)
![[Diagram]](../../diagrams/4/e1386d86127c0b4ba624d820b9f28cbf.png)
![[Diagram]](../../diagrams/39/083ace8a7be1ef5e7a03c6210b9f7292.png)
![[Diagram]](../../diagrams/28/03f38a64b2991954ce99d7296e2b9abd.png)
![[Diagram]](../../diagrams/40/93e34473354f758690eea49ae9e7f4f8.png)
![[Diagram]](../../diagrams/26/9721b543347bcfe9538ac854d1a14810.png)
![[Diagram]](../../diagrams/21/7c415abaa07bc3d491a05d373cea5936.png)
![[Diagram]](../../diagrams/0/5ba6ea5dda99a6d0c6e6161918e3bcf9.png)
![[Diagram]](../../diagrams/35/a70fb7b1c1b81f756435605c173205e2.png)
![[Diagram]](../../diagrams/51/cbc3ca66b3c08499d93e892c71ee0149.png)
![[Diagram]](../../diagrams/17/b9c6d1d58f6fab996912d419e2d1c346.png)
![[Diagram]](../../diagrams/4/ff9e73a32dd0b83f3b3bb68a46d0b3bc.png)
![[Diagram]](../../diagrams/31/d9f9c0116ec6935e050284329ff0ca08.png)
![[Diagram]](../../diagrams/41/6da705595e71fd6fba59552be7d7a8ff.png)
![[Diagram]](../../diagrams/49/b63dd74b029a873e2f7c7ccabaeda136.png)
![[Diagram]](../../diagrams/50/d2e20777c4695114f79bbf6d3f139a48.png)
![[Diagram]](../../diagrams/2/2d1807fbc31b496f85e5fa2552141df7.png)
![[Diagram]](../../diagrams/6/bf0d62e7532a3b2e90d4d00aeb117cd8.png)
![[Diagram]](../../diagrams/25/4f41a528f80a72c25a3dd98f3ecbdf4b.png)
![[Diagram]](../../diagrams/50/66408e4acebe415e4a5cbd0deef64f01.png)
![[Diagram]](../../diagrams/36/0788cc476e085beb5cdbbdc8db1401e3.png)
![[Diagram]](../../diagrams/48/76c6f87af73ac675fbe50f2298161047.png)
![[Diagram]](../../diagrams/42/2789dda89ce0a4df4116ce5c1ed1dcfe.png)
![[Diagram]](../../diagrams/14/b2ccecc1f9f7a1c88771b7bd8caccd28.png)
![[Diagram]](../../diagrams/18/342e4eaa1ed48b114be020e2160ace68.png)
![[Diagram]](../../diagrams/27/6dce3b3cc03f9a5555bf1e8fb032d46f.png)
![[Diagram]](../../diagrams/47/ee35ddf1daec27332d4d143e119598dc.png)
![[Diagram]](../../diagrams/36/5c8c127ba39307fb9435c871beeb4bc8.png)
![[Diagram]](../../diagrams/48/03c88b0cc6b6324da919f672bbbff380.png)
![[Diagram]](../../diagrams/34/98f47395e170f566916db228ff70b2cb.png)
![[Diagram]](../../diagrams/40/83bb05c1bf0aac963287a0ca1a92850e.png)
![[Diagram]](../../diagrams/16/503cfb3a65c297780f326ec880e74ef8.png)
![[Diagram]](../../diagrams/45/e6f6a9ed7004aa996983debef8719d4d.png)
![[Diagram]](../../diagrams/41/6b8030993046443ada8783b093a95565.png)
![[Diagram]](../../diagrams/30/67341393f98ee5cf811432241c1f63d2.png)
![[Diagram]](../../diagrams/16/2a663b6e020ee382fc6bb61cbaf52de5.png)
![[Diagram]](../../diagrams/24/038a7949d65a17f43d9eaa0d750445d0.png)
![[Diagram]](../../diagrams/28/d36054804db16dba5d1d5f4d3926db05.png)
![[Diagram]](../../diagrams/42/10f3ef1171beaa4885c1af6f981032e9.png)
![[Diagram]](../../diagrams/6/1ac3f1fb1bf18c844d13996bd5627417.png)
![[Diagram]](../../diagrams/51/b5a014c13950705002f125bc789a9810.png)
![[Diagram]](../../diagrams/25/7804a8eb89eacc4dddc2885e5d74931d.png)
![[Diagram]](../../diagrams/30/7d1117ca9205c4a663cee70d5e9f9a0d.png)
![[Diagram]](../../diagrams/32/78555b5ecda6c35677e71e4fa9c50f73.png)
![[Diagram]](../../diagrams/6/0d6f1dc3b1df123983976b17bfc70b7e.png)
![[Diagram]](../../diagrams/28/103faa174a37e67c446a60435c23caa8.png)
![[Diagram]](../../diagrams/28/8c8909abbe50612dc35664185e640bad.png)
![[Diagram]](../../diagrams/3/29083a7594871b40a9606885911b8bb8.png)
![[Diagram]](../../diagrams/44/13b2c51a36fb5a31208133fe826d78fa.png)
![[Diagram]](../../diagrams/36/a81c81135f58e2aa8de5c8d10e361e8a.png)
![[Diagram]](../../diagrams/7/aca6b6a7b01cf10551908fde23b7c6ae.png)
![[Diagram]](../../diagrams/36/93dcf531ca547313c7b769c57190d0fb.png)
![[Diagram]](../../diagrams/49/d252bac52caadff57add957a21cb243a.png)
![[Diagram]](../../diagrams/34/59778eb851887c157c124e0617d905cd.png)
![[Diagram]](../../diagrams/22/38fcc1a4361d770635c82a8f6802440b.png)
![[Diagram]](../../diagrams/1/3cf48774532a89c98481bda738ffc71d.png)
![[Diagram]](../../diagrams/24/0308e31a93e245c2f77ee9b4f5f73b5c.png)
![[Diagram]](../../diagrams/8/8d2119504bdcbb01978eedc791e4aaec.png)
![[Diagram]](../../diagrams/51/cc72be5e78eaf0952394d1611b0f3a41.png)
![[Diagram]](../../diagrams/18/83a8f036f8dfc7d7b84536f735ae3282.png)
![[Diagram]](../../diagrams/25/d5bff1cbe3d1e48e3897e8671c9df10a.png)
![[Diagram]](../../diagrams/33/4a12ffcdd523ca7baa85ea9afece7314.png)
![[Diagram]](../../diagrams/52/881aae4480bbbf053f8c2c303d103d60.png)
![[Diagram]](../../diagrams/3/aaf81d70caf96d906c030cce72b388d1.png)
![[Diagram]](../../diagrams/50/9ff8a418f27aa92e177e76c2c41a228e.png)
![[Diagram]](../../diagrams/34/7f4a4e97cdec4096461cf46806f466b1.png)
![[Diagram]](../../diagrams/12/2dfbb32adb07007271b22b514000882c.png)
![[Diagram]](../../diagrams/3/d9e5514a05c60a52d7e0f5b442dbeec6.png)
![[Diagram]](../../diagrams/51/26660310a337f806c8792b1b69942b6b.png)
![[Diagram]](../../diagrams/28/35632350aa6fd34d80aa5afbd3cdc121.png)
![[Diagram]](../../diagrams/5/55e1e300e927bf6a72d824ecf8624e7b.png)
![[Diagram]](../../diagrams/20/2c3cae69ce9adebbc4ee5bc0d045f3cb.png)
![[Diagram]](../../diagrams/34/a451d31da86e361b59afa8b983334b4b.png)
![[Diagram]](../../diagrams/49/bb82113a1b18244c9c7d4ad33352008d.png)
![[Diagram]](../../diagrams/13/5e75b80e3a13f2dfed467d8ef7573fae.png)
![[Diagram]](../../diagrams/14/597b6a7ece117c982cb33bbc12c60070.png)
![[Diagram]](../../diagrams/21/40c74e6d2bf8d6f3a8d107e476eade98.png)
![[Diagram]](../../diagrams/19/239c2fda53b732005b890a9acbbeb867.png)
![[Diagram]](../../diagrams/51/057e7501e5b403c04181b259a2b9cd24.png)
![[Diagram]](../../diagrams/31/40478e84bb45854e1acefcb7e0937030.png)
![[Diagram]](../../diagrams/20/9314ff1a4ee3747bec4e5add9604cc9d.png)
![[Diagram]](../../diagrams/47/bf5f9072e0527fba5050639ae31ccb14.png)
![[Diagram]](../../diagrams/39/6f6915fa9f901cf67b4df6d3ac2c40be.png)
![[Diagram]](../../diagrams/0/d7c0d697c69f51fc07e52dcdcbe1bb29.png)
![[Diagram]](../../diagrams/44/ef93a09307fd258c301b0f4d2f1fd28b.png)
![[Diagram]](../../diagrams/35/73062ce895948867437310582064ba98.png)
![[Diagram]](../../diagrams/48/36cf04e8bdaf2e092a2d4f850ea91f6e.png)
![[Diagram]](../../diagrams/38/a62f27595d2be014174126fb5f3d569e.png)
![[Diagram]](../../diagrams/21/b6f09bae3dd6f7243ff8710862238ef9.png)
![[Diagram]](../../diagrams/10/9fb5ee44ae78f1e7d301e89fbc9b6b5e.png)
![[Diagram]](../../diagrams/42/cbd13c449e255755ec004b9785027ce7.png)
![[Diagram]](../../diagrams/9/741da2aca8f2cf7c0f149e5217c4e04b.png)
![[Diagram]](../../diagrams/40/61d110e9de37bd9724774af909d25acb.png)
![[Diagram]](../../diagrams/44/fc84a3aeeab298e748dc824832fa0ce7.png)
![[Diagram]](../../diagrams/25/ea3db8ceefa346dde50b81ca70fe0581.png)
![[Diagram]](../../diagrams/50/41de19bd96dccf2acd6a1bb2e308fb0d.png)
![[Diagram]](../../diagrams/35/ca4bb0e866c59aefb5b08b2c8962b997.png)
![[Diagram]](../../diagrams/23/8cf90b754d4f67b3251209f2afe15d7e.png)
![[Diagram]](../../diagrams/15/26ca37b8df0d64f0ef043bb9a037c7b8.png)
![[Diagram]](../../diagrams/39/e0334d11999ccf56d80814c8e0ac5c57.png)
![[Diagram]](../../diagrams/15/566242bdb5cda8ad44322fe29a6bb8c5.png)
![[Diagram]](../../diagrams/2/bb7a0ab2add9bf0d8713b112d75c1b3e.png)
![[Diagram]](../../diagrams/32/2ec377c6ec9ec610ec591dde51187ea7.png)
![[Diagram]](../../diagrams/48/fc43f0aa5baa7d2b9c85f823ed35eafb.png)
![[Diagram]](../../diagrams/34/b5b8e11621bda8aa97970a47a1bedede.png)
![[Diagram]](../../diagrams/14/61ff84675248ae29cba0f483e4859b0c.png)
![[Diagram]](../../diagrams/11/82ea91935f43113ac9c6f7b967183d51.png)
![[Diagram]](../../diagrams/43/3df4f9c47d72084e2a9a72ca1b72e4ef.png)
![[Diagram]](../../diagrams/12/d30a150b45c8dd5308ce64df534db4cf.png)
![[Diagram]](../../diagrams/30/1c83dfdaa4e37e75fcc112d8312aa6d9.png)
![[Diagram]](../../diagrams/44/78b6abcb08aa252e3659c6975df99ac6.png)
![[Diagram]](../../diagrams/42/5db398c45f5c958b9097c06a440eceb9.png)
![[Diagram]](../../diagrams/19/974772288cd581d5cd657a0e60b0497f.png)
![[Diagram]](../../diagrams/15/2166b99aa46d81462ddf828b800070a6.png)
![[Diagram]](../../diagrams/29/64e126e58fd1ad7a6135125ef6236fe6.png)
![[Diagram]](../../diagrams/17/fa2ff48730aebb73c037168d736fb91a.png)
![[Diagram]](../../diagrams/14/31d573990b91ea465eb3ff239c9bd646.png)
![[Diagram]](../../diagrams/8/a8a2528f91a4f9673c19b1f815cb230d.png)
![[Diagram]](../../diagrams/42/ca626b6f02d30e6aaa71858b23674983.png)
![[Diagram]](../../diagrams/39/f3a682ef52457c80bc12b8b0f5260978.png)
![[Diagram]](../../diagrams/4/74a871da1a624bc37d29fea0cf66b5c5.png)
![[Diagram]](../../diagrams/12/ec14dfc7bf44afe2c28b6af69b26c734.png)
![[Diagram]](../../diagrams/3/d495c8b1ac184f12a4d0a2a4908685bd.png)
![[Diagram]](../../diagrams/8/3f382ab037480df3724aa59f219764c3.png)
![[Diagram]](../../diagrams/9/d84ceacd933d3b23fe0f3c33f6cff275.png)
![[Diagram]](../../diagrams/43/c7b1ea5c148426e85d5cee0e13be11db.png)
![[Diagram]](../../diagrams/50/ff7f6c05d849df4bea6b9ec716d8629b.png)
![[Diagram]](../../diagrams/32/ab83be887a34724c1b306834c726ba6d.png)
![[Diagram]](../../diagrams/24/acfc69c3bcb0ca21f88a7c9d7e0cae1a.png)
![[Diagram]](../../diagrams/23/bb42e55e7e6e2492249f8a5e21540a7b.png)
![[Diagram]](../../diagrams/13/b97b2504984ec6343f4223ea6125b232.png)
![[Diagram]](../../diagrams/30/7d58d9a2bac76ecfd322d2b5849776b0.png)
![[Diagram]](../../diagrams/14/5b21e290467941113437dbec33e2d442.png)
![[Diagram]](../../diagrams/51/d7af897b99d08246a5182e69679881a7.png)
![[Diagram]](../../diagrams/28/004149cb2bed7662febdce7975cb460f.png)
![[Diagram]](../../diagrams/44/5259112b93035f17cf1f9fb42b18a698.png)
![[Diagram]](../../diagrams/35/13813203cab0cafb0f4f865b95f0b940.png)
![[Diagram]](../../diagrams/28/53d0b417a6de56b2e4bab1449dcd0da2.png)
![[Diagram]](../../diagrams/19/55599cd29d8ab6d36330c0002d0e8927.png)
![[Diagram]](../../diagrams/50/0962c0020551dfdae0f25630c3d7b10a.png)
![[Diagram]](../../diagrams/43/4ea98823293c8757e685b0c2d67b696d.png)
![[Diagram]](../../diagrams/46/07788f6486c86720981d8fc13a61cdd3.png)
![[Diagram]](../../diagrams/46/b4ed88b8e887cbba824e3a6b0e313719.png)
![[Diagram]](../../diagrams/46/dc7872960af3422a703bc70bd76fd056.png)
![[Diagram]](../../diagrams/23/231f709068b674a641dfeb452da7cfa4.png)
![[Diagram]](../../diagrams/24/812fe9480adb5bc2574fa98344530241.png)
![[Diagram]](../../diagrams/12/9bd7c703d201871459daa94575ecf292.png)
![[Diagram]](../../diagrams/36/268d086665921a62939dc04cf9739481.png)
![[Diagram]](../../diagrams/23/f0a0db638f6cfe3d33f6d73e8b31fe95.png)
![[Diagram]](../../diagrams/38/c339fec1945c3f9a503b66f1298615b3.png)
![[Diagram]](../../diagrams/33/918c1ad7b2f37eac5ce89307939a331a.png)
![[Diagram]](../../diagrams/35/2cecfc92f634ee3174bc0f12a399a822.png)
![[Diagram]](../../diagrams/40/2d16ee07b1c711e5e0294155d0fab2e9.png)
![[Diagram]](../../diagrams/23/3350553dcccdb2102cddf487a11dc294.png)
![[Diagram]](../../diagrams/28/0e34222ee16c529c827b39491d516afd.png)
![[Diagram]](../../diagrams/28/31dc20838f0df815fe1c53711cfbd0a9.png)
![[Diagram]](../../diagrams/0/300f220643d15a9f398e81975a45abca.png)
![[Diagram]](../../diagrams/31/0cc97535a0ad055fa63d37a3c49b1e35.png)
![[Diagram]](../../diagrams/43/3a9c952caa987039a8bbf391dc2b4db9.png)
![[Diagram]](../../diagrams/38/b908f2b4f5e1d7a7ea2adfd28c1ef33d.png)
![[Diagram]](../../diagrams/52/96cbe5d2b2577a5a1127048a08cec60b.png)
![[Diagram]](../../diagrams/34/4f2d78e572a62de6cc0a5c68497077f4.png)
![[Diagram]](../../diagrams/3/c23f7aadd129c53d6a26f0df534a616d.png)
![[Diagram]](../../diagrams/44/8fdc7fd1164f873607764237323fa983.png)
![[Diagram]](../../diagrams/19/1be79b349187e3e48196029234c3e643.png)
![[Diagram]](../../diagrams/23/09e3c6309f235599c889f50b103d89a6.png)
![[Diagram]](../../diagrams/12/581163d8e6b90d2df2685d54ce9154d0.png)
![[Diagram]](../../diagrams/48/e070b204a54b63a74fd80243f5892703.png)
![[Diagram]](../../diagrams/32/30f76c56f1af84dc0c7c6d4da7c95b88.png)
![[Diagram]](../../diagrams/12/a3090c002edc23d92c8ccc90c62114ad.png)
![[Diagram]](../../diagrams/1/e16ce3e9a99676a517bd3264c9933d05.png)
![[Diagram]](../../diagrams/23/47d88ade5946d6de61d469481196d20d.png)
![[Diagram]](../../diagrams/22/f1ff3146a5844a74e8bb829177896692.png)
![[Diagram]](../../diagrams/28/70a7ca467c5a101138f6acb08a63a2cf.png)
![[Diagram]](../../diagrams/13/3915773a0452b5ff9a1d1df8c180fad1.png)
![[Diagram]](../../diagrams/34/a5a05848ea90193626e16554978cd4bf.png)
![[Diagram]](../../diagrams/6/06926b6443fae7745f080e049918199c.png)
![[Diagram]](../../diagrams/52/81c856ad6366f5e041ca309b351bbd80.png)
![[Diagram]](../../diagrams/30/aa19afa8757695af7deef7769089b2c7.png)
![[Diagram]](../../diagrams/4/060b4143c8d2fbc11878c7c97420937e.png)
![[Diagram]](../../diagrams/39/43d4e1c498fc7ff0ce4d83b788739c26.png)
![[Diagram]](../../diagrams/16/9e65be42dc54ae7455acf16666f87804.png)
![[Diagram]](../../diagrams/10/00a6b168d1339197d6f7550b980030ba.png)
![[Diagram]](../../diagrams/3/c09116065cb5896fabfec655a364b502.png)
![[Diagram]](../../diagrams/9/c6b59fdded467d9427f4405596fc5424.png)
![[Diagram]](../../diagrams/13/c3a021ab365ed256ca9fc1fd8f1f1eb4.png)
![[Diagram]](../../diagrams/9/179f80f04bc611dbac5ca22d0f5fd446.png)
![[Diagram]](../../diagrams/40/689cc2e651aab5ef053846ce3ba0ce6b.png)
![[Diagram]](../../diagrams/11/319746494b8f5b77f2ae6491b6a45a71.png)
![[Diagram]](../../diagrams/45/1c3c733ca37b5ff2c49026c105320527.png)
![[Diagram]](../../diagrams/11/a5956cbc5b4e3674c40a248c3208302a.png)
![[Diagram]](../../diagrams/4/9ac5834e24851b3c8a82687b51f510d9.png)
![[Diagram]](../../diagrams/33/6d926bcc5fc9e7aa57396ee7bdee10b0.png)
![[Diagram]](../../diagrams/23/fd43186d3ded896cf0d14b6d983a2640.png)
![[Diagram]](../../diagrams/29/0634bfb039014b851aa373acc8542a13.png)
![[Diagram]](../../diagrams/22/b42c5afaede8e7b10f0dd4be1d6821f7.png)
![[Diagram]](../../diagrams/7/80ab4bede08236d0785a73ad44b9ed64.png)
![[Diagram]](../../diagrams/8/a136d4325876fd716d6f862573b35099.png)
![[Diagram]](../../diagrams/15/4ba8e3461faf1b6b70cea80b6e08a275.png)
![[Diagram]](../../diagrams/5/4d0da99ed30ad56c43953cd3f7f8fd81.png)
![[Diagram]](../../diagrams/39/ba9b2d3c093bafe4e355b1d70062334b.png)
![[Diagram]](../../diagrams/19/22514aefe0f3df813c77f5859cc543e2.png)
![[Diagram]](../../diagrams/51/291a63c3118437401062892dda42b613.png)
![[Diagram]](../../diagrams/36/d3de0d1fd2e54ed623c3e408bd4c6da0.png)
![[Diagram]](../../diagrams/41/7b92a60121bac9af488eba5975a9393d.png)
![[Diagram]](../../diagrams/6/d7d764cd204c9bea7efda4521c64ee3d.png)
![[Diagram]](../../diagrams/39/c82b8e2dea3fe12c48dee1ad6a0db15d.png)
![[Diagram]](../../diagrams/4/8822810cf93422d0915767ee4528a8af.png)
![[Diagram]](../../diagrams/28/ca71754f28ed101d58c2430553a24917.png)
![[Diagram]](../../diagrams/46/6d0015b32f58155956f183e09211aef4.png)
![[Diagram]](../../diagrams/1/888d360883c6cab037a14b4e9fe2890a.png)
![[Diagram]](../../diagrams/51/d24fecf28cf676ec375b240295d02928.png)
![[Diagram]](../../diagrams/43/71cdce238ec89cdf8cad46fc88f20020.png)
![[Diagram]](../../diagrams/19/530b9126f6e2d652f41ffbfc30b3463a.png)
![[Diagram]](../../diagrams/21/bf49b44cb1df225e8e64bcc71d3b7afe.png)
![[Diagram]](../../diagrams/0/5e862ee0ff24095ebf759e7422a4d6df.png)
![[Diagram]](../../diagrams/21/77a53a497ddbbe9b02b549972128595a.png)
![[Diagram]](../../diagrams/31/34b80af53277bc7c1a83f13af795a750.png)
![[Diagram]](../../diagrams/19/d507f121199716a7bb1181c3d2b52b8d.png)
![[Diagram]](../../diagrams/31/0072f0618ac79eeb03304a5d87e1c1b9.png)
![[Diagram]](../../diagrams/22/3afc334090b156c8e84c405e0deddc8e.png)
![[Diagram]](../../diagrams/46/5fca6e5f5be5f895bf6a0f14d5264c37.png)
![[Diagram]](../../diagrams/31/fd7ae66a8fba7c89f5c8edee050bd242.png)
![[Diagram]](../../diagrams/33/23d59d3fbe58e2d1792c0f9d7fdd2728.png)
![[Diagram]](../../diagrams/44/bc34361345d8618f5d87b3bd360661e9.png)
![[Diagram]](../../diagrams/11/7cf2df5160879e14024c059843a016e9.png)
![[Diagram]](../../diagrams/27/8cdaf4b168d83804eaabc56877d3444c.png)
![[Diagram]](../../diagrams/23/47484f4e835ec86ba6828323cb8c5f95.png)
![[Diagram]](../../diagrams/3/2cdcbcd214a441698da3527beff4ab87.png)
![[Diagram]](../../diagrams/51/6bc454cb16a3e2d8ca703db50ac53916.png)
![[Diagram]](../../diagrams/20/6258a505eee4984fbcb3522e9da8d6af.png)
![[Diagram]](../../diagrams/22/c1c9146b6306b5055c7b8c13fe94be12.png)
![[Diagram]](../../diagrams/42/9fa821e89bc5ee1c0e74e01ce0c23ce3.png)
![[Diagram]](../../diagrams/6/1c2844b3b68a7a7b222bae19ce762b1a.png)
![[Diagram]](../../diagrams/17/383f06940a21bff6241af55443c8673c.png)
![[Diagram]](../../diagrams/29/460577a93b9ca8ac2bb83ea5e10308b7.png)
![[Diagram]](../../diagrams/15/791e050d6b21ca81b0b6a360d5840a7f.png)
![[Diagram]](../../diagrams/45/d4d52e7346f4a0e6fd570a3bd0b1780c.png)
![[Diagram]](../../diagrams/20/f98fce3759a2548a1fb30052c71f6edc.png)
![[Diagram]](../../diagrams/46/01bf0b8b4f5272e555690c7714379aeb.png)
![[Diagram]](../../diagrams/22/1db910c483e4faba86ac1ad31111c2ba.png)
![[Diagram]](../../diagrams/46/57a8d72c17b302d2c5440721ac4ecb8c.png)
![[Diagram]](../../diagrams/12/93d2c7bf2c118c3873c3087228c48e22.png)
![[Diagram]](../../diagrams/45/c9d5595d1d80451b6a5695536a04af1d.png)
![[Diagram]](../../diagrams/43/4e1ebd5b7a86e48eed75ba888c2ced8f.png)
![[Diagram]](../../diagrams/47/f150512c3d8e9205dc980ae983a877fd.png)
![[Diagram]](../../diagrams/49/a5a4b6e6a83583e360828bd14d4b0361.png)
![[Diagram]](../../diagrams/49/a34edadd955f0c542d8df5d2b2404b92.png)
![[Diagram]](../../diagrams/4/6c8e9272e333c29ca375541caaacdce8.png)
![[Diagram]](../../diagrams/38/46f790b019d04eeef00354cf79513d99.png)
![[Diagram]](../../diagrams/39/8602d09aa0f181e507fddbeeee782a6a.png)
![[Diagram]](../../diagrams/14/222d08142e4d189646dc266a5c459997.png)
![[Diagram]](../../diagrams/42/01c8cb036c7854f460d96ad563104088.png)
![[Diagram]](../../diagrams/24/51f016dc9cbd5068581cf5710a494fed.png)
![[Diagram]](../../diagrams/17/35013d22a521eddba8de24045358babe.png)
![[Diagram]](../../diagrams/45/3d58e449ce010a9b29a884c555033e28.png)
![[Diagram]](../../diagrams/48/a3355cd06694c87fa212942bfb496912.png)
![[Diagram]](../../diagrams/5/0b71bf90f5097e5829f38078b64c9202.png)
![[Diagram]](../../diagrams/12/1ac4f51bb62d13af20bd32dfe7aae66c.png)
![[Diagram]](../../diagrams/12/45cf7530628da0f46bd468621ddf098a.png)
![[Diagram]](../../diagrams/13/b088fa20b81b14dcf417418c1729aec8.png)
![[Diagram]](../../diagrams/48/e0eb996d546216c7ab768c67877bd32c.png)
![[Diagram]](../../diagrams/36/1b1106bdc6f29fa1d45029c618839f06.png)
![[Diagram]](../../diagrams/31/f8baa47b1e9a649944352bedc7321a8f.png)
![[Diagram]](../../diagrams/42/88fa37b8c3e3ab87bfe7e762f8071b06.png)
![[Diagram]](../../diagrams/5/0088a4364bfc703866e5f987ebddf42b.png)
![[Diagram]](../../diagrams/9/b0f0366ecf035317e5d25209412a3c7c.png)
![[Diagram]](../../diagrams/28/2ef4e0730729c6b824c54c05dd812c06.png)
![[Diagram]](../../diagrams/5/ee6df5a33b982d08a6fdb0543dd101fa.png)
![[Diagram]](../../diagrams/35/32648c2f31408c953fb9cc720d5fa940.png)
![[Diagram]](../../diagrams/48/b64ea47f51460627fbfa876634f5e216.png)
![[Diagram]](../../diagrams/26/dfe19397a78585e061796a01b52d228a.png)
![[Diagram]](../../diagrams/30/f6e72e8b11413062a8e3acc297d3f5c0.png)
![[Diagram]](../../diagrams/46/111c2490a0bca0df784558c58393527d.png)
![[Diagram]](../../diagrams/41/97142fe480c80a1ef82910a13a2e5712.png)
![[Diagram]](../../diagrams/21/7f21018c2914bc8a6f1e3c37ae2dcbe0.png)
![[Diagram]](../../diagrams/13/ebed77a555692296186764b6cfa7af9e.png)
![[Diagram]](../../diagrams/10/7b4f4e08746bff573b6144424cf7bf00.png)
![[Diagram]](../../diagrams/37/e090ff217b1eef5bd7a9918e7e9b7c12.png)
![[Diagram]](../../diagrams/5/5d70fc790d358861832cd815863bacdd.png)
![[Diagram]](../../diagrams/11/20136f854cc515b1f5d376fff451e102.png)
![[Diagram]](../../diagrams/8/a3e5febbba28602204408b2f9bd0607b.png)
![[Diagram]](../../diagrams/10/f28552d9257eff73b7c864daf2ca0223.png)
![[Diagram]](../../diagrams/20/2bb166664e67bab9b33b85e562bc7842.png)
![[Diagram]](../../diagrams/17/fd00e6d2293a92a27b8f1c3f6d5c2eb8.png)
![[Diagram]](../../diagrams/43/ba8f08d9ebb2558a4971525bc62d2660.png)
![[Diagram]](../../diagrams/30/f6bfa4c35e88145395d98144db725824.png)
![[Diagram]](../../diagrams/3/c32804ebdcdf3c7cf8c3bddcbee1a63a.png)
![[Diagram]](../../diagrams/14/cfabc284f4fb24db23c596c0b45ad130.png)
![[Diagram]](../../diagrams/39/7a0e15003dfc9ec7b3b07d3609ef8b31.png)
![[Diagram]](../../diagrams/37/fc6b0452755773394e73a6dd71f345e9.png)
![[Diagram]](../../diagrams/18/0a6c0b0787070ff67ea00c62a6e51e47.png)
![[Diagram]](../../diagrams/40/9628529629e3c34758b7b3ee15211ac4.png)
![[Diagram]](../../diagrams/49/ab18bebfa12d87637a2bfa9b1dfa3c90.png)
![[Diagram]](../../diagrams/49/d0d2db9985c15a78602f8af35c81a52d.png)
![[Diagram]](../../diagrams/26/db382a37c927cb8b89a0408f6c344464.png)
![[Diagram]](../../diagrams/49/e09c771ba943a45ae33fb3d871735d8a.png)
![[Diagram]](../../diagrams/25/740e41c51d317f8c666dc13f3a9c3e35.png)
![[Diagram]](../../diagrams/0/1cb10b12ad29d237b6d58b504fab49a2.png)
![[Diagram]](../../diagrams/26/2c06883fd7c7e824789edd76662a40cd.png)
![[Diagram]](../../diagrams/8/7bb9615e97df571815256a26a4898d68.png)
![[Diagram]](../../diagrams/45/956ba3b473c550f3a493b4762afcaace.png)
![[Diagram]](../../diagrams/11/5cb094a51de99eea5b654a620377136f.png)
![[Diagram]](../../diagrams/26/0f915f9ff99afed80f09df07ce91f1bb.png)
![[Diagram]](../../diagrams/46/e9368abcf0535f837912151e55ceb2b3.png)
![[Diagram]](../../diagrams/13/5fbb2e0762d97e3d1f11fb5505cb307f.png)
![[Diagram]](../../diagrams/1/86a0342686c8f927e170851e5d38e26c.png)
![[Diagram]](../../diagrams/33/1b5bb2c5b41662bf38c3ddf3a9dcf5ed.png)
![[Diagram]](../../diagrams/22/03ffb38173ddc0667d57b85172f571b5.png)
![[Diagram]](../../diagrams/49/89be6ac3ad6ff8cb52fc56274352acbf.png)
![[Diagram]](../../diagrams/47/565949c907e3eafb75f2225cb0b04c1b.png)
![[Diagram]](../../diagrams/44/782cfe31b73ad2d935ffb2cd2a949b51.png)
![[Diagram]](../../diagrams/32/1fa202db689d90d41a624f6ccb68582e.png)
![[Diagram]](../../diagrams/51/ebaf47f24f1b412381e91ae2d2e5126b.png)
![[Diagram]](../../diagrams/35/b4a3290e72b148326ecdc54558cd58a1.png)
![[Diagram]](../../diagrams/5/2a24f33c9660bf6729b900927339878b.png)
![[Diagram]](../../diagrams/18/1e90320c5b3a51c4309f7c81664c607e.png)
![[Diagram]](../../diagrams/50/9c83c0a1f34ee1157dc47b7049ae9401.png)
![[Diagram]](../../diagrams/44/276013bc78b15fc2db355aa3a73c0bbf.png)
![[Diagram]](../../diagrams/17/ac7dbf6470c038efcf2f0fd9954227a0.png)
![[Diagram]](../../diagrams/39/79f7d2835189754f8f065b9f01a6b3b1.png)
![[Diagram]](../../diagrams/44/51f283000de6912604601e0a476c009c.png)
![[Diagram]](../../diagrams/31/713af262ef698a9e65f8bebc10e19a89.png)
![[Diagram]](../../diagrams/0/8feea09187a9e98fa4135a87a4971384.png)
![[Diagram]](../../diagrams/30/48b0f127f82307dac9e0ee05a582e649.png)
![[Diagram]](../../diagrams/32/5aeeb2fb9042f300e23d62b39b0873d3.png)
![[Diagram]](../../diagrams/41/d8b66feafbca0a2a53d6fd8b58e21056.png)
![[Diagram]](../../diagrams/25/a060205639b2057bdf7af43f766e5465.png)
![[Diagram]](../../diagrams/19/c91284ac7b400d645fb3423036149e4b.png)
![[Diagram]](../../diagrams/33/3d6a0793d8daa9734077a151020df042.png)
![[Diagram]](../../diagrams/18/174b281b87a54c9fe0908c85b714da5d.png)
![[Diagram]](../../diagrams/51/8df97abc55001d8071cd6e7e16b37c16.png)
![[Diagram]](../../diagrams/2/f8ce3b8ab18ad16efea2981ac6d7badf.png)
![[Diagram]](../../diagrams/21/5d9315fe3b53b552e9e15f801b7540db.png)
![[Diagram]](../../diagrams/47/30846ab09e1f769258f236a18200292d.png)
![[Diagram]](../../diagrams/14/b654657256e110223a29a20a63918500.png)
![[Diagram]](../../diagrams/41/4923bd5d92b62706bd0d508e4c22fe30.png)
![[Diagram]](../../diagrams/34/94a3e6b89608b757565aa42b03e2216b.png)
![[Diagram]](../../diagrams/3/557852200ff265fda98d5675927e30a0.png)
![[Diagram]](../../diagrams/13/0fdc5734b86ea7685a184e83d425ccd7.png)
![[Diagram]](../../diagrams/37/ae15863eee22be7d398459e2695c33b4.png)
![[Diagram]](../../diagrams/31/a90183ca4486e616cd6803b7236b6211.png)
![[Diagram]](../../diagrams/10/eb55f7d849d38e2ca887700166b03cf5.png)
![[Diagram]](../../diagrams/11/b4828ee632845d430a1ca7d8e840c8f7.png)
![[Diagram]](../../diagrams/28/2ab5ae4c73cc48e14f9d584963ca6ec5.png)
![[Diagram]](../../diagrams/41/48a7e64533920f271e408993c6746a70.png)
![[Diagram]](../../diagrams/0/3c87b17036683b338aaccd4ef113db4c.png)
![[Diagram]](../../diagrams/44/eebedeefa8b6d5b7df65669988e21d17.png)
![[Diagram]](../../diagrams/11/dc8d9ef6109956d919f41052ce560f91.png)
![[Diagram]](../../diagrams/20/9ff02bf992f26ea2fea4ca0e9ad2695e.png)
![[Diagram]](../../diagrams/37/b39b5e05a349ede0fc87434d6d202c0e.png)
![[Diagram]](../../diagrams/7/bcb5b00842fe62568200e27429ae64e0.png)
![[Diagram]](../../diagrams/36/2f1ef4232aa66b2f53a2d37dd14398da.png)
![[Diagram]](../../diagrams/2/53079901a5f9badd5c6c7c11bc62f644.png)
![[Diagram]](../../diagrams/45/eea96d58e05e2d60d01e16ac43a8bba0.png)
![[Diagram]](../../diagrams/25/74ff44253910841e8a76d79d16f07dcc.png)
![[Diagram]](../../diagrams/27/17697c9ee6591c859c2c119edf8aa16c.png)
![[Diagram]](../../diagrams/50/ac06126cd35ed96ba7b471858d6adab3.png)
![[Diagram]](../../diagrams/49/5246e8fdf2bd9f4daa947376ba42effa.png)
![[Diagram]](../../diagrams/23/844f3ae8269ef610c844d04f26fccd15.png)
![[Diagram]](../../diagrams/45/076701e85fc7f24c0cac0a1cbcaa64a9.png)
![[Diagram]](../../diagrams/6/475a9d72a48b18fffff536b14f841100.png)
![[Diagram]](../../diagrams/21/b5485e22b152002c44c5720c51e973ac.png)
![[Diagram]](../../diagrams/13/304ac27e4733e0d2617b523251c44871.png)
![[Diagram]](../../diagrams/44/cc485b8e746706cac46e22c8dcb788b5.png)
![[Diagram]](../../diagrams/31/108fc0045f533d24075549fcb0cd5ee2.png)
![[Diagram]](../../diagrams/17/cf4b40ff269a638da3dc48712bfd6639.png)
![[Diagram]](../../diagrams/45/a4a7e75dd1febdbfc83c0f73047f0727.png)
![[Diagram]](../../diagrams/6/502b50f774c62e66a54c49f6244c3cb2.png)
![[Diagram]](../../diagrams/39/c2928061ab3bf5660c2534ab296beb26.png)
![[Diagram]](../../diagrams/11/d8b1606c6e6ab82dee14e6f5565d3528.png)
![[Diagram]](../../diagrams/52/77b4e78b39277495005e69c12bf0d760.png)
![[Diagram]](../../diagrams/26/f2ef195f82001f61588fb49adef61eaf.png)
![[Diagram]](../../diagrams/10/b06ffa2a6ec53e9f79455d439193d216.png)
![[Diagram]](../../diagrams/41/98c35cb7e5ad7dbe8de9d57150ca3984.png)
![[Diagram]](../../diagrams/44/bc5d0a75ceb651c1a67d886b81169df4.png)
![[Diagram]](../../diagrams/48/6ada9c6dc19667475264a330b2fbe007.png)
![[Diagram]](../../diagrams/36/1c5deb736d29faeadc021381b8149095.png)
![[Diagram]](../../diagrams/49/07770e15966bdddbb8655370026015c8.png)
![[Diagram]](../../diagrams/39/b5e08db521f216551ead3aae617a2864.png)
![[Diagram]](../../diagrams/41/4dfc1a916fa2554632015a906ba1302c.png)
![[Diagram]](../../diagrams/28/f9164ba0ba9ef195c43d0a136cf277df.png)
![[Diagram]](../../diagrams/44/b9ad62c2a8dd8bf3cc20a34969a0bb55.png)
![[Diagram]](../../diagrams/33/7e5bcac1b827c0d6a81c85651c2597fc.png)
![[Diagram]](../../diagrams/38/29f6fe8109da489069dc7888d3c3647d.png)
![[Diagram]](../../diagrams/17/27ef777e6a5338118c1e30d14cd114ea.png)
![[Diagram]](../../diagrams/47/c26e595c5a37204c7de3df4a20bcc9d7.png)
![[Diagram]](../../diagrams/14/1d764d5851b5f66c7553f9a580f4c17e.png)
![[Diagram]](../../diagrams/42/5261586562013056ffcf3d7008462630.png)
![[Diagram]](../../diagrams/46/c4754f0a121d22d201418a881b0e277b.png)
![[Diagram]](../../diagrams/49/87504fdf422583d205cefc303934524b.png)
![[Diagram]](../../diagrams/46/cee1073d0b0b392ef35cf6ad665d3ed6.png)
![[Diagram]](../../diagrams/4/34b2b3a2d2eb334eb19c51605e7752ae.png)
![[Diagram]](../../diagrams/42/f0c3528f67d28d2bf8789b02c51786d2.png)
![[Diagram]](../../diagrams/27/c4bdce85b1ed81595f7d8e05eee3af71.png)
![[Diagram]](../../diagrams/26/8f629021bcf6b94314a283487db8f5e3.png)
![[Diagram]](../../diagrams/19/4ca44d493f66982a136e178358a3192c.png)
![[Diagram]](../../diagrams/11/dd1b5cdad373f24ecadcc149535e2306.png)
![[Diagram]](../../diagrams/4/670f89a3bdc28fceea3811ac4688a465.png)
![[Diagram]](../../diagrams/50/810bc7d1d41d4bbce0854b83c03b5e93.png)
![[Diagram]](../../diagrams/17/dd5f71e6538f56dc17da50e8f7a1a75a.png)
![[Diagram]](../../diagrams/2/d0286c8aca5aab8b2147cd0dec19228d.png)
![[Diagram]](../../diagrams/1/7788e038d62350bc0c8201d4777132d0.png)
![[Diagram]](../../diagrams/6/b162c2eff44c6d6673548ce3dd4ade88.png)
![[Diagram]](../../diagrams/16/152b1deaf32b5cb60bd9df31e0083973.png)
![[Diagram]](../../diagrams/30/5aaed38f5e24d2a15b42a9fa2d9e1932.png)
![[Diagram]](../../diagrams/28/c0af17d4dfacab1cc9bdb6791f2db656.png)
![[Diagram]](../../diagrams/2/14cdd622641e0c8c1444c49834edc4e8.png)
![[Diagram]](../../diagrams/47/b1fd53c80fa82d8fb11db4704deade03.png)
![[Diagram]](../../diagrams/16/9a0faff7a816e56c0faad5748a4f1f18.png)
![[Diagram]](../../diagrams/46/0726c5769fa326274181db76fb70225e.png)
![[Diagram]](../../diagrams/34/21b3d4ebabb7fc9d3b5d7be04bc7d7fc.png)
![[Diagram]](../../diagrams/20/43ff395bb9d5c0ba2a1ff01235f78c35.png)
![[Diagram]](../../diagrams/13/7839134738728a634d53910cc11a3b53.png)
![[Diagram]](../../diagrams/11/c5789bb1e2c2c8644b232e7af2189104.png)
![[Diagram]](../../diagrams/22/dd31e4beebe4f93b17bf659324699153.png)
![[Diagram]](../../diagrams/9/e18b8a117ffcc8605b1125c14c9e54de.png)
![[Diagram]](../../diagrams/45/821f815b16e15b88be9405dd9a1f0873.png)
![[Diagram]](../../diagrams/10/9b73564639f42a71d72c666b4193f2ef.png)
![[Diagram]](../../diagrams/25/bcd012d72bc0124d71ff7238b02b6d33.png)
![[Diagram]](../../diagrams/33/f410edb4d0c12ad4482aa6154e6a956f.png)
![[Diagram]](../../diagrams/41/3653d58844b0097851cf87360e368e48.png)
![[Diagram]](../../diagrams/9/75ff257e5b2336acfdade34db1279916.png)
![[Diagram]](../../diagrams/42/d26f14f9054e2f7dca6af5e1ce73ca48.png)
![[Diagram]](../../diagrams/43/46c6d01442cccbaa74575e720d24d74d.png)
![[Diagram]](../../diagrams/44/2539a191ebc947afc5497fbf857ecbf7.png)
![[Diagram]](../../diagrams/19/c2fa82978c6639ce438b5ee3306d53a6.png)
![[Diagram]](../../diagrams/10/a09196aee13d446290558f110594b911.png)
![[Diagram]](../../diagrams/22/50d0c94c59e34f71e9c35f1209f3a7e1.png)
![[Diagram]](../../diagrams/48/a39409917810624ad42f332e3593223d.png)
![[Diagram]](../../diagrams/39/f20f8cadc07c99dd4144d1e30bf684ca.png)
![[Diagram]](../../diagrams/5/3088eb5fb034b476e655e06a930dfa50.png)
![[Diagram]](../../diagrams/9/251274510f08d9c148fb575c97e07082.png)
![[Diagram]](../../diagrams/32/7157ca4ff7fbd25eab7c514bc52cee5b.png)
![[Diagram]](../../diagrams/41/468f7e976fb42cc87e63dcf7e5a48fd4.png)
![[Diagram]](../../diagrams/51/35d82fe1ae9f59d74e317d77cc69be7c.png)
![[Diagram]](../../diagrams/22/32650a7b1f8ce960261cf3ba67928f9d.png)
![[Diagram]](../../diagrams/43/7f2353721a9390f7f1bb4697fe8aa949.png)
![[Diagram]](../../diagrams/5/2790ab51ef2216225140ad69a367d0f5.png)
![[Diagram]](../../diagrams/50/4895b2bac2614f77a2676bee76081297.png)
![[Diagram]](../../diagrams/7/9e3ba7b5c5b5bb756bf09962b1a9df5e.png)
![[Diagram]](../../diagrams/19/86d62e2494b1623e020f9c0b2d06ba1e.png)
![[Diagram]](../../diagrams/21/a4cb8097c6b44c4947d2236c6e7e2fa0.png)
![[Diagram]](../../diagrams/26/fe8b77576bc2f345ec72c95e43dda0c7.png)
![[Diagram]](../../diagrams/24/b3c25184699eacadbd08d7c8ea78d684.png)
![[Diagram]](../../diagrams/36/d38e5a3a25e9efc7715fe04e465f8cf2.png)
![[Diagram]](../../diagrams/35/a7203b24563553f22e542003e74b99d6.png)
![[Diagram]](../../diagrams/4/650363676d2869f01d28e0e92637187f.png)
![[Diagram]](../../diagrams/24/eb64b1300fc8ecb0d913443cfba3c330.png)
![[Diagram]](../../diagrams/11/d3b1fcc9ab14b9f35a04b532e64512ee.png)
![[Diagram]](../../diagrams/28/933296032133431487459a2ffcc87a28.png)
![[Diagram]](../../diagrams/51/e66eecdd9e0d3df66fec86f919e7263e.png)
![[Diagram]](../../diagrams/34/95977fd585b660b47e372f422b9bb8fd.png)
![[Diagram]](../../diagrams/48/35a3eb1bf1c572a20a88bddeb96fbfcb.png)
![[Diagram]](../../diagrams/22/89aa1fd1541f1fba52a42431c9f3d138.png)
![[Diagram]](../../diagrams/30/64a16fea6adb6839d8345c52674226b3.png)
![[Diagram]](../../diagrams/44/0be0c59b57beea5f670181ef6559bcd4.png)
![[Diagram]](../../diagrams/19/78038b022c87a0f876c85f866e9843b1.png)
![[Diagram]](../../diagrams/46/2ebad1b760d95c34660d6771426c1c8a.png)
![[Diagram]](../../diagrams/37/338b07c8a952dfe33f566c09584c3376.png)
![[Diagram]](../../diagrams/34/f606cf14632fb0d71833b2f9eeaf7f4f.png)
![[Diagram]](../../diagrams/21/15675d731f65b116438ea71f528b5c67.png)
![[Diagram]](../../diagrams/47/04c2767dcae764b613d39a3d0054c9a9.png)
![[Diagram]](../../diagrams/15/fec3247539fa4b843d4389a2dc713894.png)
![[Diagram]](../../diagrams/15/730794232c1918b51b279d42584ac58b.png)
![[Diagram]](../../diagrams/10/a1c8147051abd538c3b7d837aeb44bf4.png)
![[Diagram]](../../diagrams/30/0d8c80a783bc94156c58bb0bf7fd464d.png)
![[Diagram]](../../diagrams/20/4b904a73c4e5e1e23875ab9aa7cccdc8.png)
![[Diagram]](../../diagrams/16/5f4122def248d48838454b5e8faf6452.png)
![[Diagram]](../../diagrams/2/9964c293c147edbba6dfe9e6c773e8e9.png)
![[Diagram]](../../diagrams/14/2dd5a4185f381e03191b8279a3e0bb85.png)
![[Diagram]](../../diagrams/33/c47fd0255afc8040db976a5669d3ed8c.png)
![[Diagram]](../../diagrams/15/c980038ce73e2d11a727477684c17c40.png)
![[Diagram]](../../diagrams/7/8409af4d0061d304f9feae9f975d1a46.png)
![[Diagram]](../../diagrams/8/fb27fac81ad397439f0af864f8a89cfa.png)
![[Diagram]](../../diagrams/27/c5beb9c3da012de2341d58764d1ae615.png)
![[Diagram]](../../diagrams/6/ecc15325cdb53cfbc87e43e61effd0ce.png)
![[Diagram]](../../diagrams/31/ac8341101ac508ed6384cb2f438c2756.png)
![[Diagram]](../../diagrams/17/fb9b03e8474148713111fbdbd9ba5ad1.png)
![[Diagram]](../../diagrams/41/5fd960aeb3a4790e1914e116dca29151.png)
![[Diagram]](../../diagrams/18/5eb9fc989a3bb000e695c6378fa1898f.png)
![[Diagram]](../../diagrams/42/d271128c47847aa70870cbb00744304d.png)
![[Diagram]](../../diagrams/14/211577419373b0ec689ddf74d5de680c.png)
![[Diagram]](../../diagrams/36/8d5a662ef2d5d6cb4459999acc975d8b.png)
![[Diagram]](../../diagrams/39/6c0c3456f07ce28d3f88e42be9b67b21.png)
![[Diagram]](../../diagrams/12/aa5df0baf2c5d6eb296a47e0dec7651f.png)
![[Diagram]](../../diagrams/24/3c78ea2b6a483177abfdc0966705e3bb.png)
![[Diagram]](../../diagrams/9/3de90c86c990975b7b8539140104746f.png)
![[Diagram]](../../diagrams/10/ae0fc62fc8223cd74c52731bd4b9a4ba.png)
![[Diagram]](../../diagrams/24/109ea9395c9e3b3909ea9cfd2e4deb0c.png)
![[Diagram]](../../diagrams/38/f88454e632bc9faadf967a2d357c53ac.png)
![[Diagram]](../../diagrams/41/b00ae37f5efeb40a247d866bcc59c38c.png)
![[Diagram]](../../diagrams/35/234a1cf7ea8c8d2a63c685d6025f56b3.png)
![[Diagram]](../../diagrams/42/6db7859d9339938c6b6f922c165d9578.png)
![[Diagram]](../../diagrams/48/db8b8de827ceb610599e97cb263fad47.png)
![[Diagram]](../../diagrams/3/14806a6514dfa45c8d5b7ff777cb42b6.png)
![[Diagram]](../../diagrams/50/7880ca060a612a894c7535bef07ff002.png)
![[Diagram]](../../diagrams/33/05aaba0ebebb4aa5c5a1df3ee0fa1be1.png)
![[Diagram]](../../diagrams/1/8285d886f5f712852a20460843f6bb51.png)
![[Diagram]](../../diagrams/25/e98fc387ca548171db7894de5aba18f6.png)
![[Diagram]](../../diagrams/38/8ff6ba3fdb6bc44fea5d7117ac0e30a3.png)
![[Diagram]](../../diagrams/21/3024fa297d9c574230d3fd906d77814f.png)
![[Diagram]](../../diagrams/49/b444c270c8b36364fb9140a276fc69d4.png)
![[Diagram]](../../diagrams/9/bbf157fe063743af7aeeb4212613a673.png)
![[Diagram]](../../diagrams/10/702331892d50383f8f4870a16f215bc4.png)
![[Diagram]](../../diagrams/18/a4bd31e635463b931c7db0b13215006f.png)
![[Diagram]](../../diagrams/50/c9f3149a545e4c788dcfc13744000804.png)
![[Diagram]](../../diagrams/21/a7a2d601bedda0d66070f349316d54ce.png)
![[Diagram]](../../diagrams/21/979f52b6290a731696dac3b5593f8c58.png)
![[Diagram]](../../diagrams/8/c55911d44f8040d66bd362b6f847c667.png)
![[Diagram]](../../diagrams/32/4d624f3d5fc9b355aae411f4fd2c65c8.png)
![[Diagram]](../../diagrams/15/d6100254e74d5d9e95afbb54c894957a.png)
![[Diagram]](../../diagrams/50/9ecb039f217cdbaefb22c7b0b3f51bbe.png)
![[Diagram]](../../diagrams/23/4ae1c191300a506fe2ecd500cbcec757.png)
![[Diagram]](../../diagrams/6/0040a130df91d470927bd0a6ea3fb5bc.png)
![[Diagram]](../../diagrams/12/e19c2256f7f8faa9244fb16abe8370a5.png)
![[Diagram]](../../diagrams/3/5b5658c6c9b720ab1033d8fd900c124b.png)
![[Diagram]](../../diagrams/47/72e5d7e6184d4abd9bb53c3a055e189d.png)
![[Diagram]](../../diagrams/27/635d714e10b628903348d7a5f2685723.png)
![[Diagram]](../../diagrams/1/31205019a1211c2b23ddc0ebddf725df.png)
![[Diagram]](../../diagrams/47/99cbc63bbb1a00d69ba64168b0e6d45a.png)
![[Diagram]](../../diagrams/29/194151672bd5216b74b2451b48876a3a.png)
![[Diagram]](../../diagrams/18/459e0ddb80d37839e960e2ab6162a9dd.png)
![[Diagram]](../../diagrams/31/c3cfe0724ce013fcf6b3511d88957a58.png)
![[Diagram]](../../diagrams/46/4aaaeb932ce15ee8ca871d3e87da32f6.png)
![[Diagram]](../../diagrams/17/3b12f7c0d221f3b6eb4c01910ddd3ab3.png)
![[Diagram]](../../diagrams/2/4d69b29335ca3a77dafec4409298f265.png)
![[Diagram]](../../diagrams/46/c5185845a7bcb92d402cf60fd3d72afb.png)
![[Diagram]](../../diagrams/43/5cbbd99f7ee4323c3aa5da46b0b8710d.png)
![[Diagram]](../../diagrams/34/fccb08ebc16e92506cff621b845edea8.png)
![[Diagram]](../../diagrams/52/fdd68d1d909d8909a902d310b0960316.png)
![[Diagram]](../../diagrams/30/ac7d029609462d443a390d3c3ee3cd26.png)
![[Diagram]](../../diagrams/4/aeb002881879d5b939c2290a7e993ba4.png)
![[Diagram]](../../diagrams/44/fc941645067d0aebefb125a1b27ea211.png)
![[Diagram]](../../diagrams/13/a36ba506b77d602d814abfef5fe63a28.png)
![[Diagram]](../../diagrams/19/a5d22e5fa8867800390f098428a5cd92.png)
![[Diagram]](../../diagrams/33/f911e3843c246d1c4d3c444056a844ca.png)
![[Diagram]](../../diagrams/34/64270ec503a5676d47b1b9c70761d9cf.png)
![[Diagram]](../../diagrams/48/4944c865ae31d3fefa4e7802b6d32102.png)
![[Diagram]](../../diagrams/19/5b113583cf9bf4f9d931fed05292558b.png)
![[Diagram]](../../diagrams/0/d5e8e14cf3e6081a238b7909d1f80c41.png)
![[Diagram]](../../diagrams/10/252238808c18690056c4c408ffd9e063.png)
![[Diagram]](../../diagrams/34/4b3ff528349e7e9758b9f3ef76105239.png)
![[Diagram]](../../diagrams/25/82aaf559a41fc17983175cd7cb8630f8.png)
![[Diagram]](../../diagrams/2/e2a85a79ba9229d67cba7ed2fc768441.png)
![[Diagram]](../../diagrams/16/6c93240f89f7414b0a84630b6f646103.png)
![[Diagram]](../../diagrams/15/852c90a0f96352507ac17732d38c22ab.png)
![[Diagram]](../../diagrams/25/bf7d4d486a6c9bdb9907ae85ced84111.png)
![[Diagram]](../../diagrams/39/9000ee7f4b44a1966a53f02210fdaae9.png)
![[Diagram]](../../diagrams/1/dd36b30668ccfb248f1f698195532c67.png)
![[Diagram]](../../diagrams/17/04a2bf4f45a5984b2b586e65c00c2254.png)
![[Diagram]](../../diagrams/2/65e611f3adc9baf9fb0485dbc195df64.png)
![[Diagram]](../../diagrams/43/f3c4075de8ce21b4c843f1b477418838.png)
![[Diagram]](../../diagrams/10/846eeffcea0b206bef3c287c1ba16da7.png)
![[Diagram]](../../diagrams/46/f4084df4fac2c0915297b396f3a0dd52.png)
![[Diagram]](../../diagrams/37/6011cfee77f692413550564b4461ffcc.png)
![[Diagram]](../../diagrams/41/81fed55be3c73179fb930896d6420af0.png)
![[Diagram]](../../diagrams/52/9a9c84ab86686c12b845073ec44a3792.png)
![[Diagram]](../../diagrams/17/8aeebe93fb5cdeb20544307026c36a06.png)
![[Diagram]](../../diagrams/36/fd215751558a3def31867bc331b0eacf.png)
![[Diagram]](../../diagrams/41/c40eff55d673a4c487169e237faf60ca.png)
![[Diagram]](../../diagrams/20/07202fb9dc773704511186bc9245c639.png)
![[Diagram]](../../diagrams/35/f325e6d4f3f146999a49a3bffb2cacc6.png)
![[Diagram]](../../diagrams/16/dff3428a58c1a9edd97f47fc006928bd.png)
![[Diagram]](../../diagrams/50/3e038ba35c30738d0b388234992d11df.png)
![[Diagram]](../../diagrams/30/333bf9b4600ab7033c338dd05bd153d0.png)
![[Diagram]](../../diagrams/15/cf83d29644d60e6606200c503c4e3142.png)
![[Diagram]](../../diagrams/12/9b2f5dc5c9998aa6dd6b958e154d621a.png)
![[Diagram]](../../diagrams/41/f75e38d8b0d271025763a675fc7abadd.png)
![[Diagram]](../../diagrams/31/28e798b00184c6a945b067b9f64f5b98.png)
![[Diagram]](../../diagrams/29/541b7a26db8b05f9494d2b8033ab64c3.png)
![[Diagram]](../../diagrams/15/a6c90d77a1ab182613f42deaac2512c5.png)
![[Diagram]](../../diagrams/41/86147d5cbd802d8751e80e9c63418b22.png)
![[Diagram]](../../diagrams/24/03cb38d46fc69b29d5f9beaa5cffef7c.png)
![[Diagram]](../../diagrams/20/6d3301eced3e8495799ef627bc436105.png)
![[Diagram]](../../diagrams/32/0178def041e663bdb17de361bd8e8f3f.png)
![[Diagram]](../../diagrams/48/382f6ead1a7904780923ddca64dc9028.png)
![[Diagram]](../../diagrams/16/2e97e672ed8bf6670aaeefe8bb1091c0.png)
![[Diagram]](../../diagrams/42/de4ddf84737fc2597a6b5fe7015fff7c.png)
![[Diagram]](../../diagrams/19/922ee2fca179d89120532cbb8c5a2332.png)
![[Diagram]](../../diagrams/32/e68ff121ab0c529de3049fd90c312719.png)
![[Diagram]](../../diagrams/47/04735838c04b4faa5081441bf0df1997.png)
![[Diagram]](../../diagrams/1/eac8e32bc1fea3c8434c4d76ee4c3042.png)
![[Diagram]](../../diagrams/10/770e58b5ed10359ec1af297c79264fe6.png)
![[Diagram]](../../diagrams/24/5d6383fc9bb4244706c0a662dce57ca5.png)
![[Diagram]](../../diagrams/39/94e61f44b60c7ae0e4a4c6a9ba58a447.png)
![[Diagram]](../../diagrams/0/a91afce54d32f06535afd993b6c9dcf8.png)
![[Diagram]](../../diagrams/47/761c2377c87ed9bf7f931a948ad28b9b.png)
![[Diagram]](../../diagrams/15/9bdb680b9b2f2561afe45d088c4514f3.png)
![[Diagram]](../../diagrams/1/7e778bc067315c78a62bca3a863d3bc7.png)
![[Diagram]](../../diagrams/2/dd2c60e6ddcc2af8879d1fb727c27c8d.png)
![[Diagram]](../../diagrams/14/94f9219e31fec1e124fdd1772c4eae36.png)
![[Diagram]](../../diagrams/43/5e25fef0ddf998365c95b5df4c559755.png)
![[Diagram]](../../diagrams/36/2322e2d89fae988123b190f59e326b27.png)
![[Diagram]](../../diagrams/25/4453a33510249f43e1782c3ad36bb86e.png)
![[Diagram]](../../diagrams/42/cda6e978bf50e1e7671b7c2fc2f6d124.png)
![[Diagram]](../../diagrams/37/d5c6b9ab40f760e974ffacccf682ac78.png)
![[Diagram]](../../diagrams/29/91e32f6cd5c0f27f97a91ac00601faa3.png)
![[Diagram]](../../diagrams/44/f3a41b604ba28433cf900ec219264b58.png)
![[Diagram]](../../diagrams/14/0b5abb9157c64af83b767b6d82cdfe85.png)
![[Diagram]](../../diagrams/0/89b7a877966115a03f7d72a9073f0132.png)
![[Diagram]](../../diagrams/7/e2d275b1b1ee427ab2f6723b660fc6b4.png)
![[Diagram]](../../diagrams/37/5abfcd09ef17feff8c75db6d44bb8985.png)
![[Diagram]](../../diagrams/1/9bcdb7fac3c97695aa50a035149cc197.png)
![[Diagram]](../../diagrams/4/67dcbd22f8aabc72c3379c95680c3e08.png)
![[Diagram]](../../diagrams/26/7cacbdb56bd6ab2ba1ea3651601963ae.png)
![[Diagram]](../../diagrams/4/07cdab6d66b360c1cacf75bdc1eb3c4a.png)
![[Diagram]](../../diagrams/44/4097efc978cacfcec5e99ac5a6c5384f.png)
![[Diagram]](../../diagrams/6/9f406830c75a6c6d523da6c2142f7ab4.png)
![[Diagram]](../../diagrams/12/54c207fddb6a71405dece61733c7705f.png)
![[Diagram]](../../diagrams/30/56aa005adbab0ac1b5f3aa31bd6857b4.png)
![[Diagram]](../../diagrams/7/5fb0bfdffef025682c1474edce1c89b3.png)
![[Diagram]](../../diagrams/45/505ddaa024387872d9922245eb6dd494.png)
![[Diagram]](../../diagrams/36/30dc5475c2d58c42447adf5bd5d0a0cd.png)
![[Diagram]](../../diagrams/29/baf56889242ae4c77c17206febecf322.png)
![[Diagram]](../../diagrams/11/cda6ff45c185c68598a5eb118382fd28.png)
![[Diagram]](../../diagrams/42/7c850549e0c615ce5a857ba55db6d000.png)
![[Diagram]](../../diagrams/36/6577ee645b33c6c078b2e3416e81f3fe.png)
![[Diagram]](../../diagrams/26/c8c0a4d654f0d0b2407c69411e92bffc.png)
![[Diagram]](../../diagrams/13/d30da90ff15898e5878a1dd4c96f4ded.png)
![[Diagram]](../../diagrams/34/8ab73cf3b5b22e53306280899b94366a.png)
![[Diagram]](../../diagrams/9/9fc0ec556f5da710888eae2cf727861a.png)
![[Diagram]](../../diagrams/7/b98d55585cc5ba3e9ce9b9f5fb5757ac.png)
![[Diagram]](../../diagrams/40/c94f6bc5b52b3dc062ddb555ba1222d2.png)
![[Diagram]](../../diagrams/24/d77b99bbb84db171bc8400106c193ecc.png)
![[Diagram]](../../diagrams/30/b59b6c49be80fcf74037f275604e3c54.png)
![[Diagram]](../../diagrams/3/cca0651425694d1392896938dd6306fa.png)
![[Diagram]](../../diagrams/15/8920f0bb64c409673e34b796368b84fa.png)
![[Diagram]](../../diagrams/25/80a2c1f51bb415732f19f969d28d8dc9.png)
![[Diagram]](../../diagrams/9/64b91a926d373e352ca525edbfa6fd3a.png)
![[Diagram]](../../diagrams/42/1c45ece3df97b0ec02c7f84dfaee1b9d.png)
![[Diagram]](../../diagrams/4/e71a816ba8d84e10aac6b7b1c56258d8.png)
![[Diagram]](../../diagrams/27/78935e3e66c9825e4f6837c754315313.png)
![[Diagram]](../../diagrams/7/e80e59754ee39175e933fe3dd4bac301.png)
![[Diagram]](../../diagrams/51/7f3289992a2550dcbd3db97fc6f9beca.png)
![[Diagram]](../../diagrams/2/2fc228b9ef6c9c1bdc7bd34240d7f96f.png)
![[Diagram]](../../diagrams/29/5a4c7865faed9aef938a7c7d93049b63.png)
![[Diagram]](../../diagrams/31/5121d8da29b545f0c3125f39ad08410b.png)
![[Diagram]](../../diagrams/47/7e82eae0859abf9e848e1bfb6119e61b.png)
![[Diagram]](../../diagrams/12/2f0f89cf1d604f7e5372f81ac1139e6f.png)
![[Diagram]](../../diagrams/34/80ab5c4ae7b084e67f59c97714567962.png)
![[Diagram]](../../diagrams/25/70314b6dd60644ddf0ba1b5cd60fd0a6.png)
![[Diagram]](../../diagrams/37/8bdc88b2817a13cbc0c78c5711e2785b.png)
![[Diagram]](../../diagrams/8/40925f5c964d310b01337f1391b64a4e.png)
![[Diagram]](../../diagrams/14/cdc3300b8b1cc0f7289db20a8260d370.png)
![[Diagram]](../../diagrams/33/d75273a3f29c5a36234689395a7670bd.png)
![[Diagram]](../../diagrams/9/acb23586142e20f8a6022cf7b081163b.png)
![[Diagram]](../../diagrams/34/f5c913d776859e6d494ef782a84aa443.png)
![[Diagram]](../../diagrams/45/b7838d296917eb3cba934a3ff063d247.png)
![[Diagram]](../../diagrams/52/80a1cb28f1916fe5939413b65d0cccbc.png)
![[Diagram]](../../diagrams/37/70b79983d4d7a5d85c49aaf2c6307669.png)
![[Diagram]](../../diagrams/27/2edc745c585a61fac2fdf4ed3dc26aef.png)
![[Diagram]](../../diagrams/44/14b43801d6a8b15c7b9b716ed300104a.png)
![[Diagram]](../../diagrams/30/0946a41753b7e24ecf6f7d2863fe67ed.png)
![[Diagram]](../../diagrams/31/c79abfa07e43ae2e85e013a58958b465.png)
![[Diagram]](../../diagrams/37/8bf576b7502d03bdda543ece1445aef0.png)
![[Diagram]](../../diagrams/20/cdac63c5cad4aefb2b342004d66b519c.png)
![[Diagram]](../../diagrams/25/3bb1181689a03ed11b96bd5596ecd18e.png)
![[Diagram]](../../diagrams/10/93d5eca07a57f3889d4aae5459aba094.png)
![[Diagram]](../../diagrams/45/ac3110bfe2a89812c77bfa304e5a71f1.png)
![[Diagram]](../../diagrams/51/07e461fbcd9494cdf0e9f9995abf3218.png)
![[Diagram]](../../diagrams/21/28f36704e6245682bdc2c2bf7cce3009.png)
![[Diagram]](../../diagrams/15/e0c6c8223983e75ee8fd7cb1676f4ee8.png)
![[Diagram]](../../diagrams/12/3d80b83e2729e049a93ddbd2cef87ef4.png)
![[Diagram]](../../diagrams/51/ddf422787021f76259941e03163bc09c.png)
![[Diagram]](../../diagrams/44/fa3babc652a119a56c775dbef0e1f4c4.png)
![[Diagram]](../../diagrams/42/c9120ead80c65cbb597e94134a6ac51d.png)
![[Diagram]](../../diagrams/0/c235755751f55886d6982b53587b9a1e.png)
![[Diagram]](../../diagrams/12/e67a877a033bd76887b0046e9460fdd4.png)
![[Diagram]](../../diagrams/3/0cde812e1c40905c03592573fc5b9887.png)
![[Diagram]](../../diagrams/16/11c34d3dc8c85b6c8ef4f22df6ccdccc.png)
![[Diagram]](../../diagrams/36/10b4dc9b0b263574566e5c0c5fb206da.png)
![[Diagram]](../../diagrams/47/c971e9336d3b0ad50dd890b336eb909e.png)
![[Diagram]](../../diagrams/49/66400b4f425556ce4f856abb1a5774b5.png)
![[Diagram]](../../diagrams/26/2a9508cb1c81557df4e4d43b4419ac74.png)
![[Diagram]](../../diagrams/23/0701f2338a1275eda6fb54ca64745e5c.png)
![[Diagram]](../../diagrams/44/630a3d1f8932974c921d574a63f6a1e0.png)
![[Diagram]](../../diagrams/26/2568d0fc390e8e6ddcb7f073d2c3308a.png)
![[Diagram]](../../diagrams/49/00f8d5636c013ade3c03a11ed98d4e23.png)
![[Diagram]](../../diagrams/44/fa242f7e36e7191bd485517bc5723c25.png)
![[Diagram]](../../diagrams/44/9342c8bf90651706406560d8f0049afc.png)
![[Diagram]](../../diagrams/40/49c8e34e4a486c06222b9cd964fee3c3.png)
![[Diagram]](../../diagrams/45/4f8a7e9f159e56a3bac9785737e30b34.png)
![[Diagram]](../../diagrams/28/a890ec9ff2e96cc5fe30dac90f2aa6af.png)
![[Diagram]](../../diagrams/34/5740012e13d7b85aa8554ca7f4e3bda9.png)
![[Diagram]](../../diagrams/6/9d1c20ad8092ef2ee8ab47a03966b0da.png)
![[Diagram]](../../diagrams/16/c7b37b360aaa34b1670969fefa2e78f0.png)
![[Diagram]](../../diagrams/28/cc015964be4e00b23bbe1e44e4d017ed.png)
![[Diagram]](../../diagrams/50/8c32a11c814f15530a4d79bbbe5123b8.png)
![[Diagram]](../../diagrams/36/9ca00f8d00eb2e863d1e3c5ef97c9622.png)
![[Diagram]](../../diagrams/48/b6a13b7097c1e6202f436a27d663a8aa.png)
![[Diagram]](../../diagrams/8/23d48ef7420eb1ae36f2256572ba6ff0.png)
![[Diagram]](../../diagrams/29/f97b5f99621ac8d89f2d63ffee46320e.png)
![[Diagram]](../../diagrams/34/7a3f971e5879ab78342cc722cc7247da.png)
![[Diagram]](../../diagrams/49/3d3ad51cb6b86890a86ef24fbf2e02da.png)
![[Diagram]](../../diagrams/38/c773245bd6062ecbeac453bab19b9433.png)
![[Diagram]](../../diagrams/0/f74cdbdc00718444b363ca09aba664f6.png)
![[Diagram]](../../diagrams/43/8d28421ecdc94c7665fabc2dbdd6bd01.png)
![[Diagram]](../../diagrams/11/5d1112c599f14b673031d18b269992d5.png)
![[Diagram]](../../diagrams/13/99e65981ff417d4e8543dff5a847376f.png)
![[Diagram]](../../diagrams/33/87c6eb9afdb968e853a83a1b4555c073.png)
![[Diagram]](../../diagrams/4/b7cc7de6c768ea33c95e9952cda2cb5c.png)
![[Diagram]](../../diagrams/2/cb02527a410e463f87f87a6001a98dbc.png)
![[Diagram]](../../diagrams/6/918fd0236357391b5504a8a400e6d1f9.png)
![[Diagram]](../../diagrams/41/4c244316522df15cbd72c18c4b1cd503.png)
![[Diagram]](../../diagrams/15/add430b6a1aac7a698a8357c62466bd3.png)
![[Diagram]](../../diagrams/11/3c79a4a657d9c77cac92a50cee6ad7e4.png)
![[Diagram]](../../diagrams/3/719cb77470fe9745f44b2953038e1a80.png)
![[Diagram]](../../diagrams/36/7b0b1924b6178d5480a33c4b9c82eb22.png)
![[Diagram]](../../diagrams/33/8c3f0440e935f6ad33931d202899d96f.png)
![[Diagram]](../../diagrams/15/da53512286578c7c6594abb12530b710.png)
![[Diagram]](../../diagrams/25/b90b8a85ccf156c96228dca17c44303b.png)
![[Diagram]](../../diagrams/25/0f53c36febf965c48a7b850966307205.png)
![[Diagram]](../../diagrams/20/5942dd580bb155c568c75b9611e44465.png)
![[Diagram]](../../diagrams/42/33b9ac0bb602c4a6681d3cd74382b992.png)
![[Diagram]](../../diagrams/32/1bd2b2749952d289960bf5633e577e90.png)
![[Diagram]](../../diagrams/51/82d91b99558e7452662d4ce487a317b7.png)
![[Diagram]](../../diagrams/47/0f0f01ad6ae7293d5a44c86c34c45660.png)
![[Diagram]](../../diagrams/51/d78a99549d2376ea6cbecb5dec4dca59.png)
![[Diagram]](../../diagrams/10/6c1ef4a6d435fc966fbfbf9df9e407be.png)
![[Diagram]](../../diagrams/19/6310f56a9ed504b2fe325af9b83d8b6b.png)
![[Diagram]](../../diagrams/1/d4d0c645c18fc66a57f03a9b866bd96c.png)
![[Diagram]](../../diagrams/38/e98439a7568de8de87834e3c72e09ae8.png)
![[Diagram]](../../diagrams/52/03c6dd5b5e67a8e657c4aafe48ef8d47.png)
![[Diagram]](../../diagrams/50/e56faf7816b9a888d26c5c86580dc426.png)
![[Diagram]](../../diagrams/11/dbb9db42369f27aa6383b8307e22e767.png)
![[Diagram]](../../diagrams/7/e6f9b94c2bfc9cc6f18d9773e76447d9.png)
![[Diagram]](../../diagrams/3/4c01faa8c429908866a6bc30e5ee4f55.png)
![[Diagram]](../../diagrams/39/ef8f33fb7804fab7b6bd19981bf6382d.png)
![[Diagram]](../../diagrams/48/5cc46bf5e4d79002f4b4e72caf7b829b.png)
![[Diagram]](../../diagrams/31/a2c5faecbcc909007e72216f7f7e2b4e.png)
![[Diagram]](../../diagrams/0/2163e7466020ad4e7a21914de2ed4b6c.png)
![[Diagram]](../../diagrams/44/3dddde06b3715d38c93410f3d6b74d74.png)
![[Diagram]](../../diagrams/48/e28a901bf45ef458ef752ed968ffc883.png)
![[Diagram]](../../diagrams/14/419a4e7c62897e81774e202fd104ee14.png)
![[Diagram]](../../diagrams/39/db524c860ad2893fa42c10fb7b17a6f0.png)
![[Diagram]](../../diagrams/10/c2ed19f7d850d7676e7049497ccd3b38.png)
![[Diagram]](../../diagrams/28/402e99fae63434c09899fe54daeb72a9.png)
![[Diagram]](../../diagrams/43/31e204c409cc4378628cf78209ee1919.png)
![[Diagram]](../../diagrams/4/9645c2bc90581a5f52bbbd8ffcefb48e.png)
![[Diagram]](../../diagrams/28/0eea1ec5ddcbf63b19ddd7c55fa22a8d.png)
![[Diagram]](../../diagrams/44/56ca7db1a3f3786ca330f8b26675f88e.png)
![[Diagram]](../../diagrams/6/743e55271aaed0fde472b9c9cdb7a980.png)
![[Diagram]](../../diagrams/9/a43cda8dabd3a6a1f102c426fbece4f5.png)
![[Diagram]](../../diagrams/34/74682e7f4f5bf89f5c0295d65ec3c677.png)
![[Diagram]](../../diagrams/3/d6405e51430726883bf1640f9d7b6de7.png)
![[Diagram]](../../diagrams/22/5e921eda8f195dd7cea4903e184b7ebb.png)
![[Diagram]](../../diagrams/4/b6944a086746ff7e35436874ebd6927b.png)
![[Diagram]](../../diagrams/7/5cf9f75177ef0fc2af4abad2b375e7dc.png)
![[Diagram]](../../diagrams/46/e9e15862c65f7a270f6c938c7cdbe37b.png)
![[Diagram]](../../diagrams/4/aa6ac134dd13b3d51b868504534d8df1.png)
![[Diagram]](../../diagrams/40/edd756f885646fdb89c78e31d7e077f3.png)
![[Diagram]](../../diagrams/38/44b8d13b396b3ad0ae2f42fb4f3a59a4.png)
![[Diagram]](../../diagrams/11/7c9bd0bdec6ad55e84e297d9a9de0c02.png)
![[Diagram]](../../diagrams/15/587f6221f2b5f8053eb2c7dad58315b7.png)
![[Diagram]](../../diagrams/50/0a06dfbea781b17eb6e989a61ce16088.png)
![[Diagram]](../../diagrams/36/ecb58cd5f65f0deac3d093d06c3318c6.png)
![[Diagram]](../../diagrams/17/a3ab78db73f45af092eeb4f9d2c0aa79.png)
![[Diagram]](../../diagrams/33/cb023aef6a2fa95832662f3b71949d40.png)
![[Diagram]](../../diagrams/24/a656648d103c745b7220a7543d904de3.png)
![[Diagram]](../../diagrams/23/06324bf9356125f41fab4b1e6190235f.png)
![[Diagram]](../../diagrams/29/67c864269301597a73637d6672da9e96.png)
![[Diagram]](../../diagrams/15/bdb05a58a550330eb58d7c3328d78e84.png)
![[Diagram]](../../diagrams/30/92cf5efc8af9f328343fae5c1a070e6c.png)
![[Diagram]](../../diagrams/1/f263132a7590ac31648912a71938bef5.png)
![[Diagram]](../../diagrams/51/62007bad6515dd80d68ed9626c172ac4.png)
![[Diagram]](../../diagrams/42/29ea7b9385687e53bc4bbb0396689876.png)
![[Diagram]](../../diagrams/35/cf1bc3a59b4f979eabfc9c9019b1cd95.png)
![[Diagram]](../../diagrams/7/e98843a1b05abee6ffde514f8a1ef710.png)
![[Diagram]](../../diagrams/49/f2b90c26cdcc55ded9a3db8fccd693b5.png)
![[Diagram]](../../diagrams/12/2bae6f36aa008893afb762724e04ee75.png)
![[Diagram]](../../diagrams/33/ea03c2146503f859b0b7938dc699ee43.png)
![[Diagram]](../../diagrams/3/19ddf3fb25867888886cd51c59a612b9.png)
![[Diagram]](../../diagrams/3/3bb2df872b2eec0e7d6041ae18fdb81d.png)
![[Diagram]](../../diagrams/21/60549e31719d1f44d2d7f88e8f9d5337.png)
![[Diagram]](../../diagrams/43/894c4a9a3f9c812b33891e767e4cc7c6.png)
![[Diagram]](../../diagrams/40/a5e6ebcff36ffa58ac060fd12f23a613.png)
![[Diagram]](../../diagrams/40/9dd20229517337a27bf9e53725e315ce.png)
![[Diagram]](../../diagrams/51/f946457e3868819ef48fe853006c0d92.png)
![[Diagram]](../../diagrams/6/456bf720af559b7f4045121feaa3f983.png)
![[Diagram]](../../diagrams/50/9f9e0baaa1581e7e3aa84b1ea9b507e4.png)
![[Diagram]](../../diagrams/4/c9ab4b0633a92a7390db375c9526caf5.png)
![[Diagram]](../../diagrams/13/a7abfb79315da42528d866cae10b2567.png)
![[Diagram]](../../diagrams/2/24204dcc48c3a606fb2b665901b4a3f8.png)
![[Diagram]](../../diagrams/25/50fe845dccb7cb58a3192b815d47be7d.png)
![[Diagram]](../../diagrams/24/f4f0d0dc4a3e5547947338f2fa827222.png)
![[Diagram]](../../diagrams/33/3d9a1cadcab5c8934c3aa39db432ccd2.png)
![[Diagram]](../../diagrams/29/340d5113c06407ef855c809a932c706b.png)
![[Diagram]](../../diagrams/38/c763d48611af87342f3bfa484290b184.png)
![[Diagram]](../../diagrams/19/e8b3ee7d9e5462905eb4be3a22faf637.png)
![[Diagram]](../../diagrams/10/850c355733b157de95eb301c8a3e2647.png)
![[Diagram]](../../diagrams/34/d6020b0cdf032504ae3a22e14a5e481f.png)
![[Diagram]](../../diagrams/8/3a7e1263ea6ccf65fb3d67307376d7d0.png)
![[Diagram]](../../diagrams/8/9458f7d4b573de6ae3165c38e0fd095c.png)
![[Diagram]](../../diagrams/42/bbf3d10f23d40a6f58181c219ce6bb8c.png)
![[Diagram]](../../diagrams/48/0a34de3a9f812941f767ab60e83af38b.png)
![[Diagram]](../../diagrams/49/cc62614239c3afda67ddb8a92772bcfb.png)
![[Diagram]](../../diagrams/29/d3a59336f4067a415a1a60c0dd81966f.png)
![[Diagram]](../../diagrams/41/fa726331e47fbc75515d75e2284379d1.png)
![[Diagram]](../../diagrams/7/0c70b790f7d21ca65ac13a27b7cb4e76.png)
![[Diagram]](../../diagrams/44/8a77e9fa3571cc6f8395137a0c508528.png)
![[Diagram]](../../diagrams/16/506e647de5097ee116c0149fafa199b4.png)
![[Diagram]](../../diagrams/5/fde364a91dbe1b4f3b3ccffb3bb87cd0.png)
![[Diagram]](../../diagrams/39/01e5da1a936fc70501f794e50837e221.png)
![[Diagram]](../../diagrams/24/0c92a86a0ecf0d3d1d7c6328e049631b.png)
![[Diagram]](../../diagrams/17/9e566b629f5638e61f8546dfe1d42f8c.png)
![[Diagram]](../../diagrams/20/cc7ceb6e222eae7c70ca061223eb4d6c.png)
![[Diagram]](../../diagrams/44/b316eff630adbdecd48cc915fd53d7e9.png)
![[Diagram]](../../diagrams/44/0aa3a8994288aee70a6075e4e93137e4.png)
![[Diagram]](../../diagrams/28/c9d555559dea86dd339b60cbe85f1564.png)
![[Diagram]](../../diagrams/2/0e5606a8165786986f7f972e04a55ae6.png)
![[Diagram]](../../diagrams/40/f5ceeb52f65f1b922295ed11f1d3a027.png)
![[Diagram]](../../diagrams/37/eddccb03825e82cd02334174776b4e43.png)
![[Diagram]](../../diagrams/13/649edb30de3dfb73fd88c6989ea4e9a5.png)
![[Diagram]](../../diagrams/5/d46057e7b12d49e0404360e331337737.png)
![[Diagram]](../../diagrams/13/6be167e036e202ea4d6833776f52d038.png)
![[Diagram]](../../diagrams/52/73ada45f4ded9ee7faa368ec6922ffe9.png)
![[Diagram]](../../diagrams/21/391f76e86980c4cf9a0f4c7ef58b987b.png)
![[Diagram]](../../diagrams/36/608002ae8d91d62b5cf3f4b88863b24a.png)
![[Diagram]](../../diagrams/47/9191bf2fac20e098ae8cbb7049f87529.png)
![[Diagram]](../../diagrams/32/3b4cda367b348d0a76b8dee42ce2385e.png)
![[Diagram]](../../diagrams/43/c930ccda38163b1484e0653b5d7bbf65.png)
![[Diagram]](../../diagrams/35/b3adbbde6498cc2b633a7c954bc66cbf.png)
![[Diagram]](../../diagrams/44/a8b5b9b85c594cb88d2f6f51d5558766.png)
![[Diagram]](../../diagrams/28/92f7a12860748b834d8ac2c9c973851f.png)
![[Diagram]](../../diagrams/13/46c1879d9e2a54965585d52c6158b2fa.png)
![[Diagram]](../../diagrams/31/777df30b6b2e5a5a618529e2e4c8ee37.png)
![[Diagram]](../../diagrams/48/d3faac8c340d747bad20c0fad8df05b8.png)
![[Diagram]](../../diagrams/24/6dd17fe5e67b1f1c5ede81f00af7e3f4.png)
![[Diagram]](../../diagrams/0/1fc53728019fbf6343c73382f4b6ba0c.png)
![[Diagram]](../../diagrams/48/0985eff0ea3bd6744db30b43cc591c3e.png)
![[Diagram]](../../diagrams/6/ca1f9fe3eb857c394b23090990bca791.png)
![[Diagram]](../../diagrams/26/6bc214b2afecd5c8f8fc320e060557c2.png)
![[Diagram]](../../diagrams/41/9485cd4fa58abbecba39f0e705dcb262.png)
![[Diagram]](../../diagrams/36/46cfb7db47a6ae4c99f12ba9e2e0b7e7.png)
![[Diagram]](../../diagrams/9/71290221c31c78f4ac5a270cd414eb1d.png)
![[Diagram]](../../diagrams/12/fff02f514845317afac2e6b988742b73.png)
![[Diagram]](../../diagrams/8/b945d15e29d4f50f523a3dbc1f1f84d5.png)
![[Diagram]](../../diagrams/35/9ba3ec74e40a2a58155e697559fb3c96.png)
![[Diagram]](../../diagrams/11/a6b681788ef9d4d98b34fa91fbf241a7.png)
![[Diagram]](../../diagrams/7/dc793fe2566bbc814139a1be353d0d07.png)
![[Diagram]](../../diagrams/15/2759837f08da7920046a328b8846d48f.png)
![[Diagram]](../../diagrams/52/ce18414e277066b8f89ada8623c25810.png)
![[Diagram]](../../diagrams/31/48c1360bdc86e21af016647bde44aa4b.png)
![[Diagram]](../../diagrams/41/109f938b8a312b1a268be417d85fb15b.png)
![[Diagram]](../../diagrams/33/e19ec14e50950fd478e35eee1abb1d51.png)
![[Diagram]](../../diagrams/29/f071594b2c23c699a98d09406efc8150.png)
![[Diagram]](../../diagrams/36/9408289a3cd1a1aac1665a30c2771c42.png)
![[Diagram]](../../diagrams/50/59a790b30094755dca1e7c2b1c9e40af.png)
![[Diagram]](../../diagrams/46/e3dfa2ff641f0652f6adb964747e0879.png)
![[Diagram]](../../diagrams/8/dd0194d31b1f23f9331a1dcb0c7e0a4e.png)
![[Diagram]](../../diagrams/4/bb350e41a371af65a9e703ae00263bd2.png)
![[Diagram]](../../diagrams/5/a4a74327247c07d9eb392385f0a5ad65.png)
![[Diagram]](../../diagrams/30/8437bd0e28d3d38d532d2f772b155ac6.png)
![[Diagram]](../../diagrams/31/682f127f29bfc71efc0a7bfe7c5af077.png)
![[Diagram]](../../diagrams/21/62aa649555aba417aeaa7a8bf3c548fd.png)
![[Diagram]](../../diagrams/52/c38e40b694556fea94c5861ba14b31cd.png)
![[Diagram]](../../diagrams/32/0fc5a7ff131eaec415a9e521dc99e4d7.png)
![[Diagram]](../../diagrams/52/df28d29921c1dc6b1a1e430f70f42ab8.png)
![[Diagram]](../../diagrams/43/ba4e46cfb6caa9b2432c7974b334cec4.png)
![[Diagram]](../../diagrams/14/f5a80c0b756e1bbe7a8f4c59f164fee7.png)
![[Diagram]](../../diagrams/43/4d402e2f0043ffa66a4a80b3c5b2b82a.png)
![[Diagram]](../../diagrams/3/ad48cdcaccca00641a916a510a94b24c.png)
![[Diagram]](../../diagrams/4/f012c5235ed810eb91db293b3767ef65.png)
![[Diagram]](../../diagrams/36/439be4eebdef839d5bd704d642a46a68.png)
![[Diagram]](../../diagrams/16/07d9fa69474389887c4ac76249cfd107.png)
![[Diagram]](../../diagrams/0/9c1ad83e235035f254d2664b8baec8c6.png)
![[Diagram]](../../diagrams/5/a5de0ad5c984cba6c6e3ee1e28e297c8.png)
![[Diagram]](../../diagrams/6/350fe5224cb6ed29406790ed50043e14.png)
![[Diagram]](../../diagrams/42/99e767651e5f71fdc470bfde401cf26d.png)
![[Diagram]](../../diagrams/42/551217d2885ddb0800f1621df7508f85.png)
![[Diagram]](../../diagrams/44/e7364b88fab2720261b11ed58c1aeebe.png)
![[Diagram]](../../diagrams/27/decd537cbbd256015e3d84e5575b79e8.png)
![[Diagram]](../../diagrams/51/ab6d9c4dcf6be7d0ec37511f9f30399e.png)
![[Diagram]](../../diagrams/5/09853ba433f37499d5ff627ef848fe4d.png)
![[Diagram]](../../diagrams/45/8e3e42b773a12726c88f2cfb78c4645a.png)
![[Diagram]](../../diagrams/19/5da90e4488e4720e95fbe1ccff4c32ee.png)
![[Diagram]](../../diagrams/38/320b153e98b24b87ba099a48735716b1.png)
![[Diagram]](../../diagrams/13/32134b09041a64ef0f6754ba7e216a9f.png)
![[Diagram]](../../diagrams/12/91b2efd17ce83d6bd02bc91a6768bd26.png)
![[Diagram]](../../diagrams/13/bb0def6eaf941727a2409c983f4737a8.png)
![[Diagram]](../../diagrams/18/87190ca8d272008e49602f08c40ae48b.png)
![[Diagram]](../../diagrams/39/23f6d41b1cfc25f279577e67595fd167.png)
![[Diagram]](../../diagrams/26/3aa10269480e6a4c65cd4968a8eca12d.png)
![[Diagram]](../../diagrams/26/c2cee9749a17e416d631c077d7edd2d9.png)
![[Diagram]](../../diagrams/45/a58727bb11f1a4c5194ed4af68790d3b.png)
![[Diagram]](../../diagrams/0/a8acaf6ea14d8aa59e7694958a8c566d.png)
![[Diagram]](../../diagrams/30/0608fd93fa88ccf07e77ca9eb147458c.png)
![[Diagram]](../../diagrams/17/89803a9c7f3085985af3b9e3b8168174.png)
![[Diagram]](../../diagrams/4/c493c7dca2e21472addd9ab1d170e258.png)
![[Diagram]](../../diagrams/11/1da70120f6c0af7acc699dc79a0bddb6.png)
![[Diagram]](../../diagrams/47/bd3378b569927cf6b4e6f25b24c0f13b.png)
![[Diagram]](../../diagrams/16/97c4e4896494eaf3544b143618d65275.png)
![[Diagram]](../../diagrams/28/2ff7fba8e09703ce4a6735c8e3fd0250.png)
![[Diagram]](../../diagrams/14/90de56e8653c3aa6c90cdccb6060a84a.png)
![[Diagram]](../../diagrams/24/386398a53baf6841ab9fe4569dcf2f84.png)
![[Diagram]](../../diagrams/13/a90f27fef42a7ae4bcc0d66aa14657f9.png)
![[Diagram]](../../diagrams/36/fc3ed25e6036d2367fd6911f3115f24d.png)
![[Diagram]](../../diagrams/42/424f84cd7929470ea03cd45b37d5b563.png)
![[Diagram]](../../diagrams/28/917bd1996c9e2374a9d3bcca108bfce7.png)
![[Diagram]](../../diagrams/26/01551fea55a705dd24eb03f42d823599.png)
![[Diagram]](../../diagrams/22/ecb9bff7646eb3c8f214e7d721064461.png)
![[Diagram]](../../diagrams/5/4edb8c3ec42fa5af74fa24fe9b4ce221.png)
![[Diagram]](../../diagrams/41/15abfdec6c5ad0a4c29a745b13380909.png)
![[Diagram]](../../diagrams/45/383bfa87011622999cf3d59d023b4a86.png)
![[Diagram]](../../diagrams/1/0e755a80406e8833460763ac39be5b58.png)
![[Diagram]](../../diagrams/40/c98913eb4ecc41c68aaf5643d6fab276.png)
![[Diagram]](../../diagrams/24/11609f2202a70e94e71f8312a434af55.png)
![[Diagram]](../../diagrams/33/46e2fb7622c64b701e150a0f309888f0.png)
![[Diagram]](../../diagrams/50/9977a8b2a36ff1cc5f00392e5bff5d69.png)
![[Diagram]](../../diagrams/45/6b10076514c89779893d930fe3178a3e.png)
![[Diagram]](../../diagrams/28/e65f7bca2e9b9e318fb0253ab36c0f16.png)
![[Diagram]](../../diagrams/26/33e1113bb3298b86d3fd8e822369e211.png)
![[Diagram]](../../diagrams/37/2cb77ee9a4bd3aa28c20a9d032545067.png)
![[Diagram]](../../diagrams/26/3e471edb6f5a8129b4ec02d042426a45.png)
![[Diagram]](../../diagrams/7/390afc22c06929a44d064bfd1b4c4418.png)
![[Diagram]](../../diagrams/5/27d2137a211f2223482a6c818dc3ff75.png)
![[Diagram]](../../diagrams/32/b4cfc19dd1e5231d3fa1926802b630e7.png)
![[Diagram]](../../diagrams/12/cc108bd366d3f6e14c7aa0fa7a91913d.png)
![[Diagram]](../../diagrams/3/16e75bf8243754e6b3c0b41d1f72dcd4.png)
![[Diagram]](../../diagrams/3/dba522eb0f61b4e2f8e094abb858c003.png)
![[Diagram]](../../diagrams/47/9452e64192cfd13bb31465527fc43f45.png)
![[Diagram]](../../diagrams/42/c26a4a458bd6506b96144b235e266ad1.png)
![[Diagram]](../../diagrams/19/0927bb354f0d5998283d900a0b747a29.png)
![[Diagram]](../../diagrams/17/63d5b5e14d511afbced324b2240a52c1.png)
![[Diagram]](../../diagrams/5/a9b80d2bd5933f5fc53808b1a764ad8d.png)
![[Diagram]](../../diagrams/0/f30a92c5c7358c76a0343754813329e3.png)
![[Diagram]](../../diagrams/10/0763bb61b25d2c4b28f32c8a3fb8b5a7.png)
![[Diagram]](../../diagrams/33/f35dde93f9ea20edb8735b4bde0fe204.png)
![[Diagram]](../../diagrams/8/e12399dd659376976e0d17cb22cde155.png)
![[Diagram]](../../diagrams/14/018248449b4dd087908cba832cc6b84b.png)
![[Diagram]](../../diagrams/13/65bc8c033e649f4a450e2ef035c8ea2c.png)
![[Diagram]](../../diagrams/11/ec78dc3415568bcff86697ea4a4d6b8d.png)
![[Diagram]](../../diagrams/4/ac55ecc00c5aa10038648b4bca80ee1a.png)
![[Diagram]](../../diagrams/22/e0daaa5e4feadb9b7ffde7e3411e4b53.png)
![[Diagram]](../../diagrams/2/3d09afe7a0c738399ad286cf72f46b82.png)
![[Diagram]](../../diagrams/16/e3604e8d9b84704a6f7448aa54860213.png)
![[Diagram]](../../diagrams/10/c6fe9986d85219e61baf019f39f976e6.png)
![[Diagram]](../../diagrams/49/e7b369b706a2dfb929a7bb7802c716d6.png)
![[Diagram]](../../diagrams/7/e3635685738683ef8653b31f9da258c9.png)
![[Diagram]](../../diagrams/1/c156fc2e7a77606d80abbe257c9c032c.png)
![[Diagram]](../../diagrams/26/6a71e212c8fd5916a19c6b08e9d23aba.png)
![[Diagram]](../../diagrams/50/ba00f1361632633c2fcfb25980d32f35.png)
![[Diagram]](../../diagrams/2/7a448eb8f42670921609e6cede1c9ced.png)
![[Diagram]](../../diagrams/23/913048520fc3d596c21809403fcd27d1.png)
![[Diagram]](../../diagrams/10/1eb6eb652a362a661e5f6443e013956a.png)
![[Diagram]](../../diagrams/45/83f683a20a8cb5810aa0954e838520ac.png)
![[Diagram]](../../diagrams/39/9fd31b23807ca2078c969b6f52fa8b9a.png)
![[Diagram]](../../diagrams/21/0b4a02e30c5eb0a5c7d1048b4b758246.png)
![[Diagram]](../../diagrams/28/3051bb92ec66ecc13f34345f30d09ad1.png)
![[Diagram]](../../diagrams/46/bd02ce0fa3194b715b193180ed0dd2ce.png)
![[Diagram]](../../diagrams/24/8030345d7af48584753271e5b3657b0b.png)
![[Diagram]](../../diagrams/51/6cb7ff254f112d180c58d0f48a2f81b1.png)
![[Diagram]](../../diagrams/46/b7d425e88b5c948a5334089b9463209c.png)
![[Diagram]](../../diagrams/26/367ae3789f63cb4e4b5a75de292b2086.png)
![[Diagram]](../../diagrams/26/0bec99a3e6b33c9aa552c686ecac2483.png)
![[Diagram]](../../diagrams/20/7e162956cf697e4897e68515038482e2.png)
![[Diagram]](../../diagrams/23/dfb3913595b05f6301f632b8406d022d.png)
![[Diagram]](../../diagrams/7/eb43024169433c51ff42197040578463.png)
![[Diagram]](../../diagrams/15/40af17b6b76e2826f6d2b2984f2fb89f.png)
![[Diagram]](../../diagrams/27/d3066c144811c45e85e66f00fa2c3df8.png)
![[Diagram]](../../diagrams/25/f2656ea31c641660bf800603a4a0815e.png)
![[Diagram]](../../diagrams/32/e3403181ed2e69ff11c53833e1ae1d87.png)
![[Diagram]](../../diagrams/45/45830fe4fdaf69c721383de4962e484d.png)
![[Diagram]](../../diagrams/33/379413dc11c9902c26171ec581184939.png)
![[Diagram]](../../diagrams/50/8f7e3b0ea4e6196c04fa32cc068f7dff.png)
![[Diagram]](../../diagrams/25/bc7e2229956d1bfd9078ab024e282bc3.png)
![[Diagram]](../../diagrams/30/e0b80b495c6dd9ff182c40d5c6fc1576.png)
![[Diagram]](../../diagrams/39/a79fbc14c8128d8dae856097d8a2a03f.png)
![[Diagram]](../../diagrams/2/b7e6246e492e45ca8ef6747a703b051e.png)
![[Diagram]](../../diagrams/5/d34a2de6ceca4d35462410c547f3155d.png)
![[Diagram]](../../diagrams/0/00bcf28ad65ca023dc3800467a17ee4a.png)
![[Diagram]](../../diagrams/25/787f8ae71479375ae187357a1416f774.png)
![[Diagram]](../../diagrams/39/740366eb2d7acf87eba25719f9a6cde6.png)
![[Diagram]](../../diagrams/18/7576acd618676547c721a725878146d0.png)
![[Diagram]](../../diagrams/22/d722002e865972fb724b9907797a9678.png)
![[Diagram]](../../diagrams/45/12eaa840de80788f7458643b3a521a47.png)
![[Diagram]](../../diagrams/51/c8af710b663ebe051bf88146ce560840.png)
![[Diagram]](../../diagrams/22/50ddf8acc665072e5d92e55b61eb89a7.png)
![[Diagram]](../../diagrams/0/0e8f1d1a020cf13ccdfc166da1892dd5.png)
![[Diagram]](../../diagrams/36/b656d7e0d7848182119cadf04043f271.png)
![[Diagram]](../../diagrams/17/988f891e924d3f5f04506d07188eb472.png)
![[Diagram]](../../diagrams/22/00023200c5e133f2d01420ea3442715f.png)
![[Diagram]](../../diagrams/24/5fb5c0bf1d8af728e28c5ffcadb9efd6.png)
![[Diagram]](../../diagrams/10/589682b9eb3a17840e8c870dd8188adb.png)
![[Diagram]](../../diagrams/18/9cb8b5d8ddc951f66223b4cea20a8d84.png)
![[Diagram]](../../diagrams/46/ad6f630dd1ff4f9937e8996e9c035c4e.png)
![[Diagram]](../../diagrams/25/8796a221c838294769a20aa127b9526c.png)
![[Diagram]](../../diagrams/36/03316cf69a236d462969cf345166ab41.png)
![[Diagram]](../../diagrams/30/bd30d36fc9434d8dc041c1c3e52caac8.png)
![[Diagram]](../../diagrams/23/1a0a02911d27366b15f4621ce0bbc3cd.png)
![[Diagram]](../../diagrams/16/dff64df2a49ebafc98a4a17f5bec2a12.png)
![[Diagram]](../../diagrams/7/ad2f64a1a758c87a574d019ee1784d03.png)
![[Diagram]](../../diagrams/39/da1c8cf58049a308a93b3a283d8a00f2.png)
![[Diagram]](../../diagrams/29/d85789c617abff73efe6124138a16fb6.png)
![[Diagram]](../../diagrams/27/b2d8ac7816e05b20b99ba5aaf054aa63.png)
![[Diagram]](../../diagrams/14/0065009abf0344080eb9b01571f55ada.png)
![[Diagram]](../../diagrams/6/cab9ee9a4fb7bcc76e6a43275692d36d.png)
![[Diagram]](../../diagrams/4/d78cee8385e9c39c58846b2345fb4a9d.png)
![[Diagram]](../../diagrams/14/45b6b48331136c590b6f6d32557b96f1.png)
![[Diagram]](../../diagrams/19/1fcfc5e7eee51630236d29d03e20d1cc.png)
![[Diagram]](../../diagrams/36/fd8c343a1d74bace5bb733610746c611.png)
![[Diagram]](../../diagrams/8/a4e66a9e7ba0f7eb30feeee6fe95a65d.png)
![[Diagram]](../../diagrams/18/2eef356d53b786c35194c46e5240d0b3.png)
![[Diagram]](../../diagrams/4/5788fc7eaa384bff9d3be19ebebbcb61.png)
![[Diagram]](../../diagrams/46/515f4d2da30c9132fbb75f5eadeccac1.png)
![[Diagram]](../../diagrams/45/5586a5920ce845f4c235617c13638bf7.png)
![[Diagram]](../../diagrams/7/9483c103d02623cfee2dc7f48812dd0a.png)
![[Diagram]](../../diagrams/2/188e52de90528d350e437411ec61f079.png)
![[Diagram]](../../diagrams/30/4c2682b4f1987016c050d2fe25dbf955.png)
![[Diagram]](../../diagrams/36/2f4d432d672f8348122acd994955d535.png)
![[Diagram]](../../diagrams/50/0068765dd41dbbc927e1ed788fedb86f.png)
![[Diagram]](../../diagrams/12/b17df6d6cd1c8ad3c08a64e0c891fa51.png)
![[Diagram]](../../diagrams/2/8ee202bf8649b63b29204cd9e9b303d8.png)
![[Diagram]](../../diagrams/37/2975c8562b3040673b1b1a3c79ddfee7.png)
![[Diagram]](../../diagrams/6/208e0a40896e5d6d20d2d4707ca7c565.png)
![[Diagram]](../../diagrams/23/007b335098464ea75ec265cf76edd85c.png)
![[Diagram]](../../diagrams/46/801108de5bf1ebedb287f3f0779f2bf1.png)
![[Diagram]](../../diagrams/17/1b63de32af42b282d6a2e400fcdb119b.png)
![[Diagram]](../../diagrams/11/6598e51a762cbfc926cbc8aefc5a368e.png)
![[Diagram]](../../diagrams/17/7e3a5bf2b57bc0146e8d275edf82f660.png)
![[Diagram]](../../diagrams/40/1719dad1e05e2fd6781a23a1261f776f.png)
![[Diagram]](../../diagrams/42/d955dd9d300cef1b9ac22bc75cd17254.png)
![[Diagram]](../../diagrams/40/f5d29ca1062758d50a350ba3c87edc5a.png)
![[Diagram]](../../diagrams/23/16ee0e4b845027d73ad11d855d0d0a02.png)
![[Diagram]](../../diagrams/24/903b4125b13914011f655253d7162e33.png)
![[Diagram]](../../diagrams/48/e2a813cd38d2c00d9da50ede7e5ca665.png)
![[Diagram]](../../diagrams/4/97d2c0f9937daebb5f24958f2c549cf2.png)
![[Diagram]](../../diagrams/37/25b825980e6a89ac1eb159c283a785b5.png)
![[Diagram]](../../diagrams/33/7351c188afcc7763e4029727b2274414.png)
![[Diagram]](../../diagrams/3/a3bae3d0b15a1afd0da4263270cd6256.png)
![[Diagram]](../../diagrams/41/c14bc7562e9e71a8611102bc33b39e6f.png)
![[Diagram]](../../diagrams/5/14dcec0973d65df950821315ad1425c1.png)
![[Diagram]](../../diagrams/40/86b9ec6d907f99e277b659e3b927b623.png)
![[Diagram]](../../diagrams/35/3c4964e87859b5c140ad158c55a55c31.png)
![[Diagram]](../../diagrams/20/ad837ca956474d07f0f5d5b1151d2385.png)
![[Diagram]](../../diagrams/47/5bee196f7914a47845aa65280a7edf49.png)
![[Diagram]](../../diagrams/26/c991ba9f40e794118459e3c5aa18183d.png)
![[Diagram]](../../diagrams/19/6a1740e4d58aa4c279e441046fac6902.png)
![[Diagram]](../../diagrams/15/2d1352169cc9743bffa3b3a620152568.png)
![[Diagram]](../../diagrams/45/4a8ebf6bb718812a09df1504795991a5.png)
![[Diagram]](../../diagrams/1/115aedb5b0e20afb803afade3297790d.png)
![[Diagram]](../../diagrams/13/cbb4c6b6f8b25a2947edbf0b16b9d5ae.png)
![[Diagram]](../../diagrams/24/3dab4b86a0af1d00787e6838e1bfa1d4.png)
![[Diagram]](../../diagrams/2/1c1ff716508aeab6029e6b70d457ecf5.png)
![[Diagram]](../../diagrams/48/cb44cba60fa69c34ab3916489435362f.png)
![[Diagram]](../../diagrams/6/31bc50a45340e96f70d0e6490bcb03a4.png)
![[Diagram]](../../diagrams/35/144fc149cba4a77ee052beda2ed3beb8.png)
![[Diagram]](../../diagrams/51/25028ff9c1e76fc20b09afc761f05562.png)
![[Diagram]](../../diagrams/37/07ae2918216f7fcbc7aee3367156aa1d.png)
![[Diagram]](../../diagrams/12/7decd89ad372230ac34c17c64ec074ec.png)
![[Diagram]](../../diagrams/13/546921938e97270d9bab4b50e044c28c.png)
![[Diagram]](../../diagrams/27/4b72fc81e113b38a1a1b506996ce35e6.png)
![[Diagram]](../../diagrams/41/f541e66a086a825b9c469fec72bcedea.png)
![[Diagram]](../../diagrams/49/98e28420651a9112af6cfc461d3e2367.png)
![[Diagram]](../../diagrams/23/0f38d0583976baf992ebbe1325679bf5.png)
![[Diagram]](../../diagrams/29/fb343ba4693c289fc45bcad50ce2f949.png)
![[Diagram]](../../diagrams/30/85c0f3bfc174b3ba48ee336f91ab2f61.png)
![[Diagram]](../../diagrams/34/7f94dbdc76180238d970cde99014664e.png)
![[Diagram]](../../diagrams/28/96fd8aa477c071c62d2134cc0039a4a6.png)
![[Diagram]](../../diagrams/50/0f624b829b9d6788fabc5499ed952c43.png)
![[Diagram]](../../diagrams/52/e74e4bc9390c2d2c468cd8d09daa706f.png)
![[Diagram]](../../diagrams/6/8339cd9e00432231f3701d9fa15cf8e4.png)
![[Diagram]](../../diagrams/1/be51fe4f5942bcee5a5e3f42ec9120ca.png)
![[Diagram]](../../diagrams/17/2b44d0a61dd434d05734968a1d3ccbf6.png)
![[Diagram]](../../diagrams/48/a7f3edb544cb226b1c03e0aaa9a310cd.png)
![[Diagram]](../../diagrams/15/5c3509a4ae6e1a372dda1cbdcdd348e0.png)
![[Diagram]](../../diagrams/2/bd46a9b31b9aa04f443ccab50aa3acd5.png)
![[Diagram]](../../diagrams/40/909d5b380c6b79617552dbd33b25bbe5.png)
![[Diagram]](../../diagrams/27/05bcd70e012925cd216a84aee2799851.png)
![[Diagram]](../../diagrams/15/0651e70cb6866ef88fc237ad743d34af.png)
![[Diagram]](../../diagrams/5/99cf9d0d502054eef7fb4b9ab22fd61c.png)
![[Diagram]](../../diagrams/41/6372dae4e62b168749dfa7a4972db938.png)
![[Diagram]](../../diagrams/31/0eb5587ea2977b47751569d7e3995b0f.png)
![[Diagram]](../../diagrams/3/f8b98bcc960612a770f283b37ce63218.png)
![[Diagram]](../../diagrams/12/ce96e0787d907a6a35a7bceba7e324f0.png)
![[Diagram]](../../diagrams/25/2f0ab312318a3487ff6767392124429b.png)
![[Diagram]](../../diagrams/38/4fac1dd649d472f16f5dace0b55c9ebe.png)
![[Diagram]](../../diagrams/11/dca986f3f9bfef3f6694974e09de7b96.png)
![[Diagram]](../../diagrams/22/ffc3d1085a1aa07a14d89660b972b85f.png)
![[Diagram]](../../diagrams/51/cbce1ef480c9c901e1e6e63af77820fc.png)
![[Diagram]](../../diagrams/3/86ad4a9e64aa7340ed1ae675fe137ff3.png)
![[Diagram]](../../diagrams/50/2484f9379bd2275a5610080c342828ea.png)
![[Diagram]](../../diagrams/46/5463176a8687e312ef9dcf4fe78a55de.png)
![[Diagram]](../../diagrams/2/d63611a333aed12e6bb41967c60ddda8.png)
![[Diagram]](../../diagrams/0/6d7ab078c7a9b034389d2c1d6c1994aa.png)
![[Diagram]](../../diagrams/40/662240aa4fcc1652eefd473f9f5088df.png)
![[Diagram]](../../diagrams/4/05cc15bc4d996dfc1b710d1685640f7f.png)
![[Diagram]](../../diagrams/17/4c6807cfef12a9720b9910c47d1ff9c0.png)
![[Diagram]](../../diagrams/14/50e7f2fcc667d181e1e3f7bca49b20a2.png)
![[Diagram]](../../diagrams/0/363f4276ff29e77bd8682482e061f768.png)
![[Diagram]](../../diagrams/48/fbb97a72afd745c8c1da85068c1b28d6.png)
![[Diagram]](../../diagrams/33/634e96eea6180cf5623db0bdcafc88f5.png)
![[Diagram]](../../diagrams/30/e414c90a544abc46564dbd3227c48eda.png)
![[Diagram]](../../diagrams/20/cdef1eb13fc3ae3f94664c829dc156b1.png)
![[Diagram]](../../diagrams/48/b96969295e6ded95107a4cee113a20b7.png)
![[Diagram]](../../diagrams/52/e209d53ba2a24b050556c6a8857bf0f0.png)
![[Diagram]](../../diagrams/37/3b74e3f40b3fecefc92d8559ccd86237.png)
![[Diagram]](../../diagrams/27/dca124738632952fc5c5e44f4016685e.png)
![[Diagram]](../../diagrams/47/fbbc6363140f939bd903d1a7797a1230.png)
![[Diagram]](../../diagrams/48/6dbbba2d1d703d7222e896968810bacd.png)
![[Diagram]](../../diagrams/36/458f326bf4faeec8706c96c4562dcce7.png)
![[Diagram]](../../diagrams/28/b17a22a784adb0718a0bce98da2a9cd5.png)
![[Diagram]](../../diagrams/25/bad9a222340d9056ee1704c9b2c201ce.png)
![[Diagram]](../../diagrams/2/23388d127f2a3b5bc655a96b8e2b692c.png)
![[Diagram]](../../diagrams/14/851b63af3164ddf932663ee9828a4e02.png)
![[Diagram]](../../diagrams/42/4ffd1a0fc20ca656490ad89da92ffa94.png)
![[Diagram]](../../diagrams/38/6cf861393d5934802b19058276269860.png)
![[Diagram]](../../diagrams/0/c90ecbe4b368a8ddc36353b490a379c6.png)
![[Diagram]](../../diagrams/51/569139fb90963a238beef56e66623d8f.png)
![[Diagram]](../../diagrams/14/e5b523655a936998d3dd17fcf8633e6d.png)
![[Diagram]](../../diagrams/36/aefa27b55839bf9039d505da009a6466.png)
![[Diagram]](../../diagrams/31/702c55a3daf519324985aaceb92cc42e.png)
![[Diagram]](../../diagrams/44/c5973195cb0e00e7be714d137665042d.png)
![[Diagram]](../../diagrams/51/97a1d2d31c921a9b0cc1347ac20366dc.png)
![[Diagram]](../../diagrams/11/b0de1b7f66d1d4825523c5b044586a6c.png)
![[Diagram]](../../diagrams/30/60e39cf787fba48c27ca69d78b397537.png)
![[Diagram]](../../diagrams/48/f249df8688fd9346b63e49789d59399f.png)
![[Diagram]](../../diagrams/3/48136b6638eb55641141db282168513b.png)
![[Diagram]](../../diagrams/44/05d2d19e69dbe09f851288af73129dfe.png)
![[Diagram]](../../diagrams/8/15319087bf7a77624609273ac127b1d0.png)
![[Diagram]](../../diagrams/13/a4e4902108c0ec7e19b3987cb464a3e5.png)
![[Diagram]](../../diagrams/17/6629c99cafd42170afe05a052e610801.png)
![[Diagram]](../../diagrams/22/3785106c9f09830f91f706f9e2a037fa.png)
![[Diagram]](../../diagrams/1/8464def33f3f19c2f1dbe888b5087d4a.png)
![[Diagram]](../../diagrams/10/a2e9a82687f69367e1483056380daf19.png)
![[Diagram]](../../diagrams/28/c97efd4f3236777f91da587845c57ddf.png)
![[Diagram]](../../diagrams/42/67e228ecb7f957253ac8d98819443311.png)
![[Diagram]](../../diagrams/51/ec3f83c50dd97cc2aa5952e11b422211.png)
![[Diagram]](../../diagrams/26/4ced3ebb629f6a564fb2017057330beb.png)
![[Diagram]](../../diagrams/17/1320fa5b4a0b8a55ef71fc4f0238e86a.png)
![[Diagram]](../../diagrams/38/62de3e087b40143bd8a8e0b4c0df6a72.png)
![[Diagram]](../../diagrams/33/86fa4f67f3d9c8787b7d1f3909d26310.png)
![[Diagram]](../../diagrams/35/d7096699071129ae26d5bf3507b7b48c.png)
![[Diagram]](../../diagrams/16/dc331c1805ff04eb7ca5037d8398f71c.png)
![[Diagram]](../../diagrams/29/7303342dac6556bcebf7be0d40044e41.png)
![[Diagram]](../../diagrams/32/72f30010d8980a70a1f9e5c0781e333d.png)
![[Diagram]](../../diagrams/48/33538f1b7b0565f8a0a13ee9b8d4d441.png)
![[Diagram]](../../diagrams/10/dd46793e627adc92fa881ed6cda1ffb8.png)
![[Diagram]](../../diagrams/13/ae5c8bf87c084323d9a1d5edbd35cc72.png)
![[Diagram]](../../diagrams/15/601549519fcf54008f18e60f38c14044.png)
![[Diagram]](../../diagrams/1/42dbde4df7b1ec236c4936d0b2c86839.png)
![[Diagram]](../../diagrams/45/53064ed4fd4aa8b730e83ff01771a2d3.png)
![[Diagram]](../../diagrams/10/758d7948335d3beeffcbb8f39150bd26.png)
![[Diagram]](../../diagrams/47/fa5622ec7028822fe7e004830d5d21e3.png)
![[Diagram]](../../diagrams/16/a7c5947f20043d21e88124883fce908f.png)
![[Diagram]](../../diagrams/9/0436288582dc990ce23294df8e718651.png)
![[Diagram]](../../diagrams/31/8e2b7750f5bbccf7c06d4d05c67f7c98.png)
![[Diagram]](../../diagrams/33/574634e8580c731d8e8743ff3b8b7fc0.png)
![[Diagram]](../../diagrams/28/05a317b83e4ab41ed1313ad0aded75ef.png)
![[Diagram]](../../diagrams/46/2147eac369603c3e218007c9c8cfb40c.png)
![[Diagram]](../../diagrams/11/abc146d370915b91305f305a0f4de057.png)
![[Diagram]](../../diagrams/42/4e2394a7a7dff922089a2d511bd15c5a.png)
![[Diagram]](../../diagrams/49/4700298cd930f0792c1f76d8bc2f5ab3.png)
![[Diagram]](../../diagrams/33/c3ce1e5b6104364e1864e481a7e0aedd.png)
![[Diagram]](../../diagrams/32/33b8b1100bf1eb80d7b690a8cf68b207.png)
![[Diagram]](../../diagrams/39/fd688f348ccef5456a5405cbede7a4d2.png)
![[Diagram]](../../diagrams/46/aac10c308b747ba4cfe89e2c0e5b59c9.png)
![[Diagram]](../../diagrams/2/0a5fa186e0c2361aeb93dbca83d4c85d.png)
![[Diagram]](../../diagrams/2/3cf1fa2d11a665eaff2a4a5435dddd7c.png)
![[Diagram]](../../diagrams/11/a093446321c1d3d5b89c227344e82078.png)
![[Diagram]](../../diagrams/24/1bec719e4f7871647db6dbed63d223ef.png)
![[Diagram]](../../diagrams/31/effc48612b45b0ff4a2c02581aa32f96.png)
![[Diagram]](../../diagrams/8/5cf2d71beb654a3bb2a193f4cd5f7ecd.png)
![[Diagram]](../../diagrams/15/e509d321be64c6ec357c6b49c53002a4.png)
![[Diagram]](../../diagrams/48/0183c6726b26d73913e090bb370dc47c.png)
![[Diagram]](../../diagrams/45/c101b2af6894c75f46105a4e31885819.png)
![[Diagram]](../../diagrams/14/683cc1e9f078b1f72fb8c5b83dcbe700.png)
![[Diagram]](../../diagrams/12/606c781e10d9fec29f42eab95094b624.png)
![[Diagram]](../../diagrams/10/1e23d53e66afbd335dcc011d46c56365.png)
![[Diagram]](../../diagrams/37/7d3811de5f60a84ebd1670bb6d393c10.png)
![[Diagram]](../../diagrams/25/b156c3890a06aef0abcf2f2e7944b856.png)
![[Diagram]](../../diagrams/20/d1da293ec2062bcc04a8d6d542a5b9f9.png)
![[Diagram]](../../diagrams/33/ffb5b0a0876392d4a19566100a9e06dd.png)
![[Diagram]](../../diagrams/25/983ca76d39b77de519d7bea5a70b6bc4.png)
![[Diagram]](../../diagrams/17/9be2086383abc24e01c3a26107dd04c5.png)
![[Diagram]](../../diagrams/8/08fc585544f1bce9f1d6687515425e2c.png)
![[Diagram]](../../diagrams/49/2b1f6b8fb38b8a528f4b2c0b60240774.png)
![[Diagram]](../../diagrams/45/40b8364d74ce7a26a6ab0687190579a9.png)
![[Diagram]](../../diagrams/5/3df579cb3893c088740a5cec1248bfce.png)
![[Diagram]](../../diagrams/17/9a26003b890106d717f9a83895215d1f.png)
![[Diagram]](../../diagrams/31/ec026c5cc138aa853d73eb0216051333.png)
![[Diagram]](../../diagrams/16/ab6aa00fe368189851b0da265f5d392f.png)
![[Diagram]](../../diagrams/22/c6e818f9dbc78bc03f95f4398fc16ec3.png)
![[Diagram]](../../diagrams/44/a3c10edce6011f94279209055ebe7097.png)
![[Diagram]](../../diagrams/18/8e8aeec9c224ff67e84534918958305a.png)
![[Diagram]](../../diagrams/14/76c5439353aa5c50f0e14e84d9bc1479.png)
![[Diagram]](../../diagrams/28/577a1039817ddd914ecd66b46977fdaf.png)
![[Diagram]](../../diagrams/6/1d0d364c7b41330c418becbfdbd2042c.png)
![[Diagram]](../../diagrams/33/1a209bc21dcf9ee3fbe2609054d0f1f7.png)
![[Diagram]](../../diagrams/35/ec0b24acfbacb47c4ee5120ccf000cd2.png)
![[Diagram]](../../diagrams/44/c957f9a18e5c1a117c52cc7ad8fb16f1.png)
![[Diagram]](../../diagrams/25/fe797d0463b6334322eab37f0de79fd2.png)
![[Diagram]](../../diagrams/9/249af773e5da94d671003e892cd189cb.png)
![[Diagram]](../../diagrams/25/986fd1cfc2b532ac6c4f5496ca1fa48d.png)
![[Diagram]](../../diagrams/1/70cbcc1915a67c6ef9783dd223b60fae.png)
![[Diagram]](../../diagrams/17/db47c3dfc108dabaac804135eb3f20f5.png)
![[Diagram]](../../diagrams/12/63fdbe040529bcf37f9bbadc8b6ba5b9.png)
![[Diagram]](../../diagrams/36/b6d2382fb7147a7d408a3e63b1fc6903.png)
![[Diagram]](../../diagrams/15/3984453d3bd640c497425d8bfd396f9d.png)
![[Diagram]](../../diagrams/23/ae6bc104a685c1f1eb4374c1d712973c.png)
![[Diagram]](../../diagrams/14/4176342afbae9fed6d2b1a7c5cf0c3e9.png)
![[Diagram]](../../diagrams/20/030fe18b0f96f7f1579b2e108baa9cf8.png)
![[Diagram]](../../diagrams/6/e31a45dad885f2ebb5c68956236004ff.png)
![[Diagram]](../../diagrams/40/0d45e93dfc5dbc53d4ffe5c2a415925d.png)
![[Diagram]](../../diagrams/20/bbf9de97b15a9b5a801255d6691326ba.png)
![[Diagram]](../../diagrams/18/24b3090f8c5cdf4c76ec71fa0d50884b.png)
![[Diagram]](../../diagrams/7/6ef48272176f49573345116ad7025bdb.png)
![[Diagram]](../../diagrams/20/e5bf061d4ea33147c009222ebb5f99f3.png)
![[Diagram]](../../diagrams/19/5a4a2faff592529052b4c88860663a58.png)
![[Diagram]](../../diagrams/14/402812d16df65ac8d257dd7cbb64e810.png)
![[Diagram]](../../diagrams/3/4348e21506d11315d6ad846b6a4df79c.png)
![[Diagram]](../../diagrams/1/6dc9283af861b9212532b28d8fc47901.png)
![[Diagram]](../../diagrams/2/e15a06115ae58271944227ab9161a4f7.png)
![[Diagram]](../../diagrams/8/119f4cad478a8de1e21141c7984bf893.png)
![[Diagram]](../../diagrams/15/bb37ffbf5e4ef7e9f8c30a2850a78199.png)
![[Diagram]](../../diagrams/27/0a5b20d5206b64577e2cab1980618559.png)
![[Diagram]](../../diagrams/16/00fdae9a8c3e025c96e0a26c83e5f452.png)
![[Diagram]](../../diagrams/22/c80817804c28aed4350d57f5da35f92c.png)
![[Diagram]](../../diagrams/35/ef383ef6a6b3eabb7bf8abf923725e81.png)
![[Diagram]](../../diagrams/7/127975d051a6578ee85f44b9279208e6.png)
![[Diagram]](../../diagrams/34/68d1c1e8a4c16ce96c0500859197763c.png)
![[Diagram]](../../diagrams/16/4d866e87378e99925e91d76445857b42.png)
![[Diagram]](../../diagrams/52/83ac1951919b065d6f8ff93ec2b9c979.png)
![[Diagram]](../../diagrams/33/a2eaaa67d41d4dd4b3d8def5b355ef08.png)
![[Diagram]](../../diagrams/8/fcb61dc3ca3afd2019f8ff3e3b572fc4.png)
![[Diagram]](../../diagrams/1/ac43103fed8618fcbd871a5bede25aa1.png)
![[Diagram]](../../diagrams/28/9e04a9d330b0c3fd5b4b0271e0b6d340.png)
![[Diagram]](../../diagrams/32/61667c9b4e924ca6b389e75d45487de9.png)
![[Diagram]](../../diagrams/41/2e0bf5f40488dcb6d8b4df02c68cfabe.png)
![[Diagram]](../../diagrams/7/3f3f466825b0bb6862fd0ab9484c14df.png)
![[Diagram]](../../diagrams/21/99d0e888b51b32df34f490716cc340cf.png)
![[Diagram]](../../diagrams/36/19c3aeeafb0015a89b1b3eba25b3fc13.png)
![[Diagram]](../../diagrams/40/88d158f2e649b27b199ebc3bf661e44e.png)
![[Diagram]](../../diagrams/27/61d6a4d45e8111920bc8d458fa461b37.png)
![[Diagram]](../../diagrams/12/c200da66950383c1c0eb1857d9bc8749.png)
![[Diagram]](../../diagrams/17/b9c7a10a86ea7216c72329af295f3d20.png)
![[Diagram]](../../diagrams/3/e2595f38821617a5d35d595108715ccf.png)
![[Diagram]](../../diagrams/38/3f0adf2d2cfd8ef829059650cff83061.png)
![[Diagram]](../../diagrams/7/0d5fd9ceb2f34de2d0fea2b02cbe657f.png)
![[Diagram]](../../diagrams/14/704f1b37ceef65853ab9986aec950d0f.png)
![[Diagram]](../../diagrams/35/6c3044b801b2b7baf5202d0788d55235.png)
![[Diagram]](../../diagrams/12/0a5fb24a8634d0642df47da2912932ea.png)
![[Diagram]](../../diagrams/2/3254f5fe1495ef81fb192ec6de0bb110.png)
![[Diagram]](../../diagrams/12/c2a4a580fb6ca9483a47ce42f77de9d0.png)
![[Diagram]](../../diagrams/45/4832b3b6c8cb88b60f599ce064cbb00b.png)
![[Diagram]](../../diagrams/4/afde7d1488913f920e8cfb453bf4f0b3.png)
![[Diagram]](../../diagrams/1/b61a9118df26cbf7245abc116f43e768.png)
![[Diagram]](../../diagrams/41/ec323168c3616b3bd803b9dfc4b33549.png)
![[Diagram]](../../diagrams/26/3d12d8de171d36bdc2873e93ef8ff05e.png)
![[Diagram]](../../diagrams/4/458735743e2b4a8df68a58a040a56817.png)
![[Diagram]](../../diagrams/19/14e87f670103ec5cd636422d089a98f3.png)
![[Diagram]](../../diagrams/13/27e22a1997105836cd70e5169f3d5e0a.png)
![[Diagram]](../../diagrams/4/0507b676e58151475c28cffed7377381.png)
![[Diagram]](../../diagrams/34/f29ee5ea62eef85de47e064f2f0da343.png)
![[Diagram]](../../diagrams/14/e630cbbf9c73723bc78c15848d87fd42.png)
![[Diagram]](../../diagrams/13/a95192fac85d16cb39e6e7bde1c0f928.png)
![[Diagram]](../../diagrams/39/dabf1c6eb92b48dfeceb6e4750fa74e6.png)
![[Diagram]](../../diagrams/30/773575305d74e5f43f3b94ef25853d69.png)
![[Diagram]](../../diagrams/31/390fd06654c07f5a4232a510bbe77f79.png)
![[Diagram]](../../diagrams/0/ba7c003e493f8a79fb1db2d03071fcbe.png)
![[Diagram]](../../diagrams/11/dd67dda9f087b6faadda6ccf1863a78a.png)
![[Diagram]](../../diagrams/21/cbe675bed05c81bbfc7aa77f5b0c8afb.png)
![[Diagram]](../../diagrams/46/b52bc324e8f505a435e63c4cdbd2c23b.png)
![[Diagram]](../../diagrams/39/3ee0b2bc01f5b8a1686ad2538b3063d6.png)
![[Diagram]](../../diagrams/7/98872858a127bfca1db6468d3e3c548e.png)
![[Diagram]](../../diagrams/2/a107723e6c825f3178f8bbed7658bc04.png)
![[Diagram]](../../diagrams/2/61d339475a4b876f6045963fcd684636.png)
![[Diagram]](../../diagrams/7/084d8579fc0eebf01b57b60ae93ff11a.png)
![[Diagram]](../../diagrams/12/35c8d8c79c2bbcda2f7f71726510dc4e.png)
![[Diagram]](../../diagrams/16/d07c14c9b7b3e17c484d446eb80e8d6a.png)
![[Diagram]](../../diagrams/48/71a0c80d2c1090b08e7dc72de1928a77.png)
![[Diagram]](../../diagrams/45/d8810a1b8afe7dd9825caf7d2481eb35.png)
![[Diagram]](../../diagrams/6/75408f667dade31be693c0c787e77117.png)
![[Diagram]](../../diagrams/30/7e0e1edfa84ad88810ee3f65a2537f56.png)
![[Diagram]](../../diagrams/1/7797d848f66512953b4a0da9c7b13a1a.png)
![[Diagram]](../../diagrams/17/0d8b8e0d3dfb691d562fb7e84180d7b2.png)
![[Diagram]](../../diagrams/51/762680f4b02f29f6f26c6ab4f4094b37.png)
![[Diagram]](../../diagrams/27/7e6a74bab868d274a43e47aa82dca3f8.png)
![[Diagram]](../../diagrams/33/d26e77cd62a1c439987d2915c4444746.png)
![[Diagram]](../../diagrams/16/87c323f14ecc95e6bbe7e1fe6e8a1369.png)
![[Diagram]](../../diagrams/12/62c99785a0a2ccc19ff092db15f38636.png)
![[Diagram]](../../diagrams/40/eba7fc015a4be163a9db2d12420aa318.png)
![[Diagram]](../../diagrams/36/589c119bc72f6d8faac01c2ebdc8d973.png)
![[Diagram]](../../diagrams/30/f71f6ee0c3affce5e373fe4aa8a0926e.png)
![[Diagram]](../../diagrams/35/ef0f25c58d0f4883535007549bc1e65c.png)
![[Diagram]](../../diagrams/25/5d628a7480a60b679e006f4271e0b13a.png)
![[Diagram]](../../diagrams/23/b55270a76c9f36dff64cc6e15a0c67a1.png)
![[Diagram]](../../diagrams/38/74b5bb6707d2d96c973c0aa1c62886e0.png)
![[Diagram]](../../diagrams/20/7c5d570075dd6589b19c74052cdef599.png)
![[Diagram]](../../diagrams/43/e1e8371726e055ff0815864500ed80c2.png)
![[Diagram]](../../diagrams/8/f0d7919ac22ef0f945bb0ae9071f4a5c.png)
![[Diagram]](../../diagrams/39/48b99714f75cd4239c12322870cf29a1.png)
![[Diagram]](../../diagrams/7/560b4d87b66a1d554f30cda07b50e658.png)
![[Diagram]](../../diagrams/23/9ee958f563fd8fed9cb64ee50a48ad8d.png)
![[Diagram]](../../diagrams/17/7035402daa40c618c3d39104a76d7d20.png)
![[Diagram]](../../diagrams/9/435bd68d784e86a0f616013def040017.png)
![[Diagram]](../../diagrams/6/3d516c54325ae5d717b24de809300c28.png)
![[Diagram]](../../diagrams/0/c7ae994f06d44af0a1ae04a4ec450979.png)
![[Diagram]](../../diagrams/5/6f28b2b772ceccbf02cff7136e4e11f2.png)
![[Diagram]](../../diagrams/7/0c8b37f778c2a0af09e1641af8e0f101.png)
![[Diagram]](../../diagrams/14/9e49342085e8e9ade8353eaa5d24269c.png)
![[Diagram]](../../diagrams/2/f129e4fd3539782a55bc936254c84e67.png)
![[Diagram]](../../diagrams/38/7e5a908d848461e3787edd6b44c9d710.png)
![[Diagram]](../../diagrams/4/46245d72004b65f58b78a3c079bae48e.png)
![[Diagram]](../../diagrams/20/57cadd10ac66a19cbc5b6ba0cf70bfe4.png)
![[Diagram]](../../diagrams/17/8d07e14d9d631cc9c8761e27b0cbfc89.png)
![[Diagram]](../../diagrams/6/189f68b4515dc01441cd52cdfe914c61.png)
![[Diagram]](../../diagrams/41/6ba4e3b87b382b1660bf9d4e5de7beda.png)
![[Diagram]](../../diagrams/25/94e1e895e1336aecfc0bfae56b00e6e4.png)
![[Diagram]](../../diagrams/51/c308240859b5713909f635f20a1acec2.png)
![[Diagram]](../../diagrams/18/b363b66b274bae6aef7595026d4b7dcf.png)
![[Diagram]](../../diagrams/44/d0445591b658d7ed5bc2b0f4f4e85e19.png)
![[Diagram]](../../diagrams/29/2af22753a641a227fddb4c0149b4954b.png)
![[Diagram]](../../diagrams/51/cd37c646caee36bbebdcd9ea6b409766.png)
![[Diagram]](../../diagrams/18/433bd87bd293f2e05a4cbcbe75b5378a.png)
![[Diagram]](../../diagrams/48/4b6b36dea37e12763adf0e8e56ef839e.png)
![[Diagram]](../../diagrams/21/8d439d0b583982919be516534a6e55eb.png)
![[Diagram]](../../diagrams/14/07cf66988f51397ccf29ad6ca640a54d.png)
![[Diagram]](../../diagrams/45/85d0db5fedac22b9aad9fe406ad0e75f.png)
![[Diagram]](../../diagrams/41/e6b352393be3cd1c8da8fa758453f08b.png)
![[Diagram]](../../diagrams/18/03bae75ae5effce0f9d7514b2d52948a.png)
![[Diagram]](../../diagrams/2/ed2112d5de77b2f78e533a72d59828af.png)
![[Diagram]](../../diagrams/52/cb230d2f07dafb460e25c89d5fddd65e.png)
![[Diagram]](../../diagrams/30/0ba4a5a76ff2ca34e5b4591f8b513f7d.png)
![[Diagram]](../../diagrams/42/73b4d26b9db1fe6cd9c3458158c04d5f.png)
![[Diagram]](../../diagrams/34/0d3313bb17d936a58e91ecb99cb61536.png)
![[Diagram]](../../diagrams/28/190147864633b9d04a78699fb177cd7e.png)
![[Diagram]](../../diagrams/18/07704b302680efe58dadb3ccba818a86.png)
![[Diagram]](../../diagrams/31/fd74baac0ddb1942eb12cbce6c9c1bfa.png)
![[Diagram]](../../diagrams/22/29d58d802b87f0e307f1a47f34bbb1f6.png)
![[Diagram]](../../diagrams/1/7b54ee97f412c0e5e0f146370eada998.png)
![[Diagram]](../../diagrams/12/5b94c8cbbaf2ed62f4a05cd7c1ebaed6.png)
![[Diagram]](../../diagrams/33/ec9728bf46842f7e5e2f47d976c79afc.png)
![[Diagram]](../../diagrams/36/1c4e4976c00dd86def44aac89241b8a5.png)
![[Diagram]](../../diagrams/18/ca9453a5adec15fb2d4167d246fe2a8d.png)
![[Diagram]](../../diagrams/45/8fde1cc9832e08239dec861b25c8b17c.png)
![[Diagram]](../../diagrams/22/3a19ad4990bf66eee0e3fc97659172a9.png)
![[Diagram]](../../diagrams/11/ec0e5668d09fdb55f5b4284e27b10571.png)
![[Diagram]](../../diagrams/6/7d64693f671dbc63f6cc4f9fa9aab3f3.png)
![[Diagram]](../../diagrams/36/b201b451cedad3c4de05235dec28ca49.png)
![[Diagram]](../../diagrams/20/04838ba6ebb1f2860b8eb041add9b473.png)
![[Diagram]](../../diagrams/33/e2e888ddea8953d353f124e5e04daa33.png)
![[Diagram]](../../diagrams/24/8a147653ebb625633302d42936a7666b.png)
![[Diagram]](../../diagrams/21/7ef430af0adb1eeb8c7f9e47481498da.png)
![[Diagram]](../../diagrams/7/dbafa01023d8c345688020d8f28bbb44.png)
![[Diagram]](../../diagrams/43/d001eb97f9d8aeece2d1c707823a80a6.png)
![[Diagram]](../../diagrams/11/21d88d38d24b8a6dfa9c089fd752b63d.png)
![[Diagram]](../../diagrams/18/5ff9d0da1b8df4a29ebd8d33f84ef7ee.png)
![[Diagram]](../../diagrams/10/3e1bba601a471418564e93cd9b295b8c.png)
![[Diagram]](../../diagrams/13/f30644a25590fcf30f3d8a13c849c1a9.png)
![[Diagram]](../../diagrams/0/64791559e978b5354890e280e7e971c3.png)
![[Diagram]](../../diagrams/11/985d0c657cae4ff50b23ed8876e11b3b.png)
![[Diagram]](../../diagrams/47/8d44a50a73365f0b1930d8d133672455.png)
![[Diagram]](../../diagrams/37/2d63aa92caee5aab8926eebf7aa6334f.png)
![[Diagram]](../../diagrams/40/8f7cb16f482bfa4e4cf1dcdabab238ab.png)
![[Diagram]](../../diagrams/40/ec7c1292e70ac5396e08232bab88d0a2.png)
![[Diagram]](../../diagrams/31/014105755089caacf7084075493a161c.png)
![[Diagram]](../../diagrams/9/dc0f6e82b1d34937cccf6b6079e0ea07.png)
![[Diagram]](../../diagrams/36/3f5f8ce699ab4ba7d27aa49784cd7b7d.png)
![[Diagram]](../../diagrams/0/81eb108a7e5d14e09234981b7aed0616.png)
![[Diagram]](../../diagrams/23/66f579444ad26b22b7d62204cdceca6e.png)
![[Diagram]](../../diagrams/9/db05a29fc6215fac79d29ae7419d3943.png)
![[Diagram]](../../diagrams/29/d72e5dced657ca7ae1a68d60c86b4cec.png)
![[Diagram]](../../diagrams/16/08ca49d05d2257ddf2737fef295e0afb.png)
![[Diagram]](../../diagrams/9/f3720a07f3e1345afab248bf146b6942.png)
![[Diagram]](../../diagrams/46/1b61ee8c926c1e14198a694b878fc219.png)
![[Diagram]](../../diagrams/0/c006fddd10b445f13ba95c493c7fd76e.png)
![[Diagram]](../../diagrams/18/bb85b5f1ec2e45cd3f9c563ba9bdc408.png)
![[Diagram]](../../diagrams/5/58712686d9333e01f72be4bbe24fa9b6.png)
![[Diagram]](../../diagrams/42/32207cb2bec6d303112650e36645efa1.png)
![[Diagram]](../../diagrams/35/f2ab4c7367049b1ec6d4a432bcaaa05d.png)
![[Diagram]](../../diagrams/36/c44e941c33d19851d9b440d9aa320bf2.png)
![[Diagram]](../../diagrams/28/0a8dfdab9fdd86d84ec0cf28bad552ed.png)
![[Diagram]](../../diagrams/22/d64a34277c794a397d93e6f9ecd2a5fd.png)
![[Diagram]](../../diagrams/48/57d67097916fba8714d333532a160347.png)
![[Diagram]](../../diagrams/7/d048f3c1c5d6dedc82190895698282c8.png)
![[Diagram]](../../diagrams/49/d5caa26aa3a280f1850ffa138a00a423.png)
![[Diagram]](../../diagrams/26/ce5a911cae44111f446053d9ab93aef2.png)
![[Diagram]](../../diagrams/51/fce8a92e07d8a23cd83ab8c0e1153fbd.png)
![[Diagram]](../../diagrams/44/e885033c91c42e6a430d0296f8679c3b.png)
![[Diagram]](../../diagrams/31/bcafb155b0f74a1eb2184ba73b4df432.png)
![[Diagram]](../../diagrams/50/004f2daf6722ea7c8bbcd1708bd59a99.png)
![[Diagram]](../../diagrams/52/9ca8c20fe766317cdea06430a2c6aadc.png)
![[Diagram]](../../diagrams/40/b949c34027102e036550470618b63bad.png)
![[Diagram]](../../diagrams/44/3bd570b1fac686361774e774a768f419.png)
![[Diagram]](../../diagrams/16/062d4d6c7bcde818525994c6d876c6e1.png)
![[Diagram]](../../diagrams/4/8c72682ed6d0af93581c2244622a1d84.png)
![[Diagram]](../../diagrams/30/c970b7d6c086b7b214a75147b3058b25.png)
![[Diagram]](../../diagrams/9/bc72f792dca4eeb82edb83a524727452.png)
![[Diagram]](../../diagrams/19/03d1ac4261c75d22350d59a026c81ecd.png)
![[Diagram]](../../diagrams/36/41a2316b78d84f5adf2728116fc61a48.png)
![[Diagram]](../../diagrams/44/51c60489c85e66aeb5e5d2ef7b8cd7f7.png)
![[Diagram]](../../diagrams/44/e772a942c2b0605e837917b73f7286da.png)
![[Diagram]](../../diagrams/32/5d0a5e065f0da00d1cac4050ed5226e6.png)
![[Diagram]](../../diagrams/44/09781b940bb4116ecede9af649d967cf.png)
![[Diagram]](../../diagrams/11/0f4223977b34e1f649a092d998209bf7.png)
![[Diagram]](../../diagrams/52/84f798133992b858d86087083d9c619b.png)
![[Diagram]](../../diagrams/33/e6b066a39e3e876a7e02ec4dab12321e.png)
![[Diagram]](../../diagrams/13/bdba7f44de0e7dd72dba65bfc8dba9cf.png)
![[Diagram]](../../diagrams/31/4e8a535114f7aff88e51d1c9fde129a3.png)
![[Diagram]](../../diagrams/37/225e359e4fe0a7ada2b408cf2bd7a24d.png)
![[Diagram]](../../diagrams/18/ee80b547aaed20c085558e8afe1e37f9.png)
![[Diagram]](../../diagrams/50/77b608ad7b0a7bfc12e3040606321975.png)
![[Diagram]](../../diagrams/22/d9f54f96a9c1a30c24457c986901c796.png)
![[Diagram]](../../diagrams/27/bc14b4aeb6cfad7472c7aaab0a6a725f.png)
![[Diagram]](../../diagrams/11/04f3bd673587482618e2305114704fd6.png)
![[Diagram]](../../diagrams/1/68dab37a79a5199d950b011fa2ee51bb.png)
![[Diagram]](../../diagrams/2/a01e83cf2b6ad1a9902247ddcd21608f.png)
![[Diagram]](../../diagrams/21/639b25911ffc364e4c4b49795a613b99.png)
![[Diagram]](../../diagrams/2/19aad5980ee4dbf99d090a1046ab0a5c.png)
![[Diagram]](../../diagrams/18/0b7f53342ef6e59b015c43c57bda5a94.png)
![[Diagram]](../../diagrams/44/93f105c3cce5e81ed2383fdb82008c85.png)
![[Diagram]](../../diagrams/1/1fe6fc8a61279803a804efb8e757aead.png)
![[Diagram]](../../diagrams/12/96508ee8074ed2e1eabf273e83b237fb.png)
![[Diagram]](../../diagrams/5/010d4eb670c13d74bbe46f2829e35e36.png)
![[Diagram]](../../diagrams/41/b4bb58f0828f9b7e9be124c2c97f3442.png)
![[Diagram]](../../diagrams/4/bcb7a2164f0a683b0596144e5715406f.png)
![[Diagram]](../../diagrams/15/365dae9181086582a978f84249779d43.png)
![[Diagram]](../../diagrams/46/385eb20958505d74f19dd53cb2994f54.png)
![[Diagram]](../../diagrams/21/e4da8f212d9aabd9cca7d059f4969796.png)
![[Diagram]](../../diagrams/24/cd15a982851c5b0893d30e7f67d7ae73.png)
![[Diagram]](../../diagrams/14/bb4b8253133e176ec06556cb8877db42.png)
![[Diagram]](../../diagrams/14/937034ba548946e5ea2d7f5b835f0ca0.png)
![[Diagram]](../../diagrams/18/784821acd24765b0772c7a8cc2158311.png)
![[Diagram]](../../diagrams/44/410c4162ca3cd2cfae05fff8c8d7a8fc.png)
![[Diagram]](../../diagrams/52/38e21eda8600bd8eefca56d84cf69173.png)
![[Diagram]](../../diagrams/31/bd08d38a70cd2d8d487bce1b27cd4e93.png)
![[Diagram]](../../diagrams/48/0a593dff57831b1f58eeedbdb83c9059.png)
![[Diagram]](../../diagrams/28/904db9940727dc1995e54b992b472bf2.png)
![[Diagram]](../../diagrams/40/faa4cce9c1157db13bfb1dad2556ea8f.png)
![[Diagram]](../../diagrams/50/83c031da7c05525c17919796176d6984.png)
![[Diagram]](../../diagrams/39/0f705fca652e89565bdd2484bccfe2bb.png)
![[Diagram]](../../diagrams/0/a1de6ab3c677fc34293753429bb0f4c5.png)
![[Diagram]](../../diagrams/12/effae535c6ae8ed6fd7875b3cfa331ce.png)
![[Diagram]](../../diagrams/0/00569aab528ca14dd25a3601e9fe78b4.png)
![[Diagram]](../../diagrams/17/d686d08b30aaee6abac44ee045fd41e8.png)
![[Diagram]](../../diagrams/27/98f47973cdba7d5e3c2b35e9db37b086.png)
![[Diagram]](../../diagrams/17/542c52642cc7b6ac319bad6a764d24c3.png)
![[Diagram]](../../diagrams/43/85ce44311aec56610fccd7747fd562ac.png)
![[Diagram]](../../diagrams/34/26497d1190dd117d1639c7916ee751a8.png)
![[Diagram]](../../diagrams/36/79e72aae864f3b9a223a12bc45432815.png)
![[Diagram]](../../diagrams/0/0ca10ca45706a6bc844588a9f5f5e4d9.png)
![[Diagram]](../../diagrams/4/29c2579ec1f33fe25c977fb71a33f675.png)
![[Diagram]](../../diagrams/46/5443575045b463ec4b4760ed79023069.png)
![[Diagram]](../../diagrams/36/0fa5f4e782f87a3083e7c993d6300ab9.png)
![[Diagram]](../../diagrams/23/5a6580c88d99f8165651fa738d993387.png)
![[Diagram]](../../diagrams/13/d5b07b3b7f088f8b2bc379b72b51e979.png)
![[Diagram]](../../diagrams/20/2b93347eaf1aa7a986674663a29b3fed.png)
![[Diagram]](../../diagrams/24/c97797bbe408db56992096178455b837.png)
![[Diagram]](../../diagrams/20/53f2025782d2b66b493c4166d37339a3.png)
![[Diagram]](../../diagrams/44/3bab9e4fba97b745da0c6e7b8557ada8.png)
![[Diagram]](../../diagrams/7/b04631472d088707c319633c31affe54.png)
![[Diagram]](../../diagrams/8/757b4153d7a5fe9e9449a7ab97fb9eac.png)
![[Diagram]](../../diagrams/12/e037638c5201a55d47673acdd26b0614.png)
![[Diagram]](../../diagrams/25/e3b2964f28a4321b288f5e19d256379a.png)
![[Diagram]](../../diagrams/22/04ecb4de6b7018b330a072a5acb561d1.png)
![[Diagram]](../../diagrams/14/41aefcf1160ce29c3133caf60155044c.png)
![[Diagram]](../../diagrams/1/3f53b57f50ded0b085d76d9da38450a7.png)
![[Diagram]](../../diagrams/35/7c8a0a8f73fb3de8f7929ab88deccef7.png)
![[Diagram]](../../diagrams/8/0e1b55c1542c199c0973e8c695e5d007.png)
![[Diagram]](../../diagrams/31/bd7df53fe0e817ed06e985b0b093b5d3.png)
![[Diagram]](../../diagrams/48/a54d679ca8e47935a13ac3ff17e12705.png)
![[Diagram]](../../diagrams/26/6bfdcd185910f3db9a021495934ae1da.png)
![[Diagram]](../../diagrams/7/d7864c93256f25ac01b58f38e747c911.png)
![[Diagram]](../../diagrams/44/916325e9e14edc6fba4c21da24a38d56.png)
![[Diagram]](../../diagrams/15/a79634c3247da6fdf13ca45791b60e19.png)
![[Diagram]](../../diagrams/11/c96c5204a41bc9e5e84f4f4df2a3f288.png)
![[Diagram]](../../diagrams/13/374f83a7233b0bb674474aba8f0e8918.png)
![[Diagram]](../../diagrams/16/25313a36d1bc797abe82308516c1fc42.png)
![[Diagram]](../../diagrams/16/55b38f05cc3b224cbbd60ad090084e89.png)
![[Diagram]](../../diagrams/7/f6b7a01c1352033e022900777d1250a1.png)
![[Diagram]](../../diagrams/19/280747073f8c61eb0d0da13a42967285.png)
![[Diagram]](../../diagrams/27/f0c93905ceb72ee375ebf35506a4c0bf.png)
![[Diagram]](../../diagrams/31/bc9920fef9c55647e1ad2737a7d0cc36.png)
![[Diagram]](../../diagrams/8/aaba80b664a5f47ce435f0a9be8186b0.png)
![[Diagram]](../../diagrams/10/be2c5e20ce6f4495705b9b365c0dd139.png)
![[Diagram]](../../diagrams/28/9bdc9f39a68b956cc71ed09f27d87340.png)
![[Diagram]](../../diagrams/38/62d852dfeb2fd6c7da962e8b8ae27faf.png)
![[Diagram]](../../diagrams/14/379a55e1585966b8ff16962046716eaf.png)
![[Diagram]](../../diagrams/22/5609cf65df5787e8d20fe8c22fc30f60.png)
![[Diagram]](../../diagrams/14/1d24d3d2aeacd4b342576e1a6e923a4e.png)
![[Diagram]](../../diagrams/48/02b591dd6cc90dfda8f607af098a826b.png)
![[Diagram]](../../diagrams/44/c700446aa8ebe3af8229cbcadf194b2c.png)
![[Diagram]](../../diagrams/42/68ba78cf3168cc77d0b255a2434fe4b4.png)
![[Diagram]](../../diagrams/51/6c8740f279b08397f3a9c4cb819a4773.png)
![[Diagram]](../../diagrams/6/faab1097fb57994c892560ea21aa1ba1.png)
![[Diagram]](../../diagrams/31/b602401a46e79e84ca25b68d842d4a22.png)
![[Diagram]](../../diagrams/23/f9122d33a9a1a3f5ec4a5831be03c711.png)
![[Diagram]](../../diagrams/26/5170f4a9f953fdaff083c0e55e45466e.png)
![[Diagram]](../../diagrams/42/2572a431b5aff31cae65b9699a3a2fb6.png)
![[Diagram]](../../diagrams/46/850fbdf96769921ca0831ae8674b9926.png)
![[Diagram]](../../diagrams/47/068f165f981b7aea99a0e43827731f55.png)
![[Diagram]](../../diagrams/16/3f0ddbbfde8351011f8f3583f8f6a0b9.png)
![[Diagram]](../../diagrams/38/ce756ee5510b319c2848436b593d3591.png)
![[Diagram]](../../diagrams/46/805355af3c50595fc6f3300312a115a7.png)
![[Diagram]](../../diagrams/51/e4684a71390e628f329d91af268d8c2b.png)
![[Diagram]](../../diagrams/3/312bc08915c4fbeaddf109ac00f769c4.png)
![[Diagram]](../../diagrams/35/4091a914f96c54edfad6402054d2ac8a.png)
![[Diagram]](../../diagrams/26/c16cc848d87a1cb8d4e803dec75d1ba1.png)
![[Diagram]](../../diagrams/44/1ec39b046c9eeb93287c405f3d2e7e6a.png)
![[Diagram]](../../diagrams/44/1a7edf3a447b917b02aafcdeac01cc71.png)
![[Diagram]](../../diagrams/10/49409e7e16a52a7e012d55f6cc7b4fc8.png)
![[Diagram]](../../diagrams/43/e9db881c925d523ebe59d9370d4354f2.png)
![[Diagram]](../../diagrams/25/efb5ff0faaf953686688638357804973.png)
![[Diagram]](../../diagrams/2/d9232a93518d92d969b336c13ec5eca9.png)
![[Diagram]](../../diagrams/24/2a87948c00e8d4edcbd59867f9decaed.png)
![[Diagram]](../../diagrams/29/e9957eb53609fcadbd5196ee467a121d.png)
![[Diagram]](../../diagrams/43/f44254f0967d435c33e9623cde9f05c0.png)
![[Diagram]](../../diagrams/21/a84620929825b58dce3640e0f7de5b43.png)
![[Diagram]](../../diagrams/2/4665d7995ec76321e8c0c659421824dd.png)
![[Diagram]](../../diagrams/5/b08e49673d3f65762543e6574b55c5d6.png)
![[Diagram]](../../diagrams/34/02b0ebfe270da91fea5b1059a1be9b39.png)
![[Diagram]](../../diagrams/18/b8e5455d26056bb1da12eb9bd2dc5a21.png)
![[Diagram]](../../diagrams/41/7b3cbd650114049757c1ecfb988560f9.png)
![[Diagram]](../../diagrams/1/25b97faf4627209e8f97dbf31ef7d1e7.png)
![[Diagram]](../../diagrams/39/bb41efbdfd40b791609ab48bb5be715b.png)
![[Diagram]](../../diagrams/29/65e620e6a4d9169dc73d16665db516f8.png)
![[Diagram]](../../diagrams/28/a2aee50a73cdaaaaf3cccb908a47614f.png)
![[Diagram]](../../diagrams/29/92d5761adcb4cb6fa2526bbcdcb3be39.png)
![[Diagram]](../../diagrams/3/4a4e884d7268a5ff8bcc5cb7570f674a.png)
![[Diagram]](../../diagrams/33/8500c91d5c8cbd6a2a639af511e0a3f3.png)
![[Diagram]](../../diagrams/24/894d090123b07657855a6c834e511cb8.png)
![[Diagram]](../../diagrams/21/c391899c1b6c55e017b1ae32d7d342ef.png)
![[Diagram]](../../diagrams/36/3980231edb1b97617bc7bed4d5089d25.png)
![[Diagram]](../../diagrams/25/50e8991c0a4cad30b87247e8257ab73a.png)
![[Diagram]](../../diagrams/6/cf83e54fddcca925ae70dd64913f5620.png)
![[Diagram]](../../diagrams/20/300541254ccc2858dea63b8021e5a667.png)
![[Diagram]](../../diagrams/3/1c76005166bbd8f71840785e18547e47.png)
![[Diagram]](../../diagrams/48/3db738e4441b6bddfa292019b160373c.png)
![[Diagram]](../../diagrams/26/b5bccac5fc8e983221534ecafb4f234b.png)
![[Diagram]](../../diagrams/26/42a55f73b5ef7b0ae598a67eba10626d.png)
![[Diagram]](../../diagrams/46/a3d0e65ced2c564cc1a4bfb955f954b2.png)
![[Diagram]](../../diagrams/32/c03cc64bfb72c6246f55ad039c3d6f66.png)
![[Diagram]](../../diagrams/14/5d8237536b91ea2fe89a944dc3e91317.png)
![[Diagram]](../../diagrams/40/5fff87dfa0ea483930a01c007a3ec6f6.png)
![[Diagram]](../../diagrams/28/c9ece3fa227bc2322490695d5ba0cd7d.png)
![[Diagram]](../../diagrams/40/8b2f65bd38ee0e60f0534b177a488984.png)
![[Diagram]](../../diagrams/37/5bcdccc9dd1b398aef739329b0f65a5b.png)
![[Diagram]](../../diagrams/24/a65898c4e1ed0f627ae5399359e05d1c.png)
![[Diagram]](../../diagrams/17/18065491e445d1b14ec82403028b1619.png)
![[Diagram]](../../diagrams/16/5875fcd240df9390203d596319edfa10.png)
![[Diagram]](../../diagrams/6/cb535b00990cb224cf09c53a4c72fab7.png)
![[Diagram]](../../diagrams/49/a478ca6ff94460ec824e6d065b37c7d5.png)
![[Diagram]](../../diagrams/19/024b65e7dd1958beeff7e45bb2253a66.png)
![[Diagram]](../../diagrams/2/bfb5d100346b7e47b55241be7ec9e58b.png)
![[Diagram]](../../diagrams/16/a6ef1af3c2fceeb05a6569541a357f08.png)
![[Diagram]](../../diagrams/18/f121fff081fd63ab22151187a57d8b3d.png)
![[Diagram]](../../diagrams/0/eafce03120bb68e74b4d672daaaa402d.png)
![[Diagram]](../../diagrams/2/51d37a91d72090c44330a45d42623ff9.png)
![[Diagram]](../../diagrams/49/dd634d46ceabb89989473a3017dd6db2.png)
![[Diagram]](../../diagrams/8/3f88c96a2b537a8eda4231870405b991.png)
![[Diagram]](../../diagrams/7/5cc10a58e0116b01a25ac94a927fc1b1.png)
![[Diagram]](../../diagrams/10/a717954fbe269b785094553949476406.png)
![[Diagram]](../../diagrams/22/57c71feef6c5a0e020980b6b5c10d77e.png)
![[Diagram]](../../diagrams/0/088d75ce969c0e817f9f0eb52c3e742f.png)
![[Diagram]](../../diagrams/11/6559c870b2f42624dd8a703dca0af18d.png)
![[Diagram]](../../diagrams/9/7f23da039446c1081a8b13888b9c454f.png)
![[Diagram]](../../diagrams/41/94c989680782a0768885ba5fc7bd45b9.png)
![[Diagram]](../../diagrams/48/d9be037e06e47f2b9399aef201d365c1.png)
![[Diagram]](../../diagrams/7/e961b08cf423801093db19edab21fb13.png)
![[Diagram]](../../diagrams/28/3c2f31ed44f67399f0ea3fdd1522f810.png)
![[Diagram]](../../diagrams/5/2cc62d0a197469ec858cab38580ff2c9.png)
![[Diagram]](../../diagrams/34/c6d0e281373cfa8e328c8071e8a67dab.png)
![[Diagram]](../../diagrams/32/ef373a9c3d8c02e91ebc58c903c15013.png)
![[Diagram]](../../diagrams/5/932703bc0cddda0b523df100141d8fff.png)
![[Diagram]](../../diagrams/50/036db75e976ec5ebd00d6e3a61ea88f2.png)
![[Diagram]](../../diagrams/12/f17ed44482547c3dc472918ccc0c309f.png)
![[Diagram]](../../diagrams/50/8e20034f38ff80fee752a3acf956c450.png)
![[Diagram]](../../diagrams/11/cb623235bac383393689029d26b55270.png)
![[Diagram]](../../diagrams/8/852e4ee8fbadff5d1a2e94675b800c26.png)
![[Diagram]](../../diagrams/9/b587acbcfee1627a06b7a543069284a1.png)
![[Diagram]](../../diagrams/1/710cedc671e78634e03e1cf9c6587ef6.png)
![[Diagram]](../../diagrams/13/91200a73cd0e50aea32a72ab9ccbe7ac.png)
![[Diagram]](../../diagrams/40/63928bdc4e2d0c93e38062edc81c0e67.png)
![[Diagram]](../../diagrams/43/308183af10585bac087a9dcd65a73552.png)
![[Diagram]](../../diagrams/21/bb75b5099ef56dd243084fe2a0db6a40.png)
![[Diagram]](../../diagrams/14/3796c3486f94129f8a164bf84dde6fbe.png)
![[Diagram]](../../diagrams/45/8b09ec6e831490dd66e8b08f23e33833.png)
![[Diagram]](../../diagrams/6/2623f9085cf46efc1ac0375f8ba21775.png)
![[Diagram]](../../diagrams/39/3655983da878df31d1a2a6e8692c3da6.png)
![[Diagram]](../../diagrams/17/cb51f12a0eb9164cd80a4756b1c4d61b.png)
![[Diagram]](../../diagrams/0/d6717cc4c1dce86d57c69c3c5e3cf2ee.png)
![[Diagram]](../../diagrams/6/361891a2f95cded57dea03acf0c93fe4.png)
![[Diagram]](../../diagrams/10/7386bf02d335f70a9df626bec485d4f9.png)
![[Diagram]](../../diagrams/4/3bf3ad4a199b90187fb49891e7871f9e.png)
![[Diagram]](../../diagrams/16/72b6de2f606d5e2356ad770be5cb5c42.png)
![[Diagram]](../../diagrams/46/eeff36280e1b42c05bd353268329d856.png)
![[Diagram]](../../diagrams/12/cdfec438a3c97a921f08b579e7d3d761.png)
![[Diagram]](../../diagrams/40/0bd7b6e573d8d3c1a65f0f450fbce018.png)
![[Diagram]](../../diagrams/37/c6969fc5d4b09284cc9b9355f68306d8.png)
![[Diagram]](../../diagrams/48/3f38a34641cd21dd14016cc901c69939.png)
![[Diagram]](../../diagrams/7/4b93ad174cffc4705eeed7c5d716a447.png)
![[Diagram]](../../diagrams/38/6a72fe2b48ab5aca66a049d78486e5ed.png)
![[Diagram]](../../diagrams/2/fb49d6d34fb819c2c9748671f1b2ec4b.png)
![[Diagram]](../../diagrams/37/5800eb176c7020055391b20727db79c4.png)
![[Diagram]](../../diagrams/39/e7e8ee2483898ead62bb09e8bb293f1b.png)
![[Diagram]](../../diagrams/18/96da37cf3adce07077c299283efe7a50.png)
![[Diagram]](../../diagrams/52/ccb8674e1763ee29401f04e67297c531.png)
![[Diagram]](../../diagrams/2/11fe29c55f02c3243961dae661f920b4.png)
![[Diagram]](../../diagrams/46/a7449e5e2b43d9a7768d4adf42fa9fa8.png)
![[Diagram]](../../diagrams/16/d69eec7ec07e6f12680e7c60c7940c84.png)
![[Diagram]](../../diagrams/7/613bc536e19c49ad7b01bd77611e02f2.png)
![[Diagram]](../../diagrams/31/f7d9e8115e9660aa862a91053efde6e8.png)
![[Diagram]](../../diagrams/50/370fbdbdaddd66407da4ba38f95ee01b.png)
![[Diagram]](../../diagrams/38/4e775c0e748c38cf45a743578753c0e4.png)
![[Diagram]](../../diagrams/4/db84de2fbdf465cebf2011bfe69e2504.png)
![[Diagram]](../../diagrams/35/c950df58925e8c2b904aedb1aea63712.png)
![[Diagram]](../../diagrams/41/dbf3b9794c8fe1c96588173170c3cede.png)
![[Diagram]](../../diagrams/21/e5912346df1cbecafc84cd24098e701f.png)
![[Diagram]](../../diagrams/39/d12f6dfa3e5c4f23c1ca48eeeb5521b5.png)
![[Diagram]](../../diagrams/27/7542a9aeab766a57e2bef53e764cb71f.png)
![[Diagram]](../../diagrams/16/5f92528860dcfc3611a366b4b82bd272.png)
![[Diagram]](../../diagrams/33/a91847f8b8ea468c5aaae0820b4e59a9.png)
![[Diagram]](../../diagrams/19/430db984851da9ed822823e584a47bf6.png)
![[Diagram]](../../diagrams/52/43ac205dc44aaa0f9a370f97841d11f0.png)
![[Diagram]](../../diagrams/21/08fffa79967d50cdaea986d16d5c2b89.png)
![[Diagram]](../../diagrams/16/9456cade103fc23277e4a77c9b6a9100.png)
![[Diagram]](../../diagrams/6/f5dade6660a9df75e9b70df4c7ad8cfb.png)
![[Diagram]](../../diagrams/6/63ee3e087f8466973961428f57259db2.png)
![[Diagram]](../../diagrams/4/708ed3b3b947c123c7ef07f7fb8ea036.png)
![[Diagram]](../../diagrams/10/ec9d124dfe661db2550c6c28c7550e44.png)
![[Diagram]](../../diagrams/21/360e07b8153522a24fae4babb834ec02.png)
![[Diagram]](../../diagrams/9/6ebd648d0f39d8c1a43bcc863b3e25b0.png)
![[Diagram]](../../diagrams/35/688d6fce18997b3ea3b4703ec36ebcf9.png)
![[Diagram]](../../diagrams/11/d2353ad507d48223ecea3ec948c7e71c.png)
![[Diagram]](../../diagrams/50/f00e1bc9dde7e7df7bcc1a3af6ff0342.png)
![[Diagram]](../../diagrams/23/3baeb234a2a7b3237223ea61242ee470.png)
![[Diagram]](../../diagrams/50/eaf2425750beafccb238c62833435427.png)
![[Diagram]](../../diagrams/26/b1e97d67cc31a5112ec2bd2d3fcfaedf.png)
![[Diagram]](../../diagrams/38/07cfd1c4d41e2b78c4103450a135ec98.png)
![[Diagram]](../../diagrams/32/29a6551eef7a63c7a76160c972459bf6.png)
![[Diagram]](../../diagrams/28/ff352a725d0fb9c4b34d4fc39457a49a.png)
![[Diagram]](../../diagrams/30/270aa89d9841f777330b36007488a670.png)
![[Diagram]](../../diagrams/42/04ebd31784708f6d3785bfa495579454.png)
![[Diagram]](../../diagrams/51/faf2e93db35e417d509773fb5035f29b.png)
![[Diagram]](../../diagrams/19/92a93d11bb8f0172559d88a01f486920.png)
![[Diagram]](../../diagrams/3/310f27807ae19d788c851a5d7b31bdd3.png)
![[Diagram]](../../diagrams/2/cd861dfad4e6eee5f134a35d579da2e6.png)
![[Diagram]](../../diagrams/3/b4185dc31b88071a59f71222be3981d3.png)
![[Diagram]](../../diagrams/52/656b0ba91d0e84112a9a179311758483.png)
![[Diagram]](../../diagrams/21/a262492f46982d43930bb0ebad878954.png)
![[Diagram]](../../diagrams/17/e15bcba202194f51f04e53a49c6933b4.png)
![[Diagram]](../../diagrams/18/bc677ab9eea6465227857eab52ab2c3d.png)
![[Diagram]](../../diagrams/37/11de3cc7f45f4797d292ed12da2f6a9f.png)
![[Diagram]](../../diagrams/45/a96e9368115a11399ad3c19d6cc7fdc8.png)
![[Diagram]](../../diagrams/8/24c76135ce58d0ca93332816830c04c5.png)
![[Diagram]](../../diagrams/26/547b1ab1a1c66564920e3aa23b2ae9cb.png)
![[Diagram]](../../diagrams/7/8bd509946e27b80f2457b262205a9eb6.png)
![[Diagram]](../../diagrams/42/f33a5e5b2b33f2a52973dec4d79553a0.png)
![[Diagram]](../../diagrams/37/ad92666c599b8a16b05c5e452482456a.png)
![[Diagram]](../../diagrams/5/f7dd2612649e6cf4993aa80c3bafed0f.png)
![[Diagram]](../../diagrams/14/ae81814cf8aa88b3b2197a1811470bcd.png)
![[Diagram]](../../diagrams/12/5568c4aea2839cff325f52acc4ae5e14.png)
![[Diagram]](../../diagrams/49/141b0d5733f9c0b4cca4a5f3070da454.png)
![[Diagram]](../../diagrams/0/5810800de79bbf84aed639c09030dafd.png)
![[Diagram]](../../diagrams/9/149ced80c4b7b60ec47833286cda28c6.png)
![[Diagram]](../../diagrams/4/95c069280d73636031f8ce3c4af7c985.png)
![[Diagram]](../../diagrams/40/c7cc0d877ef53cede752a2e29b42bd9c.png)
![[Diagram]](../../diagrams/34/5e83fb0129adb3bc26c1dd745025b323.png)
![[Diagram]](../../diagrams/14/9c15990f8e8fa5992c391e7edbb6c5f8.png)
![[Diagram]](../../diagrams/28/f912f3ea2fe4b25e8a685ef7967f7489.png)
![[Diagram]](../../diagrams/0/622728c389a2dcd4ae876e34675fd4b7.png)
![[Diagram]](../../diagrams/0/a1704430175cd49edc4f2d7b86445232.png)
![[Diagram]](../../diagrams/45/eed60bd4d5076f30943301afb1b5587c.png)
![[Diagram]](../../diagrams/7/42406dafcbfd0c2c40ed6f54c9911c32.png)
![[Diagram]](../../diagrams/4/7d18454d706166d528f8cb84a9898654.png)
![[Diagram]](../../diagrams/28/e2c61b9ba4691aceaa16ff485726a5f7.png)
![[Diagram]](../../diagrams/40/5fd2deaeb47541b2dd7fe1f83f1e6ddb.png)
![[Diagram]](../../diagrams/20/5e1918d19148de88fe772b599410a8bf.png)
![[Diagram]](../../diagrams/29/80d0fab2f37aa2d414adc11fdc85286e.png)
![[Diagram]](../../diagrams/9/97e58c7ba795bce68cdaa379165d77ad.png)
![[Diagram]](../../diagrams/13/58c1b49cf83ae8d896c497ed69b361ab.png)
![[Diagram]](../../diagrams/28/213471e7a40a921d3f17bf0849281d2c.png)
![[Diagram]](../../diagrams/40/81fe2b6f33e1d74032a43ad4254fa5cf.png)
![[Diagram]](../../diagrams/8/dfc5d7e755c1b16f59d09dc20920854a.png)
![[Diagram]](../../diagrams/35/4d30a0bee530ad1e571a8c38cfc319d9.png)
![[Diagram]](../../diagrams/9/00bc5dedc131f18020f61f56081064ae.png)
![[Diagram]](../../diagrams/34/72252568b57b5eaf615f9685ec80212d.png)
![[Diagram]](../../diagrams/0/5aa05e56ad121a5a3c71d25fbd1cf932.png)
![[Diagram]](../../diagrams/34/e64b40338616a44e503a75b36a9f26c5.png)
![[Diagram]](../../diagrams/0/43c3555b9ea6d4007c69e50cf6c7c919.png)
![[Diagram]](../../diagrams/7/b5d1e7201daa20cf92c835da0a9e161f.png)
![[Diagram]](../../diagrams/27/60cf8ca46dba7af5ff98b8349cf77594.png)
![[Diagram]](../../diagrams/44/d63c7796d0c8b59c4b5556fe02f87bdd.png)
![[Diagram]](../../diagrams/29/df43f6a941ae27162e5f47c25e6b157d.png)
![[Diagram]](../../diagrams/52/db362b4439530d8e725a48f385dd5c78.png)
![[Diagram]](../../diagrams/20/c97ac46c0149cf80c63ade105f1fb9e2.png)
![[Diagram]](../../diagrams/35/9c2cd8ae06ebc931d00c0fbd769140f1.png)
![[Diagram]](../../diagrams/25/590aaffb11eb449f25cee2c4f474f4b9.png)
![[Diagram]](../../diagrams/49/7422f1710d4e487337006480262d7be3.png)
![[Diagram]](../../diagrams/21/84a99025cde60f2c790aafa2c2a29141.png)
![[Diagram]](../../diagrams/29/aede8fb61df17adafe7507a9c6d9ff81.png)
![[Diagram]](../../diagrams/14/762603ef106451cc4b3549693f111496.png)
![[Diagram]](../../diagrams/14/8cbce848e87130ff1e087ca2f6db46d7.png)
![[Diagram]](../../diagrams/26/cfaa09f0a61bdc406bc8a70a1bd734b1.png)
![[Diagram]](../../diagrams/34/89b91b3097fbad35fc8af63cb54387c0.png)
![[Diagram]](../../diagrams/2/433090f6cbd08d44f4a3f8975e846e40.png)
![[Diagram]](../../diagrams/42/de47b5890839dfcf2349ad0927c96fe1.png)
![[Diagram]](../../diagrams/39/ded3d7bb1a7c4e26acffaeea21a0f46f.png)
![[Diagram]](../../diagrams/5/e06a650d02a2f556d7b63e6c5df60580.png)
![[Diagram]](../../diagrams/30/eafb733c8396dd161a4afcdb6691e556.png)
![[Diagram]](../../diagrams/4/1b7d7433827ace7fa94f5a19de6ce8da.png)
![[Diagram]](../../diagrams/28/ac3fa4e421476f72cebf62567afb02f7.png)
![[Diagram]](../../diagrams/14/196facd820392e3b73e16660f56dd3f5.png)
![[Diagram]](../../diagrams/34/e323567602dec7cef60e7f850696c6ae.png)
![[Diagram]](../../diagrams/49/696d7b01298ee85a148b1b0c0943c8a9.png)
![[Diagram]](../../diagrams/17/d177a4db8f9765ab2f89bf42e05abd20.png)
![[Diagram]](../../diagrams/40/a72c720fbd5a8c6aea41a1cf015c5e90.png)
![[Diagram]](../../diagrams/2/33c0456d17b90ca92f338b8f22b2ba27.png)
![[Diagram]](../../diagrams/1/0208f2601ca3e346d79a83350e8df045.png)
![[Diagram]](../../diagrams/30/96ebf9b1acb1e8891fb06f2b861a769f.png)
![[Diagram]](../../diagrams/38/c80aa9045992fc221d2c1fd8cd2edc0d.png)
![[Diagram]](../../diagrams/26/fa62e1949b0bade947aec37a18577a14.png)
![[Diagram]](../../diagrams/1/0e845664cff5fe819e35d3543203f28f.png)
![[Diagram]](../../diagrams/16/b72051c05a5e22652022bc8ef0488dff.png)
![[Diagram]](../../diagrams/42/28fb787377e19ae01016195943c11c34.png)
![[Diagram]](../../diagrams/39/da372498f90a42261b516bf848ac4b47.png)
![[Diagram]](../../diagrams/23/c745cfe80e7f6ea69e11325f874bc718.png)
![[Diagram]](../../diagrams/31/d861bd88de2dcc74d0463724fdfd0f8c.png)
![[Diagram]](../../diagrams/33/81d23561d8966888155313a3f8d4ec2d.png)
![[Diagram]](../../diagrams/7/3d15fa7b329cd61289ea9e4977d81431.png)
![[Diagram]](../../diagrams/11/191b7229c517f3d6e78e1103e1be8e23.png)
![[Diagram]](../../diagrams/33/eba28b86b7f8365c65c988ba7c082c13.png)
![[Diagram]](../../diagrams/28/e0f6ffcc8dbbbf62a0c598a8bde6793d.png)
![[Diagram]](../../diagrams/24/29660f12aa73d559ab67d6d8c26a5d64.png)
![[Diagram]](../../diagrams/19/1088cb1099f78284ce3d3a6ba7fb20f3.png)
![[Diagram]](../../diagrams/12/de6136cb6cf7b5529107cdb1e416a5f7.png)
![[Diagram]](../../diagrams/41/e72487cfcb387e638d41b255f900b31a.png)
![[Diagram]](../../diagrams/45/8a0ed3e1a6ef26533ef2a6d9a17edcb6.png)
![[Diagram]](../../diagrams/25/8a9307c519b612a97dbcd99cb200c8e7.png)
![[Diagram]](../../diagrams/46/184de241bb2758ab5669cbad1dbb04bb.png)
![[Diagram]](../../diagrams/45/cba206f5c001434147369b30883ec86b.png)
![[Diagram]](../../diagrams/15/3593196631374a1d34cab4fa2139053a.png)
![[Diagram]](../../diagrams/26/8ae47576f4468993a4d2bd7d6087ea29.png)
![[Diagram]](../../diagrams/17/9ba6b66042559ad47399456983e6a6bb.png)
![[Diagram]](../../diagrams/10/44a1be73d0503f191188d59c11b88f8f.png)
![[Diagram]](../../diagrams/19/a9e1a04505c5d23eebe4d1cea526b3bd.png)
![[Diagram]](../../diagrams/42/fa9f5dd92bd2f3647b78c59cc2688fb6.png)
![[Diagram]](../../diagrams/24/34bda9a6a790649cc80e814778c6e53b.png)
![[Diagram]](../../diagrams/39/97283f4f72d8fbe2d79c0ccb2475a762.png)
![[Diagram]](../../diagrams/0/c041babd0ed4b98f694642f4db981164.png)
![[Diagram]](../../diagrams/22/e8e97d0ee08da42a2f21a3c3a8bf9635.png)
![[Diagram]](../../diagrams/43/e5c346979eaf28eda6960011d413cb9f.png)
![[Diagram]](../../diagrams/0/69718c41cd61c37ade3a2b744bf5dcc8.png)
![[Diagram]](../../diagrams/20/d81c812358a7238818ae4d6491102ed3.png)
![[Diagram]](../../diagrams/20/cd313c9f95a22a2a580c9868932a7bc6.png)
![[Diagram]](../../diagrams/16/13bc0891d8e93ced41a5b7b484a72a14.png)
![[Diagram]](../../diagrams/18/60cf9c9df2924b533a52a1d44e37c1dd.png)
![[Diagram]](../../diagrams/12/f4d6db9bc1127aa0476310b24a7d4e4b.png)
![[Diagram]](../../diagrams/36/f091dffe5427b4596d47ad1ace7969d4.png)
![[Diagram]](../../diagrams/11/71c23efa887b996e20b80eb24915c521.png)
![[Diagram]](../../diagrams/5/023cd4ee77235bc78e7e273f66a7e084.png)
![[Diagram]](../../diagrams/33/e4206457c3b61992c2706f0c21014df3.png)
![[Diagram]](../../diagrams/14/a0b1b90f5e101d1f933238f298c2c43d.png)
![[Diagram]](../../diagrams/33/90fd0fa4b15f3589572ef63c904db184.png)
![[Diagram]](../../diagrams/52/655f7cb3159e53eabb69775c36441708.png)
![[Diagram]](../../diagrams/29/606ac2cebe9dd021ddb12e9459c64e75.png)
![[Diagram]](../../diagrams/17/6a5918223003e48d3083841a127a2231.png)
![[Diagram]](../../diagrams/12/a42f2ba57ca49de3b94783ce88c18617.png)
![[Diagram]](../../diagrams/15/cd3c126c2dc0e9f7bf0c7a1d0d59de95.png)
![[Diagram]](../../diagrams/52/ff1f66655fea1630b51ca71d83864a71.png)
![[Diagram]](../../diagrams/5/b909fc6cbbadb80d4338cf5e5ec0a070.png)
![[Diagram]](../../diagrams/19/41c3a1654cd6ab7f6bf6b0b4c3ecb968.png)
![[Diagram]](../../diagrams/44/1ca3b8a65786ebb148b9299c71908118.png)
![[Diagram]](../../diagrams/23/0e464f6b18ac21432edec963626a471a.png)
![[Diagram]](../../diagrams/20/7e026bcec61c3ffb17b7b653108e7cea.png)
![[Diagram]](../../diagrams/33/5bae510629b729a975e50867e4bd89fc.png)
![[Diagram]](../../diagrams/27/a38a0c18ddbdd6a76912c30916dc7dc3.png)
![[Diagram]](../../diagrams/52/75c57a5597639e075401c294cc4dfb8b.png)
![[Diagram]](../../diagrams/37/71ec696d731504f2e51e1c3757dd6c15.png)
![[Diagram]](../../diagrams/48/9ce5e0058f18c14685bef6f7c0a63920.png)
![[Diagram]](../../diagrams/0/1ea31a534978f8ca473e9b8a5d679acc.png)
![[Diagram]](../../diagrams/42/71a7c9826828a389920479c479786399.png)
![[Diagram]](../../diagrams/49/91ec52d06af1b498bce79144157053ec.png)
![[Diagram]](../../diagrams/42/f3b8be1923e9516fe3b1d7d655618720.png)
![[Diagram]](../../diagrams/1/348ece2dc14575a5ce95979d6cbe011e.png)
![[Diagram]](../../diagrams/52/ac740c8e6f6573a7b9dbdd8f99bc3466.png)
![[Diagram]](../../diagrams/49/7a3180f7f238486560e144c6fd8d0de5.png)
![[Diagram]](../../diagrams/42/dd67405d69c0ee40a9bb025d2398395f.png)
![[Diagram]](../../diagrams/26/f000251cbff832a8bd7f38c28a71472e.png)
![[Diagram]](../../diagrams/18/8394eae09a993d4d5cebc96cc167cc58.png)
![[Diagram]](../../diagrams/50/24a0537fe1d6853e35196c8a387a0820.png)
![[Diagram]](../../diagrams/31/dd67d7dada05431257e8d7a7dd172d35.png)
![[Diagram]](../../diagrams/15/8d8b241c287d3f631031ac5fdb3157b9.png)
![[Diagram]](../../diagrams/0/ffea48106c1b19da95e27b3d9a963ded.png)
![[Diagram]](../../diagrams/27/6282b9011e997c636c5e6faa2e6bd222.png)
![[Diagram]](../../diagrams/43/11a7707effdf632220319aec02c94f77.png)
![[Diagram]](../../diagrams/50/5fc55fa3059799ff247864cd76332ba6.png)
![[Diagram]](../../diagrams/50/0413dba54890c962f3e8df0bc143c386.png)
![[Diagram]](../../diagrams/26/451f8d92f9581eeb4e90de76ad4809b1.png)
![[Diagram]](../../diagrams/13/8301f1a7e696c6f6fae6c2cd39f48672.png)
![[Diagram]](../../diagrams/36/61e3f9f326a785730b1f77e0772d8503.png)
![[Diagram]](../../diagrams/46/9cd39bab44a4c0ee041cc6a8f92ece2e.png)
![[Diagram]](../../diagrams/40/f18a8d5ee4f655e9feac9480115f25f6.png)
![[Diagram]](../../diagrams/1/df836fed1ce01656cd21c45947f4333f.png)
![[Diagram]](../../diagrams/51/76f67547b0c00a603609ce7dea56ace9.png)
![[Diagram]](../../diagrams/36/f6f882a3a8d21d82975772312b52550d.png)
![[Diagram]](../../diagrams/32/aa064d017550abb296d69007797a6d11.png)
![[Diagram]](../../diagrams/26/4d2375654ec5faa8f353d2829f954754.png)
![[Diagram]](../../diagrams/16/44364b8a2cc2bca1f9141439f3430147.png)
![[Diagram]](../../diagrams/1/100da1a0fccbff18e451f1d8652ec7e0.png)
![[Diagram]](../../diagrams/0/c9ec512d34c9ad931d9cde2d6d3e97c0.png)
![[Diagram]](../../diagrams/39/67904231ddc9f7e198e91bda8a27819d.png)
![[Diagram]](../../diagrams/37/51a22e2e3eec4aca7c37361fddca4794.png)
![[Diagram]](../../diagrams/2/1243b44fdb85a51942103bf7baca34d5.png)
![[Diagram]](../../diagrams/49/5f980a34cc9905fbb35c28d487e2212a.png)
![[Diagram]](../../diagrams/1/a7b21bae9bfe4f9303b5abef3aeab234.png)
![[Diagram]](../../diagrams/47/54a5fa4c69f0861c82a7665d5dc65c68.png)
![[Diagram]](../../diagrams/32/833711f41bd2575af9e703777e011ab3.png)
![[Diagram]](../../diagrams/43/0343b028a881472f184e5adfda9a9f0c.png)
![[Diagram]](../../diagrams/18/fa490f577ec6ec624f0fbde50b624d3b.png)
![[Diagram]](../../diagrams/8/6ac6c6495bde9bb91c2c225bb77799f6.png)
![[Diagram]](../../diagrams/40/ce8f158c752bd529ccf4b52299a723be.png)
![[Diagram]](../../diagrams/49/95a98ccdc7f12d91de238ace340b115e.png)
![[Diagram]](../../diagrams/52/de654ae82d970211cfb8dcf35159472a.png)
![[Diagram]](../../diagrams/34/b456e916841906ed4a030ebd3b15b56f.png)
![[Diagram]](../../diagrams/38/ede572793e09ad18a8031e661510a762.png)
![[Diagram]](../../diagrams/40/b85d42f3d528d46f3d714e3e31a4018b.png)
![[Diagram]](../../diagrams/42/efa9d5fc6e662f357ef52f90dcf3d6e0.png)
![[Diagram]](../../diagrams/29/2403ce22ca317b4afd6ef3a50f57668a.png)
![[Diagram]](../../diagrams/5/7e744eac892ae8476ece7b2236737a3e.png)
![[Diagram]](../../diagrams/7/62f8acda13ec57d8e8c7de39a6f2045c.png)
![[Diagram]](../../diagrams/30/c801a21b0a011569b7217fb31f8dcbc5.png)
![[Diagram]](../../diagrams/23/dffd4f88373c548a3d489aba55574672.png)
![[Diagram]](../../diagrams/10/6dc0bef2cb48757b36e398276658b975.png)
![[Diagram]](../../diagrams/43/1ec23976feb5b0bce9a890b53b7ec8f8.png)
![[Diagram]](../../diagrams/34/51781e4e5858f5e8f339f6b45c84b7d0.png)
![[Diagram]](../../diagrams/17/bbf12907ca63017eab4d92de3516507a.png)
![[Diagram]](../../diagrams/20/e0d354aaa6729bc4e230c735b3aed483.png)
![[Diagram]](../../diagrams/35/7eb455f4d3cd0f427058cdc6421d72bb.png)
![[Diagram]](../../diagrams/21/1e93b37404537785c5c384a13288ba18.png)
![[Diagram]](../../diagrams/8/ee4e4c3d24f44e6d77eddbed7b515c65.png)
![[Diagram]](../../diagrams/47/e358a6b86dfe84675788676e5d73b4ba.png)
![[Diagram]](../../diagrams/38/313042854d445ba5f769d531d3f81b07.png)
![[Diagram]](../../diagrams/28/b3da64309219c2c8f988bffd53623bff.png)
![[Diagram]](../../diagrams/13/dd4acb10c8d860e6571df5cbd870417d.png)
![[Diagram]](../../diagrams/16/23ebb8bbaa9b140c4ce7328cf914361c.png)
![[Diagram]](../../diagrams/46/b85abdb2002f94a578db6f5c2091303a.png)
![[Diagram]](../../diagrams/23/a27657fdbd794d1f8a00c4d7a64b5f78.png)
![[Diagram]](../../diagrams/9/754a930cf297782ded3ed581876dc48c.png)
![[Diagram]](../../diagrams/9/64c875e9afc47745e54f9048ed1947d4.png)
![[Diagram]](../../diagrams/25/b92a8276fa36b07feae0142df604e5ce.png)
![[Diagram]](../../diagrams/7/08f743e9521f741939a827c7aa329161.png)
![[Diagram]](../../diagrams/16/722cb5bea9c4c0be65feedccca151b5e.png)
![[Diagram]](../../diagrams/12/c7693dd7a4677de76621936e5ab35520.png)
![[Diagram]](../../diagrams/31/fe0df22a6a5d6fa5ae33dfda40cbf496.png)
![[Diagram]](../../diagrams/37/d94abb610491a7fdaa7a3b2ebde28b28.png)
![[Diagram]](../../diagrams/14/f130b7c7d62716cb16f27675a049cef5.png)
![[Diagram]](../../diagrams/30/89d28ed1268d6327af8b9c2330f42870.png)
![[Diagram]](../../diagrams/20/3c65286cd161f5c144af47c021fd996b.png)
![[Diagram]](../../diagrams/39/d02a27d02bb132edf0605466ca99bd8c.png)
![[Diagram]](../../diagrams/46/1e63e1cff7b177d6d5a6df36c887d146.png)
![[Diagram]](../../diagrams/11/f46abb5e2b0e900f3d492c43ccd80d5c.png)
![[Diagram]](../../diagrams/21/5e8881ff9e4d6a3679d01d652dd650b5.png)
![[Diagram]](../../diagrams/26/72e649931b422134537067d4ba3e3557.png)
![[Diagram]](../../diagrams/26/026366a627e73f45280d16b113e73db2.png)
![[Diagram]](../../diagrams/21/228867f46af81bfd74fd97a9565d5e5e.png)
![[Diagram]](../../diagrams/14/94c311bb4860b8524b252357bfdc9714.png)
![[Diagram]](../../diagrams/7/a976314f14c941b3d3fae882170efbfe.png)
![[Diagram]](../../diagrams/31/0390325195baf7920d363469e1daf492.png)
![[Diagram]](../../diagrams/10/4afc58bda9bcc15a4dc4ee1e57394dd0.png)
![[Diagram]](../../diagrams/14/d07bfd14cff015bba0e08b0ec22e3de6.png)
![[Diagram]](../../diagrams/24/c57b6ca4849a899922e6dc6b6ff109b6.png)
![[Diagram]](../../diagrams/6/99c4ba906fb6b575689beeb07f9454c1.png)
![[Diagram]](../../diagrams/40/1a1f7b9fcde66944f3ff123308cb1ed7.png)
![[Diagram]](../../diagrams/17/ca33728ad0103b17a598323124979608.png)
![[Diagram]](../../diagrams/34/f4b63e5f802b10bd09895a9e5a495268.png)
![[Diagram]](../../diagrams/19/a889b9598331f531a69ae68f330a75e8.png)
![[Diagram]](../../diagrams/42/ca62ec17eb3970a7fa4c79722aa6358a.png)
![[Diagram]](../../diagrams/20/b4e938767066bb5d5e76170c51561ff7.png)
![[Diagram]](../../diagrams/12/117f9e8c4eb4e1e034be3c224439be92.png)
![[Diagram]](../../diagrams/29/fb9715f9c3b9bceffba20073ef8605b9.png)
![[Diagram]](../../diagrams/16/733b03aaac2f231bceaf125270fe9a53.png)
![[Diagram]](../../diagrams/29/6ac9aaf9e32be14201f8753729ef593a.png)
![[Diagram]](../../diagrams/13/df156224bdb39080f0052e63840c13f3.png)
![[Diagram]](../../diagrams/2/ccbaec1d59d349d6249c68872cce8e43.png)
![[Diagram]](../../diagrams/33/718430dda2b717d7b55f0c4336d8a975.png)
![[Diagram]](../../diagrams/18/6a467e8247b032451d0b3a773278e3c5.png)
![[Diagram]](../../diagrams/6/f092a5dc1c4d991f6838753e842e69d6.png)
![[Diagram]](../../diagrams/32/e52e55e0c380b6b9ade7f693ed2ff8e7.png)
![[Diagram]](../../diagrams/28/6f8b760a51c3646418de33ee82800352.png)
![[Diagram]](../../diagrams/13/31a6946a994a2730f1b4f91d431c6904.png)
![[Diagram]](../../diagrams/33/26a79a72ee021aa3191280908c839bc4.png)
![[Diagram]](../../diagrams/25/7a055c857a8f63ad4d20fb2e0d266b0b.png)
![[Diagram]](../../diagrams/15/d2f7767e3af48d7b16df5a356be2ea40.png)
![[Diagram]](../../diagrams/45/d023e81edd7fbf17daf16db9b397be05.png)
![[Diagram]](../../diagrams/12/3b1a42b7a00631fe720f0cb3489e15bb.png)
![[Diagram]](../../diagrams/52/9195d8e24a8eede565ca33e49f498908.png)
![[Diagram]](../../diagrams/13/9367776ec4464b7668c446c192f86dde.png)
![[Diagram]](../../diagrams/26/40102c604dac611b37203feaa4807f87.png)
![[Diagram]](../../diagrams/7/528d954620afd2326a19c4edc177abb3.png)
![[Diagram]](../../diagrams/17/dbad97454bad653f3c0baacb4105c274.png)
![[Diagram]](../../diagrams/28/e1154a815d3134ee6f1c40e20b477582.png)
![[Diagram]](../../diagrams/49/296ebea1eb6d3883b63918dfb580661f.png)
![[Diagram]](../../diagrams/48/ad086dc7e54ea256fdca7f431cd7c3c2.png)
![[Diagram]](../../diagrams/43/bc622f53546b7f69891005943b1ee932.png)
![[Diagram]](../../diagrams/6/5beae2dc27c59a8dad2524e6bf3d286d.png)
![[Diagram]](../../diagrams/30/6c6db79597ab8ce5e57468ce21095c55.png)
![[Diagram]](../../diagrams/8/dd68340cbdc49fa0a06e42fd4ae77dd3.png)
![[Diagram]](../../diagrams/31/17721e613a62fa9f6d4f29df8a10b5c2.png)
![[Diagram]](../../diagrams/24/c58cbbb3b81a97dc323486e0b3ae0481.png)
![[Diagram]](../../diagrams/33/bdb5ead1caa1210f5d8e2347cbeb1207.png)
![[Diagram]](../../diagrams/32/daea2d8fc7dcb3bf59752e0e53d2c59c.png)
![[Diagram]](../../diagrams/40/ac2ead3b8b4fdb4ed2dca367dfb0290d.png)
![[Diagram]](../../diagrams/16/6a71df04335d626600f04812d1eecbf6.png)
![[Diagram]](../../diagrams/25/898e42056d6241e45f802e70d5b8980d.png)
![[Diagram]](../../diagrams/10/486fc82aee7cc08e228cc7f5cdb3d604.png)
![[Diagram]](../../diagrams/16/69684de5f19283ec3f2e621044f98ce3.png)
![[Diagram]](../../diagrams/1/cfcdb37cb8466bb557670ed31cbd567a.png)
![[Diagram]](../../diagrams/2/60e4950870987728e83cd274785299d4.png)
![[Diagram]](../../diagrams/47/b28b5d326e24a3996554fec2ee10f7ec.png)
![[Diagram]](../../diagrams/19/2e69e5e1dfb066069e34ff4011abd911.png)
![[Diagram]](../../diagrams/41/cde80ae701babe041eaacd4fa5fd64aa.png)
![[Diagram]](../../diagrams/12/7cf7d119ff8e228e342eba16b60e2c1b.png)
![[Diagram]](../../diagrams/18/9b2b6e5f306ff4ea87cfea63edf9d5cf.png)
![[Diagram]](../../diagrams/15/fbc3e62ac2c7d4374bccbafd284bcbe2.png)
![[Diagram]](../../diagrams/14/34c182209547967c3ded05fc9346331d.png)
![[Diagram]](../../diagrams/42/45583f149adeaa899deee69cd3abcb39.png)
![[Diagram]](../../diagrams/7/34d961577dec87824382379984298bba.png)
![[Diagram]](../../diagrams/20/f87b218ea857827d8017a62d5a98b5a2.png)
![[Diagram]](../../diagrams/2/dfadf1568b9c59779513e0a08906a3df.png)
![[Diagram]](../../diagrams/48/3b38f974af0f5a383f97b79a5615f314.png)
![[Diagram]](../../diagrams/47/3c577ec59a62be3c9fd7fec9afeb0ca1.png)
![[Diagram]](../../diagrams/18/b9a7e6092ed173613af5ab9942c17a3e.png)
![[Diagram]](../../diagrams/20/e26c990ae44d623a132d3bd8528534fe.png)
![[Diagram]](../../diagrams/45/4dc2d2acadfcfd8c69cca34fd92ab3c5.png)
![[Diagram]](../../diagrams/18/605f15f17bbafb33979026d7a9e0d8ca.png)
![[Diagram]](../../diagrams/23/6aa1d5e066c04c09eb59e11ed2f0cd7d.png)
![[Diagram]](../../diagrams/34/0a7bbce67c218b2f09895d76c9ca46fa.png)
![[Diagram]](../../diagrams/44/e1eab8a611b286d78497876638262e3f.png)
![[Diagram]](../../diagrams/30/cd90a277ceffc98f2cb1897c940190b8.png)
![[Diagram]](../../diagrams/39/595fb8f07c3a3f3bdf0a0afe2f3097b6.png)
![[Diagram]](../../diagrams/7/5d4b4d72648c5182035909ec78ada415.png)
![[Diagram]](../../diagrams/45/1aeadc10ce838a2b5c720f017552b1fd.png)
![[Diagram]](../../diagrams/18/ef2b7ffb58e224afab76a19fe1c9fac8.png)
![[Diagram]](../../diagrams/48/42a28cb1d896b2d1676f6bb4bc298c1b.png)
![[Diagram]](../../diagrams/46/d81aabf6954e11dbc053c06eff5a45d5.png)
![[Diagram]](../../diagrams/42/91471e513f293717a9f4fea969a50985.png)
![[Diagram]](../../diagrams/7/ef19108fda729fff028dd421a4f1e57c.png)
![[Diagram]](../../diagrams/4/4f621e381e7b7cdc9165b8e324ff35e9.png)
![[Diagram]](../../diagrams/50/eaf15eae7da81483ad3911b74d61ec9b.png)
![[Diagram]](../../diagrams/2/31356b75544fc1216487ecc05e3d0ce0.png)
![[Diagram]](../../diagrams/39/6096ca5662148078cb5c35bb244bc162.png)
![[Diagram]](../../diagrams/6/eb68fcb6148452fccb08993660639950.png)
![[Diagram]](../../diagrams/24/017c11e5061edc25b708dc1d2e0bda10.png)
![[Diagram]](../../diagrams/15/4f464d7903b670c5da15d361b38d53a7.png)
![[Diagram]](../../diagrams/31/ea33b23e2b4bb6e62d21fc3d69929bed.png)
![[Diagram]](../../diagrams/20/0851b521bad0cc031f56e1abf215a38d.png)
![[Diagram]](../../diagrams/28/73e150be6bb220331d907b1a7de1c4a1.png)
![[Diagram]](../../diagrams/5/e6784a602ef020de04fcb8201efea68e.png)
![[Diagram]](../../diagrams/26/0e6256b6f3cea3317442ed6d42e50da1.png)
![[Diagram]](../../diagrams/46/d87486ef50631bc7a2a75012f4f55f59.png)
![[Diagram]](../../diagrams/15/209c1af869355375eed3adbf3e5afc5b.png)
![[Diagram]](../../diagrams/21/eedfdc8e138afa4d5769eb271f9ed04a.png)
![[Diagram]](../../diagrams/8/09a8526204cf9df814bbcc7617e5a790.png)
![[Diagram]](../../diagrams/35/483206906c6b3eac85c4e83f92b5f2bc.png)
![[Diagram]](../../diagrams/19/d98c8c000041c647918f11d64e43d582.png)
![[Diagram]](../../diagrams/51/d76e76684f0fe1f7a0d9c7080f9caf33.png)
![[Diagram]](../../diagrams/39/0009333e34b82ab554a46bc94b5317ee.png)
![[Diagram]](../../diagrams/37/79fafa4f7217089a328cb10779c9b8d5.png)
![[Diagram]](../../diagrams/29/388431efd6a1749f7496ee43ee2f59ee.png)
![[Diagram]](../../diagrams/20/4297c5eaa7c938e2bbf82691fcaa38e3.png)
![[Diagram]](../../diagrams/0/55bf76d4ec92558c3a01a770d00788cf.png)
![[Diagram]](../../diagrams/37/d8c8986581e00b7af7ec8e819d4a94f7.png)
![[Diagram]](../../diagrams/20/5ce3d413e77ca430537fb324cac4d3a0.png)
![[Diagram]](../../diagrams/28/bdbfa250ca273f23a43056a2d893641e.png)
![[Diagram]](../../diagrams/5/04ba0f1b730eadab50a3be1dc4914666.png)
![[Diagram]](../../diagrams/47/8671d51ac510727945ae0c495f488599.png)
![[Diagram]](../../diagrams/42/8ae431e8e14931b22f340558b6a5b8b1.png)
![[Diagram]](../../diagrams/43/11725a0d0c190deeb6fd5dc58f941531.png)
![[Diagram]](../../diagrams/45/130576eb5f90e6374bcffe0cfa0b1bdb.png)
![[Diagram]](../../diagrams/4/d43d64ebde43db9697b9b08e8d74248e.png)
![[Diagram]](../../diagrams/23/a2055156c73e6c7253f1aa7e4dd4545a.png)
![[Diagram]](../../diagrams/35/a0a71307dced03ab067444ccd0b4acd5.png)
![[Diagram]](../../diagrams/12/d0f15d73fee405597e4e2ca7b0a71fe8.png)
![[Diagram]](../../diagrams/33/fb50d09f8bbcccc52bc14827b850272c.png)
![[Diagram]](../../diagrams/31/a13d994e5e738b4f9358b3a96cd41a97.png)
![[Diagram]](../../diagrams/40/57b0e561a7cc830325a447d2c4f8b4dd.png)
![[Diagram]](../../diagrams/32/3d96f2bd1e3fb926d44d8c18dddf061b.png)
![[Diagram]](../../diagrams/40/772f29cc3f59b5966041806cb979d585.png)
![[Diagram]](../../diagrams/38/55eb06ee23ca5bdaca7d1be664504172.png)
![[Diagram]](../../diagrams/41/faa1ccf99e30e92a97bb9dc4715380e0.png)
![[Diagram]](../../diagrams/45/a28e6b72f1bc733bbd0ea3d5320d5f42.png)
![[Diagram]](../../diagrams/49/07744d96b3cede7b3d55942131ece9ce.png)
![[Diagram]](../../diagrams/51/e17aa6f512235c0c872b6d357dad28c4.png)
![[Diagram]](../../diagrams/15/3d1a956c3302fe805468c1e6cc578317.png)
![[Diagram]](../../diagrams/4/7a1ec46c608cc6150451784d782ea850.png)
![[Diagram]](../../diagrams/19/a61ace5f967cc3c2aa375b7c96d8d1dc.png)
![[Diagram]](../../diagrams/28/c0c1f5c60ead58883173687d4c8cf27b.png)
![[Diagram]](../../diagrams/10/af203ee2ab0b725fc0b5f6bd1d11274e.png)
![[Diagram]](../../diagrams/16/d4fb8f8bf26fa459124ecd4b80f92014.png)
![[Diagram]](../../diagrams/30/0d72f8247e1d151625e3f9c8fd410e7c.png)
![[Diagram]](../../diagrams/4/0837d6557de077d1a833ad2264085174.png)
![[Diagram]](../../diagrams/17/3ad97462f7b6462d56b1b1d30f12cf35.png)
![[Diagram]](../../diagrams/44/fb984f791429c281c4fadd260cf3c746.png)
![[Diagram]](../../diagrams/23/867748d80de3ae275e6cd75ed1380c91.png)
![[Diagram]](../../diagrams/2/e54820bf19851a4f72dd5ecdfd422ac8.png)
![[Diagram]](../../diagrams/23/a018a3d3345edb3d0b841808c24bc9a5.png)
![[Diagram]](../../diagrams/30/8e7cca9f3d5a7d338881896ca6f85853.png)
![[Diagram]](../../diagrams/7/71d7e950dae25d1b0b34b516eadf91ba.png)
![[Diagram]](../../diagrams/16/9e3f66f070841c839a19ef6a319738ac.png)
![[Diagram]](../../diagrams/18/98781f5110f51de868f75f59f81a9d6a.png)
![[Diagram]](../../diagrams/28/267ef621850c836a316e2543cc71a9a9.png)
![[Diagram]](../../diagrams/35/124276fe1eb1c88d4569bc4214ad6f2f.png)
![[Diagram]](../../diagrams/51/82d429de94c6d364ff6c1da6bc52936f.png)
![[Diagram]](../../diagrams/30/df43d0bc58dafe0e0836513c9da8f528.png)
![[Diagram]](../../diagrams/11/fcd277d30d5e10a337dd1240ec3f4706.png)
![[Diagram]](../../diagrams/14/584dd97f70336c49d9009420b7ff2411.png)
![[Diagram]](../../diagrams/12/82d65f8472e26d673affa6c8671ce18f.png)
![[Diagram]](../../diagrams/23/88d1fa9fb67b3b251b0709bf4a7acf36.png)
![[Diagram]](../../diagrams/49/8d05516867eac14d424e269fbf9ae160.png)
![[Diagram]](../../diagrams/51/2eb49036592666cba86a988829a17c58.png)
![[Diagram]](../../diagrams/43/32149c5a90ed82213d821ae9d0e616ad.png)
![[Diagram]](../../diagrams/21/b61af1c20f7ce829e22ab814ea2da0da.png)
![[Diagram]](../../diagrams/41/1b648c5c7a35efb0e9a37d48688a89d5.png)
![[Diagram]](../../diagrams/33/440fc9a397d662c250f1bb9b66648827.png)
![[Diagram]](../../diagrams/0/5d5e7e1d9885c1e9f36b36aa6103d45d.png)
![[Diagram]](../../diagrams/48/071858bb14e3d5481654350782b0e3d0.png)
![[Diagram]](../../diagrams/21/8d70f8c8c87688fd5b4519712c28b9a3.png)
![[Diagram]](../../diagrams/19/3dc151e8941b9dd5ea7a3d0ef4f10f23.png)
![[Diagram]](../../diagrams/52/5dae51d4f5705f71382007a0611f1265.png)
![[Diagram]](../../diagrams/15/4ec64a86fc8ae206b66b023542973b70.png)
![[Diagram]](../../diagrams/9/91758aabf62c527ebab201d404e0b69c.png)
![[Diagram]](../../diagrams/21/6c4dea4935e7eaafe36f597c26238137.png)
![[Diagram]](../../diagrams/46/670044aeae15d5c115dbc7f1dc6ee079.png)
![[Diagram]](../../diagrams/18/b44a828e4cc1db1e3b93f4725d5ed01e.png)
![[Diagram]](../../diagrams/5/4e1bb5f3eb0767011cf5d4ed4cf3cea6.png)
![[Diagram]](../../diagrams/11/e183627b34c6d17fea902398bb00771d.png)
![[Diagram]](../../diagrams/51/b2ee970745c11442cd00804aa088dd7b.png)
![[Diagram]](../../diagrams/5/4e12715e46842eab98a2d204fedd2bcb.png)
![[Diagram]](../../diagrams/10/07823a6f126fb871ded8ba74b40ba284.png)
![[Diagram]](../../diagrams/22/2e37c70d786bc98e3c6f5126f52b5ebc.png)
![[Diagram]](../../diagrams/14/1df83a56eab812451aecd036d8e65b6a.png)
![[Diagram]](../../diagrams/9/296c9da6c02ead6a6c43b2a51cc5bb59.png)
![[Diagram]](../../diagrams/50/26fe3300f1e96918879aee3313caf580.png)
![[Diagram]](../../diagrams/49/5649207efbd44be0c0372f84fd0646fc.png)
![[Diagram]](../../diagrams/3/9bc258871d67305e290b77eee4e39d81.png)
![[Diagram]](../../diagrams/32/e55877872bd0f61d2abd95891e98f004.png)
![[Diagram]](../../diagrams/0/a2bd81150e61232ea7b64d87b343459c.png)
![[Diagram]](../../diagrams/45/4fec88232be38909827be54ed2cedc30.png)
![[Diagram]](../../diagrams/14/d4250845a3f3ee7902a6494bfc8e9b39.png)
![[Diagram]](../../diagrams/4/354893e55f5884b04c2d0cf73e90b386.png)
![[Diagram]](../../diagrams/38/46cc33f69076717b50514414dc1c9415.png)
![[Diagram]](../../diagrams/22/a5ccd4c253eb869586b71f497ff7178a.png)
![[Diagram]](../../diagrams/48/d0782e48ac7850ecb3b9cb9041df6b44.png)
![[Diagram]](../../diagrams/50/448a31062c134f9ce1efb8f4fb3d15d9.png)
![[Diagram]](../../diagrams/46/13ddfae0a5607632ab44242fb9891962.png)
![[Diagram]](../../diagrams/18/459b8d980487286f270a00441e120343.png)
![[Diagram]](../../diagrams/21/e850e6d6546c27be83616966aca924cd.png)
![[Diagram]](../../diagrams/27/22a0d6a233fcf16dcd504bce17c6fe9b.png)
![[Diagram]](../../diagrams/4/64ffbe0f52182dcf83b0a2c47d43e5d2.png)
![[Diagram]](../../diagrams/44/b89df73907d6bc8352cdbfea68c45b04.png)
![[Diagram]](../../diagrams/27/e427641f88fb1533003cc5f789f89529.png)
![[Diagram]](../../diagrams/8/ef3f3ce33f42ac01e75c235d63356a4c.png)
![[Diagram]](../../diagrams/25/2a2f3343fb86431bb9d528ecfc1f82c6.png)
![[Diagram]](../../diagrams/49/5f5dfc2a87428e1a7ab0eec1647553b1.png)
![[Diagram]](../../diagrams/45/b99558220c738e5d0da8cc1dec27d180.png)
![[Diagram]](../../diagrams/24/64953ae97ffdfff220f9e7fcbaa17a41.png)
![[Diagram]](../../diagrams/4/7f542c2b8c33d23d170b7d517cd476c0.png)
![[Diagram]](../../diagrams/30/16687dc3300488d1057654d0ea223ad7.png)
![[Diagram]](../../diagrams/45/e2d4432807747b022526e4cfc68a2c16.png)
![[Diagram]](../../diagrams/43/e88029290fe465d5fbdedcea953f644b.png)
![[Diagram]](../../diagrams/1/249e6322b5e0de8c281b413dd1a94834.png)
![[Diagram]](../../diagrams/31/381b57eeca1e0d77b321f09c148a5a70.png)
![[Diagram]](../../diagrams/32/7853cbe381a0c2ba6380c9790cade714.png)
![[Diagram]](../../diagrams/13/beb0ed7428367916e659727424268814.png)
![[Diagram]](../../diagrams/6/8c9edc6ef4b5c9317270173611d3de74.png)
![[Diagram]](../../diagrams/51/af6d22fdaef1081b5e46a2366a741849.png)
![[Diagram]](../../diagrams/46/440eb22024919f878801ab78700b898c.png)
![[Diagram]](../../diagrams/42/95f61ad497a0fccc8e77d166d6b61346.png)
![[Diagram]](../../diagrams/11/a7b6be99be0c0ec86a9c963de2699884.png)
![[Diagram]](../../diagrams/39/5b56360264b7a22764f39ed92e6c087f.png)
![[Diagram]](../../diagrams/52/250932ca360692ac2916b35a2915c734.png)
![[Diagram]](../../diagrams/47/8d6bcdcc2c119ceb5f9e7678181e02c6.png)
![[Diagram]](../../diagrams/24/bf426e8084ea677d4e75def05ed7370b.png)
![[Diagram]](../../diagrams/7/30e55bd76db6c51818ad57792e3dcd51.png)
![[Diagram]](../../diagrams/21/e2a189d633b9145cdba49c74aad8d809.png)
![[Diagram]](../../diagrams/51/13a172da27251ccbb5d47a8452888d7b.png)
![[Diagram]](../../diagrams/8/e4181e2c0b53c443e504c6a46f07aa04.png)
![[Diagram]](../../diagrams/44/1b5d10d272d48059b560c43a77949d98.png)
![[Diagram]](../../diagrams/31/0afa1b7ec332bcfe5b0bdcec714a5c1e.png)
![[Diagram]](../../diagrams/0/f159f3be503c278cef83bc27bf440666.png)
![[Diagram]](../../diagrams/41/b302aecc05d6eacf614ce93adbf689ba.png)
![[Diagram]](../../diagrams/5/6af6dbe15f273e6c2a9072f857759690.png)
![[Diagram]](../../diagrams/2/53c801c050386407d3604c4eafc43f9c.png)
![[Diagram]](../../diagrams/23/60bd5c6e87cf8eeadda3641ca8adb5ce.png)
![[Diagram]](../../diagrams/5/e83aad219eadb4ec28f444030ad83055.png)
![[Diagram]](../../diagrams/35/8070e4b333d46288c769a2c7a9ee1eb4.png)
![[Diagram]](../../diagrams/0/92aeeaade130ab0d0ebecdf1f5c8959e.png)
![[Diagram]](../../diagrams/10/5c664a5bb0a1dd52e7d8911a3d17ea75.png)
![[Diagram]](../../diagrams/43/cc7e2ec1f77d43e312b79fe59a28af7b.png)
![[Diagram]](../../diagrams/22/6b1fbe524c5c13e785ba31fd6d080552.png)
![[Diagram]](../../diagrams/48/b461b9c5d23e2c1dfa1fd074fceec386.png)
![[Diagram]](../../diagrams/38/f2155ec4a1db1896f4fdc074bc2d4023.png)
![[Diagram]](../../diagrams/52/343e36cdaccfafd40170255987fc61c9.png)
![[Diagram]](../../diagrams/48/5f0382c407b07d7c97ebcd72796238a9.png)
![[Diagram]](../../diagrams/35/cd8d8cd614a4cd39793cc50f584a17be.png)
![[Diagram]](../../diagrams/40/580e06c761c4c9eb8933505680546aff.png)
![[Diagram]](../../diagrams/22/8a157757b5f6eddb5ba6380e6d3e4a11.png)
![[Diagram]](../../diagrams/1/9df31f7ef549eacc6466ec3eb3c424d7.png)
![[Diagram]](../../diagrams/21/2119d92497f33c5fab30f32b61176f9c.png)
![[Diagram]](../../diagrams/45/ffd3c602689c136c2a3b713f652e4a5a.png)
![[Diagram]](../../diagrams/51/d1de85a7447aa9e07452fc172fc99285.png)
![[Diagram]](../../diagrams/13/3f23d8494c6e17bc54be8db031e60538.png)
![[Diagram]](../../diagrams/12/9dccdd571fb336faa2cd4a6b70099378.png)
![[Diagram]](../../diagrams/8/5ae9e872bdefa736dc8eb8520b89d435.png)
![[Diagram]](../../diagrams/33/0d77cc97602a3d6906c23b8cf1bd7211.png)
![[Diagram]](../../diagrams/41/a3060463b151d4400d6d5e37d8c57528.png)
![[Diagram]](../../diagrams/35/37727ee7ce3135943cb48560e0bed6e2.png)
![[Diagram]](../../diagrams/50/7ae735c6eece5f4cf4477d6c5dc179c8.png)
![[Diagram]](../../diagrams/5/e2e15346fb00142515ee052d1ee26ade.png)
![[Diagram]](../../diagrams/40/57768d4e1b8e2d98aaa7e4fafb51cbd9.png)
![[Diagram]](../../diagrams/16/7317d585aae6bec90c5fff96a07750e1.png)
![[Diagram]](../../diagrams/39/443d85e2e2fedf42e4f27364708aec83.png)
![[Diagram]](../../diagrams/48/48775b3f0e440fc380ff974ef6f0c20c.png)
![[Diagram]](../../diagrams/45/bb26c6819c31be4cf42833a3ee8daaf7.png)
![[Diagram]](../../diagrams/13/99cff471c567503bed71756ed65da7c9.png)
![[Diagram]](../../diagrams/33/23ac0ea9418fa4a231a07921bab87468.png)
![[Diagram]](../../diagrams/47/4e9d7a346e358b0796686f6c83c5331e.png)
![[Diagram]](../../diagrams/24/b669d6638c49a8f4f2ac95e1b9cc522a.png)
![[Diagram]](../../diagrams/51/30f217f1f648e1c67c9c2f28dde936c4.png)
![[Diagram]](../../diagrams/14/c077b229c7c7877f555988b0b3d06d17.png)
![[Diagram]](../../diagrams/1/88549b2a88f798f91193149e7a38d74e.png)
![[Diagram]](../../diagrams/44/db33708f2f6ec56d1822c745cb2ec589.png)
![[Diagram]](../../diagrams/32/d8fd2a20239dafe3e2605c22bd1e7d52.png)
![[Diagram]](../../diagrams/44/d89c1f02fa0416db6189314320f25624.png)
![[Diagram]](../../diagrams/14/c82f3f8eca5175923c0df7ce0c82261d.png)
![[Diagram]](../../diagrams/16/6ed4711ca37caf991d6cfe7712536e05.png)
![[Diagram]](../../diagrams/27/ab6c1841f49ce0a0fcc6d9bfda890f0d.png)
![[Diagram]](../../diagrams/0/7c2d3201759b9d1fabfca35ad49b1197.png)
![[Diagram]](../../diagrams/8/11234100ef3206a39b52f5127c689cd7.png)
![[Diagram]](../../diagrams/13/9fea37c537bdb2eebed2f13f04a3662d.png)
![[Diagram]](../../diagrams/2/95a2c73e1c71e057e0892711ba763172.png)
![[Diagram]](../../diagrams/38/376156dbb6f3117e74616e0e2fe96218.png)
![[Diagram]](../../diagrams/39/bc0f283cdf4b92d3c9a32e437ee481ff.png)
![[Diagram]](../../diagrams/33/fbc3e4a6c183fc895b53cc1d17b6aa30.png)
![[Diagram]](../../diagrams/27/abac54f0245c0c582657dea75a34dc1e.png)
![[Diagram]](../../diagrams/7/619aa5e589be913101d144637127b3b9.png)
![[Diagram]](../../diagrams/6/cd082436bd03b96f73e6b98bc4e19e4e.png)
![[Diagram]](../../diagrams/48/59dcea970c194338a44c21646a8d76f2.png)
![[Diagram]](../../diagrams/47/807c6e926fb90dd42988a2812bfc5d3d.png)
![[Diagram]](../../diagrams/24/0ecea37d062241d2ad2f5cd5899824d2.png)
![[Diagram]](../../diagrams/13/89a6617f794fb27fc1e99a8b8463569a.png)
![[Diagram]](../../diagrams/4/639fc80d370fe8002616b89b7b7266fa.png)
![[Diagram]](../../diagrams/27/5ab00b6210f968e765001b2371f78b41.png)
![[Diagram]](../../diagrams/52/900038ed4442d62c3e14399e35f0b4f9.png)
![[Diagram]](../../diagrams/1/5f134ad43d7240a738f6118f9f6b6a9e.png)
![[Diagram]](../../diagrams/5/4ce18d838494ee3e60adc07d63212c1a.png)
![[Diagram]](../../diagrams/31/1d934d58c96fa0be119719343c2fa41d.png)
![[Diagram]](../../diagrams/44/da82fe774d5a4d348cde2dc57f84ff5f.png)
![[Diagram]](../../diagrams/52/5d10794efce74074ea5c9811e0a11b14.png)
![[Diagram]](../../diagrams/2/54c76f54909cd8eedcb5c9db4f8dff76.png)
![[Diagram]](../../diagrams/23/0c65d19cc20818b555600ad2de0f16d1.png)
![[Diagram]](../../diagrams/10/d4b69125aa378f3b84c34d5c6cda8cfd.png)
![[Diagram]](../../diagrams/28/41a51ec60b99a9ff98656a1ed2d5109f.png)
![[Diagram]](../../diagrams/43/4827a4909576a7697a70584f26bcaeea.png)
![[Diagram]](../../diagrams/46/9c0d26469cdd76ffbc9503456e79258b.png)
![[Diagram]](../../diagrams/24/f1a9e47e126fed6c4121e6cf085296c2.png)
![[Diagram]](../../diagrams/16/e9a7bee8aee3f9e1b9008cbbb4158ae8.png)
![[Diagram]](../../diagrams/41/6c58ac44b5ed3446b0647b56cd5c5b5f.png)
![[Diagram]](../../diagrams/29/c9531f545771ce9dbe690f9d718ddbd4.png)
![[Diagram]](../../diagrams/46/12f5a99164900aaa6032320730414665.png)
![[Diagram]](../../diagrams/46/eb1c892912d94d0f2a57dd2515838b61.png)
![[Diagram]](../../diagrams/23/7f098bc0bd6896013bf30389f678b509.png)
![[Diagram]](../../diagrams/16/a2780e423183a8e07b8dfbb11c5c3393.png)
![[Diagram]](../../diagrams/4/ed2a94fd9d6846de4da4389d19c5f9a3.png)
![[Diagram]](../../diagrams/13/3c695b0f82b83a4bf0fd494b6d37d93c.png)
![[Diagram]](../../diagrams/45/2f0d187e142e0912a463ccd335053c5d.png)
![[Diagram]](../../diagrams/29/b9b3a3af0b6b06bce6dfe1fb473d92fc.png)
![[Diagram]](../../diagrams/18/15825a77f33776a3e72efc1d1e6496a4.png)
![[Diagram]](../../diagrams/23/efcf39bd98b49550720e9fafe9164ed2.png)
![[Diagram]](../../diagrams/35/2be21f35edad94452fb6cae732a5576b.png)
![[Diagram]](../../diagrams/47/6dce3842567ff4d6965dd28d77c2665c.png)
![[Diagram]](../../diagrams/47/a67b2e17212b7c63aa78b260fb353827.png)
![[Diagram]](../../diagrams/50/5679f624009bc96a11a8caab5d693900.png)
![[Diagram]](../../diagrams/22/da4d2b249e0ff938bc2823e01bc782b4.png)
![[Diagram]](../../diagrams/48/52d0b32a4c192241053b1ac19fab6809.png)
![[Diagram]](../../diagrams/7/001e4137fe91bbd72d5dff5db6c1b9fd.png)
![[Diagram]](../../diagrams/17/ddadd67f963d537f7f38025d5e231603.png)
![[Diagram]](../../diagrams/42/605f17c523c837377ef2cc98332e9179.png)
![[Diagram]](../../diagrams/29/93773cdcf5ab5e328b51680ac17beb33.png)
![[Diagram]](../../diagrams/42/4ce8b97a405b40cfcc3efc2fcf7fa7cc.png)
![[Diagram]](../../diagrams/36/3f39cb11795793325a5d8ed77feac591.png)
![[Diagram]](../../diagrams/9/fe38a7dd6291de0227e594674d10a6a4.png)
![[Diagram]](../../diagrams/7/80a9e9661cae0367bf8913966c896f28.png)
![[Diagram]](../../diagrams/28/13826c276a51fc2fc3466116c1eceb14.png)
![[Diagram]](../../diagrams/52/5676ce058d146d2d1b46bd70674588fc.png)
![[Diagram]](../../diagrams/50/bceb2345c4198fc4ec160c222c97558f.png)
![[Diagram]](../../diagrams/41/db1375c19bf80e6440cc42449e7aa76b.png)
![[Diagram]](../../diagrams/4/abaec4b4850f4f32c2501c6df0f2e37a.png)
![[Diagram]](../../diagrams/50/e6382c871ee4e268be7f2b86c8a9330f.png)
![[Diagram]](../../diagrams/24/f81467c6301c7f8b9bb6a4e5d626a004.png)
![[Diagram]](../../diagrams/25/d892ce6e110b881fbcc3ffef937d2f57.png)
![[Diagram]](../../diagrams/40/45fb8501add4552a0e94302fc6f6f1de.png)
![[Diagram]](../../diagrams/3/a7c83a1fe6adb1316df544d94d689841.png)
![[Diagram]](../../diagrams/28/73c654fcb79f6fd57e160b62bceb07ee.png)
![[Diagram]](../../diagrams/24/83c8fe54cd47c8340af16fbed72580b3.png)
![[Diagram]](../../diagrams/2/95599a61b40cb1f85e02b9e1fae23613.png)
![[Diagram]](../../diagrams/32/e93b76ac11de0cf9dcabc429938771a8.png)
![[Diagram]](../../diagrams/7/4e40a91371bb88969aff5eab9e19c858.png)
![[Diagram]](../../diagrams/4/c8e47d8e4b02b623a89e9bf507512cdb.png)
![[Diagram]](../../diagrams/15/c5e11482008c46172073bff5e9f3ae6e.png)
![[Diagram]](../../diagrams/6/3f12b378050e96abf92994ad5341c9e2.png)
![[Diagram]](../../diagrams/45/e1f988937acaf83926ae4effccaa30b0.png)
![[Diagram]](../../diagrams/49/043235aa2f53d94e64a4b73c3d34ed6c.png)
![[Diagram]](../../diagrams/10/222c7a1660d4f1ab9d97d4d978493abc.png)
![[Diagram]](../../diagrams/16/400f9a58b00290a145ad78032adb6c5a.png)
![[Diagram]](../../diagrams/13/06b12dcbcb1fa28f1c7ba104cf12c121.png)
![[Diagram]](../../diagrams/8/92eb17b3b1a301f0bcf90f062ce4fd36.png)
![[Diagram]](../../diagrams/25/4911890df922094dc3cacb6ceee514a6.png)
![[Diagram]](../../diagrams/51/8802dbcaa60b14def60306537c57f706.png)
![[Diagram]](../../diagrams/32/5471b75409126b4a548aba06398256b2.png)
![[Diagram]](../../diagrams/52/052fed83183d7e9e40acdf4793707a81.png)
![[Diagram]](../../diagrams/41/f373cefe2f450b6e16debf93afdde0bc.png)
![[Diagram]](../../diagrams/22/a2e15266c35a80c48743f1586dfbba3e.png)
![[Diagram]](../../diagrams/50/92afb49287777fb5f91a08bf047c4012.png)
![[Diagram]](../../diagrams/41/9f412bd956bb2324a64a6dc151f278fe.png)
![[Diagram]](../../diagrams/45/a28c01ad74985501a3cd98b867e977fd.png)
![[Diagram]](../../diagrams/9/e6f46538d16e593a42ac6b21d9f587f5.png)
![[Diagram]](../../diagrams/45/ca45cf087bf32ee4fc7ecebfe60fa321.png)
![[Diagram]](../../diagrams/4/273c67486e723aca47e22f3f2a7e4cb0.png)
![[Diagram]](../../diagrams/17/4d0b9be45db2fdf8a2aa18cdd462f6fe.png)
![[Diagram]](../../diagrams/4/68c27f8b181da77cd7d6bdfff3fed7bb.png)

![[Diagram]](../../diagrams/39/93a2b47a419377b1c52baf35ea33b7e4.png)
![[Diagram]](../../diagrams/34/443bcb029c629e58aae2f75926ffe367.png)
![[Diagram]](../../diagrams/13/cf33d9102151599f11f27437e394c35c.png)
![[Diagram]](../../diagrams/38/00cab68d78d4bf88537711f84d10f4c6.png)
![[Diagram]](../../diagrams/52/b143c1b75f68d5b3351779e1b6715b30.png)
![[Diagram]](../../diagrams/17/e27c11ffd8401e36f8c02c0464450eb4.png)
![[Diagram]](../../diagrams/15/907936fa39a00fe60bfa4d6f4cafc9ea.png)
![[Diagram]](../../diagrams/11/84546ad841c47ecde1f8d384293acf1d.png)
![[Diagram]](../../diagrams/1/1f58a7c7092d1217b74209cff0aa8960.png)
![[Diagram]](../../diagrams/48/ce37475c196a71a8b923711b554f3835.png)
![[Diagram]](../../diagrams/41/6402ec6a1e187d2afe5321bbdc9fc211.png)
![[Diagram]](../../diagrams/36/2106c19ff1535bddd6eed332eabb4459.png)
![[Diagram]](../../diagrams/22/4f9d7ac7406c4236b320aa814de33b56.png)
![[Diagram]](../../diagrams/33/ad8c8d83ab229f10ec6813dd5b3ca1c2.png)
![[Diagram]](../../diagrams/44/3cad6e47226db4263f61dd58568fd654.png)
![[Diagram]](../../diagrams/12/23f981338d6426ce02d3ac3e3111a6e9.png)
![[Diagram]](../../diagrams/45/71bc07732227b3c63c8992c50079a23a.png)
![[Diagram]](../../diagrams/18/5a2c7ddc9a9f583df1c9735d3bb14c52.png)
![[Diagram]](../../diagrams/30/f1b4df38e381cb61e8488b184fb4d59d.png)
![[Diagram]](../../diagrams/49/e2b84c742d5a34d47b52a51c825f34e5.png)
![[Diagram]](../../diagrams/29/93bc5aa98fe589b9646da4e6fb5c7404.png)
![[Diagram]](../../diagrams/3/47583149593c9087c12d3c816c0b55c1.png)
![[Diagram]](../../diagrams/4/15fb4baedbbe70d1125eaa8fd0cf7f57.png)
![[Diagram]](../../diagrams/11/362a246d971a79a1d2a304b5c1c73856.png)
![[Diagram]](../../diagrams/27/6a9b3b9e34e76376e064454d6eb3fdf0.png)
![[Diagram]](../../diagrams/37/d2ed02111fd781574370f84ef681e2ad.png)
![[Diagram]](../../diagrams/19/1a6aae2dc786a9bb754abd8c4125e907.png)
![[Diagram]](../../diagrams/25/257fac9dfb67121886f537a1d3587ad1.png)
![[Diagram]](../../diagrams/32/02abe62ede6ea45f8bb89e31de128516.png)
![[Diagram]](../../diagrams/20/03e1b9305e3eb4963f8465636ac929f6.png)
![[Diagram]](../../diagrams/7/2fa45a35c620431f10065dab67883d2f.png)
![[Diagram]](../../diagrams/29/d2f524cce3ab9b6379e1fac7299ed695.png)
![[Diagram]](../../diagrams/31/e9d8c520d3572c7843b4823c2af0f8a0.png)
![[Diagram]](../../diagrams/46/11e7463f8921ed85d12d31f145eb3fab.png)
![[Diagram]](../../diagrams/8/8db59f9a2ed581f442ec137c209e73fe.png)
![[Diagram]](../../diagrams/29/e65e1a015fbfaa03f8afa470d2bfe073.png)
![[Diagram]](../../diagrams/32/45fbbe0556c632d491364236498a8c52.png)
![[Diagram]](../../diagrams/24/e8043ccbd1473618f7f69267b5532b47.png)
![[Diagram]](../../diagrams/28/a388bc7ae0218d4c593b2fcbeebf2e85.png)
![[Diagram]](../../diagrams/27/e8809707e7c13d743c57e7962fa208b8.png)
![[Diagram]](../../diagrams/4/936611ecba63e0881d2dd38d3d0599f3.png)
![[Diagram]](../../diagrams/29/3577310354f4846424606e8a353a53a5.png)
![[Diagram]](../../diagrams/6/9988d123c111c0afdb89e356650083d6.png)
![[Diagram]](../../diagrams/38/29bdf6f3f52c9532f0fbc47d63b8b7cb.png)
![[Diagram]](../../diagrams/34/e66ce01ccce0e80f610b56c0e3b0d2d7.png)
![[Diagram]](../../diagrams/36/3dc8d215bcacb1908eda0c3cbaee3b4e.png)
![[Diagram]](../../diagrams/47/7213c5acbdbba276a7e0e0c04aeaf2c3.png)
![[Diagram]](../../diagrams/44/493ee1f56b703468c6bef3526cdca509.png)
![[Diagram]](../../diagrams/13/79801e2ba6e3abfb054eb4d1eebdb85c.png)
![[Diagram]](../../diagrams/46/1b344bb928459be467e48047f324c90f.png)
![[Diagram]](../../diagrams/45/0a45e30ea92eb63f58bc100b083ac58e.png)
![[Diagram]](../../diagrams/13/b36bfa831cebc7258d22043096c55cd6.png)
![[Diagram]](../../diagrams/48/bc1730c8f9067e3d042b63d1c6b686a8.png)
![[Diagram]](../../diagrams/31/056f68ae76d7651c3ddbea69ab60a5e3.png)
![[Diagram]](../../diagrams/30/01230cdce56031c3c81b22b90617995c.png)
![[Diagram]](../../diagrams/15/6ef42de1d1de3c555ded3fc0f8ebabe8.png)
![[Diagram]](../../diagrams/12/7f35075a4917b5fd5bfdaebc4ccfbc23.png)
![[Diagram]](../../diagrams/8/a36b90f91224eb4d786a5db2208bbbb0.png)
![[Diagram]](../../diagrams/23/fd5ca95a9dcef6652af9cf431de10dee.png)
![[Diagram]](../../diagrams/18/40e570299566917387de6579f6469638.png)
![[Diagram]](../../diagrams/20/5a0f4362229c91b17455673f4d2d64b1.png)
![[Diagram]](../../diagrams/1/8829bd4de64ac429078e54801cbb98f5.png)
![[Diagram]](../../diagrams/26/62c579a8077ae670f1028913e547a918.png)
![[Diagram]](../../diagrams/49/d104634816ad64c9e547e87a4f189463.png)
![[Diagram]](../../diagrams/22/fe79f16cb9673c0182733d449ac78a57.png)
![[Diagram]](../../diagrams/1/d0f1ac66b91466975b3be40222fe5544.png)
![[Diagram]](../../diagrams/20/d8ef7281a35555765609e8a50229a160.png)
![[Diagram]](../../diagrams/48/7cce2e6fe2ba3f724dfe7fe78e3cfb77.png)
![[Diagram]](../../diagrams/46/f185107751ffecf8dde4f8e7c5a47efe.png)
![[Diagram]](../../diagrams/23/624a77330f6b3939a9c7b5a11d47eb06.png)
![[Diagram]](../../diagrams/7/93a95821873190f1dae953361f006ed8.png)
![[Diagram]](../../diagrams/28/fec8be16251248147cb271fc5c780302.png)
![[Diagram]](../../diagrams/40/2bd9a18a158beabf45bf57e7714a5414.png)
![[Diagram]](../../diagrams/10/bf53d48f074168d3666ec49eff13d150.png)
![[Diagram]](../../diagrams/31/f299dfa227b571dcb3b1ff63fe2bcaa4.png)
![[Diagram]](../../diagrams/47/f2dee8bb590828630fa3fe23d59ddab0.png)
![[Diagram]](../../diagrams/44/469b32ab6be2ae62a0b5f8c78e2b98cf.png)
![[Diagram]](../../diagrams/18/0c5778e7943a2765e9759c4b46df97eb.png)
![[Diagram]](../../diagrams/10/07b16e96ea09f54ef31a818f81d80d89.png)
![[Diagram]](../../diagrams/14/9085a5ca05412a3b3293707254d33b9b.png)
![[Diagram]](../../diagrams/1/87223a68f98152523758ddfa50ffb9bf.png)
![[Diagram]](../../diagrams/16/5729d5ab75cfb480c9b32f859e4009b1.png)
![[Diagram]](../../diagrams/41/6d71eefb55d2ff85f71923d617ef4227.png)
![[Diagram]](../../diagrams/31/161a77b3e1352c5c018075cd2ec4f62a.png)
![[Diagram]](../../diagrams/28/cbe5fb47541ef119e46435593466b854.png)
![[Diagram]](../../diagrams/31/7fe1eff83a62759d676a656c06add796.png)
![[Diagram]](../../diagrams/8/5308a5d904c7114463de8bb7fe77a2af.png)
![[Diagram]](../../diagrams/14/582a2cfb35fc392d7d7064fd09e89512.png)
![[Diagram]](../../diagrams/14/90cd8f5606d524353246e82222ebef9a.png)
![[Diagram]](../../diagrams/45/888bf45c4e9c8c5dce3cf62b5639af3d.png)
![[Diagram]](../../diagrams/20/a3b9dfbe973c9638dc06db56da72505a.png)
![[Diagram]](../../diagrams/0/2601ae2f6d687ff545030a84402d1264.png)
![[Diagram]](../../diagrams/36/91b5de9801793e328deb3dbcdc4eec0b.png)
![[Diagram]](../../diagrams/40/94b4ec48fee325f463a1fb860c507ce6.png)
![[Diagram]](../../diagrams/29/f4eb05b3065b047f4710c23cf03a91d0.png)
![[Diagram]](../../diagrams/41/6d7142f62fc8d791bd30cddf9e94fd36.png)
![[Diagram]](../../diagrams/3/3f4908e951f7d25ad0922db827d142db.png)
![[Diagram]](../../diagrams/36/0c49da303dd3b53ced2a6c7f45640853.png)
![[Diagram]](../../diagrams/14/8eb4146dca3607df60b0b22fd65454b7.png)
![[Diagram]](../../diagrams/31/ebf78ee7e141b2063309ef1fdd817cde.png)
![[Diagram]](../../diagrams/20/fee198fd327fb6bc771363d65d5cb9aa.png)
![[Diagram]](../../diagrams/43/78c2162d059933cb2c0a1a79ba94686f.png)
![[Diagram]](../../diagrams/4/5195b10ef80490868db5eb4d584a1aad.png)
![[Diagram]](../../diagrams/0/3611e871491fac5bd73539de82c8d96d.png)
![[Diagram]](../../diagrams/17/3b29afc7ab2494482b5a0b85062f0326.png)
![[Diagram]](../../diagrams/1/89c6fed9c6b1712eb3effca91007bbb0.png)
![[Diagram]](../../diagrams/28/f9e0ec5003ba09aff7d13af8e699fa8a.png)
![[Diagram]](../../diagrams/37/edfc511093c4faf9529714e9ec4ea489.png)
![[Diagram]](../../diagrams/46/173684669161ee7b234daffba51a2945.png)
![[Diagram]](../../diagrams/38/8777989047eaac53f837f22a5cfca5e1.png)
![[Diagram]](../../diagrams/50/76875bd04df1fb07340c90a44415a442.png)
![[Diagram]](../../diagrams/23/669d373a815f035635f8d2345849bdfe.png)
![[Diagram]](../../diagrams/30/0c5ab1a07182f93230487ec24affe2bd.png)
![[Diagram]](../../diagrams/23/f769eaa5bc8bac98e56f099a0d6831bd.png)
![[Diagram]](../../diagrams/39/23134f47fcc99a00bc46b17ce33be6b8.png)
![[Diagram]](../../diagrams/1/195aef16b811e77c4f64afeee67c6a20.png)
![[Diagram]](../../diagrams/32/1880ee7e8c4287fc6791a8415c784ce6.png)
![[Diagram]](../../diagrams/18/49897805d7a9e0a98cbde44d5e07c91d.png)
![[Diagram]](../../diagrams/51/17fabf8e8bf883f1f15b3e775cbe47f5.png)
![[Diagram]](../../diagrams/16/b55b49a1495ece6b18a806ae53075748.png)
![[Diagram]](../../diagrams/25/12fff0fbfa218e24180f0c5fbeb5eb93.png)
![[Diagram]](../../diagrams/9/1c9e15b1439978f5d3e3e065c1ba8bbe.png)
![[Diagram]](../../diagrams/13/95cb9e0ec46d91a187c21fd413ea2eb0.png)
![[Diagram]](../../diagrams/32/78a38fccc48268ded7a9ffba87142783.png)
![[Diagram]](../../diagrams/50/ff831187371457ea5431fefac1f254a1.png)
![[Diagram]](../../diagrams/15/3ad140442bbbb9d6eedfe11a8b1ed806.png)
![[Diagram]](../../diagrams/29/21f50ca8016f85096706cd30f567a251.png)
![[Diagram]](../../diagrams/43/945b72a2b0ee4d0f2bf4abfa6a229e3b.png)
![[Diagram]](../../diagrams/33/25101e2d1ebbd56a51bee9435968bd87.png)
![[Diagram]](../../diagrams/36/c63f3889688a6ea1bc5c49a4072d0d97.png)
![[Diagram]](../../diagrams/20/da9e58499210a7b2bb5977d94992208e.png)
![[Diagram]](../../diagrams/12/881c4a18ffa0143908b95909bbf1e9e9.png)
![[Diagram]](../../diagrams/22/30c9b0abbb2524e85ba72d56b0c5a574.png)
![[Diagram]](../../diagrams/17/a42419eb894295c4e2ed93c95244ede0.png)
![[Diagram]](../../diagrams/27/8ccaad2d70deb4e127345669d0a2806f.png)
![[Diagram]](../../diagrams/30/7dba2a356279185af4ae9fbc2518d5a4.png)
![[Diagram]](../../diagrams/20/9cb7360737aaa342290130d3fee30609.png)
![[Diagram]](../../diagrams/26/01502adc526b9e2b3ffe555f863d0e4e.png)
![[Diagram]](../../diagrams/23/68c420c979e26e33d96df7664591281c.png)
![[Diagram]](../../diagrams/0/7218b94a3d0d578bdf82b1433367f9ac.png)
![[Diagram]](../../diagrams/42/bc6d993e7b8ad5fe6099179d52fbdee3.png)
![[Diagram]](../../diagrams/3/646906c5112a6c68380a10820ae9f246.png)
![[Diagram]](../../diagrams/31/11bb5485f302035315906277c472cdf8.png)
![[Diagram]](../../diagrams/16/aa1ce88c2952e08e4261225156454940.png)
![[Diagram]](../../diagrams/33/74cd8c478b6ab567a60d60d32142973d.png)
![[Diagram]](../../diagrams/35/0b695ac421f2a2b1689161693bebc69e.png)
![[Diagram]](../../diagrams/32/1dd8e35b9ea6f4d2acca218f42f4e17f.png)
![[Diagram]](../../diagrams/39/e4695f55342488213674c923519b9c05.png)
![[Diagram]](../../diagrams/39/3e2d56f8a4aac017e37654c6480320d0.png)
![[Diagram]](../../diagrams/10/9aa9df67c22082c60d1ef891c21467a4.png)
![[Diagram]](../../diagrams/10/ac357843bc1fe0342dce881b455719e3.png)
![[Diagram]](../../diagrams/17/474e13c4103372b5b0a5a07a1a58904a.png)
![[Diagram]](../../diagrams/6/19dc589f9a14cd227fc0733f800d9f15.png)
![[Diagram]](../../diagrams/39/ec0c5425207664e91ee37d861f950919.png)
![[Diagram]](../../diagrams/36/11f88dd83b2184b8030cf4c4d9ba7e8d.png)
![[Diagram]](../../diagrams/13/bb0a7cde0b0d47a50ab757f6e2619080.png)
![[Diagram]](../../diagrams/1/696f1e045236b16a13b22d61f64bd002.png)
![[Diagram]](../../diagrams/26/b8592ae4228572afdeb98d19544fba44.png)
![[Diagram]](../../diagrams/4/808149705e01d452194f7ac077244e39.png)
![[Diagram]](../../diagrams/43/1afa0bdd1a1e4355a369ece4bc31d521.png)
![[Diagram]](../../diagrams/39/e26dafbefe153b98bf39e7fcd020f4cc.png)
![[Diagram]](../../diagrams/25/0af2850b87595b184dd31828d3bd5da6.png)
![[Diagram]](../../diagrams/16/b016fb8f219b75aa8d5ec94487665021.png)
![[Diagram]](../../diagrams/6/0e209d6fbffa4d610d8e697afaa4f55f.png)
![[Diagram]](../../diagrams/33/f7c489227e7a6ec1ff38f775c4cd2186.png)
![[Diagram]](../../diagrams/42/bb3e8a61d1bf2a22b0c8f9b648f91b3f.png)
![[Diagram]](../../diagrams/25/6ba72148b5508ac3571ba4910b26e8bf.png)
![[Diagram]](../../diagrams/52/39177d385173cdff1cec620d58bfde6f.png)
![[Diagram]](../../diagrams/31/27f442f01bb97f09a2b84bfbb4c0460f.png)
![[Diagram]](../../diagrams/30/4a3651732b29e87f6a87f3f6366419ed.png)
![[Diagram]](../../diagrams/24/cc430fcaf36790cd1f5029806f580d11.png)
![[Diagram]](../../diagrams/1/4fefe50184493ca3f6a9a3ef6021ec49.png)
![[Diagram]](../../diagrams/46/b4c8a8a2e1ae06ffb98dad83f2db2b51.png)
![[Diagram]](../../diagrams/37/0042bfe41293e8787bc52059fc5c0ca3.png)
![[Diagram]](../../diagrams/40/a04d9464656e765d4569fc9b8cff188c.png)
![[Diagram]](../../diagrams/30/cc1bf141eeb96fe995430332dcd32fb6.png)
![[Diagram]](../../diagrams/41/306849f12f713dbe2a52ec2e26416d1d.png)
![[Diagram]](../../diagrams/32/0641742d849188b772bedd33e3fee2e9.png)
![[Diagram]](../../diagrams/26/979af8d50802836ab45e87b68e9f7096.png)
![[Diagram]](../../diagrams/9/8e43833afb10cde97d9fc4de4e06d2e3.png)
![[Diagram]](../../diagrams/36/f64f3b953587fab295bac2d1cf300c6d.png)
![[Diagram]](../../diagrams/0/5d735f2e73fb7ae7ed995f5ba573a404.png)
![[Diagram]](../../diagrams/49/683ee9688e5563a4c71fbe471022324c.png)
![[Diagram]](../../diagrams/1/8d25d11ae5187d604c1e3af0b511af60.png)
![[Diagram]](../../diagrams/14/d1a0c2ec78bb4ecf840133026e74abc5.png)
![[Diagram]](../../diagrams/48/d3f8ddeaa7f529d58cb5585a4c21ab3d.png)
![[Diagram]](../../diagrams/7/5281fc4dd7705548b9b3117fb1985ce0.png)
![[Diagram]](../../diagrams/10/e360937b0b313434d2f7e40074bfc413.png)
![[Diagram]](../../diagrams/7/ec30b673e2f76ddc445098300331b7c2.png)
![[Diagram]](../../diagrams/14/0da2d50c2dd16afb39a1fd1bce8bf0d1.png)
![[Diagram]](../../diagrams/43/65df82366229a42e81a4d424db8c26ea.png)
![[Diagram]](../../diagrams/26/9a9a4ae6c6ea4abdf659f598ede0fd02.png)
![[Diagram]](../../diagrams/4/3ae3ef0bc5083d0dd4d20f5ca0a136c6.png)
![[Diagram]](../../diagrams/46/d114500b113fe9bef961cd52fb796dce.png)
![[Diagram]](../../diagrams/32/831a9c4e0467802f7290e763deaee855.png)
![[Diagram]](../../diagrams/1/40a2d3fde8d15e98281dad4fa9e5f3f1.png)
![[Diagram]](../../diagrams/7/9d634163a4729e421bd68a3d2ea611a2.png)
![[Diagram]](../../diagrams/15/89b83f8bb8e262a524c0d5b7b93e18fc.png)
![[Diagram]](../../diagrams/16/b3805bb504c8c330a8b790a5f8acd900.png)
![[Diagram]](../../diagrams/0/8ab66a92e39da6a2ca5c124c3f2801f7.png)
![[Diagram]](../../diagrams/21/bf9fec4c9822908c961524a5417e97f9.png)
![[Diagram]](../../diagrams/44/1ef2d98cf23491893fd630ff87200c21.png)
![[Diagram]](../../diagrams/1/52e467c869dab6c276d55099ad762eaa.png)
![[Diagram]](../../diagrams/37/9e9415da2baba090ed9e24597a157d34.png)
![[Diagram]](../../diagrams/8/04112948b1280b34d94e9b22eb5c10be.png)
![[Diagram]](../../diagrams/39/5e7a2c0a3e6fd4225cf7a687cef58370.png)
![[Diagram]](../../diagrams/21/75a8fba526f5a550e38442c4d3cd39c7.png)
![[Diagram]](../../diagrams/9/4842fa5c2712138847daf61fef6a0fe6.png)
![[Diagram]](../../diagrams/27/2c4000e5b1343da831c9447bc3cc0b13.png)
![[Diagram]](../../diagrams/44/0c64b5567015020203c71dcef3eebdac.png)
![[Diagram]](../../diagrams/30/5dfbf77f3e77af83565f0a8eb86ac608.png)
![[Diagram]](../../diagrams/22/e8c75684d3ceb19486182f732081ea5c.png)
![[Diagram]](../../diagrams/21/24254871f1e821c69a33467c9d44426d.png)
![[Diagram]](../../diagrams/52/6c93143523cc1be0254460764a9d86aa.png)
![[Diagram]](../../diagrams/42/be5c23d596e45f7d850f71c76982cd5f.png)
![[Diagram]](../../diagrams/3/7f6f6f864a775abc52fef6cb674c4901.png)
![[Diagram]](../../diagrams/26/c9352735124409ad6c2ec80e625c1c17.png)
![[Diagram]](../../diagrams/51/6e6a536222030bb318771a685d8d8f92.png)
![[Diagram]](../../diagrams/9/9c64a60b7ae21002d1578a685dfe401c.png)
![[Diagram]](../../diagrams/7/e4dffca0da5ec91b4ceaade4a4c3ae50.png)
![[Diagram]](../../diagrams/16/7efc18dc4b4e5f5a48353f2f0cbedf1f.png)
![[Diagram]](../../diagrams/10/f1bd72d06b6ba7407cf910cf65f51b03.png)
![[Diagram]](../../diagrams/22/b65ab0ec1a9993214f1802f170f97102.png)
![[Diagram]](../../diagrams/39/13f144b100077a86a7139e8f8e22168c.png)
![[Diagram]](../../diagrams/29/53e8e3473f2ef2bdcc87af0c598d46b4.png)
![[Diagram]](../../diagrams/6/f78161c7298362ccebaa40fb3b8150c5.png)
![[Diagram]](../../diagrams/14/3c6d654244fa36595002408cd75ab2f8.png)
![[Diagram]](../../diagrams/23/3ad21e25e00dd4423c83112847eacb66.png)
![[Diagram]](../../diagrams/41/6096a4a943264be9653befd1af8ae64e.png)
![[Diagram]](../../diagrams/51/add53a133e901763046d461b4d5df4e7.png)
![[Diagram]](../../diagrams/49/8e332eaa27ae8a0967a190e4c9736d8f.png)
![[Diagram]](../../diagrams/43/8f17deee8bc0995f8dd978e69e2267af.png)
![[Diagram]](../../diagrams/14/98bdbbfe4fd0da794e8055408fa9cf6f.png)
![[Diagram]](../../diagrams/2/e87e114fa21da7d45103dc4a4a04e6b6.png)
![[Diagram]](../../diagrams/27/d4410d77f7fef858257c52f9b3ed8d93.png)
![[Diagram]](../../diagrams/20/4db41de1e2d1d2ce931fd23bb111f577.png)
![[Diagram]](../../diagrams/18/87cbdd9715af004c842b8732703a8eb2.png)
![[Diagram]](../../diagrams/37/db23627b05fdcaf0bd12381038678197.png)
![[Diagram]](../../diagrams/27/04388bccbce5a3ead40e119ab19dc29c.png)
![[Diagram]](../../diagrams/38/63b43acf591ca3b2e155304289c5e7a6.png)
![[Diagram]](../../diagrams/19/76b133599f3c13a043f38fd392788498.png)
![[Diagram]](../../diagrams/5/dd19dac44a9dae6bf5a0a026f218fb47.png)
![[Diagram]](../../diagrams/48/e43e718f98f453977ab546ec1e660f60.png)
![[Diagram]](../../diagrams/44/eaa5724bf09dddf08639db29a8afa191.png)
![[Diagram]](../../diagrams/23/bb110c39e70a93f5ac8020f64cac7be2.png)
![[Diagram]](../../diagrams/20/88ccfaa10c286ffa88d8bacb6b02c899.png)
![[Diagram]](../../diagrams/2/3555f8b67b1d689b43e7ed66f3b9aad6.png)
![[Diagram]](../../diagrams/21/0c80dbbbd73e955a91f6d13fae7a8c03.png)

![[Diagram]](../../diagrams/39/93aad87135f12312997d6ae88b3f1b88.png)
![[Diagram]](../../diagrams/21/1eb423ee1f5719418baa9be4bceeeb16.png)
![[Diagram]](../../diagrams/19/2e073201969c90e5e34fbfa3031a60e7.png)
![[Diagram]](../../diagrams/0/a326175e5b1bad30760a84cf2161c913.png)
![[Diagram]](../../diagrams/26/56d5667c2b21a3167bc158615414d70a.png)
![[Diagram]](../../diagrams/9/8498fac246b3faafce92f6da47e7f4dc.png)
![[Diagram]](../../diagrams/1/c7a7f8f3429024202889ba8a72e45578.png)
![[Diagram]](../../diagrams/17/d9c2aa7129dbdc251d4ad6c5d7ba0ef8.png)
![[Diagram]](../../diagrams/38/524b7ff80c9dad6f7687f78aa8a51846.png)
![[Diagram]](../../diagrams/23/735178757efbb8ed8ead9c2ae2a941eb.png)
![[Diagram]](../../diagrams/4/e2427c3305027206468274756f6aa617.png)
![[Diagram]](../../diagrams/30/b05e04e44faabd4c52f3089180ca662f.png)
![[Diagram]](../../diagrams/27/8af97ba61e5e1fe94ab566f099800a81.png)
![[Diagram]](../../diagrams/15/0cdca2929e655754ede00c3a0abbfb43.png)
![[Diagram]](../../diagrams/44/1daee55b8804457c14d1eed154896a06.png)
![[Diagram]](../../diagrams/43/61911a10184c22fe19edcbd3517e3bb1.png)
![[Diagram]](../../diagrams/29/c264d4caf67154bd542e5126919686c8.png)
![[Diagram]](../../diagrams/19/27b2397f8b92f053c8312fdc9252a1b0.png)
![[Diagram]](../../diagrams/13/931a0a0196e9332ede88c34254c05f82.png)
![[Diagram]](../../diagrams/38/45c3c29d9b1d7c04ddadff188288290f.png)
![[Diagram]](../../diagrams/39/f4be6df133546330fb14481daf795938.png)
![[Diagram]](../../diagrams/7/85c9d92679ae1cb69544be424c89b96e.png)
![[Diagram]](../../diagrams/21/d24ce518b941ec07ab822268228920f7.png)
![[Diagram]](../../diagrams/24/b3f41550522a59a636f1ac6cc08a15bd.png)
![[Diagram]](../../diagrams/48/7023dad80e5132ea1641d7a52fb0f220.png)
![[Diagram]](../../diagrams/33/f47da6f3662c3e50f9cdaf18c5c5601d.png)
![[Diagram]](../../diagrams/14/0f404dfc9c004cfada144d05a699ef44.png)
![[Diagram]](../../diagrams/10/709b9028172ba435bb0f591c1fd33da1.png)
![[Diagram]](../../diagrams/48/9dcd4b5a1c9101fd5fdc25c95f51a597.png)
![[Diagram]](../../diagrams/45/24b683fd06106570e788d8685129c9fd.png)
![[Diagram]](../../diagrams/36/1247db28739509ba233ade43685611c2.png)
![[Diagram]](../../diagrams/10/36be2f13a42426c04411fc78c8ec26e7.png)
![[Diagram]](../../diagrams/1/b9d3e0fe0b5e968acda1e5221e9436c1.png)
![[Diagram]](../../diagrams/5/c2bbe473fb005f00b8af3148a81719f0.png)
![[Diagram]](../../diagrams/39/6ece05752208004ffe2bcf05f0fea91a.png)
![[Diagram]](../../diagrams/37/46496ae71ddaf1f7ddf12ea16e04aadb.png)
![[Diagram]](../../diagrams/5/e62856d164c4ba8362332b0ebd4a529a.png)
![[Diagram]](../../diagrams/15/c1a01010a9a7c8447228e4873b51003e.png)
![[Diagram]](../../diagrams/26/65ef6c515a886554317a076e6a08e26d.png)
![[Diagram]](../../diagrams/39/a5ec43e205d7a4b45ce8e0d9849452c1.png)
![[Diagram]](../../diagrams/20/c4d8e51680a6657e3639b998ecf6129b.png)
![[Diagram]](../../diagrams/47/5011c51967c0850a35c777867c860cee.png)
![[Diagram]](../../diagrams/3/cf3c1aeb757c3750482595ececeb1031.png)
![[Diagram]](../../diagrams/24/dca66eb912180c9e0adbaf46b9c0ef1b.png)
![[Diagram]](../../diagrams/51/a325bb53d41f03db38d75ee29ae650c0.png)
![[Diagram]](../../diagrams/26/5a64fd716badb305b9cdf346ba41f27a.png)
![[Diagram]](../../diagrams/24/2d09d4eacc8eecf6a24a2f73afc36640.png)
![[Diagram]](../../diagrams/12/6414c1b14cecad32d6970a32e7925646.png)
![[Diagram]](../../diagrams/3/5aa13e6a933b08413f79026eb1f9c7b1.png)
![[Diagram]](../../diagrams/51/56acc8435f30b6e235c9cfab90da796d.png)
![[Diagram]](../../diagrams/25/3599a586cb1467a76eddb697adb61aae.png)
![[Diagram]](../../diagrams/8/38dcb78dd3465c447915dcaab90e3280.png)
![[Diagram]](../../diagrams/2/c964b652e18dff81a12e12f9f8031994.png)
![[Diagram]](../../diagrams/28/e7e1e50525af85a99f0c47634fef8e18.png)
![[Diagram]](../../diagrams/24/978b1d7c40561472a3151510e612fd5f.png)
![[Diagram]](../../diagrams/45/48abe4e0c246191712044ca22e0acf4a.png)
![[Diagram]](../../diagrams/6/dd53e87e48eef49c43d3f689295fef65.png)
![[Diagram]](../../diagrams/0/91bf064febaa0e965de81505fb9609ec.png)
![[Diagram]](../../diagrams/0/6d28ee7c8ee4556a8954fc6b1323d9ca.png)
![[Diagram]](../../diagrams/25/e04bbae2203c5c88fec41705796b0efc.png)
![[Diagram]](../../diagrams/5/c1b204803607d69ed1e4b11c2576364b.png)
![[Diagram]](../../diagrams/34/bab37f6569901e3cfdda1d68f19e5fc3.png)
![[Diagram]](../../diagrams/52/d81877031a2139a49e9651a706cb6a19.png)
![[Diagram]](../../diagrams/32/d8a3f835d94a3f580061208126b2d7f7.png)
![[Diagram]](../../diagrams/3/a7153a5edae37ecf1c364bc5c36b253e.png)
![[Diagram]](../../diagrams/40/12bfa9347457c7a1ad7f22ffb55a82a8.png)
![[Diagram]](../../diagrams/30/815b4471502d45fa7082b9106ec1ecc7.png)
![[Diagram]](../../diagrams/19/800634717cd3c9cc443e74999a58f1fd.png)
![[Diagram]](../../diagrams/47/84d68eeebb1846c754089a255f824087.png)
![[Diagram]](../../diagrams/51/d6afe668322713c576854ffafc7fa47d.png)
![[Diagram]](../../diagrams/36/fa7ffad67b16b6de21629917617168c2.png)
![[Diagram]](../../diagrams/40/68f385399855a8c23c68ca1304bd3e15.png)
![[Diagram]](../../diagrams/26/da331fcd0704b798a2ac67f62cd0dbbd.png)
![[Diagram]](../../diagrams/24/c753abfb1d709e2f2febe95e1cbfbe74.png)
![[Diagram]](../../diagrams/31/e20d6ac18067cad4797eba3c7974e813.png)
![[Diagram]](../../diagrams/46/3ca836d77846bd2f8426941009c9ee62.png)
![[Diagram]](../../diagrams/45/e7b7863f6802f2a3d7cf09f7a0d2d648.png)
![[Diagram]](../../diagrams/25/3129ada9ece1022f5be6a5e152dc37d6.png)
![[Diagram]](../../diagrams/26/731db55cd3c1828471e6e3d022edb4b4.png)
![[Diagram]](../../diagrams/34/4c2755d376f9d515d6aed211ef01e8b9.png)
![[Diagram]](../../diagrams/7/1b92fc60a81b53c25b1ddcf8e9810821.png)
![[Diagram]](../../diagrams/10/aeeae921aa892f1f41a8ffb622f31c50.png)
![[Diagram]](../../diagrams/24/bf68925b3370452d927fd1e7ea2fc166.png)
![[Diagram]](../../diagrams/45/a8d3c230f34cb509dacb913131b087e5.png)
![[Diagram]](../../diagrams/34/016a8d0d892dcc85e61ec83b48b99624.png)
![[Diagram]](../../diagrams/52/1c0341a2ad4466fb1ed1c97d77bad098.png)
![[Diagram]](../../diagrams/17/c87f1c90faa520369cd0c97ab3316802.png)
![[Diagram]](../../diagrams/52/0de5e59fac91d3ccefd8738b6827f24a.png)
![[Diagram]](../../diagrams/20/412e0e5d3227c2888adbe082ffd67b6a.png)
![[Diagram]](../../diagrams/49/ec02b758c075a45d0457d727e64f591b.png)
![[Diagram]](../../diagrams/18/dc72ec68cb8e2e61325eae58d7ba9ee8.png)
![[Diagram]](../../diagrams/52/0e1f9dced6b987b6767f6272ec8edc29.png)
![[Diagram]](../../diagrams/17/793828396dd81d34b8346eeca74af8d7.png)
![[Diagram]](../../diagrams/21/af0ad0b3ba772b410c0e735dedd6ee90.png)
![[Diagram]](../../diagrams/35/aeda9c856055f80ef86a35afde5ba571.png)
![[Diagram]](../../diagrams/41/ca230a9760ebfbb365c5fcd46a50d9fd.png)
![[Diagram]](../../diagrams/28/24c18902771c74d69fc068beb9c45fd3.png)
![[Diagram]](../../diagrams/36/55692ab6f3749ab32cebdbc599555f8b.png)
![[Diagram]](../../diagrams/6/c25f1e73cdbb7b2f72699e02522d216a.png)
![[Diagram]](../../diagrams/34/353418d3f7d9929e2cdf153fc5455497.png)
![[Diagram]](../../diagrams/18/5aa6fe4cf64d8f698e7e609b723c3cd0.png)
![[Diagram]](../../diagrams/17/efdcd4146ef1d233478b5f9c33a253b5.png)
![[Diagram]](../../diagrams/50/e466c21480bd97f6e810fdccc27d2ea0.png)
![[Diagram]](../../diagrams/29/b36ca1ed000493d0aa952130ef28b0aa.png)
![[Diagram]](../../diagrams/42/084b0940cc0ada01b42c21a86286409d.png)
![[Diagram]](../../diagrams/37/542f3601b39419a6561bd03b48327059.png)
![[Diagram]](../../diagrams/45/97bdeee9a6990d835ed8eb0e6d40a114.png)
![[Diagram]](../../diagrams/19/2628e578ea7663554e08b08556f2f3a9.png)
![[Diagram]](../../diagrams/44/0583846f8c00918ef7c37c173b36f233.png)
![[Diagram]](../../diagrams/41/ae5efb447d26e05bd7d040c298559b9f.png)
![[Diagram]](../../diagrams/6/ef7fa6df199a57094eef16c74b0ff9af.png)
![[Diagram]](../../diagrams/43/689d21714d3911847ff77b3ffbc08fa6.png)
![[Diagram]](../../diagrams/47/7a516c5d980e75987a03fccb09c06031.png)
![[Diagram]](../../diagrams/11/a1f11f9d43960792e5dfc8228f22787b.png)
![[Diagram]](../../diagrams/48/1d874b192994a582ca75cb489d060afc.png)
![[Diagram]](../../diagrams/43/a95a8933e3b7eed4cfab78e4c0769ad2.png)
![[Diagram]](../../diagrams/9/4d5e46747ef0f0e7c72415b60658d975.png)
![[Diagram]](../../diagrams/45/fe4fa42a868692b9ba9d8f0efd822784.png)
![[Diagram]](../../diagrams/26/5fd0ab97ef07a16081433eb7f2042c02.png)
![[Diagram]](../../diagrams/41/908b7550fc6a794a2e44e65464d88879.png)
![[Diagram]](../../diagrams/11/2bd20007ada3ee2b4a91a05dbc13f2c0.png)
![[Diagram]](../../diagrams/16/e504c1c722018572bd0db45811cb2061.png)
![[Diagram]](../../diagrams/37/2d0cac9fe0b7afdadec0908fb912fb85.png)
![[Diagram]](../../diagrams/5/67f28a5d27935274943e84baee3d2f15.png)
![[Diagram]](../../diagrams/10/77da41eb24e74966ac6b1951b39f4f4b.png)
![[Diagram]](../../diagrams/47/725bdb27f3da60e3fbab6e9f2d6a61e2.png)
![[Diagram]](../../diagrams/49/5f9ac1d3a2080cd268719f1ecf237167.png)
![[Diagram]](../../diagrams/9/73d916f3d8d1642c8ab01385d52550b5.png)
![[Diagram]](../../diagrams/13/b269e1669dcf1a765cb5245e3cffd6fe.png)
![[Diagram]](../../diagrams/25/00b88da85575c93e659b183d5a64a21d.png)
![[Diagram]](../../diagrams/1/be8224b7fb21cefc9f276e5ff0cd3743.png)
![[Diagram]](../../diagrams/32/2299e12bb7576db15b747ba15bac8e2c.png)
![[Diagram]](../../diagrams/19/b4fdaa10d44f0a968c1014142d5f2568.png)
![[Diagram]](../../diagrams/48/38b7d793038067130df6847f39e44ba8.png)
![[Diagram]](../../diagrams/35/f25416c52ae76c5d8db72548e169f0f3.png)
![[Diagram]](../../diagrams/26/b59d4ea08173bae68675b23f993023a9.png)
![[Diagram]](../../diagrams/42/547b392ea19ae6be73d48dd9ad6a109d.png)
![[Diagram]](../../diagrams/8/d3012a5873179636359a9f8745d42099.png)
![[Diagram]](../../diagrams/41/4021cc81d317144319a0148d8a5709dd.png)
![[Diagram]](../../diagrams/14/39041deb28c2f41250055b133e5a895a.png)
![[Diagram]](../../diagrams/42/6e05c0b7d7999031e3db698d1fa4a20a.png)
![[Diagram]](../../diagrams/4/d9d6f6fd7aec5f391ab375cddfcbb7cf.png)
![[Diagram]](../../diagrams/5/6ffac47980be8d24c4dc459a0784a800.png)
![[Diagram]](../../diagrams/52/2144d3a7632d0ba5efd39abec474c500.png)
![[Diagram]](../../diagrams/45/ab1fc5770502a6365cd995a52326aae0.png)
![[Diagram]](../../diagrams/2/ccea2c3b263380eb5b3fa3462f64ee18.png)
![[Diagram]](../../diagrams/1/649cb7b154e2846df970166a15985913.png)
![[Diagram]](../../diagrams/34/bd94cc2d1e36f63d6536752d24a512d3.png)
![[Diagram]](../../diagrams/13/4fb7b36263821d8de6fb1e5b44790541.png)
![[Diagram]](../../diagrams/25/a4d8b73f3e5f5b45092905e6b2971cf3.png)
![[Diagram]](../../diagrams/44/071c4987b9e765212283b953b8c228e0.png)
![[Diagram]](../../diagrams/7/468b227f3a3cd4227e39da7f4fc00f4b.png)
![[Diagram]](../../diagrams/9/5898c23534da79154b871fd625d2e7fd.png)
![[Diagram]](../../diagrams/20/50dc3426a0d83424dd095f2af1f98be8.png)
![[Diagram]](../../diagrams/33/5551c098ab39764e4aaa1ce2c7adbbe0.png)
![[Diagram]](../../diagrams/10/7a6bd05d7800c707a114ac6d6966586b.png)
![[Diagram]](../../diagrams/2/f25eee5db148a3fdd9792e7fbd313b1f.png)
![[Diagram]](../../diagrams/27/931c06c1fdba9c29ee0e027b35f7c457.png)
![[Diagram]](../../diagrams/13/81c39da8a1ef41eec8f477dabb0c60f2.png)
![[Diagram]](../../diagrams/46/03e25032cb1378cc1c18b3d163b29c96.png)
![[Diagram]](../../diagrams/26/0c3d337909590b7cb52e3025b56d7370.png)
![[Diagram]](../../diagrams/13/10f1e59ed176063410896428b4925fdf.png)
![[Diagram]](../../diagrams/49/e777b0d03eecc0266ce15151eb568280.png)
![[Diagram]](../../diagrams/5/d95c2d1a9bac1cb9f82ef213dd76f113.png)
![[Diagram]](../../diagrams/31/0a1c08fea770d8ecad43b22f7a4d005e.png)
![[Diagram]](../../diagrams/32/2bcd90b49d9f33f5e886d81f3f51accc.png)
![[Diagram]](../../diagrams/43/0c4c6303b1192cc8ae010206130ad915.png)
![[Diagram]](../../diagrams/4/55ceb6b9f24067d6c0de90038b0358c4.png)
![[Diagram]](../../diagrams/46/f57961a7aeea3b70cbbad2fd0d138dee.png)
![[Diagram]](../../diagrams/25/1f8ddc3980b6372007779c5f5aa662d4.png)
![[Diagram]](../../diagrams/43/587b4cc14f9a2803628b054cc5af50e9.png)
![[Diagram]](../../diagrams/47/68ca05f0fce8ea227269bbbe3e495d08.png)
![[Diagram]](../../diagrams/5/48ea858b43458783382d44a3227757a9.png)
![[Diagram]](../../diagrams/9/6f66e6b79c5ac88330120f1ca9164394.png)
![[Diagram]](../../diagrams/12/7b7f668a6577927d0ad23f0dd220d82e.png)
![[Diagram]](../../diagrams/41/1b35efbd2144334152bbf69a9d42a478.png)
![[Diagram]](../../diagrams/41/f2a557cf56350e1f33d64e46cf62b00b.png)
![[Diagram]](../../diagrams/3/c9ef86f2da3e9eecfe7c5a811721e8fc.png)
![[Diagram]](../../diagrams/10/a75a82f68c13c66b2f28a80ba74e8fd8.png)
![[Diagram]](../../diagrams/36/06b627544f7e26596e1ff3247c6fd18f.png)
![[Diagram]](../../diagrams/15/ae68d70f4dc3bccece456a49bbd9f97f.png)
![[Diagram]](../../diagrams/26/194027df4a37c59747aa2af34ceca1fa.png)
![[Diagram]](../../diagrams/21/9238595648cc988da4e5b11f80b9dda5.png)
![[Diagram]](../../diagrams/46/ddefbde91308e8d137e0698091899e23.png)
![[Diagram]](../../diagrams/4/be9c8fad2ff94fc457a3092fbbe7392b.png)
![[Diagram]](../../diagrams/12/1ccf12aab1b2fa403a8779745277e4b8.png)
![[Diagram]](../../diagrams/21/43037a1cf21e47cd3fe2d9beb0991d58.png)
![[Diagram]](../../diagrams/51/0c56b8d89b9387486c5c82733c97efd6.png)
![[Diagram]](../../diagrams/1/98074b75de3c4a0bd9a232c830bfe6a4.png)
![[Diagram]](../../diagrams/52/876cd5f600a4a6c9a49cc4e128fd3309.png)
![[Diagram]](../../diagrams/25/15f473c7b928460b04176ff66a1e5da8.png)
![[Diagram]](../../diagrams/13/04709b96610d60fcc182e59163deaab3.png)
![[Diagram]](../../diagrams/38/90284540ab5ddc777b55d9fa9a613ac2.png)
![[Diagram]](../../diagrams/48/fb12894ee6c173f188cd9c6e44f8315a.png)
![[Diagram]](../../diagrams/32/d8b17aa58e48fed1bca54a6562ec4d0c.png)
![[Diagram]](../../diagrams/16/2192ca5adef3309b5090d2785df9312b.png)
![[Diagram]](../../diagrams/26/7b236f87ffcf38be62e1d081d3e117f1.png)
![[Diagram]](../../diagrams/48/4acb610a8b11df7801fd37f6c8f5bd3e.png)
![[Diagram]](../../diagrams/32/8f6a61d1a26904ae1c1c40254e7aea0f.png)
![[Diagram]](../../diagrams/19/493f5279f97762382c9bd7eab22dbc51.png)
![[Diagram]](../../diagrams/26/b64efcae1866f2e52656099cceeddc85.png)
![[Diagram]](../../diagrams/41/013a29ef8e5c4839980a493d3802650a.png)
![[Diagram]](../../diagrams/23/1e6acf1aafbde4ee6bb3fa980ccdda46.png)
![[Diagram]](../../diagrams/27/22f9042b5d330376aa68ace021973172.png)
![[Diagram]](../../diagrams/2/bfea2a3add7a7aaf2f6caedbb53e5d7e.png)
![[Diagram]](../../diagrams/44/b09f5b39bdbb8577cf7f4e21e7c552c8.png)
![[Diagram]](../../diagrams/12/d27956df578f0917750c7f6243a3f046.png)
![[Diagram]](../../diagrams/35/7c0159ad71f0ca44305d58fb16a30745.png)
![[Diagram]](../../diagrams/16/aae6dda3c3d3ab3bf90142c554c34f95.png)
![[Diagram]](../../diagrams/27/5075572a8ee244825c29a85a8715541a.png)
![[Diagram]](../../diagrams/23/6c38bbea2f9059a5afc2e2547beadfa0.png)
![[Diagram]](../../diagrams/51/c86384de94df9536fc7e6c774f850140.png)
![[Diagram]](../../diagrams/13/4ebf7e4298567ce4b8c242825f915d9a.png)
![[Diagram]](../../diagrams/9/6ef4a896c8a1424d1becf451672281e6.png)
![[Diagram]](../../diagrams/39/70a46c5d2870786d562a126603e75a50.png)
![[Diagram]](../../diagrams/29/a578bbf6c4a4a49ade5b8ac4b6f65bc8.png)
![[Diagram]](../../diagrams/18/d173e11af2a7cd5bcfc7ce72d7666827.png)


![[Diagram]](../../diagrams/38/e3fcf1f2e9d8eb3a9e44184cb70a2f17.png)

![[ext]](http://www.gobond.nl/images/jwgokaart1a.jpg) http://www.gobond.nl/images/jwgokaart1a.jpg
http://www.gobond.nl/images/jwgokaart1a.jpg![[Diagram]](../../diagrams/35/33406a86039fe8b6e126f4b7c0dced14.png)
![[Diagram]](../../diagrams/39/ef9de96c48e1bfeff52274d97d1b2f15.png)
![[Diagram]](../../diagrams/21/86352b3f96b2fa30a0902be40169ec1c.png)
![[Diagram]](../../diagrams/22/626db500e1ed1962006406acf3f2bfb0.png)
![[Diagram]](../../diagrams/33/65c1d1b836992cde47226086e628ea37.png)
![[Diagram]](../../diagrams/30/e6f1516af91dc5905fbef93e2d1385b8.png)
![[Diagram]](../../diagrams/19/3d6f1cbff95fa0b6aac1088b0b9da883.png)
![[Diagram]](../../diagrams/46/6b883eaad3ed48561756b80fda39a533.png)
![[Diagram]](../../diagrams/2/ec05062acf466de3f81d3b9fe61f6158.png)
![[Diagram]](../../diagrams/21/7a9ef96b569d3869062e03fb99f6f85d.png)
![[Diagram]](../../diagrams/23/6713b2f54a13980eecff010bec97c5a7.png)
![[Diagram]](../../diagrams/23/6871b8419f6c3fd644be6e745a01edf0.png)
![[Diagram]](../../diagrams/28/8cc6a6c73599d2515c4096a676558fb2.png)
![[Diagram]](../../diagrams/6/53bc0a0933237b238cc494dda9b93586.png)
![[Diagram]](../../diagrams/43/2f4e13d43950e113c980c994e8ebf541.png)
![[Diagram]](../../diagrams/40/bbcf0a11a802b10f6aa8da4a2f0cf4d7.png)
![[Diagram]](../../diagrams/9/11ac86abcc5822f7bf8ebfb585b96056.png)
![[Diagram]](../../diagrams/42/aa850951506c6798063f59f2b66159fa.png)
![[Diagram]](../../diagrams/4/55d7e0a8d9c2a281a907e001e345a8ea.png)
![[Diagram]](../../diagrams/9/23a1d827642805432d353b8c18fd7269.png)
![[Diagram]](../../diagrams/51/6a6e8ae5445f5e7aab0b34fb140c6088.png)
![[Diagram]](../../diagrams/41/d1e1c0e29d6d397f068880156ba304f1.png)
![[Diagram]](../../diagrams/17/0dd4a5e94c302c2698bd571eae429131.png)
![[Diagram]](../../diagrams/21/b7f0078301698acf008ca50f5f811c09.png)
![[Diagram]](../../diagrams/36/a3c23a23f778f0726c93a364e5ec2ae6.png)
![[Diagram]](../../diagrams/8/a63785f88bc3a5b1f00ada9990ef3f50.png)
![[Diagram]](../../diagrams/15/6c96ed5749ed7cf2a687e7094800459d.png)
![[Diagram]](../../diagrams/47/397637c8e7787525534a01b209e37d70.png)
![[Diagram]](../../diagrams/44/97fe2cfd774e4c6ce40349b09527c8bb.png)
![[Diagram]](../../diagrams/2/e1d29316193830f0a87a065742bc4354.png)
![[Diagram]](../../diagrams/50/d8046c9a86a2a3161974c291f4d44822.png)
![[Diagram]](../../diagrams/25/11ddbb577d3f667afe77c47ee2fab30c.png)
![[Diagram]](../../diagrams/44/a0da8c1dd4849ae1e8e0ade6c5e7d37a.png)
![[Diagram]](../../diagrams/34/ae326ff5b18f2b716da55c8eddb43963.png)
![[Diagram]](../../diagrams/13/91c20063fa289c1da2fd7a7cc34c07ef.png)
![[Diagram]](../../diagrams/44/c7ec938adfff488c76c93febae3fbaa2.png)
![[Diagram]](../../diagrams/16/a985b5ba143da243105834388814edd8.png)
![[Diagram]](../../diagrams/47/cf57b769ece000559aa505e8aebaeb9b.png)
![[Diagram]](../../diagrams/30/41981dbb70c2eeadf42fbe9c7285df9e.png)
![[Diagram]](../../diagrams/39/23fb6de26ddfbc5f2a558ee31fc1ceef.png)
![[Diagram]](../../diagrams/42/bebf488317d61545c47ca94d04f48822.png)
![[Diagram]](../../diagrams/45/a7e2b056495f2b1fe2366e49ae7c6e03.png)
![[Diagram]](../../diagrams/6/0fc238f0bf25a3e3a39bcd99d3e83b88.png)

![[Diagram]](../../diagrams/19/49c5b3e155c726db72562f000e4beda8.png)
![[Diagram]](../../diagrams/38/e8e70e73a18c2f6b335cb9c83533eac6.png)
![[Diagram]](../../diagrams/1/4086ebaa1b298d431066b0733a7da1ae.png)
![[Diagram]](../../diagrams/34/7ccd46f5f9a86467b5a5a2ec4852264e.png)
![[Diagram]](../../diagrams/1/72972429efffd4ccacbba4885f868a00.png)
![[Diagram]](../../diagrams/31/a26cb886d6e1e3e146215518169a507f.png)
![[Diagram]](../../diagrams/7/65b673e806db74daa3996ca874ef06b6.png)
![[Diagram]](../../diagrams/30/6b60a383fe5cc985504038a3ab36bd80.png)
![[Diagram]](../../diagrams/12/c556ea489d1ba62c48a546a0939a3498.png)
![[Diagram]](../../diagrams/46/84c93ab755f9fef82f770bbc8c22b537.png)
![[Diagram]](../../diagrams/17/6f9147ca4fa3f1edaec24af708c01218.png)
![[Diagram]](../../diagrams/29/222d86a694e686bc4256954d393441f9.png)
![[Diagram]](../../diagrams/23/740fe92ff4417d31a43bc0b3fe438e75.png)
![[Diagram]](../../diagrams/24/96bd5ecae2f7ed6b2ebb4da42aba56ca.png)
![[Diagram]](../../diagrams/16/8755351d8745a0a19baa179e03f62b6d.png)
![[Diagram]](../../diagrams/39/ff862964732706a3e348846ca38dd84a.png)
![[Diagram]](../../diagrams/26/1f214dd09c7bfa0c8e41ebf6da325459.png)
![[Diagram]](../../diagrams/10/4f7994990e3419b5e10fc5a8395696cc.png)
![[Diagram]](../../diagrams/15/bd5f8e812c39739bec410ba0ee45b24d.png)
![[Diagram]](../../diagrams/42/e4a2551c41280ac9e9a63987c9052105.png)
![[Diagram]](../../diagrams/32/92feac074ec41e921deaaa86cb4ca696.png)
![[Diagram]](../../diagrams/6/471ff25c58e30fed9e12c97c40b9c12d.png)
![[Diagram]](../../diagrams/50/1dd3323ec6c2fcb0bc4e8631a943ff96.png)
![[Diagram]](../../diagrams/43/46942c64aa5419c40b922a93f9e6ab43.png)
![[Diagram]](../../diagrams/35/89253886a0df689a8b879b40be8be931.png)
![[Diagram]](../../diagrams/52/377e1a3619db938eb4eec336425e2c2d.png)
![[Diagram]](../../diagrams/6/7bf9c02a586af664a8131100c2f5c86e.png)
![[Diagram]](../../diagrams/36/e0a4d372083c39c53a8da735d085176d.png)
![[Diagram]](../../diagrams/30/44101b29337972f5e327c5138a937de9.png)
![[Diagram]](../../diagrams/26/e2a17453a41428d55544db16ce92aa79.png)
![[Diagram]](../../diagrams/28/a178f25b6d1b4943f49c5a24e059c03e.png)
![[Diagram]](../../diagrams/39/46d817380a6dddcf72013aed9a7ba91d.png)
![[Diagram]](../../diagrams/32/5aaa557b530ba8680a0b97a086f09eb8.png)
![[Diagram]](../../diagrams/7/a4b198bdd7a6845c37b358f82a4ee76a.png)
![[Diagram]](../../diagrams/9/5e98895673c17a8068c778ac925fa15c.png)
![[Diagram]](../../diagrams/34/228427ee255b858e5676908a9d9e10e6.png)


![[Diagram]](../../diagrams/20/dcb0f028c7d98a2712b5783b99ed17b6.png)
![[Diagram]](../../diagrams/2/0c5b5c291a164d0401e6f38dfc9ebc3c.png)
![[Diagram]](../../diagrams/47/d4a41f649e6e8bd52da7d2977f01c3ea.png)
![[Diagram]](../../diagrams/8/461e565ec4744c0ce9ca5a67c5f91424.png)
![[Diagram]](../../diagrams/23/d0100c63df94845e4c51a5519507c195.png)
![[Diagram]](../../diagrams/6/eb005095cdc04e5f7efb6dc7e0c0303d.png)
![[Diagram]](../../diagrams/25/8b4f3f203e76b4f9aef3b19aba9e8865.png)
![[Diagram]](../../diagrams/30/8d970bf990a62d46110e0a1109bb157e.png)
![[Diagram]](../../diagrams/18/68c174b0f962647b3873bf2ff20286d6.png)
![[Diagram]](../../diagrams/19/48ee6ccc65e1289788b3ac26ca9bb4e5.png)
![[Diagram]](../../diagrams/50/135983c8a79e7617c0f985d3a7b4424f.png)
![[Diagram]](../../diagrams/23/897e71be4341b308b5ca6935235370d4.png)
![[Diagram]](../../diagrams/19/3825508ab254f6041c9a97b1657ad408.png)
![[Diagram]](../../diagrams/46/8b4ff49700e131701d861d8c7d61216e.png)
![[Diagram]](../../diagrams/41/ed820992efcad71a37a46905e5c8eab9.png)
![[Diagram]](../../diagrams/6/a43476bec83562a84204bab557559be3.png)
![[Diagram]](../../diagrams/32/e876d98085d816337ff019c604d5a84e.png)
![[Diagram]](../../diagrams/26/26c0a88aaeaa0a95d759ccd67764aef2.png)
![[Diagram]](../../diagrams/11/19fe6c1f44ec203372cbd464694a7aec.png)
![[Diagram]](../../diagrams/11/d15b2640e61760b8bf48da55b31215ee.png)
![[Diagram]](../../diagrams/6/6349e8416651688ddd95c53093cb33dc.png)
![[Diagram]](../../diagrams/37/90e94d4360ae78aff16503eafe1c493c.png)
![[Diagram]](../../diagrams/15/7f71a39ac0e40c328a1967b19886464b.png)


![[Diagram]](../../diagrams/15/fdd34402558874230d488f51b8f9fdbb.png)
![[Diagram]](../../diagrams/34/058e8f76b59f2bb89c00fdd61e28cf57.png)
![[Diagram]](../../diagrams/6/cf60716a36c2b7e0071d777f1c347a0f.png)
![[Diagram]](../../diagrams/46/293cb7351b39f0b108a5fa88ccf6544b.png)
![[Diagram]](../../diagrams/37/074918c4e46caf26be2f96443c4c93e4.png)
![[Diagram]](../../diagrams/21/c43c846465105e03d3e1daf03bdd3634.png)
![[Diagram]](../../diagrams/28/3baf0a9a041a227ce2f0c36fbbd858cc.png)
![[Diagram]](../../diagrams/35/711a47b2192163bcb5cd42c354140675.png)
![[Diagram]](../../diagrams/16/d71bc27e6e36374fbb18b7c1c740b881.png)
![[Diagram]](../../diagrams/27/07751a757701168e51bd7c55e8c07ea4.png)
![[Diagram]](../../diagrams/19/7e907d1fc0ab67e98bb9d59286c1d2f4.png)

![[Diagram]](../../diagrams/21/82de2ca4163a6990c57e96c7c636284d.png)
![[Diagram]](../../diagrams/8/90796a92f5b00911e0f2ff3970d3b4b1.png)
![[Diagram]](../../diagrams/35/0e58e0fc3750664af1c1d75527fcc199.png)
![[Diagram]](../../diagrams/43/975cca90fddf8070e1a02cca5b0adb50.png)
![[Diagram]](../../diagrams/5/3dd47e79d3d9455907cfc9c982909fe2.png)
![[Diagram]](../../diagrams/46/1398ff6c6bc3e976f7ae93ec305f2812.png)
![[Diagram]](../../diagrams/43/f6857f397207d89dfafe1369b13a051c.png)
![[Diagram]](../../diagrams/28/8514e5f0ad3dcbad3a9db4776f8b2e2c.png)
![[Diagram]](../../diagrams/26/f56245ff4eec4d56b685e718f0ea136e.png)
![[Diagram]](../../diagrams/34/1a3530e4b2b7f81fbc08edb29bb44ec6.png)
![[Diagram]](../../diagrams/42/8576bbb6874c30b6e4ce97aac07e265e.png)
![[Diagram]](../../diagrams/13/7b1fcd7c75009bcf68431a0514321ad0.png)
![[Diagram]](../../diagrams/20/f5c7b8e00d3044211e9392186214af9e.png)
![[Diagram]](../../diagrams/3/91b86de5b15cec45568544a068419cd2.png)


![[Diagram]](../../diagrams/28/c2e7ea5e52f7fb72ccfac18dd1ab716e.png)
![[Diagram]](../../diagrams/14/62ab270ec835e0bab12474e181837a70.png)
![[Diagram]](../../diagrams/40/c24a7d09579e3bdba6f199830295e755.png)
![[Diagram]](../../diagrams/41/26e155c495d2a870db56ded654858c99.png)
![[Diagram]](../../diagrams/43/9053d76840588143e02608c24bf5dd22.png)
![[Diagram]](../../diagrams/19/e96a6066ae200e504b529f3f2a06246b.png)
![[Diagram]](../../diagrams/52/d1378a94318019ae395cf258d16f87a4.png)
![[Diagram]](../../diagrams/37/2e2bcc6304d61d259026e5ae87079732.png)
![[Diagram]](../../diagrams/0/d70c2a7172a26375692dc560278fc12e.png)
![[Diagram]](../../diagrams/52/a0237e16495ed31f5abcd46885b07c25.png)
![[Diagram]](../../diagrams/1/3391aeafa62cd3b4705188e4769e749b.png)
![[Diagram]](../../diagrams/39/034a66dbb58e4bb86579382ce772fd26.png)
![[Diagram]](../../diagrams/39/b2974995407c9a9abb12ac78f01b62d7.png)
![[Diagram]](../../diagrams/5/6e6836ab0faf0a317dfd632afae3238c.png)
![[Diagram]](../../diagrams/37/7d72cb2671faf50cc1cddf2719b4fe42.png)
![[Diagram]](../../diagrams/13/e08ce9da823d46a0589f1ee0c19f8a83.png)
![[Diagram]](../../diagrams/40/2ab1bcba034c1b0ff20f037aa1240839.png)
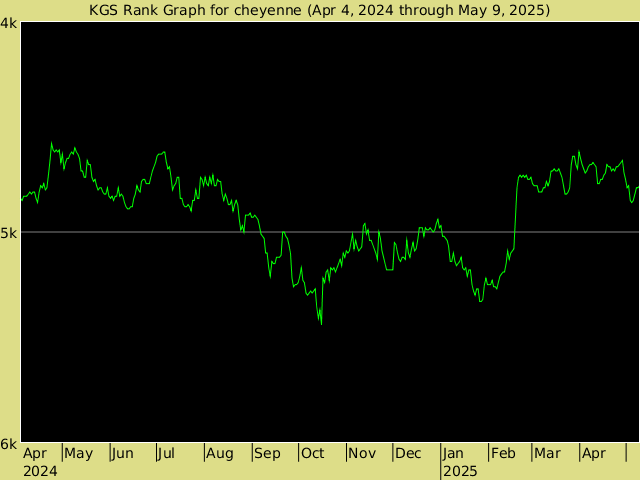


![[Diagram]](../../diagrams/6/ad2a831a5c55f923310c8982a3de3d91.png)

![[Diagram]](../../diagrams/5/01a7c16caa2e41c148d7e806a0281318.png)
![[Diagram]](../../diagrams/39/a9f3ea45772f7ffb08d4aebe5fad5f45.png)
![[Diagram]](../../diagrams/45/f2ca35eb04f17671bfb7ccffdbbd091a.png)
![[Diagram]](../../diagrams/15/2f2b38cb5a33cce50a21f6fd2a189985.png)
![[Diagram]](../../diagrams/12/5b423e7458df9eb6df9fb93d78a15701.png)
![[Diagram]](../../diagrams/52/61704a1c2d356cb962a0a7f42c261a3c.png)
![[ext]](http://www.go361.com/propic/20031018144325W07.jpg) http://www.go361.com/propic/20031018144325W07.jpg
http://www.go361.com/propic/20031018144325W07.jpg![[Diagram]](../../diagrams/22/a6f2e094cad0919bdadcb8521ab3baa9.png)
![[Diagram]](../../diagrams/47/d07c0a2a45d673648443e53c53be7a5c.png)
![[Diagram]](../../diagrams/29/bb7335f118e41fdfe1835536c489ee13.png)
![[Diagram]](../../diagrams/38/e9c9c4e6228811a4f9de7b64507f4a01.png)
![[Diagram]](../../diagrams/1/03bbb3c1ee25e9b95a4c8f9a0c4992bb.png)


![[Diagram]](../../diagrams/39/7f1faa656f1c7b052fae50a8058e86d3.png)
![[Diagram]](../../diagrams/40/77312030acd130eadd9c74059cf36210.png)
![[Diagram]](../../diagrams/48/0731f9c7df7b3c4c3d64ebde96f5d0d1.png)
![[Diagram]](../../diagrams/40/18d38d4adffaa31048d7d28b1dfc50f2.png)
![[Diagram]](../../diagrams/20/cd5b1669745f80197661e28548e075e3.png)
![[Diagram]](../../diagrams/5/89deea8b75b8c137a374b4e8625875b6.png)
![[Diagram]](../../diagrams/8/8decdd2ced4beac4dde1b9c0afd8164c.png)
![[Diagram]](../../diagrams/13/0eb1ac6b426a7c44f7f8884b4f64a551.png)
![[Diagram]](../../diagrams/15/3104f71bcc325db8824192763259fbe9.png)
![[Diagram]](../../diagrams/16/9521c01eb577956738177335a8fc749f.png)
![[Diagram]](../../diagrams/42/ffdbffa54d886287954ac105f8111a8d.png)
![[Diagram]](../../diagrams/28/46ceebeb45266a8a1f79e555f16230d1.png)
![[Diagram]](../../diagrams/25/a580092ce21c266d4bc70408b9661c4f.png)
![[Diagram]](../../diagrams/37/961b617fae7d60a20882093eec27afba.png)
![[Diagram]](../../diagrams/16/ce9be491bc2bcf0ebfab04af74f385b2.png)
![[Diagram]](../../diagrams/0/5b7ba0ccc18f7b5d5d3e6ea7fe790892.png)
![[Diagram]](../../diagrams/47/36a2c2a6dcdb0f69be06973a0b78fbee.png)
![[Diagram]](../../diagrams/6/dbb470022984785bbd5d84f0a39f4705.png)
![[Diagram]](../../diagrams/10/943ab8c42e543380b9cb02710412222b.png)
![[Diagram]](../../diagrams/0/f8603b620ff2fff6defe595b796c3c4b.png)
![[Diagram]](../../diagrams/29/0ff837a5d91a5e9b844bb3f42c4693ad.png)
![[Diagram]](../../diagrams/52/14f9328b0c2ced7b221cbf36e3538319.png)
![[Diagram]](../../diagrams/29/b68da0ecc8ae7b1c9dd83bbb073f72bb.png)
![[Diagram]](../../diagrams/41/798e8bbaef14b44d5f92af411bbea5d9.png)
![[Diagram]](../../diagrams/23/acd0575b1b17681f490aa8df4a6230ec.png)
![[Diagram]](../../diagrams/44/47649476f0ace5dae78c9da3f77b453d.png)
![[Diagram]](../../diagrams/33/944f3c50c3d16ff56c7146f161efd56d.png)
![[Diagram]](../../diagrams/18/3b04931f7e13c2622885f156f5dcedbd.png)
![[Diagram]](../../diagrams/11/e2c1e08c1103cc5937b3ece9e0918f0e.png)

![[Diagram]](../../diagrams/29/ed501f0fa0b072c0abe79cd9edf959d9.png)


![[Diagram]](../../diagrams/13/8a777fce66fc2dc4c1d9a1a8d188feae.png)
![[Diagram]](../../diagrams/41/64be4eecf386147094749a3f080a1192.png)
![[Diagram]](../../diagrams/12/52a6ce5acade17547aca65ef6445713e.png)
![[Diagram]](../../diagrams/26/24b96ed25564fcb5d04d1d12c1b32202.png)
![[Diagram]](../../diagrams/2/4f6e9b9fd3e47a1ae99f5e1a9463ac7d.png)
![[Diagram]](../../diagrams/35/5d170a88fd8f27bc698606f7f314d8c8.png)
![[Diagram]](../../diagrams/0/2a74a7de1d5010a0d40e3c6bfa89c7c6.png)
![[Diagram]](../../diagrams/29/6d2821b2987738bd5f88ce4c8d52d5dc.png)
![[Diagram]](../../diagrams/44/5b97d88076709443a544a5a227f54560.png)
![[Diagram]](../../diagrams/29/cdc5e51f1faee8720f98ec63d4b9a7c4.png)
![[Diagram]](../../diagrams/7/a83e0d4da292d19bf31d21e61050b2d2.png)
![[Diagram]](../../diagrams/16/ee16891ce6f08a7641c0d55fcaa50845.png)
![[Diagram]](../../diagrams/38/3ac9abad29bc7aee3dbf4964d4b16eae.png)
![[Diagram]](../../diagrams/16/33a1df12e18c2657b6bec60e791a98f1.png)
![[Diagram]](../../diagrams/13/cca91c9fedae6537417fe3e3adfcdee7.png)
![[Diagram]](../../diagrams/13/785105ba357ec06fc7309ad526a853c8.png)

![[Diagram]](../../diagrams/3/3b5a53fdd2db012e895b97e424bc8237.png)
![[Diagram]](../../diagrams/21/ab5b052a25a0af088aeb8dab9c5473dc.png)
![[Diagram]](../../diagrams/25/081393891fff2f4d844036afbda86c60.png)
![[Diagram]](../../diagrams/49/1baad5240ebcbb89268930914b1b792a.png)
![[Diagram]](../../diagrams/48/17c0c683a308d84e3264339b2f081601.png)
![[Diagram]](../../diagrams/2/c83641926aebee34e79c5ba98fa00a4a.png)
![[Diagram]](../../diagrams/8/6a4dc2b5104075b49ac1e17a1b5d66a0.png)
![[Diagram]](../../diagrams/23/60e60be4b0f8bbef9eebe16adc8799fe.png)
![[Diagram]](../../diagrams/27/64e44bd64884aba4fc90990179a77154.png)
![[Diagram]](../../diagrams/21/96dbada0069e41b1973602dc285500d2.png)
![[Diagram]](../../diagrams/49/81042d9121956becb17017462843982c.png)
![[Diagram]](../../diagrams/16/b59bb5d74e830fd3560bc7f6a8ffd705.png)
![[Diagram]](../../diagrams/10/fb8d610755131c2c3c7667aced67896c.png)
![[Diagram]](../../diagrams/14/6eb4cd0f53059b4d06aad94a6c935ac0.png)
![[Diagram]](../../diagrams/17/07acd076081576edfdfea002320c1269.png)
![[Diagram]](../../diagrams/10/09d3e373df118d84ba5b75668a1792ae.png)
![[Diagram]](../../diagrams/14/7b52dfce9d6bd1437fff2898c6db8b8f.png)
![[Diagram]](../../diagrams/18/4f76a6577f8802160f4c0d8b6293f415.png)
![[Diagram]](../../diagrams/19/bc774758b5a5a042c63e733af0c5c81a.png)
![[Diagram]](../../diagrams/13/e099b82c5f8ea8668f28463e0b622c99.png)
![[Diagram]](../../diagrams/29/3209b48667eacd7270c40a8cc2965be7.png)
![[Diagram]](../../diagrams/42/bff8bda7029ba693b7b695311fd172f8.png)
![[Diagram]](../../diagrams/19/d6787eaac359cb5f6a57dfd730f5e24b.png)
![[Diagram]](../../diagrams/11/4229b78e45829678759ec0752715680d.png)
![[Diagram]](../../diagrams/17/8b0c56964058e64124bc9f0aee15244a.png)
![[Diagram]](../../diagrams/23/b6a2861ce844900a0884b2022c84e426.png)
![[Diagram]](../../diagrams/43/ae0fc7671f50efa0890930572c944dbc.png)
![[Diagram]](../../diagrams/22/5e14a40eeaa46200bdf19bceb918f55f.png)
![[Diagram]](../../diagrams/7/6e72193002f88e9c9c1494557b11ddf0.png)
![[Diagram]](../../diagrams/26/fc953d62a9933d1439200c8f2ef813d9.png)
![[Diagram]](../../diagrams/12/3ec15240fd17660953a20a42c772a43f.png)
![[Diagram]](../../diagrams/9/652beb4649ce9e6bc67f24ca05dea3fa.png)
![[Diagram]](../../diagrams/43/930c5176f2b53be61d5c6b3665f7b59a.png)


![[Diagram]](../../diagrams/30/811bb31abb434aa271f3985547ab7f32.png)
![[Diagram]](../../diagrams/12/550191ab1e59cead0c1ede0484393d9b.png)
![[Diagram]](../../diagrams/14/40afcf4cb3810d54db2461ac8134b51d.png)
![[Diagram]](../../diagrams/7/3d2ae5b3152f4b2c7f2698a4dafb2039.png)
![[Diagram]](../../diagrams/50/fbe054ba4c70f445517b9b635656972c.png)
![[Diagram]](../../diagrams/6/a018d892aa8903b3a19da11926125a06.png)
![[Diagram]](../../diagrams/36/8c1096fccf706f4c44058beb5d58e3c5.png)
![[Diagram]](../../diagrams/22/69aa156ed1fa514336660648d599687e.png)
![[Diagram]](../../diagrams/6/64d770902f51ac53cf341eb8b2f328e2.png)
![[Diagram]](../../diagrams/20/c17685d16f1a760cca3acc2198c5e73e.png)
![[Diagram]](../../diagrams/37/c639d7da10e7e12a4edcb67cf7dceaac.png)
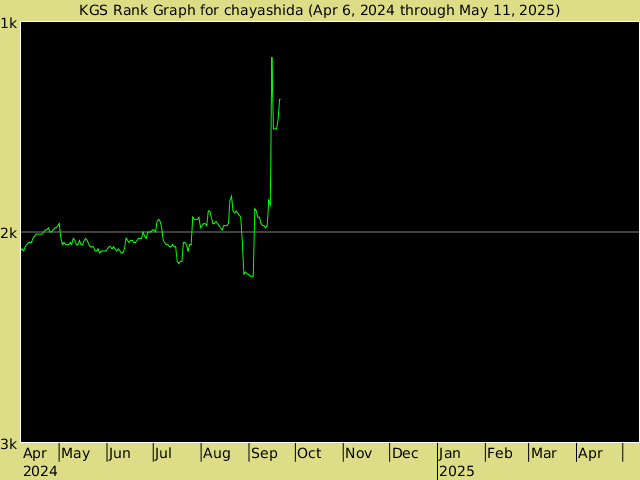
![[Diagram]](../../diagrams/28/2fd7652bdca37b8f20e21b2833f965c2.png)
![[Diagram]](../../diagrams/10/7de09643ebff3cd2b7155e2353613ccd.png)
![[Diagram]](../../diagrams/35/a0045b122f0801e3564c181b5bea01c9.png)
![[Diagram]](../../diagrams/16/12cf3a756b7934210cf417f681b50e2b.png)
![[Diagram]](../../diagrams/50/b441bc65bd17302c7a75ec5b161964d4.png)

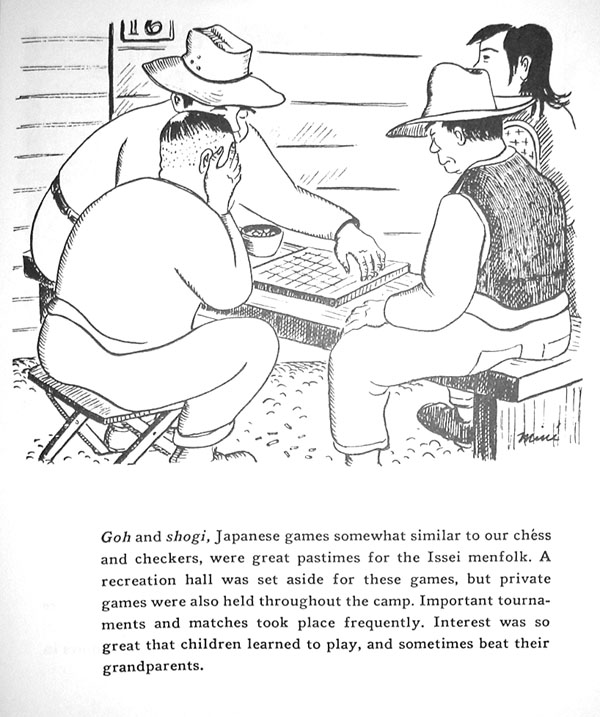
![[Diagram]](../../diagrams/24/41233582943c91262c2a0ad842f147fc.png)
![[Diagram]](../../diagrams/22/779d61610f35204b04bcc83576e3a35a.png)
![[Diagram]](../../diagrams/21/888f9190791b874cb1df7645a93bc35b.png)
![[Diagram]](../../diagrams/15/cd27606d036a051bc57cde5adb1b7536.png)
![[Diagram]](../../diagrams/13/18eaf206683bfbb57f548c2da4b7ff3e.png)
![[Diagram]](../../diagrams/8/289bf7b344f2a6ec9319bd39eb4daa9f.png)
![[Diagram]](../../diagrams/48/530015fa74a277c92b2b1df3a99d4148.png)
![[Diagram]](../../diagrams/21/9cd8a06c5b2d55c843c6f2611e1ce19e.png)
![[Diagram]](../../diagrams/15/65fdbaa7660415e841d6d316118e4f97.png)
![[Diagram]](../../diagrams/36/6b7e884237d8b8c911f5b60d72a3188a.png)
![[Diagram]](../../diagrams/5/2b33ba9cff25cb7cd7166a5d35389fea.png)
![[Diagram]](../../diagrams/43/7bf6ec42c47620e21cee45f712388bf0.png)
![[Diagram]](../../diagrams/44/1d7fd29215a94d3c09213f7cd1a72e9b.png)
![[Diagram]](../../diagrams/18/82b3727947d871143717b5781771bfc4.png)
![[Diagram]](../../diagrams/44/c728fb37b3847d4581f5c019679549a1.png)
![[Diagram]](../../diagrams/28/599b531294fb1a546a3c163e183f0882.png)
![[Diagram]](../../diagrams/5/0f164dbd0faa590caa487488c0cd7bd4.png)
![[Diagram]](../../diagrams/19/b5562c438ce67e6e59279867ea5a2cb4.png)
![[Diagram]](../../diagrams/4/252a14815d0759ecfb193bdbc3a840b6.png)
 , bigger pictures here:
 ![[ext]](http://www.garde.de/bilder/gross/schachuhr_mechanic_1-1_g.jpg) http://www.garde.de/bilder/gross/schachuhr_mechanic_1-1_g.jpg
http://www.garde.de/bilder/gross/schachuhr_mechanic_1-1_g.jpg![[ext]](http://www.mastersgames.com/images/board/garde-clock.jpg) http://www.mastersgames.com/images/board/garde-clock.jpg
http://www.mastersgames.com/images/board/garde-clock.jpg![[ext]](http://www.chessforum.com/images/itms/663S.jpg) http://www.chessforum.com/images/itms/663S.jpg
http://www.chessforum.com/images/itms/663S.jpg

![[ext]](http://www.dgtprojects.com/images/klokken_faded.jpg) http://www.dgtprojects.com/images/klokken_faded.jpg
http://www.dgtprojects.com/images/klokken_faded.jpg![[ext]](http://www.avekont.cz/shop/hodiny04.jpg) http://www.avekont.cz/shop/hodiny04.jpg
http://www.avekont.cz/shop/hodiny04.jpg
![[Diagram]](../../diagrams/1/75177d45c49498e7ff1701448016933b.png)
![[Diagram]](../../diagrams/13/ea3bd7618cb41910100766843ac58dad.png)
![[Diagram]](../../diagrams/43/d7252b57dcc6a3492a3559ef42ee4922.png)
![[Diagram]](../../diagrams/10/e3852e6fb785811bedfef43cbf5f4fdc.png)
![[Diagram]](../../diagrams/36/9e6ef348b6a33c2a1c4d5722e27df8dd.png)
![[Diagram]](../../diagrams/33/981e7597a79860448c831b55bc30d218.png)
![[Diagram]](../../diagrams/2/720a74c132bcee42f00d53310487385e.png)
![[Diagram]](../../diagrams/20/c7bc738b8a30ae363b49edc3930f0b69.png)
![[Diagram]](../../diagrams/31/4a667aa229659588b14e50a075e263ef.png)
![[Diagram]](../../diagrams/21/39dc9815963f56eea4c08aff8db65c92.png)
![[Diagram]](../../diagrams/6/a993614c7e433bc99d09e087f8b0811a.png)
![[Diagram]](../../diagrams/22/c877a55b4c707385e6c561890da2d91e.png)
![[Diagram]](../../diagrams/48/249a3ee9eb076a99369729237b63be83.png)
![[ext]](http://www.nihonkiin.or.jp/img/img-e/tokyo-office.gif) http://www.nihonkiin.or.jp/img/img-e/tokyo-office.gif
http://www.nihonkiin.or.jp/img/img-e/tokyo-office.gif![[ext]](http://cf.geocities.com/ilanpi/KF.JPG) http://cf.geocities.com/ilanpi/KF.JPG
http://cf.geocities.com/ilanpi/KF.JPG![[Diagram]](../../diagrams/0/65902fb20edbea912bb2b4563dbc54ef.png)
![[Diagram]](../../diagrams/7/54d030669b880c60699a9b70c97b3f24.png)
![[Diagram]](../../diagrams/49/b2c3b2a3aa2efde684237e1f193c9df5.png)
![[Diagram]](../../diagrams/29/dec1fb089e73f242d68470def8fde0a0.png)
![[Diagram]](../../diagrams/51/fa79f84822b59b7fe85887bc38af188e.png)
![[Diagram]](../../diagrams/14/88949e75e3e5c49d51f1bd8e1483489d.png)
![[Diagram]](../../diagrams/3/149c2c6ed6df3617cb91f6906df10dd7.png)
![[Diagram]](../../diagrams/5/843cd7e3ce9b08a4ced7f3f75fbab12d.png)
![[Diagram]](../../diagrams/34/0dd870b2b5cc85318d9c4f91a3c3306d.png)
![[Diagram]](../../diagrams/32/0a88d6ece2152fd218bb10e6a30cf5e2.png)
![[Diagram]](../../diagrams/23/cea94ef95d7957e28c13bb3b2a5034e2.png)
![[Diagram]](../../diagrams/23/a82e2da1174bbed65bc81a18dcbf0eef.png)
![[Diagram]](../../diagrams/18/daa27fe41cf54ababc4e873ed4e037b6.png)
![[Diagram]](../../diagrams/45/762fe0644306cd9562deaa5852602b4e.png)
![[Diagram]](../../diagrams/37/ec1be48d1bfa85662ab6e2cedbf1d615.png)
![[Diagram]](../../diagrams/2/432380f8609ef4834b142f1c50f8f625.png)
![[Diagram]](../../diagrams/35/c9656e59ded34dc6f90de9fd2758584f.png)
![[Diagram]](../../diagrams/3/cf22cfd1d48d4dcbdddf9380880167dd.png)
![[Diagram]](../../diagrams/28/69cb524e67e87439a8ed5524f5a1121e.png)
![[Diagram]](../../diagrams/16/654d1e207abbbb71e6ad5247fb3c1c8b.png)
![[Diagram]](../../diagrams/20/567c182059dd726c2f23cae85eec0c1c.png)
![[Diagram]](../../diagrams/24/c8f3eb04683bccf14b4b1de3a525f936.png)
![[Diagram]](../../diagrams/2/296fee3aa3dd2c6490833380e30f77e4.png)
![[Diagram]](../../diagrams/52/e0da922a2187975bc6a6bc52170613e8.png)
![[Diagram]](../../diagrams/4/3420faadf9dc7d25755b65ec702133e6.png)
![[Diagram]](../../diagrams/32/23803d1fa691105d4e85d7017af8392f.png)
![[Diagram]](../../diagrams/51/6e5245ad5e53e610b722f05fc3ae440e.png)
![[Diagram]](../../diagrams/34/ee38e718b6f97c3fdff350cecb9a5926.png)
![[Diagram]](../../diagrams/9/517444f85ee131ff6fd0d09f0ccf4d93.png)
![[Diagram]](../../diagrams/43/69ef576708dff4267c8b7e7a28e2288f.png)
![[Diagram]](../../diagrams/23/758eb700c45a3b2c4ddf6f54a28507c5.png)
![[Diagram]](../../diagrams/33/5d01492adbc5e18132cedc4f1ea57ef5.png)
![[Diagram]](../../diagrams/33/15c512f4a2dca047c34c15afeee6514c.png)
![[Diagram]](../../diagrams/47/cbe538fbf63a5838904a6554be9e0a44.png)
![[Diagram]](../../diagrams/27/4bc1a8066274fd3ca4fb252bd3f43cef.png)
![[Diagram]](../../diagrams/15/fb9c3f5b5f1bc03a86634105fa1f27d4.png)
![[Diagram]](../../diagrams/37/123e3dd670da238088c57b92f0576708.png)
![[Diagram]](../../diagrams/21/a1e66e6348e227b4066f66b47b0a70c3.png)
![[Diagram]](../../diagrams/43/89124ffec99e21afaf2932fc381dd86b.png)
![[Diagram]](../../diagrams/32/da5fa6aa6a542e78aaf16f929b3865e3.png)
![[Diagram]](../../diagrams/38/8f5a80eb03e0901537896a11c50e2f67.png)
![[Diagram]](../../diagrams/11/03614abe03f6e99952d14770d76bd638.png)
![[Diagram]](../../diagrams/37/45a90b43bcc6bd0bb71aad25c7cbd22a.png)
![[Diagram]](../../diagrams/13/f45121d5391a120bb3106329f9cc184c.png)
![[Diagram]](../../diagrams/47/f1118fcb02529b59c4639483e43b13e3.png)
![[Diagram]](../../diagrams/37/3b9a7daa23841f0393fbcc07392778e6.png)
![[Diagram]](../../diagrams/52/d8ec6110dee1b72e2a9154ba5c559127.png)
![[Diagram]](../../diagrams/30/2044b5f26f0f277103561fc2e4d452b4.png)
![[Diagram]](../../diagrams/37/26b5d248ceeffc0785bdd6d96f61970d.png)
![[ext]](http://senseis.xmp.net/files/sl-ads-mockup.png) http://senseis.xmp.net/files/sl-ads-mockup.png
http://senseis.xmp.net/files/sl-ads-mockup.png![[Diagram]](../../diagrams/49/80f1593a1544aa4699f0b4c4ed9626cf.png)
![[Diagram]](../../diagrams/42/bbfb663cb0d5cbba46b40003689ea277.png)
![[Diagram]](../../diagrams/28/e24a8416c5801d3321d56ed696a35ac1.png)
![[Diagram]](../../diagrams/32/63ce05288617d8814cb2d8648fe7d670.png)
![[Diagram]](../../diagrams/42/2e640b920fc0684c4a108890dc666dcf.png)
![[Diagram]](../../diagrams/24/1b3ce00615413ad2fa1cfd581e6db5bf.png)
![[Diagram]](../../diagrams/12/ded4b12e2beb6ae870e3ff54b677c311.png)
![[Diagram]](../../diagrams/24/f135ac54ce10bb3862b1c6fef7350ac6.png)
![[Diagram]](../../diagrams/40/26bbcc8361beb120423c2a80ff79f38b.png)
![[Diagram]](../../diagrams/18/cf7c9235130408aba58751e9c341cee0.png)
![[Diagram]](../../diagrams/40/207a306a2015203de1270acb24e1eed1.png)
![[Diagram]](../../diagrams/9/cdd9d6ec999a259ceb54c34d7ea169d5.png)
![[Diagram]](../../diagrams/22/21ffddfd36a138f2dfd5637e12c33f63.png)
![[Diagram]](../../diagrams/41/47b793dfdec639304086a332d84cff68.png)
![[Diagram]](../../diagrams/7/7a12a6de7a4c89395d9f41826b97673b.png)
![[Diagram]](../../diagrams/46/e101d6adf3491a1429f5a7cce8178f72.png)
![[Diagram]](../../diagrams/23/5acf2bb27adce74be69e4be6d52625e6.png)
![[Diagram]](../../diagrams/19/ea57f6394d6af232a8ca0f87a5e3c913.png)
![[Diagram]](../../diagrams/51/5c465685a6869d197af5afff17f5a3c7.png)
![[Diagram]](../../diagrams/12/2dc5a7ae17de3c1336151279d56d6416.png)
![[Diagram]](../../diagrams/23/c95340d62077ecd359e23099b01b3195.png)
![[Diagram]](../../diagrams/5/6c0c173c626197253ba567809d20ad3b.png)
![[Diagram]](../../diagrams/41/1ec3d613a2dc69682769057efce34512.png)
![[Diagram]](../../diagrams/1/dd6210365f0f65cf32f3b7a7e264739f.png)
![[Diagram]](../../diagrams/22/3b285d10fa3d4babb0c2b9fc4994617a.png)
![[Diagram]](../../diagrams/37/92dfcae780babe740f8358844aea134a.png)
![[Diagram]](../../diagrams/42/eb7aaba726ae69c8d9a1866a4ad678a1.png)
![[Diagram]](../../diagrams/46/17e341906b56e5872a20552996a2b261.png)
![[Diagram]](../../diagrams/29/e3f9311dc6f1aeef59127d43bfef0c89.png)
![[Diagram]](../../diagrams/8/08e9fe5352d1a0ac7575d55b35b1b4cf.png)
![[Diagram]](../../diagrams/49/15f2d11fb8c52539bd72dfca4bb89986.png)
![[Diagram]](../../diagrams/10/26e6c0f827bf9f7b223ff01d6b2acafa.png)
![[Diagram]](../../diagrams/33/b7e1eb9b84119359b16b22ee1387ce01.png)
![[Diagram]](../../diagrams/42/18f66e29242ef4e6c4baa564e5676bb2.png)
![[Diagram]](../../diagrams/28/4b2506a53aaf2d3d8cb5ea9d7d91f561.png)
![[Diagram]](../../diagrams/45/bd094d98e259267e87674252c7282951.png)
![[Diagram]](../../diagrams/37/ead7166fe4537e697c965875b52072e2.png)
![[Diagram]](../../diagrams/24/1d6024c602e75bc4886d72c3f64ac4d1.png)
![[Diagram]](../../diagrams/35/5842d56225dc0c264daa1a6096f6833e.png)
![[Diagram]](../../diagrams/30/528c27e8a24af66440071429ba3b6c4a.png)
![[Diagram]](../../diagrams/3/594a7121bc0510522c5a8f1c73d23540.png)
![[Diagram]](../../diagrams/18/f34adf62a644671dd426326bd5529df2.png)
![[Diagram]](../../diagrams/30/807a69968fc7473d8d23e77cfe171383.png)
![[Diagram]](../../diagrams/7/f275045e203268be8cedc230512fd2b6.png)
![[Diagram]](../../diagrams/6/700a372b4c145b9939439e385b3e1910.png)
![[Diagram]](../../diagrams/41/3e46197624eca698274f02af00aeab01.png)
![[Diagram]](../../diagrams/12/0aa1a245826046ed879f40cd9288b1ad.png)
![[Diagram]](../../diagrams/4/4a779c577552fcfb339f010271347634.png)
![[Diagram]](../../diagrams/45/4128caca83127edb0a666ec81b66ff09.png)
![[Diagram]](../../diagrams/48/07dba031ea457c2d9190c3b2a8841e76.png)
![[Diagram]](../../diagrams/8/4b520e8d80e9e59b4281922e1bbc3471.png)
![[Diagram]](../../diagrams/45/54c08457bc6dc7d8cf463dd7531cc943.png)
![[Diagram]](../../diagrams/43/d6e9ad172fc0771ef58110f965e0b2ce.png)
![[Diagram]](../../diagrams/47/d854f10753d594627492514ae04c81c4.png)
![[Diagram]](../../diagrams/8/54915a0eb837f541ef13b31960a88bde.png)
![[Diagram]](../../diagrams/25/4e4e6850fcd9885353a770054a342918.png)
![[Diagram]](../../diagrams/30/a3a276a92d6ee5c0dcb5c710d6fcb9bf.png)
![[Diagram]](../../diagrams/51/b1109aceeeb1158f719744c1e11cd3e4.png)
![[Diagram]](../../diagrams/49/c3f3ec9348e922e623670f9237a2c0af.png)
![[Diagram]](../../diagrams/28/67fa132b6239aafc3b027a955fa63bb5.png)
![[Diagram]](../../diagrams/51/47563efbe0736ad5ee691f5d964578f5.png)
![[Diagram]](../../diagrams/22/c11d790f3b6e358893a9600fa3e0539b.png)
![[Diagram]](../../diagrams/4/97d3eefd01afe9da6f29ec0e2d88ba8f.png)
![[Diagram]](../../diagrams/31/1750c92f951df2613624e10065cc5819.png)
![[Diagram]](../../diagrams/0/ba5c4bba2657a8283edc56df7ad2da7d.png)
![[Diagram]](../../diagrams/42/f4422ebee8f1eea30b9f28fafc8e579e.png)
![[Diagram]](../../diagrams/9/bf7cd68af8c011cf0f0c90b01c0a3400.png)
![[Diagram]](../../diagrams/34/d329f751ff3cca435986c12fc4f40165.png)
![[Diagram]](../../diagrams/7/820fa2bf78ed2b91262059f5effaefdf.png)
![[Diagram]](../../diagrams/25/95a896f02ac90ab2779ca9a3b9d2640f.png)
![[Diagram]](../../diagrams/0/0a719d48613127fb82efda4642280cfb.png)
![[Diagram]](../../diagrams/6/b2205264633644a9d6f9c8ceb2faeca9.png)
![[Diagram]](../../diagrams/12/15d3c23329b87644d775ec7183a2198c.png)
![[Diagram]](../../diagrams/29/e14f8f829a0c28496e42f305c6e18603.png)
![[Diagram]](../../diagrams/41/74f3a70737eb964c0121057c97c80a13.png)
![[Diagram]](../../diagrams/11/6e0f3dc29617e730eb6c8b781de471b9.png)
![[Diagram]](../../diagrams/16/02154624a07c95c8352979467a690390.png)
![[Diagram]](../../diagrams/18/e1b75ea04ae4a83c3728ed5daf686d4f.png)
![[Diagram]](../../diagrams/8/de4a73970f90b500d11a798ccfac701d.png)
![[Diagram]](../../diagrams/6/fbd2baf723b74a3ecbb811b12e6aff86.png)
![[Diagram]](../../diagrams/46/0ca987c5607255c0c8f6a54c382875a4.png)
![[Diagram]](../../diagrams/39/83c125d9e51561cb878bc87ecde3f50f.png)
![[Diagram]](../../diagrams/0/30741630341bce4a2e4e07f08f41fa84.png)
![[Diagram]](../../diagrams/1/d4355cffa47bc7022a9b4bbe1f986926.png)
![[Diagram]](../../diagrams/34/cd61c780e37ee3261ece3b45d321fc25.png)
![[Diagram]](../../diagrams/40/d7b0cbd55b6e748a3b22040afb272d08.png)
![[Diagram]](../../diagrams/35/e1cfec91706328e14bd6c28f5ced7723.png)
![[Diagram]](../../diagrams/31/29b6457ef94376ccba832a5c312ea8d5.png)
![[Diagram]](../../diagrams/18/13098ec54643e2d4e47ef0a9ccfe1c7e.png)
![[Diagram]](../../diagrams/34/d2226df447a33f57d2eb8e1c194d5210.png)
![[Diagram]](../../diagrams/21/313161c9ec8b65783228ad7040c24e7b.png)
![[Diagram]](../../diagrams/1/9225caa28be289d9b5104ed0257382c9.png)
![[Diagram]](../../diagrams/37/5d6962f9af01f054d02ffef62a5d4813.png)
![[Diagram]](../../diagrams/44/6a8df0232c5c929576605454232822a2.png)
![[Diagram]](../../diagrams/28/10ec87f152f1f3572e055e46f211f8f5.png)
![[Diagram]](../../diagrams/22/9b102129bd9552140f9201b8944225f2.png)
![[Diagram]](../../diagrams/39/4fd765e16957ba78662a2eaf87291d55.png)
![[Diagram]](../../diagrams/26/c4bda1dadf8bd67faa727751bf870a9d.png)
![[Diagram]](../../diagrams/42/b80ec3d0aa095e927034b332f9bb3949.png)
![[Diagram]](../../diagrams/13/15235e858b8480243f5d8005a873f897.png)
![[Diagram]](../../diagrams/19/8df7615195182b0cf6faf26c04bbebe5.png)
![[Diagram]](../../diagrams/28/d89b62641c7d4261818390e2e27b0462.png)
![[Diagram]](../../diagrams/19/47fd1537001a9578a47f5d1a72ae5630.png)
![[Diagram]](../../diagrams/23/dcc0fb202eb326f3ed3016b50446d6d0.png)
![[Diagram]](../../diagrams/9/be90bfd658388d0e6d6bc947421a229c.png)
![[Diagram]](../../diagrams/42/e04cd802ab9fe76f44bc9d23918733dd.png)
![[Diagram]](../../diagrams/11/7e76f70b2b4f6f453be6dfbb01180194.png)
![[Diagram]](../../diagrams/24/8c33912116c5b7ab490fee8d4eb1804e.png)
![[Diagram]](../../diagrams/5/55deb16d4b3544b2b0f6acc3b61ed7fa.png)
![[Diagram]](../../diagrams/15/6d7f0d52825c5ba33431d1a7b91dd38a.png)
![[Diagram]](../../diagrams/30/ff2929fe291f9d36763b0e537f045d0a.png)
![[Diagram]](../../diagrams/30/49a47e87524d0826da11fb027451750c.png)
![[Diagram]](../../diagrams/39/c75b7d0153221a63450619574622ef37.png)
![[Diagram]](../../diagrams/35/47e6cc17e123b44e65922b92da4dd1c1.png)
![[Diagram]](../../diagrams/40/984ad08e0e47f88fd81fb31037f22189.png)
![[Diagram]](../../diagrams/10/ee8e89fd8267394de2cdbdf6b9684fa3.png)
![[Diagram]](../../diagrams/51/487efd30b198e581279ca152cdd7fb42.png)
![[Diagram]](../../diagrams/29/d978c639ed921f02a801b210a23db0b1.png)

![[Diagram]](../../diagrams/41/082c4df3f8e6155d65a97a6a02005121.png)
![[Diagram]](../../diagrams/41/560f08ab1903bcbd80222152ccfac5ec.png)
![[Diagram]](../../diagrams/17/0b80104a4b628b2bafb249e2bd99aafe.png)

![[Diagram]](../../diagrams/33/826e426eed44407dfc27690751c1bca4.png)
![[Diagram]](../../diagrams/29/8ff4dee75835a0eb655e56b1e907f781.png)
![[Diagram]](../../diagrams/34/0ae144c049d71bbbe39aedaa277d5b52.png)
![[Diagram]](../../diagrams/32/9e9182dabb36ac2a976ae02027186bca.png)
![[Diagram]](../../diagrams/0/3e644f742e55733986cc065946ff4cde.png)
![[Diagram]](../../diagrams/45/9010c6517cd8067929e64ef6e94fb288.png)
![[Diagram]](../../diagrams/9/62558dd6aeac4dd19fce623af37dbcd7.png)
![[Diagram]](../../diagrams/46/1c105bd53025b36f8f57ccc5a04c456e.png)
![[Diagram]](../../diagrams/9/22f1f4f72f906623633ecdf1dcbdd962.png)
![[Diagram]](../../diagrams/50/2b304df5c6d2f2342bd58dc754fb5c7b.png)
![[Diagram]](../../diagrams/22/36df1f5e0ea7fb4f2373e097f4bd028e.png)
![[Diagram]](../../diagrams/2/6b385d9d7603fe83368cdec50c8f2ca8.png)
![[Diagram]](../../diagrams/21/8873a091873321715e5a36bd6daa69fb.png)
![[Diagram]](../../diagrams/14/85dae39cc4b8caae88aa4e9d3f524174.png)
![[Diagram]](../../diagrams/2/6b293f839dee83439761eec2977f6cdc.png)
![[Diagram]](../../diagrams/24/027f1ffbe95e5013fad917da0eb05a71.png)
![[Diagram]](../../diagrams/15/51eb3a1836f170d3c4792e564f5edbe5.png)
![[Diagram]](../../diagrams/18/719308ea30a92d9956f21d6b945b7526.png)
![[Diagram]](../../diagrams/29/8e33fcb15d20751fe506e61143d00363.png)
![[Diagram]](../../diagrams/20/179ce02492ccdf88e411c3c56ef490f0.png)
![[Diagram]](../../diagrams/39/c9363f65f95c0503b1dec9ceed7ab0b5.png)
![[Diagram]](../../diagrams/30/ad7d6a32ceefef8e9cb266e55a48aae3.png)
![[Diagram]](../../diagrams/47/2130d5762a414bde0a7f99eefc14bc78.png)
![[Diagram]](../../diagrams/37/312b58aad62112aa9c3907085f70a6d5.png)
![[Diagram]](../../diagrams/22/5c2e699bd25aaa2dbc557e192baa5882.png)
![[Diagram]](../../diagrams/30/e988a8aad3890f792126925a826ef790.png)
![[Diagram]](../../diagrams/36/c5b12a710b82ed6386c96870e5df4c2d.png)
![[Diagram]](../../diagrams/38/4a2c02d8aa4f373d69b2114921d5ee9b.png)
![[Diagram]](../../diagrams/48/11d96e14251f8d4f1a86953f45f66c09.png)
![[Diagram]](../../diagrams/19/fcb1f302c330f5bb4515d88fc011abc8.png)
![[Diagram]](../../diagrams/45/f7e247dd193ca73844797e53a857b45a.png)
![[Diagram]](../../diagrams/6/ee2783a070f45db66d7902c82b18fcc8.png)
![[Diagram]](../../diagrams/26/286fd16753bbf836a3e98925bdb74918.png)
![[Diagram]](../../diagrams/52/463c62b23958ebada7fb892d47e4e6f2.png)
![[Diagram]](../../diagrams/20/dcb35e3200ff8ccd446b4f1e64b9246f.png)
![[Diagram]](../../diagrams/24/c0c77ffd9d58cd484baa20e80de8b798.png)
![[Diagram]](../../diagrams/38/bf2eea7dd1f59dc277a77d2e88673265.png)
![[Diagram]](../../diagrams/18/c77c0d025211ddaa486e7b945d8de9b2.png)
![[Diagram]](../../diagrams/24/408146d29808067ccdc8f3f78321811e.png)
![[Diagram]](../../diagrams/1/11d212194922e8ff5773fcda25c42a31.png)
![[Diagram]](../../diagrams/19/891d305828d76bf6a8ab21bcddab6e9d.png)
![[Diagram]](../../diagrams/2/f96d67ea8696a97e3b09c272a416636a.png)
![[Diagram]](../../diagrams/42/0ec5e13e6bd8cd75d5965dbfabf4c3dc.png)
![[Diagram]](../../diagrams/50/1b87eb4d85daa651b2f0346cd373b300.png)
![[Diagram]](../../diagrams/39/52973482c756abdb87d4ff46799376e0.png)
![[Diagram]](../../diagrams/47/28bbcff4abe5d24268ea1b628214b384.png)
![[Diagram]](../../diagrams/49/e0b36c7e156acdff571117dc5e7776a7.png)
![[Diagram]](../../diagrams/22/f2fab8930d3cca5fd357fd9ad1865ecd.png)
![[Diagram]](../../diagrams/37/e9dfd3388f7a687e36d4929bae297a92.png)
![[Diagram]](../../diagrams/18/ae9734e161350c085a0ccb0caceb46ea.png)
![[Diagram]](../../diagrams/35/7879b5f9cc0e1b09dc43d41244136f5e.png)
![[Diagram]](../../diagrams/11/83717480a3ce8486c1d7c72ab1e55411.png)
![[Diagram]](../../diagrams/14/667ec10b08b5f371d664d2547b526d84.png)
![[Diagram]](../../diagrams/3/c17621101b36ce610b2b89805fe79f9d.png)
![[Diagram]](../../diagrams/38/fcb9be89288564ff103a61e5df96ce27.png)
![[Diagram]](../../diagrams/48/f09178e54de79cd2900f4ae58a06a7ec.png)
![[Diagram]](../../diagrams/33/c77fe6be6a5fa16c1e7b82954f01781f.png)
![[Diagram]](../../diagrams/1/452879672c6a0c196c698a2a812adf89.png)
![[Diagram]](../../diagrams/6/54495204670b2070715f3c103a49d22d.png)
![[Diagram]](../../diagrams/5/229d8299535d6e954000e86860c7259c.png)
![[Diagram]](../../diagrams/5/4604b64b003780e8a12115e454cf7d71.png)
![[Diagram]](../../diagrams/4/dfa3b6751b49451349d28a415272c17a.png)
![[Diagram]](../../diagrams/38/aecc4028afd3faac166f77f9fbe42a00.png)
![[Diagram]](../../diagrams/37/26dc0548cb545d3db307f0abd6d6f49f.png)
![[Diagram]](../../diagrams/17/78072f926820dc31636a06b9e8cdffc3.png)
![[Diagram]](../../diagrams/19/6489d5d3cb479d22aefba302947f8ad2.png)
![[Diagram]](../../diagrams/19/15df5ffb963bfe7b04fab9dc1ba2439d.png)
![[Diagram]](../../diagrams/42/5add3d53469a71bdb12910b03f4146e7.png)
![[Diagram]](../../diagrams/36/2c40f034796824751795378ea7ac9837.png)
![[Diagram]](../../diagrams/21/a480f248154e85c2627cc65374a746a2.png)
![[Diagram]](../../diagrams/41/e978c725e7a7a325c0584f3dfb800fdb.png)
![[Diagram]](../../diagrams/43/b0092cd125ddb426038acded326767d1.png)
![[Diagram]](../../diagrams/17/33fb6f22da82d6e0aa99746b550e2b18.png)
![[Diagram]](../../diagrams/43/6e6f6b8b86f154f79d9c133f8e62bc9e.png)
![[Diagram]](../../diagrams/7/01a2c4624a55ad63c269cf528571af09.png)
![[Diagram]](../../diagrams/25/aea5b2562a860d6f08b2af4c26e1d0e0.png)
![[Diagram]](../../diagrams/42/bff6d9e0aa61fcf306ce1d73435fc7dc.png)
![[Diagram]](../../diagrams/37/44981706ef96a9c6baa9c618aeb8612b.png)
![[Diagram]](../../diagrams/12/cd024619891c627198e087d3fd86385a.png)
![[Diagram]](../../diagrams/50/5edc5a270f89c6e206317afda8811055.png)
![[Diagram]](../../diagrams/5/5b343ffd1358abb8b57eb68d632f3cd9.png)
![[Diagram]](../../diagrams/10/3a153a1ced04afeb233839c8e7983e69.png)
![[Diagram]](../../diagrams/49/14c89947aa02f26019e7ce9a47290e6d.png)
![[Diagram]](../../diagrams/18/39514c021e0359fc7317bb87ae178413.png)
![[Diagram]](../../diagrams/26/1f311d02c99aa86dc32260a439397a88.png)
![[Diagram]](../../diagrams/29/8a6b63f8917e25e5979377290fb78b0f.png)
![[Diagram]](../../diagrams/18/b89995432af17deb6c44b78d735e73de.png)
![[Diagram]](../../diagrams/11/9477db522fc5764cfdb4b14fb0f868cf.png)
![[Diagram]](../../diagrams/24/75f6c41c84a48c541398094393fb3532.png)
![[Diagram]](../../diagrams/45/2f782f14887eebaa8cb7f88a32dc23e4.png)
![[Diagram]](../../diagrams/32/b1e585f4cf0fe612ab6cc622f47fa3e0.png)
![[Diagram]](../../diagrams/22/dc632606510eda0a59cee739c6bd7929.png)
![[Diagram]](../../diagrams/52/46e94397f9728c4304ead0a4c6fec4fe.png)
![[Diagram]](../../diagrams/29/55405892e85affbae094c3a94af2cb93.png)
![[Diagram]](../../diagrams/26/3f0db91b1710f95cd50efeb6b407389c.png)
![[Diagram]](../../diagrams/34/37811a8e39503e1f47312e99e844676a.png)
![[Diagram]](../../diagrams/39/7efba79a6dd92480c58f60d61aa120ab.png)
![[Diagram]](../../diagrams/9/e8d055eb017b5b0b683af69d13dd2885.png)
![[Diagram]](../../diagrams/44/d3b7bc99d808488675917b3e54c8879a.png)
![[Diagram]](../../diagrams/45/540d9f999502b1adc991df8ffd8607f0.png)
![[Diagram]](../../diagrams/38/d15f56e866f1ec1b70111c24716b47bf.png)
![[Diagram]](../../diagrams/39/d14ddaff6dccd9cc2f849f2d9557622e.png)
![[Diagram]](../../diagrams/28/1cb26bc833ea1f7b8932f92e41a627f7.png)
![[Diagram]](../../diagrams/33/f847d4ae2db4d67954d8d587b772875f.png)
![[Diagram]](../../diagrams/30/5081cf044ab0b5fcab767abde9baa141.png)
![[Diagram]](../../diagrams/26/4edc0ece98eabae31c0cba1d1ef759a3.png)
![[Diagram]](../../diagrams/0/055df18d0baf8eb318662041eddb77ea.png)
![[Diagram]](../../diagrams/2/1b22219a3ac09630c083aec784ad999b.png)
![[Diagram]](../../diagrams/18/3431e60205016e03a54a0574c0cd1674.png)
![[Diagram]](../../diagrams/28/8ee7b7475d6d4173692839ca88e8f9e9.png)
![[Diagram]](../../diagrams/1/9b4aba70f1992157eed204b83ef8c883.png)
![[Diagram]](../../diagrams/4/cc3698616db91367de5af0b2f4a80c2f.png)
![[Diagram]](../../diagrams/11/b64aee7ccf8d79101020a2e778b47969.png)
![[Diagram]](../../diagrams/31/13365b89dd0fbaaf8dc1303e83998b4b.png)
![[Diagram]](../../diagrams/30/a687dad4f2e7f5562079d4fd530b2c9c.png)
![[Diagram]](../../diagrams/41/9ac0ef4f133c2286fdd0b1bfe9e331d9.png)
![[Diagram]](../../diagrams/19/0b3028916c00a0b1aa1cfb005057d2a7.png)
![[Diagram]](../../diagrams/13/6aa038fe68282a5c09f6a471212ed0c2.png)
![[Diagram]](../../diagrams/12/5a355c850f247cda388c4b91a9f6eba6.png)
![[Diagram]](../../diagrams/29/38cd31d8c9d54ef8b5a4cde72fe8ee3b.png)
![[Diagram]](../../diagrams/51/7921d027a906aa717330b85bf1b73cff.png)
![[Diagram]](../../diagrams/3/bb5833b73958ce44317d13a777f3532a.png)
![[Diagram]](../../diagrams/3/8607103cb94ad24f36b8a2140891d070.png)
![[Diagram]](../../diagrams/20/6315cdc5fcfd749acfd35fedbe357031.png)
![[Diagram]](../../diagrams/37/a30eb4d70ce2bbe861380211c9e821ef.png)
![[Diagram]](../../diagrams/14/22b5ccdf53a5295aaa8b3697523df6c7.png)
![[Diagram]](../../diagrams/2/29ae492477a1b13767548fecfad28407.png)
![[Diagram]](../../diagrams/4/fb81820d9feb861c7fe43b3f907a3bae.png)
![[Diagram]](../../diagrams/22/455586464d47634fa07b3e962f61f3e4.png)
![[Diagram]](../../diagrams/11/c995bc80adfa7483b8c6764cbaa12281.png)
![[Diagram]](../../diagrams/38/e9bedd6215a1d1f07a127203241ebff7.png)
![[Diagram]](../../diagrams/28/ca4efebba833e65a6927d90ed412f2f8.png)
![[Diagram]](../../diagrams/42/ab3eba24b4392555a20cfc6e0fb79b05.png)
![[Diagram]](../../diagrams/26/5b053bc265bd80d2b7f840152e91cd60.png)
![[Diagram]](../../diagrams/37/0d6aceaadbd3fd5f781f6f5f036110b7.png)
![[Diagram]](../../diagrams/2/a52a192baace736a54dccb38007eb248.png)
![[Diagram]](../../diagrams/5/ced6a1edee96ee01747e8301bcb7ca64.png)
![[Diagram]](../../diagrams/51/8a762bdaa0c20acc5ecea6ed51e10932.png)
![[Diagram]](../../diagrams/2/5a867c5f94e16fc1facf8e7176091467.png)
![[Diagram]](../../diagrams/31/a8dc948b17104a4abee5b0674381f7d3.png)
![[Diagram]](../../diagrams/22/a8ef9332ac6b501d5d8802565d1a7a91.png)
![[Diagram]](../../diagrams/50/8d85b5c4b59a34d0d84db08abcac2e77.png)
![[Diagram]](../../diagrams/12/b6b5500494789b522ad072c9ce689a17.png)
![[Diagram]](../../diagrams/43/5b87711f17894b26232bae62eba5531f.png)
![[Diagram]](../../diagrams/42/a8649461ebabfadb015dcaefcfa606bb.png)
![[Diagram]](../../diagrams/33/b4d6e02204afc4fdef40dd5f75cdb560.png)
![[Diagram]](../../diagrams/14/7e1753986264c05b5335843a75e98336.png)
![[Diagram]](../../diagrams/29/c01937cce263d9b402bacc66d294eb3c.png)
![[Diagram]](../../diagrams/2/150ae8418cd75de51e4026238ed2cd7a.png)
![[Diagram]](../../diagrams/3/8b55c6f4e0ea8e23bc7e981a773e1b28.png)
![[Diagram]](../../diagrams/49/1a48a69c666374cabc5fe0127789ac42.png)
![[Diagram]](../../diagrams/52/84ba5421f78a1860cd0d70647eee8516.png)
![[Diagram]](../../diagrams/24/6ac543241621c97a9110656ee2a8c35d.png)
![[Diagram]](../../diagrams/48/f99095655a170bdba4ba4ad9d6c46ff8.png)
![[Diagram]](../../diagrams/18/03a34aa07f25a4fa91e2407c1a8f054c.png)
![[Diagram]](../../diagrams/38/007c9c9eff4af42c56421a3bab7f0f42.png)
![[Diagram]](../../diagrams/11/b153d18179c05ff78d96d19e2cf86aa8.png)
![[Diagram]](../../diagrams/48/744ef9aabb2f596848e65cd15e982802.png)
![[Diagram]](../../diagrams/40/af1ec56539111c0f807e793fbf165dab.png)
![[Diagram]](../../diagrams/33/f5548e195c486dffcdb0bf093104a171.png)
![[Diagram]](../../diagrams/14/f1b1b7a5245b84080f7568f512e7ced1.png)
![[Diagram]](../../diagrams/4/19b86385233e0879c84f219465c2f068.png)
![[Diagram]](../../diagrams/45/d75599f27895b407fbcf4fb6bbf57b0a.png)
![[Diagram]](../../diagrams/2/497e682794fb86bcf5b4ccc4933cc503.png)
![[Diagram]](../../diagrams/50/fe81faf46f5dd66320bbdcb29d4f48ee.png)
![[Diagram]](../../diagrams/48/cfc2318d155eba68299a0fc8de00fb15.png)
![[Diagram]](../../diagrams/10/8fe9248778fc1432f7ddf8e701b5d1fd.png)
![[Diagram]](../../diagrams/31/c96084ed2bd80aa4aea1d4871409e3d5.png)
![[Diagram]](../../diagrams/32/2c622cfb0da83ec907afdcd3cbc61104.png)
![[Diagram]](../../diagrams/34/53d1075d93d1d430eb17da6591a55747.png)
![[Diagram]](../../diagrams/43/1ea3a81f54026c14c9c2af22c89db9bb.png)
![[Diagram]](../../diagrams/18/92b18a2dbd7f65bd2dd553b0e26ac734.png)
![[Diagram]](../../diagrams/29/20f21e0e96600b44feb5051e03b66a47.png)
![[Diagram]](../../diagrams/27/38b5478c99a31434a861ff569c10f3f1.png)
![[Diagram]](../../diagrams/20/e0c008f65e860748c6b986283acf1a7b.png)
![[Diagram]](../../diagrams/25/da3db44a3bb2fd51670dfdba14ca866a.png)
![[Diagram]](../../diagrams/2/648308b4a5ef2ff92afb215005260055.png)
![[Diagram]](../../diagrams/21/57202c6cf11e47b272c732f195f3d323.png)
![[Diagram]](../../diagrams/40/cbe12788ec8c4ba39fdbb990667e419f.png)
![[Diagram]](../../diagrams/50/9ed47e196cdfb1ee7e8bbcd0d852990a.png)
![[Diagram]](../../diagrams/9/cbdde39bb9a7b35a71238d2e8213b6c6.png)
![[Diagram]](../../diagrams/1/b0b5ca175e915a153bedae987e28c3a2.png)
![[Diagram]](../../diagrams/35/7130b647956b08165b731a059598d336.png)
![[Diagram]](../../diagrams/39/bd1635c88cb8bfadc911ea75514d3640.png)
![[Diagram]](../../diagrams/37/3d986d64245976080f116c4dfe11f178.png)
![[Diagram]](../../diagrams/38/2cada36496327369a5070e7c0dbabf41.png)
![[Diagram]](../../diagrams/25/afecf532a955472170c6f4773a3ba470.png)
![[Diagram]](../../diagrams/39/f6c51ca0fca137c6e3ae8c548a5843f1.png)
![[Diagram]](../../diagrams/25/a82c978418068f363f50151014bb6e29.png)
![[Diagram]](../../diagrams/42/8a2c924d0263e270490c0511e3575890.png)
![[Diagram]](../../diagrams/34/b90d149565e626523da3f2a1d11afbbc.png)
![[Diagram]](../../diagrams/29/20da5881466579cd51b2e44729f1dee2.png)
![[Diagram]](../../diagrams/24/1ee5a807b4f96c230ca42e729947ade6.png)
![[Diagram]](../../diagrams/7/45e0cda82ca3f157c2d41524b5160ad2.png)
![[Diagram]](../../diagrams/42/0535c4eb9311d56a72c2e7288c09cd67.png)
![[Diagram]](../../diagrams/4/d1f226372ffdf56dd69d53f469ac0fc0.png)
![[Diagram]](../../diagrams/13/3fbd3ff868d557a76c439102ff947c10.png)
![[Diagram]](../../diagrams/26/7fbe9f7feab468a09e578bf5e34e8cb2.png)
![[Diagram]](../../diagrams/27/0da3a00b7730a07ae7006d2e8ee178c1.png)
![[Diagram]](../../diagrams/36/26c0ce1dfded60a894234abe05165a4f.png)
![[Diagram]](../../diagrams/1/3ff8534e4bd4ce67adc22c2f85498e23.png)
![[Diagram]](../../diagrams/14/222d549b986be46b195634279ce9f5de.png)
![[Diagram]](../../diagrams/1/29cfccde80931bfd386cb0baf1df44bd.png)
![[Diagram]](../../diagrams/6/e2c5379e02307403973ff3012313fde0.png)
![[Diagram]](../../diagrams/1/97b65db5990fc2a9c31403dadf55aec0.png)
![[Diagram]](../../diagrams/18/3eb5d6e3787d7c5f401248d212c15e41.png)
![[Diagram]](../../diagrams/5/7731456fa0150262d6b83a510c8bb2b6.png)
![[Diagram]](../../diagrams/2/b7f9d3d6b9551017bb8d612883f28d1c.png)
![[Diagram]](../../diagrams/17/3d44ac8dd914d54853b29262d71822af.png)
![[Diagram]](../../diagrams/29/a5b7af2c4207167e55cd7b240f42225d.png)
![[Diagram]](../../diagrams/46/c6a3bd01becf36558af0997987b45d64.png)
![[Diagram]](../../diagrams/18/d0f959d09dc3906e68334bb303b6ae35.png)
![[Diagram]](../../diagrams/5/28fa576c636cb52748cd44df4cface82.png)
![[Diagram]](../../diagrams/12/3d85000f60235f1a42a7c0538030ab3e.png)
![[Diagram]](../../diagrams/14/564f79c536f06d8160f82a78b8e1c0f8.png)
![[Diagram]](../../diagrams/3/638f0b5b51219ef2ba5409eff7d384cd.png)
![[Diagram]](../../diagrams/8/839ddf503ef87cad32a27518e12a0a19.png)
![[Diagram]](../../diagrams/15/9be1833d3fff80e9f5449be725dc3be1.png)
![[Diagram]](../../diagrams/15/083201266b539dad98d9734df9b7ee1a.png)
![[Diagram]](../../diagrams/0/37804e901b49e5ef659c71205b4e1eff.png)
![[Diagram]](../../diagrams/43/53f34cb4c4576e30d57288ff2e932d7a.png)
![[Diagram]](../../diagrams/38/5306fba3e44d40e73d41fb404ccad964.png)
![[Diagram]](../../diagrams/15/be8d865df5f92985d3dcb49c5868c6ea.png)
![[Diagram]](../../diagrams/35/7e5c6dd48c75c080b640907245325a28.png)
![[Diagram]](../../diagrams/47/afcbc4eb6034cca5acc2dfe54551a802.png)
![[Diagram]](../../diagrams/44/366bba8d1ebdb90a17287c41b81e488c.png)
![[Diagram]](../../diagrams/13/02a2ce0963c19dfcb81fb775dc3a9aaf.png)
![[Diagram]](../../diagrams/21/a5b67fd56b9e7132aeb3271a0ae041f6.png)
![[Diagram]](../../diagrams/43/d884b3b7a996a0b25447e87cc875bb6f.png)
![[Diagram]](../../diagrams/11/d50ed39a5b5df863ac556877cd71a19f.png)
![[Diagram]](../../diagrams/51/2c80478b2b8790197b355e43160128cc.png)
![[Diagram]](../../diagrams/45/ef49d014b19b7b5846699d2a92ed1578.png)
![[Diagram]](../../diagrams/49/7bde58f1830d732bc88f5a66ba76c17e.png)
![[Diagram]](../../diagrams/43/e503c2ba6ca73441424fb96529622ed4.png)
![[Diagram]](../../diagrams/26/9cce9003ecee31137e9270592545aa27.png)
![[Diagram]](../../diagrams/35/5ac787ea24e5243f2d26c5f64039157d.png)
![[Diagram]](../../diagrams/4/873eb50d5d2c4aa4457afc23956882ac.png)
![[Diagram]](../../diagrams/0/8962d648c145e4d4adacc486e55803c5.png)
![[Diagram]](../../diagrams/49/a0115b036f8b40d7d1687ea1cf14b0e7.png)
![[Diagram]](../../diagrams/30/430325e7fca3d0e4216ab1e8c6805b8f.png)
![[Diagram]](../../diagrams/27/ca859584d15a2bade820f865fba98a4b.png)
![[Diagram]](../../diagrams/38/09593f2bf52bec3b503599c93d20ee6c.png)
![[Diagram]](../../diagrams/32/41f5504907c82649a9b0b43e250cb849.png)
![[Diagram]](../../diagrams/17/a5342639534192df5d85d339ec49ebbf.png)
![[Diagram]](../../diagrams/16/9cf1431aa79f977f436830bf9875ec61.png)
![[Diagram]](../../diagrams/43/5c35f33d11533eb3f93db7682eb66d16.png)
![[Diagram]](../../diagrams/2/9aed693fbfcc339a5872a42184c68e59.png)
![[Diagram]](../../diagrams/9/0bb2e470f9e092ac21551f6055591805.png)
![[Diagram]](../../diagrams/32/bfa4fef980df9bbeecab85424fb2bf86.png)
![[Diagram]](../../diagrams/18/570c48ed791cecff740882e211dda1b9.png)
![[Diagram]](../../diagrams/4/b2813b36906153bb627f1552124113f9.png)

![[Diagram]](../../diagrams/15/96c9daec9b7e239766e9e92089693135.png)
![[Diagram]](../../diagrams/14/d57ffc0589e8fd3cc8603364fedf8063.png)
![[Diagram]](../../diagrams/21/5438a52b82adaa8a0cebce4b1b9463af.png)
![[Diagram]](../../diagrams/47/009bbf4700bf35d9b15364ba47567404.png)
![[Diagram]](../../diagrams/7/d2df2a8a3020467c5e62cc64cf09412f.png)
![[Diagram]](../../diagrams/1/033ac4e316943d08ea76f42813a321b5.png)
![[Diagram]](../../diagrams/31/9ea176e09ec8a6780cfa3498d98d24a6.png)
![[Diagram]](../../diagrams/11/24a9e907b6b31db71cb25da73f035e61.png)
![[Diagram]](../../diagrams/2/bdd7b264e0c2a18d11c2cacbdf9dfe16.png)
![[Diagram]](../../diagrams/3/0f6fbeb4d2090998a99b0fefb778d506.png)
![[Diagram]](../../diagrams/8/3a9b78c7cc471c97f4da911e3b44a983.png)
![[Diagram]](../../diagrams/44/c447b33e9724a02aaadab4caf373db1d.png)
![[Diagram]](../../diagrams/19/176f79f55d295a2005682505ddb58e02.png)
![[Diagram]](../../diagrams/47/cb1d58287a431143483bacea67c41dda.png)
![[Diagram]](../../diagrams/37/76083a685fdf7207485660cebc3d1ed0.png)
![[Diagram]](../../diagrams/23/ba2e34b53113222740047abf1f93a8e3.png)
![[Diagram]](../../diagrams/18/9619f80cd26f9ba4d74f2c2ccadcd6e7.png)
![[Diagram]](../../diagrams/6/5af5a7e4559b5eb8c226055d10ca4c0f.png)
![[Diagram]](../../diagrams/51/4b08f5b185181785f9769786d805a0d9.png)
![[Diagram]](../../diagrams/33/818e5d6d2787048672a34f56995af30a.png)
![[Diagram]](../../diagrams/42/0722808545ba4c0d6b2df9228d02a62a.png)
![[Diagram]](../../diagrams/32/c9525b259cb4d43ede67b70ec841d690.png)
![[Diagram]](../../diagrams/25/592dd71b5af2d732c107ac06319f8997.png)
![[Diagram]](../../diagrams/52/7da8c2db6c3bb7fe660928edcc128c04.png)
![[Diagram]](../../diagrams/32/8451d5ad48d77fa3d4759a7f32375db0.png)
![[Diagram]](../../diagrams/44/9cf9c9af76336b9c6c592a39ae16bbee.png)
![[Diagram]](../../diagrams/10/3ebf4db48c12c62a8d6f13caf77a0fb5.png)
![[Diagram]](../../diagrams/29/aa638090358f2d58abde48c1beb6f27a.png)
![[Diagram]](../../diagrams/40/e60583422efe7d1fd3af376af805f821.png)
![[Diagram]](../../diagrams/20/3a099ff1d7a49c8622ec94c81fabd8de.png)
![[Diagram]](../../diagrams/45/b7da5ca3cf940844e73213601b9a0759.png)
![[Diagram]](../../diagrams/15/2de15b278d34e9a2418fd348874a198e.png)
![[Diagram]](../../diagrams/0/523263d5ef272851f58e346ef3cba0d1.png)
![[Diagram]](../../diagrams/52/205b0c1db3c203bb4c007bba50f31d56.png)
![[Diagram]](../../diagrams/20/2ba7cfb410e6d1b7149d427242713f3e.png)
![[Diagram]](../../diagrams/26/034332de4380dd81b5720b9a896899c1.png)

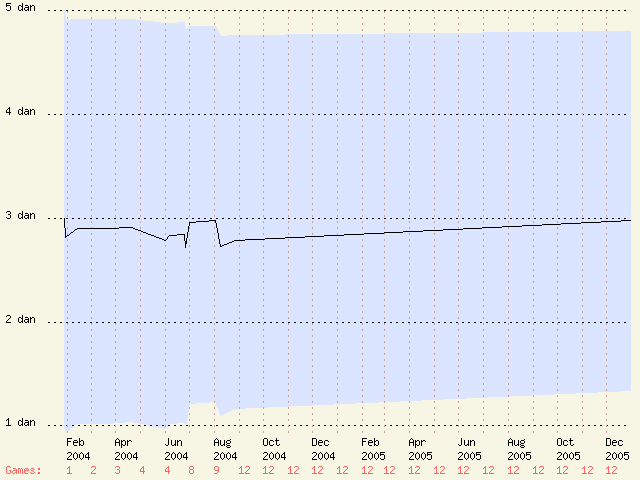

![[Diagram]](../../diagrams/46/f18a4829af68dd2feccc628789fc28f3.png)
![[Diagram]](../../diagrams/2/6a8ef2154af5714ad1322405d36fface.png)
![[Diagram]](../../diagrams/38/74e1e3d4af0b5f257af34595b0f6d430.png)
![[Diagram]](../../diagrams/3/ec3af8b1b4b77b72dbe82730fa81989a.png)
![[Diagram]](../../diagrams/9/e0e1cbb6e70164e91d86abc350f9f2be.png)
![[Diagram]](../../diagrams/10/c7a9c53dc93b8379075cd7224f8cbdee.png)
![[Diagram]](../../diagrams/12/5f47f0a6d32ac195205135b5f4270042.png)
![[Diagram]](../../diagrams/46/7d96d90cbcd08e5cc19104e57d5b40da.png)
![[Diagram]](../../diagrams/10/619dcabb2696f08d3a71957649c4603a.png)
![[Diagram]](../../diagrams/30/ebbc3ef27d31eeb5f10d0373e659d94b.png)
![[Diagram]](../../diagrams/35/5c327899c42496851780b6d41125dee4.png)
![[Diagram]](../../diagrams/1/7017d072c2229675a342681e6d12e88b.png)
![[Diagram]](../../diagrams/35/7e8d48ad9ab4f2e84511e638ce885c6a.png)
![[Diagram]](../../diagrams/30/2f675d6388bd85cce848eb9530aea800.png)

![[ext]](http://davou.freesuperhost.com/images/april-sept05.png) http://davou.freesuperhost.com/images/april-sept05.png
http://davou.freesuperhost.com/images/april-sept05.png![[Diagram]](../../diagrams/11/b0d735b75fc7dd2296dd94ca2d98a98c.png)
![[Diagram]](../../diagrams/45/cc1486864b7bc567a38723d713369f69.png)
![[Diagram]](../../diagrams/39/0287aa29807a325ef302d43363ca39f5.png)
![[Diagram]](../../diagrams/13/43e72b0d41c4faf8f49730f38a7a1eae.png)
![[Diagram]](../../diagrams/38/b186dc54d1e7cb816ef8387ccf645555.png)
![[Diagram]](../../diagrams/46/6303612a9ea3e779f1bbf4b9b687b67f.png)
![[Diagram]](../../diagrams/44/a04b82ffa31ec7b41b70d9087c0a1430.png)
![[Diagram]](../../diagrams/5/e10407e247aa78e4b2bb00148f00e940.png)
![[Diagram]](../../diagrams/11/f02a22a01f1a3a7485fee2d7214cd175.png)
![[Diagram]](../../diagrams/28/9ff6696aa441bd0277cf2d2135ebe236.png)
![[Diagram]](../../diagrams/19/be0a7b4a13a09887cdfb0ad263ef94f5.png)
![[Diagram]](../../diagrams/9/08c0e2469e4295d4e346e8a5a7eeca0a.png)
![[Diagram]](../../diagrams/14/8b10968ba16bce08ee7661ac4ecbbe96.png)
![[Diagram]](../../diagrams/17/390db474651362bf9e135c35a409bfda.png)
![[Diagram]](../../diagrams/49/f1e14302b1f73f1cbac20d14a6f10225.png)
![[Diagram]](../../diagrams/32/97d5142f8f5f74f87740be1d1c1fe56b.png)
![[Diagram]](../../diagrams/32/7417561ad65310bfbb53f9cc8110a44e.png)
![[Diagram]](../../diagrams/6/e379d5be12e00b2dc414cdf5eded18bd.png)
![[Diagram]](../../diagrams/3/9ee41d1491f175ba18be13d4e9f86e09.png)
![[Diagram]](../../diagrams/34/50b77066913a5b905ab7238b011d3523.png)
![[Diagram]](../../diagrams/33/3f6768b47c140c1f89c3909af58804ae.png)
![[Diagram]](../../diagrams/15/3d32ce8bd964fa7557277185f30f179f.png)
![[Diagram]](../../diagrams/35/b5d92c0ebd675320e99fab5df1eec8ba.png)
![[Diagram]](../../diagrams/23/ca1b2f0150c9d9b850ef5001bbc2726c.png)
![[Diagram]](../../diagrams/26/9e9448ed8edbcf76b8384e45c2929cdf.png)
![[Diagram]](../../diagrams/2/900195d6b22b57351bb187df497ca58b.png)
![[Diagram]](../../diagrams/15/a8132f70289834d9137cb275ceb3778b.png)
![[Diagram]](../../diagrams/22/9fbe141c56c3fb676fb8927e922369af.png)
![[Diagram]](../../diagrams/18/19cd5002faa0ec5503c33f6174cebb36.png)
![[Diagram]](../../diagrams/41/7c124f8e9945acc46edf870b3975b786.png)
![[Diagram]](../../diagrams/47/4993822bbda8f70f87d191dd02a4888d.png)
![[Diagram]](../../diagrams/42/86f3f49d77a4a06ab418e6f304d830fd.png)
![[Diagram]](../../diagrams/48/de7ac808500708a479081934247e2acb.png)
![[Diagram]](../../diagrams/11/8274d600903f1e20bd2970c9a6651ad0.png)
![[Diagram]](../../diagrams/32/9ca1aedbb496460fecb9ef48e624707c.png)
![[Diagram]](../../diagrams/15/903098fc2b089e3e17226c5f503f821d.png)
![[Diagram]](../../diagrams/40/30a93adff49ef963306418336b2c64c9.png)
![[Diagram]](../../diagrams/48/5fb22d7f0c7451bfcbb0e58b9723f650.png)
![[Diagram]](../../diagrams/5/efe1ff6553771c6fb5420f935f557e02.png)
![[Diagram]](../../diagrams/34/fb3cc26cf1ab934a76d0203e54d62129.png)
![[Diagram]](../../diagrams/11/e6198eadd7dc6919f46afad6db65b714.png)
![[Diagram]](../../diagrams/22/3c3935f1db5689e9daef4a624f9d6038.png)
![[Diagram]](../../diagrams/18/82b660acc12f5f263942f575f752817a.png)
![[Diagram]](../../diagrams/16/461e04af34aeea391be865d7449295a2.png)
![[Diagram]](../../diagrams/8/bcb6bcd4caaabaa41fb890a8127a6c52.png)
![[Diagram]](../../diagrams/42/3e9e3512bec4883f77af2fb828bcb968.png)
![[Diagram]](../../diagrams/13/45438551d0d8af88e6e203abdae4c456.png)
![[Diagram]](../../diagrams/34/1bf4f0959f66efaab2001c613d9bae12.png)
![[Diagram]](../../diagrams/41/74aedd8446d148746af6acaf8d69c79e.png)
![[Diagram]](../../diagrams/46/6ef5b864f53fcd009ac00e5f0c4e253b.png)
![[Diagram]](../../diagrams/10/592b48f7ff67f21fd4dc0da4bf88ecd7.png)
![[Diagram]](../../diagrams/1/d4918be3e45c650c724c6fb0027fe5b4.png)
![[Diagram]](../../diagrams/20/c545d0b63686fdf84ade9d94a64853c1.png)
![[Diagram]](../../diagrams/9/0e1d8d0327ebd76b021f53b11642403f.png)
![[Diagram]](../../diagrams/13/e158804782941bb8bf4ddeee8acf9a4f.png)
![[Diagram]](../../diagrams/3/bf616c80705ab433c3c2914fd85b5b31.png)
![[Diagram]](../../diagrams/38/13e15ed794079f4fb6d2109dbb440b8b.png)
![[Diagram]](../../diagrams/6/5cef078520f4992272bdf6ebd91e011f.png)
![[Diagram]](../../diagrams/17/8e5681f71def52c7d3113382b59cf940.png)
![[Diagram]](../../diagrams/5/065f79651a23e78eb5124b4c6bf0715e.png)
![[Diagram]](../../diagrams/12/709ddb428b265283b898dad8b76feb17.png)
![[Diagram]](../../diagrams/50/3bb83a070bca1f5c91c8edd1934c82d3.png)
![[Diagram]](../../diagrams/47/489c34ae63550341e0436f90fb9edf30.png)
![[Diagram]](../../diagrams/47/7f13871601f21abb9addcf0231f63dfd.png)
![[Diagram]](../../diagrams/11/f3d80d8e7f92565a5516e34324fced93.png)
![[Diagram]](../../diagrams/15/5a34070a1cfe5e567378dfe511ca71a6.png)
![[Diagram]](../../diagrams/19/3af31c1a09fd1a500eab3e4a15a7d769.png)
![[Diagram]](../../diagrams/46/f24ab9b123089dc23c5e423fb8ff8742.png)
![[Diagram]](../../diagrams/16/fc9f201b329174a5c85d126210eb7365.png)
![[Diagram]](../../diagrams/52/f928390c886b3aed21b6589f6af5b7f7.png)
![[Diagram]](../../diagrams/18/d73d244419d79b86c23a49f32fc19e0f.png)
![[Diagram]](../../diagrams/1/bc6416989e602edb9d0955a8d77ded58.png)
![[Diagram]](../../diagrams/22/d396cbca5b8d91856c3b3b60d6996376.png)
![[Diagram]](../../diagrams/31/d62efbbd6091494f19f3d1207af448c3.png)
![[Diagram]](../../diagrams/43/70aefc2655bbeecc128b7e052c154340.png)
![[Diagram]](../../diagrams/23/0ca52bfa02995b8982aaa918020c22cd.png)
![[Diagram]](../../diagrams/17/f423d3dc92a94b981a70956fe54139d4.png)
![[Diagram]](../../diagrams/35/eb7754c72cadd3f3efbbd1180e6c8652.png)
![[Diagram]](../../diagrams/0/73d6aa0ab935ce1b2d92eff9583266b9.png)
![[Diagram]](../../diagrams/25/3b86473074780c4096b6304ffab23cba.png)
![[Diagram]](../../diagrams/29/ad7f78053e838bdfac6ec968961217da.png)
![[Diagram]](../../diagrams/48/242ab1ba10a4ee34b9570688057ded23.png)
![[Diagram]](../../diagrams/34/3c6d14b6bc80dfd6a877f16aaa4735d0.png)
![[Diagram]](../../diagrams/24/0dc30a1b489ae4f82c0d424c4465f44c.png)
![[Diagram]](../../diagrams/49/8cede056835f21887a63f21813e77314.png)
![[Diagram]](../../diagrams/26/fac623d7e493c4eb4440131c8c404c8e.png)
![[Diagram]](../../diagrams/12/d190d12f60e1583ea5d427de7b2d6eca.png)
![[Diagram]](../../diagrams/24/ba7ad994a60fef8d379a97015d856e88.png)
![[Diagram]](../../diagrams/33/6175b8e39ab09edfbe394b2045484a9e.png)

![[Diagram]](../../diagrams/23/18ebdfaee02043e013ce6706f9042d94.png)
![[Diagram]](../../diagrams/30/64172b30aedb32dbcc0a833160933c4c.png)
![[Diagram]](../../diagrams/25/54d7a4c048953370616f338c061fe457.png)
![[Diagram]](../../diagrams/32/2ecad963d7174b6861766d866e80f65e.png)

![[ext]](http://www.gyoju.com/ben/headsup.jpg) http://www.gyoju.com/ben/headsup.jpg
http://www.gyoju.com/ben/headsup.jpg![[Diagram]](../../diagrams/22/737d28c096fc87f2888afb0ebafa6506.png)
![[Diagram]](../../diagrams/44/f6ae00a209eb317da70be35e199450bc.png)
![[Diagram]](../../diagrams/11/e64792fc21761a032bc2cc1a37cca650.png)
![[Diagram]](../../diagrams/48/8127404d5f1b6194fa403e8e0f0d0255.png)
![[Diagram]](../../diagrams/24/a605f2f31dfc262b31404dd4f63bb628.png)
![[Diagram]](../../diagrams/40/f091478621d5e7c42f552f1c0f2c07f1.png)
![[Diagram]](../../diagrams/19/6fbe2f5ed3d04014bea810e70a1b0927.png)
![[Diagram]](../../diagrams/31/01bbfce8618e5dca3c2b48386668401a.png)
![[Diagram]](../../diagrams/38/ac4baaa80545ad055872e74b00ea54ea.png)
![[Diagram]](../../diagrams/14/5c127dfd8dc1b456de8426cee5880442.png)
![[Diagram]](../../diagrams/11/e62e76ac3213dfc685d52d9f17b0871e.png)
![[Diagram]](../../diagrams/38/a924a3fe79839ef69c8383df4abf7b26.png)
![[Diagram]](../../diagrams/14/59664da36f8c7ea304fb314f1790f3b8.png)
![[Diagram]](../../diagrams/39/e7781bf9a61ab3e6443f92e4b082fb1d.png)
![[Diagram]](../../diagrams/31/748346dc2b1ffc75d319feddde6f749e.png)
![[Diagram]](../../diagrams/21/292f55534b362ad36502864767ca04a3.png)
![[Diagram]](../../diagrams/31/9eea44bca3f58d5ae7a12b441ee902eb.png)
![[Diagram]](../../diagrams/22/6606cf75cea022412271afb43ba33b89.png)
![[Diagram]](../../diagrams/3/33af27130af10cbd30a366b0e1744a91.png)
![[Diagram]](../../diagrams/50/8ca3123eee9b5d9302cd5e6596ee334a.png)
![[Diagram]](../../diagrams/8/00964f16b4be0ef2c6fbf27954381949.png)
![[Diagram]](../../diagrams/52/f4eca1888e63dc98628b90106cc3cde9.png)
![[Diagram]](../../diagrams/7/75e567af729939067f41d7851b84e998.png)
![[Diagram]](../../diagrams/4/9703fb63d247c2bc59e76b64d390add6.png)
![[Diagram]](../../diagrams/16/5ce07139d99896bf563d7f0376d00a84.png)
![[Diagram]](../../diagrams/2/58b775b181f8f49d991b095de32b7c47.png)
![[Diagram]](../../diagrams/9/64287d1536c7bc8d18107cecabb0f0d1.png)
![[Diagram]](../../diagrams/42/7aa8d99db1778bcb3c3f95eb46fc7532.png)
![[Diagram]](../../diagrams/20/0a207f61765953d9da615f54e9981d5d.png)
![[Diagram]](../../diagrams/44/c8f9e3c4fcf1a1ad7c6c7ea6a65fef0b.png)
![[Diagram]](../../diagrams/31/17c4cbae7c9c1f07578dc03a8845df34.png)
![[Diagram]](../../diagrams/28/438a3ef53791c77d168729ff66f9172a.png)
![[Diagram]](../../diagrams/35/1e41f71ef337dce79cc3dd31633c31ff.png)
![[Diagram]](../../diagrams/16/31266522158961109eed3d28541fbda8.png)
![[Diagram]](../../diagrams/0/ce11078abc7b9e5a990ed7383c3d35cb.png)
![[Diagram]](../../diagrams/48/054686638078140e72eb5b585e62ac65.png)
![[Diagram]](../../diagrams/48/72ce325514769b5bc09c112b64d7094d.png)
![[Diagram]](../../diagrams/9/4703b152f6d98622f85e3def2f04cf1f.png)
![[Diagram]](../../diagrams/36/9477ce76edeb696761bbe62e1e4cdd23.png)
![[Diagram]](../../diagrams/22/28b42e5130e22345622e7c746169e3ec.png)
![[Diagram]](../../diagrams/39/e196f29f94bb278cac0f2b7b5da287c8.png)
![[Diagram]](../../diagrams/38/ad98fefbf7d80c97779f9d623e460924.png)
![[Diagram]](../../diagrams/19/3770de82c685e971d828de25548ab83f.png)
![[Diagram]](../../diagrams/40/906e9948bcdee0ec462740419411da81.png)
![[Diagram]](../../diagrams/11/6a744988267f068b431426a6f2fc89b5.png)
![[Diagram]](../../diagrams/22/395d86aa254df5fc7ce8b1ee82b74d84.png)
![[Diagram]](../../diagrams/11/a59935561ce89dd7eb85c16c6c995fe8.png)
![[Diagram]](../../diagrams/27/c8b9f9cb4e0b365d91dbba097f9136c7.png)
![[Diagram]](../../diagrams/20/2d59ce8c69b8c03a43e93949b7ede251.png)
![[Diagram]](../../diagrams/19/b156ec6f5d9a7dd62b65303ce93df409.png)
![[Diagram]](../../diagrams/19/1b986f5be7f9035d901fe83e0627ab3c.png)
![[Diagram]](../../diagrams/24/e2fc5cf09e396bef54ed9ebccd73a1fc.png)
![[Diagram]](../../diagrams/40/b61a8d8ddb43eee1a6b65db95fae80c7.png)
![[Diagram]](../../diagrams/28/79eb94e4cf739968c1952d0e63274e90.png)
![[Diagram]](../../diagrams/36/2a9b6bf343ca9f0680ea5ee7c13b2c8e.png)
![[Diagram]](../../diagrams/42/73be381c6c8e9de5371d37c0d6ab30da.png)
![[Diagram]](../../diagrams/15/cbaf4455ff855ab22fdbc78aba80c57c.png)
![[Diagram]](../../diagrams/1/75df48bf32dffcb8a24e177352d58e6e.png)
![[Diagram]](../../diagrams/4/c7f2019d2155ad713b0f8dda987137ac.png)
![[Diagram]](../../diagrams/5/14d5cb1d02ae5d3830972f8c0266fb90.png)
![[Diagram]](../../diagrams/46/22a23bcdba054e1c7dc0aceea2e13538.png)
![[Diagram]](../../diagrams/36/8802f72a0b30b58e45039b7522957216.png)
![[Diagram]](../../diagrams/13/cbb7e0dbd458de3db4cabff52a879bf2.png)
![[Diagram]](../../diagrams/19/a3b25390987a0bd9f66b82a6e8102c0c.png)
![[Diagram]](../../diagrams/39/c06e4fc6e90ceb6027596ab8c49d69aa.png)
![[Diagram]](../../diagrams/34/41ba9b5514eafa7b1d943b47c45085d0.png)
![[Diagram]](../../diagrams/14/00274bed51523942fa61d7b9ec408c51.png)
![[Diagram]](../../diagrams/3/d9ad05066245af74a7dde6bd819f9fb2.png)
![[Diagram]](../../diagrams/9/d8f16b2d1daff925ede2e013b309dc5d.png)
![[Diagram]](../../diagrams/5/53b6aec8e6039396893a03cc313efc91.png)
![[Diagram]](../../diagrams/36/91bba5f093d48ec33c38630787138ee4.png)
![[Diagram]](../../diagrams/52/55c69d6ab808a8004171525b9379a60b.png)
![[Diagram]](../../diagrams/32/8cf6aa9259f3b30c3aca4dca6a5275c1.png)
![[Diagram]](../../diagrams/8/8350f89db97206292b48367365c3a0a5.png)
![[Diagram]](../../diagrams/18/d603da7d12eac30cade1f5d1802d192e.png)
![[Diagram]](../../diagrams/33/ab1b43564a8a3467bb7d05bb0e9166d2.png)
![[Diagram]](../../diagrams/26/8b658a040344fe4ecbceca6d10fdf9b8.png)
![[Diagram]](../../diagrams/2/a02bd17db80d835e5aa267b3aba89ba0.png)
![[Diagram]](../../diagrams/35/69eff94c19d1dbce371cea350ea14880.png)
![[Diagram]](../../diagrams/41/cfb2eba6e72a2661b3cd95fb6933c63c.png)
![[Diagram]](../../diagrams/9/ef581ba17a1c43f6b7965c17ab856710.png)
![[Diagram]](../../diagrams/28/cedc8ccce11fb6614ac257d897cb4f52.png)
![[Diagram]](../../diagrams/39/cf17664971c1578ee8650a181a13e0f4.png)
![[Diagram]](../../diagrams/24/965e1c184217d535e5ba58a92241f992.png)
![[Diagram]](../../diagrams/19/66e45024d90461187c31769bdc0d5cbe.png)
![[Diagram]](../../diagrams/39/a2025ac8fe5f6a85f8fdcfb9e4e9c82a.png)
![[Diagram]](../../diagrams/48/016bd5879118e7ef0b6311351b0554a0.png)
![[Diagram]](../../diagrams/19/d0c56a5b83d44e58f7fc5a8de7afe7ee.png)
![[Diagram]](../../diagrams/30/1f7b68c972926447d5d2ad478493b36a.png)
![[Diagram]](../../diagrams/6/3694233cda64280ffa03ee1eca0b04d8.png)
![[Diagram]](../../diagrams/35/553b18ba314585feb7db49b0bcfdcc51.png)
![[Diagram]](../../diagrams/26/9efa2686d7b82ccc816788afca9bd1a8.png)
![[Diagram]](../../diagrams/16/50fa40858c12266f1b598588c3943e4d.png)
![[Diagram]](../../diagrams/41/b0675cc771cc7e091978eae4d9595bab.png)
![[Diagram]](../../diagrams/27/d1a5a7a9191bb6f5b842e36446204fb8.png)
![[Diagram]](../../diagrams/38/37e1f335e95557442075d053df604640.png)
![[Diagram]](../../diagrams/5/988ade459b5521c2118a4babe1c9113e.png)
![[Diagram]](../../diagrams/3/ca5556546a74933e63e383780d454e6e.png)
![[Diagram]](../../diagrams/47/fbf5d7f09c6113a0ba5a149d9ebca1e6.png)
![[Diagram]](../../diagrams/45/954bc46c6342b83e860c41c6008113cf.png)
![[Diagram]](../../diagrams/36/dbf02d9649eb5c043d0e85e0201ca44b.png)
![[Diagram]](../../diagrams/35/0b01f216c6802de3a5703f51bcefab0c.png)
![[Diagram]](../../diagrams/37/a7f910b854b97b4038359a50a2143120.png)
![[Diagram]](../../diagrams/28/c66789e0ab62af69416729f15219770a.png)
![[Diagram]](../../diagrams/13/bb35cafb654185f4407c752010de7480.png)
![[Diagram]](../../diagrams/13/2e9ee83e07b2fd95cda212f0fa9f5dfe.png)
![[Diagram]](../../diagrams/15/e1f73be4ab0cb1af5ab3b996926a4994.png)
![[Diagram]](../../diagrams/42/a7e0a60b26e2839dfb25b08c627c4d11.png)
![[Diagram]](../../diagrams/40/4000d1b8247c2bcdeb76a1e0809846e2.png)
![[Diagram]](../../diagrams/46/72ac6331363f815fa22aae55255212b8.png)
![[Diagram]](../../diagrams/24/1cb05934812524fab91d8119ab0ecdbe.png)
![[Diagram]](../../diagrams/10/eaa228ea0b0d3e4b3494b094a421f78a.png)
![[Diagram]](../../diagrams/30/beb2eba8d2b2322c1f2efa8ca7963f26.png)
![[Diagram]](../../diagrams/9/60d64f361e696eef22a8feb4e658e5ff.png)
![[Diagram]](../../diagrams/50/b1bd39a55a94b018201ff816f73e4766.png)
![[Diagram]](../../diagrams/49/0b1e686c137f5f89b7acf99751d9765b.png)
![[Diagram]](../../diagrams/16/7b13f7ab75235f092f4944082048ff54.png)
![[Diagram]](../../diagrams/38/a18987256e015559b46b53b6fa9c42e4.png)
![[Diagram]](../../diagrams/52/ca633d1aca68e1a340e0df44dbf561ec.png)
![[Diagram]](../../diagrams/2/320af563877fa47c6e03378e8a54df90.png)
![[Diagram]](../../diagrams/51/d3385b031c21f0139119f3904c1518ba.png)
![[Diagram]](../../diagrams/4/c242bfd00337bf4b1c05c93f982c144e.png)
![[Diagram]](../../diagrams/0/5e4946aa664a751de8601adeaa7baeb8.png)
![[Diagram]](../../diagrams/12/6afdd634c2e64a5e9374976443f844b0.png)
![[Diagram]](../../diagrams/13/f533d156eb78e8dd954a9dfd547cd55f.png)
![[Diagram]](../../diagrams/29/994a0cb07f42ee93b7e6213ee9725922.png)
![[Diagram]](../../diagrams/0/368a4b1de15d6252bcf48224908b791d.png)
![[Diagram]](../../diagrams/5/6d6404870d368fa406fcacb434333f19.png)
![[Diagram]](../../diagrams/29/7bd12fc59e6e1136ee08021298867bc3.png)
![[Diagram]](../../diagrams/46/0089ab13c9919446df18617f1d1c0030.png)
![[Diagram]](../../diagrams/26/95d7e10983a7dc6a700ebc39af784050.png)
![[Diagram]](../../diagrams/26/3af8e78f4f76f640828790180d37bb60.png)
![[Diagram]](../../diagrams/33/f78e4b62389dc4b25c5cc15ad96c8c28.png)
![[Diagram]](../../diagrams/17/5bd4522a993ad79a90ee602f72af8b10.png)
![[Diagram]](../../diagrams/34/bf1eb4c32439fee40ce601bf6f7c79b3.png)
![[Diagram]](../../diagrams/36/46a29b1f19239acf277bd83f8151ce9f.png)
![[Diagram]](../../diagrams/14/6c08d61c0db68e7c42438834a6974131.png)
![[Diagram]](../../diagrams/13/ea47cb5a2fd9ded9cfae43a30e0b5410.png)
![[Diagram]](../../diagrams/39/05e18ccf9756ef3574826ad9aee9e228.png)
![[Diagram]](../../diagrams/47/82cc3ddbf805a34f94d7932889f5514a.png)
![[Diagram]](../../diagrams/14/e5707f688aa34a9d851a9d26dc4deeff.png)
![[Diagram]](../../diagrams/4/8cf2aad5c920a23b05ef25ad93145981.png)
![[Diagram]](../../diagrams/3/f42b8cb2bfac21de2bbd099c4849025d.png)
![[Diagram]](../../diagrams/0/d43b677a98ee76af340b966fceb4ab61.png)
![[Diagram]](../../diagrams/21/f7245ab446ac10b6f91586bfe91b101a.png)
![[Diagram]](../../diagrams/29/ef7c8b7f9de67c770ddf5ed43372d058.png)
![[Diagram]](../../diagrams/27/1f700b85758a669c313fe4ae2c14ac3e.png)
![[Diagram]](../../diagrams/28/9116f2f6ffbeb688ecf50357c39679b8.png)
![[Diagram]](../../diagrams/46/8dea1aa7f8546b1a64bf264519c33d59.png)
![[Diagram]](../../diagrams/27/98ebd8fe14321aa453149b59162c611a.png)
![[Diagram]](../../diagrams/46/d9d32705776cd76d54994df034fdd180.png)
![[Diagram]](../../diagrams/29/c9fcfe04003347a66dd9ac931c531a39.png)
![[Diagram]](../../diagrams/31/b97997a4daf9a560da6d115d431902ae.png)
![[Diagram]](../../diagrams/13/068ba4c309d7c375623a5d7e3067a7ab.png)
![[Diagram]](../../diagrams/45/1838124da8c307a1d380496ecd67871f.png)
![[Diagram]](../../diagrams/12/bec6887968355b1b5a64bdeeec2eb0a7.png)
![[Diagram]](../../diagrams/3/f09c9d1915dd7c0b89f3ed404dcd5de4.png)
![[Diagram]](../../diagrams/41/b22de57a1d0894f7fa1f123ffdb34a47.png)
![[Diagram]](../../diagrams/41/e005a405795fd40b2acfa1981109d529.png)
![[Diagram]](../../diagrams/14/904de4c0e11c8051c6572e94dbae2e79.png)
![[Diagram]](../../diagrams/5/23b05afd25a3f5c09ac5059511a2ee3d.png)
![[Diagram]](../../diagrams/9/28a2517d882fe1aa5185c35af8364cd6.png)
![[Diagram]](../../diagrams/23/d6c721f1936883f3b000999676093a14.png)
![[Diagram]](../../diagrams/43/1c54ab84c40dab2280bfcd0cfac87e08.png)
![[Diagram]](../../diagrams/6/cc510fda0e20854cd989414144888ca4.png)
![[Diagram]](../../diagrams/38/9650aeb1a69cddaed8686e55143884ca.png)
![[Diagram]](../../diagrams/17/953bde150c8d95e68a1920d2a9f9dcc3.png)
![[Diagram]](../../diagrams/36/36781427270d7ce75bd0f4894632ee70.png)
![[Diagram]](../../diagrams/17/77b6fbcd5552160863e62c51b46411c4.png)
![[Diagram]](../../diagrams/45/ae0db3017263ba14fae6b17ef4f6dec5.png)
![[Diagram]](../../diagrams/5/e67d90eac77bc5b8bf822c69c9874734.png)
![[Diagram]](../../diagrams/12/814c2ac2c30944968e1cc8d609910398.png)
![[Diagram]](../../diagrams/21/a806b627e9351bbb349cdfaea08780de.png)
![[Diagram]](../../diagrams/36/5c39537bd5441cfeee35ce7924e6c321.png)
![[Diagram]](../../diagrams/51/c862218c3e6ab16a84e330c42b911238.png)
![[Diagram]](../../diagrams/32/2c54088b40514752fdc658a2a7a2f79a.png)
![[Diagram]](../../diagrams/46/6331d9081926e474daff8d37be2b00c2.png)
![[Diagram]](../../diagrams/7/aef56d6d7195d7ae637fdf43c73cfffa.png)
![[Diagram]](../../diagrams/6/3dbab58bef2374636976fd1d0999cfb7.png)
![[Diagram]](../../diagrams/35/199aa4b768c91bc522dca34907fd6ff6.png)
![[Diagram]](../../diagrams/17/08c54cec58ab9b266d6be5f6937aab67.png)
![[Diagram]](../../diagrams/33/d843fa0f003a06594ac7b2b667545a94.png)
![[Diagram]](../../diagrams/23/4cfc1469351bfcc4e0005e0807e3da20.png)
![[Diagram]](../../diagrams/26/d5bc0c1f54454cd8a936539ba519dc7e.png)
![[Diagram]](../../diagrams/8/992be4926a3755345f76d0c87e896fb6.png)
![[Diagram]](../../diagrams/7/3e17be17ef1f8c241882b975354f3d2f.png)
![[Diagram]](../../diagrams/41/445684586752681d55067589e83ba114.png)
![[Diagram]](../../diagrams/32/02690c95f354c679f5b21f723c103a0a.png)
![[Diagram]](../../diagrams/49/378b621b9f4d4f3ab882f6573902b596.png)
![[Diagram]](../../diagrams/10/b84e83a48062ccf6830f364acdc253d3.png)
![[Diagram]](../../diagrams/39/649e22ff25beb8588432afddd07e12a3.png)
![[Diagram]](../../diagrams/15/cbfedae42b426b15e0c3908f7ee5bf94.png)
![[Diagram]](../../diagrams/4/aab41b9bffaf9bf91e397482b04162aa.png)
![[Diagram]](../../diagrams/31/56eaaaea06de309f2fa88d7509903359.png)
![[Diagram]](../../diagrams/46/03ddb4e276d8f6efbf7615984fca34c4.png)
![[Diagram]](../../diagrams/48/208751db44ea728f01e0fef101ffe1a0.png)
![[Diagram]](../../diagrams/38/a3b4d9a693d9dd1171677f9a5fa080cc.png)
![[Diagram]](../../diagrams/6/dfddf5a463de22f360dfeb9b265671fb.png)
![[Diagram]](../../diagrams/0/f271eb97568de2b44e8e960af008054e.png)
![[Diagram]](../../diagrams/1/f911fc52ab97abf94c3887c2194871d5.png)
![[Diagram]](../../diagrams/18/b0ed1e50d4eb3c6877f5d25379f3048f.png)
![[Diagram]](../../diagrams/20/7f90c23d2375ea6e91f572c81dd511f3.png)
![[Diagram]](../../diagrams/4/9b4ec05b3089df207ac97d3fe0168efa.png)
![[Diagram]](../../diagrams/4/9b05e7889fd62e322eda16760faf9c34.png)
![[Diagram]](../../diagrams/35/8f1cddb05b962084dc724ec8e17b43ee.png)
![[Diagram]](../../diagrams/31/67c87d7fc7ab1f43b1536e8429633a81.png)
![[Diagram]](../../diagrams/12/23739be5cbe6dd90391dfc15a1237d90.png)
![[Diagram]](../../diagrams/14/0b83654ef06e3cd77961d0a712789159.png)
![[Diagram]](../../diagrams/1/ab2dbfbd40b70d2f09d15865537d4134.png)
![[Diagram]](../../diagrams/5/16588dc195146c85b15778c337129f0f.png)
![[Diagram]](../../diagrams/15/3611c6c807bf0f30e1b73011c4867f8f.png)
![[Diagram]](../../diagrams/24/28b4ea57d25b4dfc30c2d5a12a771b31.png)
![[Diagram]](../../diagrams/22/9e58484d3b5c53dc916b9e30b3bd4d24.png)
![[Diagram]](../../diagrams/36/eb4b10bf1edd927f8a4cc3eeb18afcdb.png)
![[Diagram]](../../diagrams/46/ba056b90c07f3a15c01f8694da470601.png)
![[Diagram]](../../diagrams/22/d5c49918b7bb84d698bd6d8e9f762b60.png)
![[Diagram]](../../diagrams/49/4180b0ee9dac39ccab38599bca6497aa.png)
![[Diagram]](../../diagrams/33/f888d7e2d7c1c4f559e8a84f3289663e.png)
![[Diagram]](../../diagrams/24/f63dce82f48d15021d0ad569c957fa2a.png)
![[Diagram]](../../diagrams/20/ed02e467ce235b9f8734f5da885ff1b1.png)
![[Diagram]](../../diagrams/16/972616a4d7f91835bb93b1cbed822398.png)
![[Diagram]](../../diagrams/6/11b88e77195d407f60ce8672f2f166d3.png)
![[Diagram]](../../diagrams/1/576b85cb6c44092955cbd6825c21e0c6.png)
![[Diagram]](../../diagrams/5/7f8f0b042247ed5d55b656138c7d2e0a.png)
![[Diagram]](../../diagrams/4/3c01f05ba51862d8777d747ad2a0a002.png)
![[Diagram]](../../diagrams/23/cbaaf8427e75e81fac14a36e90f0e584.png)
![[Diagram]](../../diagrams/48/0daa52daad539845d4f007f54850d510.png)
![[ext]](http://macg3.munkeby.se/bw/go/MM/AlgorithmOptions.jpg) http://macg3.munkeby.se/bw/go/MM/AlgorithmOptions.jpg
http://macg3.munkeby.se/bw/go/MM/AlgorithmOptions.jpg![[ext]](http://macg3.munkeby.se/bw/go/MM/CalculationOfMMS.jpg) http://macg3.munkeby.se/bw/go/MM/CalculationOfMMS.jpg
http://macg3.munkeby.se/bw/go/MM/CalculationOfMMS.jpg![[ext]](http://macg3.munkeby.se/bw/go/MM/ChangeMacMahonBars.jpg) http://macg3.munkeby.se/bw/go/MM/ChangeMacMahonBars.jpg
http://macg3.munkeby.se/bw/go/MM/ChangeMacMahonBars.jpg![[ext]](http://macg3.munkeby.se/bw/go/MM/ChangePlacementCriteria.jpg) http://macg3.munkeby.se/bw/go/MM/ChangePlacementCriteria.jpg
http://macg3.munkeby.se/bw/go/MM/ChangePlacementCriteria.jpg![[ext]](http://macg3.munkeby.se/bw/go/MM/MoreAlgorithmOptions.jpg) http://macg3.munkeby.se/bw/go/MM/MoreAlgorithmOptions.jpg
http://macg3.munkeby.se/bw/go/MM/MoreAlgorithmOptions.jpg![[ext]](http://macg3.munkeby.se/bw/go/MM/Tournament-OtherOptions.jpg) http://macg3.munkeby.se/bw/go/MM/Tournament-OtherOptions.jpg
http://macg3.munkeby.se/bw/go/MM/Tournament-OtherOptions.jpg![[Diagram]](../../diagrams/11/539f25f5f2cca6461b703ebb3b5d3c52.png)
![[Diagram]](../../diagrams/23/dde25a31784b4a328fa02e644f470153.png)
![[Diagram]](../../diagrams/7/afb97021da8bcacf40ec6780fb029c5e.png)
![[Diagram]](../../diagrams/51/9f567616dbbe9dee57164fab76f72b0f.png)
![[Diagram]](../../diagrams/39/c07c0530ec09d1b2ccfad957d91a3a72.png)
![[Diagram]](../../diagrams/37/e77e5f43a0125fd9ddb0f71c1b6583da.png)
![[Diagram]](../../diagrams/11/1141a1a3ee19f0c373e50e7b24b74881.png)
![[Diagram]](../../diagrams/48/aa40a38e01ec488c4165080913527519.png)
![[Path]](../../images/path.png)
![[Forum]](../../images/forum.png)
![[HomePage]](../../images/homepage.png)
![[Diagram]](../../diagrams/28/b67f3d67bfa137afad4247c523056394.png)
![[Diagram]](../../diagrams/32/934d8713efb5a005bb2cc3ff2e795565.png)
![[Diagram]](../../diagrams/13/0f71f59d5e34686456c837e3fc27e5b8.png)
![[Diagram]](../../diagrams/51/1ecf0e3d13bdbfa36dccc9d848d979c1.png)
![[Diagram]](../../diagrams/9/f6f3d0e65cfac5827fe484298bdc9122.png)
![[Diagram]](../../diagrams/4/1f8b6bc0c66347af6f02577de041d6f4.png)
![[Diagram]](../../diagrams/15/e45903b4d233326b41d8dc59ac1927ba.png)
![[Diagram]](../../diagrams/51/e901077810c32176191033642ee0b6bc.png)
![[Diagram]](../../diagrams/7/b2f0ce2485cfee217b69750ee4426eaf.png)
![[Diagram]](../../diagrams/14/40bc8e1f7a30ac42dae6611d96b7e42f.png)
![[Diagram]](../../diagrams/7/ea4759f4431337dc77e06645c20f4266.png)
![[Diagram]](../../diagrams/32/296b9158f84b926fb2e8feb6dfd6bd6e.png)
![[Diagram]](../../diagrams/42/022d853584189fd1e0a0eb15a17380bc.png)
![[Diagram]](../../diagrams/3/d06d39809ff7fd5e96049e729d4c3c5f.png)
![[Diagram]](../../diagrams/22/3536c7efe4e42bfc806ce95185665c32.png)
![[Diagram]](../../diagrams/38/cd3859235c1f3742f49baa6f2238d1dc.png)
![[Diagram]](../../diagrams/3/438354a7d1fd569c0eb54d0c0a51b450.png)
![[Diagram]](../../diagrams/42/32a82b10721784eda7c20b7057e36cef.png)
![[Diagram]](../../diagrams/4/158d3f6b06ec6fb7928fb11439658a3a.png)
![[Diagram]](../../diagrams/19/e83faadcac00e5ce6323bcff9ec65cfe.png)
![[Diagram]](../../diagrams/51/5292fddb2ef29c73ca5eac281a747fed.png)
![[Diagram]](../../diagrams/47/81cb1bd6fae7053e655f5c173b9d9e08.png)
![[ext]](http://go.weiqi.ru/files/Photo.jpg/normal) http://go.weiqi.ru/files/Photo.jpg/normal
http://go.weiqi.ru/files/Photo.jpg/normal

![[Diagram]](../../diagrams/9/c49e888775178e6b2e455bf1474fe765.png)
![[Diagram]](../../diagrams/25/efdc360ff8669e6324cbd64eec1167f8.png)
![[Diagram]](../../diagrams/0/71a0354bcf461c87654c62de1a48f66a.png)
![[Diagram]](../../diagrams/10/d5cff93b4dc1e337b14125634d3eca28.png)
![[Diagram]](../../diagrams/2/9b682bcc68e6314fff51d8006e09f854.png)
![[Diagram]](../../diagrams/45/7b2c7597e3d18c032a9786738c928e5c.png)

![[Diagram]](../../diagrams/27/993bf896251eac4880e03b354a9957bb.png)
![[Diagram]](../../diagrams/25/b87382c137f5535423c37c7c1c68a937.png)
![[Diagram]](../../diagrams/21/9cd8f1f677c5d91ae1f2bca56f0a13d3.png)
![[Diagram]](../../diagrams/25/934377db18d508248a8c47e63efe3e29.png)
![[Diagram]](../../diagrams/27/db95b937047d2726778c2ea5f7e0bd23.png)
![[Diagram]](../../diagrams/10/d12381574db9959b734df1439bfca9a0.png)
![[Diagram]](../../diagrams/2/3ec1a9d3fb7ee0b15b2bb026daf05faf.png)
![[Diagram]](../../diagrams/0/4d005836d05a24edf260c0942ac5e011.png)
![[Diagram]](../../diagrams/7/c846bc41012a5480e0ad555b32c413ea.png)
![[Diagram]](../../diagrams/30/dd6034ab464529648db7df338944f1f1.png)
![[Diagram]](../../diagrams/34/7a86daf3f3dc78cb955e661e3090ea3b.png)
![[Diagram]](../../diagrams/38/7ba7f8b59cf64c93a8e0c64cf589d75e.png)
![[Diagram]](../../diagrams/45/b573f6415eccb54138110cd5b0f1481c.png)
![[Diagram]](../../diagrams/49/926d1390537ac9832c71be7a32131119.png)
![[Diagram]](../../diagrams/21/630c2856cd2649a6322b78dae3163253.png)

![[Diagram]](../../diagrams/3/e9800bef2b020adb67b0461aa98bdf39.png)
![[Diagram]](../../diagrams/42/2371b168eb08f95495492b132dab5692.png)
![[Diagram]](../../diagrams/27/8a2394ae9c3ed64e44a714340688e9b4.png)
![[Diagram]](../../diagrams/9/0f7c3f7906bc5a049ad68aa52d0d096a.png)
![[Diagram]](../../diagrams/52/bbf48e94c31bdb5101a4ff67d6658bd2.png)
![[Diagram]](../../diagrams/48/93d9474c2d540993f68cd7b33f2d676d.png)
![[Diagram]](../../diagrams/3/ef3727a2badbe2e56d8001c5e999acea.png)
![[Diagram]](../../diagrams/48/6fd4c9f0d3210fad58d634bb22b58b7b.png)
![[Diagram]](../../diagrams/18/6834ada012b9b577695da1e85417843a.png)
![[Diagram]](../../diagrams/45/5cc77ad8b419dadcf87e6500698aa5af.png)
![[Diagram]](../../diagrams/43/bf43a539a709256807156eac2d6dfcb2.png)
![[Diagram]](../../diagrams/40/aaaac853e845492bf28bb8f0c9ec8b96.png)
![[Diagram]](../../diagrams/28/ec907ec3d8215575bc95d9db9a38592a.png)
![[Diagram]](../../diagrams/2/0ad43344e5f7366576c940eef4ed27dd.png)
![[Diagram]](../../diagrams/17/ce49b94d6bc38347c5dd6e52a7b47557.png)
![[Diagram]](../../diagrams/48/23bdfaf4efbe645c989548f939db1893.png)
![[Diagram]](../../diagrams/17/3f1f0350ad1ab05d60aff1fee1bd784c.png)
![[Diagram]](../../diagrams/5/86a9382af78373a930c09a3fcb61b3bb.png)
![[Diagram]](../../diagrams/48/5f6710bb4c32262d9067afbd9a5000ee.png)
![[Diagram]](../../diagrams/48/b44a04dbf3fad4d7b0b5e5c81224d146.png)
![[Diagram]](../../diagrams/21/2399f8320151e60487482a9930b5b306.png)
![[Diagram]](../../diagrams/14/b247e9eb746e9c965cb300050d6d1bcd.png)
![[Diagram]](../../diagrams/25/923eb990c91c80dd51692006fa7f771a.png)
![[Diagram]](../../diagrams/11/153cff4da9213c7a78a504a2f1505d69.png)
![[Diagram]](../../diagrams/43/4aff755a7a4007af59f7abf8a11e58e0.png)
![[Diagram]](../../diagrams/39/e785027470e6b43e87232c976bc41eec.png)
![[Diagram]](../../diagrams/14/d1d6f92a74acfa349175f99f3e8323e0.png)
![[Diagram]](../../diagrams/4/ac49b16cf43ff4963209a53a4fd7ee17.png)
![[Diagram]](../../diagrams/4/839d71fbf473f0d2274baeb669574eec.png)
![[Diagram]](../../diagrams/8/0d32c306c542a11d0e8a42b1094e694d.png)
![[Diagram]](../../diagrams/36/55bf35bf37e52f4539e43ed20e921ca5.png)
![[Diagram]](../../diagrams/27/8a22642d6401138e7ca2b6160d009fb2.png)
![[Diagram]](../../diagrams/22/430c3535f7387b310a8963c5648e0dc1.png)
![[Diagram]](../../diagrams/37/fdb2e540583f1d24665200add71fd6fc.png)
![[Diagram]](../../diagrams/32/a18e7426d6a4a4e0609c9be9cab468f1.png)
![[Diagram]](../../diagrams/36/747fa96952ae29f3624e45aacfe7f2db.png)
![[Diagram]](../../diagrams/16/86c3fcdca0f037080dd2e3bbb32e81af.png)
![[Diagram]](../../diagrams/34/7d9bc2b4df69d83bb2a5cc3329705b7c.png)
![[Diagram]](../../diagrams/12/5174b18b28f2d16d89554712d667c5a1.png)
![[Diagram]](../../diagrams/31/4ee546f1cf148bc30fc4ef2290511b31.png)
![[Diagram]](../../diagrams/40/c742e7c12cb36340d247bbec592f3a65.png)
![[Diagram]](../../diagrams/42/a0d70b50d48579419df2dcee2f5951a0.png)
![[Diagram]](../../diagrams/40/6902b0b84596bb51e6663ec4aeada4cc.png)
![[Diagram]](../../diagrams/16/4c07a40b01fb8614b7c21d409e4805f9.png)
![[Diagram]](../../diagrams/4/70d2a4ea102c87dc815cd81e2f95c49a.png)
![[Diagram]](../../diagrams/45/c2944361fa6bb44d52afcd534a9f15f3.png)
![[Diagram]](../../diagrams/34/6f3927bae3336266bf49029a12a285e8.png)
![[Diagram]](../../diagrams/8/4948e98c7989c9b28478c0b7d13941cf.png)
![[Diagram]](../../diagrams/8/17e4d05946b7f590d43f5744f618044b.png)
![[Diagram]](../../diagrams/47/c4963593095ac7342ead6479be8385ba.png)
![[Diagram]](../../diagrams/47/6b04b9f4dca8a44799d3c44dc22b66d4.png)
![[Diagram]](../../diagrams/18/0e752c423e950b7ae9117157390996ac.png)
![[Diagram]](../../diagrams/48/0fb0247b51ccfa226d288244a2c968ef.png)
![[Diagram]](../../diagrams/28/6f0f7fdd6cc6bb2a1f76117fead97285.png)
![[Diagram]](../../diagrams/5/a2706c8f813a903db5609d56fec58061.png)
![[Diagram]](../../diagrams/5/b7612e71fe3b586c9eb64406adba6cd7.png)
![[Diagram]](../../diagrams/31/82d046f63fbc542b9d0316a479c43968.png)
![[Diagram]](../../diagrams/41/00fe773c8e836055ccccb62c35c0e5bb.png)
![[Diagram]](../../diagrams/50/123573b1ee8c3f8c625737001fe66ef3.png)
![[Diagram]](../../diagrams/22/a0c9ee3dbfb94b9968094717e9139a29.png)
![[Diagram]](../../diagrams/17/56f5d4a38e1a95378c5650c94234fa78.png)
![[Diagram]](../../diagrams/26/28a49823f0966ef0e10660dadab9ed2b.png)
![[Diagram]](../../diagrams/52/6574681fdb45280b55b25e9c44456b33.png)
![[Diagram]](../../diagrams/35/6664b3d655d45c03b9789898ef849a83.png)
![[Diagram]](../../diagrams/40/a37c2ee318e2c02c5295df10a428f097.png)
![[Diagram]](../../diagrams/47/baef09e85cf3a5a3059cdc2c5d6d677d.png)
![[Diagram]](../../diagrams/2/3f154df7d02a6401f5de08aa43a13794.png)
![[Diagram]](../../diagrams/48/2f734ef09ffe59c8fbc27c4ce680fb4d.png)
![[Diagram]](../../diagrams/23/acdd715a02a7acadf9e77c04678a5dcb.png)
![[Diagram]](../../diagrams/17/f2874ce1c6250627da22bf6ae5e9d0db.png)
![[Diagram]](../../diagrams/2/99e4a59924474c1c68fd614a7df138b2.png)
![[Diagram]](../../diagrams/3/e143bfdc10896617cfcce15d055ccd8f.png)
![[Diagram]](../../diagrams/25/bcb3042d03b9e2b412f2827cb66d32f6.png)
![[Diagram]](../../diagrams/21/9a023d6b2c18a5ef3f46367a7aef441f.png)
![[Diagram]](../../diagrams/22/b8b2c460ad1fa5c6014e5a474a6c7378.png)
![[Diagram]](../../diagrams/40/b1b6d743d7f64f70871fd4f86c568d80.png)
![[Diagram]](../../diagrams/37/ca5850b943b44e3de7cd58ff019c70ed.png)
![[Diagram]](../../diagrams/42/957e9e672227f3421cddfec561855051.png)
![[Diagram]](../../diagrams/50/c33dc98772c9d0d6760d6e0b3e51e7a0.png)
![[Diagram]](../../diagrams/40/7bf523db352b5cef2890f840c3ea134c.png)
![[Diagram]](../../diagrams/44/407f9ebe760d2e27e0dacb101902f1b5.png)
![[Diagram]](../../diagrams/50/3dd76f16e6e58854548179a9f39bc5c9.png)
![[Diagram]](../../diagrams/14/f798f7d5a556d082df2592347c16b889.png)
![[Diagram]](../../diagrams/8/bc301ce6e329be149b0488fecb831c1f.png)
![[Diagram]](../../diagrams/2/e82b4d7d1cbc2f88c1e083a47c6d0067.png)
![[Diagram]](../../diagrams/12/90c428202d0281cf30c57c4c59e21677.png)
![[Diagram]](../../diagrams/11/99faa89933670222779b33d0e3853551.png)
![[Diagram]](../../diagrams/3/0156d0dab0c4b4454cf18005153e519e.png)
![[Diagram]](../../diagrams/27/9d47e43e32d0f7ff88e6d1f5d1bfab75.png)
![[Diagram]](../../diagrams/37/cf052feacca03de239cb4dc81d9fd4fc.png)
![[Diagram]](../../diagrams/37/694c3014d8899970f3159bf91bc6e975.png)
![[Diagram]](../../diagrams/2/b97b7c7f00043fda9335b8fbd0483f45.png)
![[Diagram]](../../diagrams/52/7d8aec4a34bdfe0b8066638491e85f6d.png)
![[Diagram]](../../diagrams/24/8bafae1598cb0b98c42d9ec993e418c3.png)
![[Diagram]](../../diagrams/49/8e3e6cb725bc6a7761358f8d6e5e228e.png)
![[Diagram]](../../diagrams/13/921d0a188eea6c9dd40b2146bb489f3d.png)
![[Diagram]](../../diagrams/37/fea81f4ae281e7dc77196023e3e2504e.png)
![[Diagram]](../../diagrams/52/f72369bb1e9b73e747f3ea3cd8b3d87e.png)
![[Diagram]](../../diagrams/4/bfe076a26b552ca3e239406acdc19c4c.png)
![[Diagram]](../../diagrams/13/a5596e645ba5a0f21fbfbfe99b76ba9d.png)
![[Diagram]](../../diagrams/34/76c800ec2991c53dfbff06cfe51ae90e.png)
![[Diagram]](../../diagrams/9/5bd67200b4e9ce449804410c62eaec47.png)
![[Diagram]](../../diagrams/50/68cd9ea6b3305173978366643e4f79c5.png)
![[Diagram]](../../diagrams/26/3777cde2cf8413f0e8f3af54171ff6b1.png)
![[Diagram]](../../diagrams/1/7b8956fe51689b6fdf004e79ffb65de9.png)
![[Diagram]](../../diagrams/43/9191f6435ee8df114272a109f1571b6d.png)
![[Diagram]](../../diagrams/20/91b6f37fd67fb649bc13e9173ec23655.png)
![[Diagram]](../../diagrams/33/783c7a65c51a566ccfeb04d6859685d8.png)
![[Diagram]](../../diagrams/29/f7414e6231a9a9da26b0ef3fd9edab08.png)

![[Diagram]](../../diagrams/40/a01d7afec185ac962fdf914195c4066d.png)
![[Diagram]](../../diagrams/37/35a02a50882f809b96d14df998e89663.png)
![[Diagram]](../../diagrams/40/f806f388b276214bce8a9a4a1abf6945.png)
![[Diagram]](../../diagrams/4/1d3d6b88a9f404b1a0b2f9d295f980a8.png)
![[Diagram]](../../diagrams/11/1456bd3f7ef25a87a88eaaa46fc32f0c.png)
![[Diagram]](../../diagrams/22/3dbd262cbfc86d15c5ef9197d0cce09a.png)
![[Diagram]](../../diagrams/19/cdbcb34d85dc32bd6ff07dc2af46a701.png)
![[Diagram]](../../diagrams/42/2473c6f92b1296b4fc801e993e2d19a0.png)
![[Diagram]](../../diagrams/40/0ba56a34755652e284e9bfffadf4f4ad.png)
![[Diagram]](../../diagrams/24/33fc3cde06e08b4d9b3e6148b0e29ea5.png)
![[Diagram]](../../diagrams/48/ac9c8e5ef2a99c9d4f5f71b3b77c40f1.png)
![[Diagram]](../../diagrams/35/3d82b06c718d6a36359b538f934bf1dc.png)
![[Diagram]](../../diagrams/44/52cd87b869d4161d95e3ed0429dbafa7.png)
![[Diagram]](../../diagrams/26/89167256570a1b25a0632c9edac59686.png)
![[Diagram]](../../diagrams/47/2958011bc3a2914d773ed538be79f6d7.png)
![[Diagram]](../../diagrams/29/20ad7bc053e529d8b8f712f0348d0f49.png)
![[Diagram]](../../diagrams/13/d10639b8e18b7514d8d7c1da7047266e.png)
![[Diagram]](../../diagrams/15/18e7449f9abe89079f9a12d7f134da9d.png)
![[Diagram]](../../diagrams/19/54e43f88eb8ddf7669e78088cf9d5bd6.png)
![[Diagram]](../../diagrams/21/ce061c88a1d38725062b7ae8c4865ae7.png)
![[Diagram]](../../diagrams/23/e1e2f6276d2538da06f179087dee2a17.png)
![[Diagram]](../../diagrams/42/3c798b1f4adf0d8f405c8c4da35dfb94.png)
![[Diagram]](../../diagrams/1/2138951bc071630e7ec2727f3b4a0d25.png)
![[Diagram]](../../diagrams/50/41229c3b73f09024a987cd552f1dbedb.png)
![[Diagram]](../../diagrams/2/82f9da75ded9f2a8df9d9722c0ef0c25.png)
![[Diagram]](../../diagrams/20/31546c9163b8739ec88f21471748541f.png)
![[Diagram]](../../diagrams/32/75a86332f433ee98bba983177ce77756.png)
![[Diagram]](../../diagrams/5/e3ff630098337b083353dfbd6b7da1db.png)
![[Diagram]](../../diagrams/20/cf6dfef38885fcc4d58a0902bb300790.png)
![[Diagram]](../../diagrams/24/4d0201b111952886535238117c3768b9.png)
![[Diagram]](../../diagrams/16/7acd0aa0d80d48efcb8ac9d415c3577d.png)
![[Diagram]](../../diagrams/6/166091f5b16a4ebfd36da740bf7cae0b.png)
![[Diagram]](../../diagrams/52/d5d90a733a5c82cd20e5a541728410be.png)
![[Diagram]](../../diagrams/36/4a7b0b57706a8610fee30d0d641676c2.png)
![[Diagram]](../../diagrams/15/1040a48a71ffb01a03b76de614b3962b.png)
![[Diagram]](../../diagrams/28/ce18285f2607f6727c2545ebff120c80.png)
![[Diagram]](../../diagrams/16/8723b244a9bcd25db039c90f526b77a3.png)
![[Diagram]](../../diagrams/18/9ee2efe4fd936d45f6ef0faabc62c1c5.png)
![[Diagram]](../../diagrams/7/45ba99ec6e156df507943f88881e3836.png)
![[Diagram]](../../diagrams/48/e7635ea3946f08e6ef2ac26523abe710.png)
![[Diagram]](../../diagrams/25/0202a77f58b903ad35a83542e680efca.png)
![[Diagram]](../../diagrams/35/6c66c41d1bb6845b31a2c68e00384902.png)
![[Diagram]](../../diagrams/15/43c9251ac66b29d551813f746d727ab7.png)
![[Diagram]](../../diagrams/35/b2cb65f7c1a7ac9408714bf452206f88.png)
![[Diagram]](../../diagrams/8/1b3e131b6add16d60f5d24cfc834c519.png)
![[Diagram]](../../diagrams/31/17f6d6d2fbee7eeb1ac2284ca0f7cb9a.png)
![[Diagram]](../../diagrams/42/d605dcb24d9be6b0a29b5d81435d278a.png)
![[Diagram]](../../diagrams/14/d69410f08eb700991f2e28ca0c1744c8.png)
![[Diagram]](../../diagrams/31/d269838947b49e1fa9fc503cbd8b8c87.png)
![[Diagram]](../../diagrams/16/362af0fd2b15a946fa4966a78c54d871.png)
![[Diagram]](../../diagrams/41/293798750fa02846e2795d9f4a350c05.png)
![[Diagram]](../../diagrams/27/db0a43b5777bfe69e61f04a6fce55cf5.png)
![[Diagram]](../../diagrams/9/22cd0a99161b78c15951db05be61f481.png)
![[Diagram]](../../diagrams/24/76db1fc7a7d8afcd08e16ee39ff3b8ca.png)
![[Diagram]](../../diagrams/33/c65e8e678e69b8e1c19a2fa0a8d14e05.png)
![[Diagram]](../../diagrams/8/03bfed9f34e0f44ff603922bc7914e5b.png)
![[Diagram]](../../diagrams/8/92bc7484606d9f0bf02de622a50db611.png)
![[Diagram]](../../diagrams/35/338e41165e10ea4ed32f793fcf60ad00.png)
![[Diagram]](../../diagrams/25/5fc62c50319c0fe7d2957a2ad9038188.png)
![[Diagram]](../../diagrams/30/96c969652823cb4b084866a6284adfde.png)
![[Diagram]](../../diagrams/42/178f35ee8e7105d3b76204bd51dfe934.png)
![[Diagram]](../../diagrams/8/d6580d157219b14ec517c6f85d13d14f.png)
![[Diagram]](../../diagrams/33/ac9aebd5bf43ab48f9ebef5e06302623.png)
![[Diagram]](../../diagrams/30/5a819552ce9fa2a289647a1e2d3d2e9c.png)
![[Diagram]](../../diagrams/14/d869688ff92574366c090aaf07b41442.png)
![[Diagram]](../../diagrams/43/f505ca9b705211734c33e901c339e8b3.png)
![[Diagram]](../../diagrams/20/45847e780d79d83dee8b17e1a4e81fed.png)
![[Diagram]](../../diagrams/7/0564037c307e39c4c53c11cb53a321ce.png)
![[Diagram]](../../diagrams/5/dc5a4a484440adc181a3656fd742a970.png)
![[Diagram]](../../diagrams/43/ce3a20186367b7f785110a4d7c18b768.png)
![[Diagram]](../../diagrams/38/d9715da72dc2707be7b0d50b53b7d753.png)
![[Diagram]](../../diagrams/45/2110787bb9dd6b1af0f241cd129bf0ca.png)
![[Diagram]](../../diagrams/37/334b08253324621195ddfaf10139dbc6.png)
![[Diagram]](../../diagrams/8/a3e6f8fbc0616c1537a82177d42d4b35.png)
![[Diagram]](../../diagrams/21/01f5a5f624fb615c6aae80bba6f347a1.png)
![[Diagram]](../../diagrams/31/c60749dab405649e91f5850d8f2e57d5.png)
![[Diagram]](../../diagrams/16/2cd9c239b4b5e5e9d19d7f06c9082aed.png)
![[Diagram]](../../diagrams/14/451ec7224ef179b899fc4998cd2edee0.png)
![[Diagram]](../../diagrams/25/bec1887cf913eb25da5de5e37a519b90.png)
![[Diagram]](../../diagrams/18/3d27a4c807f37e859f2b35fae7ae34a5.png)
![[Diagram]](../../diagrams/51/20118de1eef8a7dbacfe5c0f7c039437.png)
![[Diagram]](../../diagrams/46/732b2d6b52b890a4edfd01ba5915fed2.png)
![[Diagram]](../../diagrams/18/e070af0c8075867ccefee3a0f5d285b1.png)
![[Diagram]](../../diagrams/20/a8bf18e286c13239756d0395c2442ebc.png)
![[Diagram]](../../diagrams/29/8ff3756954d806fd822309373672843c.png)
![[Diagram]](../../diagrams/25/5d85f395ce33dcdaae798acc5c5393cd.png)
![[Diagram]](../../diagrams/27/59b4e2d56b3fd820049d9fba065ee288.png)
![[Diagram]](../../diagrams/7/0220e24dbb02bada906b8f8b8d440e9f.png)
![[Diagram]](../../diagrams/6/75b4e8152439940397e0f5fafa9e9342.png)
![[Diagram]](../../diagrams/24/2dddb95c94e6b93674b839c571157c94.png)
![[Diagram]](../../diagrams/8/690d884dbecdbb8f0a2e885919eeccf8.png)
![[Diagram]](../../diagrams/26/a679526aff9cb257c8f2ad2e3dd77e5c.png)
![[Diagram]](../../diagrams/49/71ee7ca7ce16a1b384422b79ac399b1c.png)
![[Diagram]](../../diagrams/26/04f38982a4fb18adf9be8870c0724409.png)
![[Diagram]](../../diagrams/11/e42ec9ff0b8839b2e1bbad0aee9d5fc0.png)
![[Diagram]](../../diagrams/6/e7de3cac9600ebbb73ef9a9ee17ec9d9.png)
![[Diagram]](../../diagrams/0/4c24c1638ce4a9a4caccf85fcb857a03.png)
![[Diagram]](../../diagrams/3/127998695887a9bc814b84b7e682dbc2.png)
![[Diagram]](../../diagrams/24/1c5b0650af1094af120bd208640da0d6.png)
![[Diagram]](../../diagrams/5/f34e1758f431ea79cf6ac3501b9ac920.png)
![[Diagram]](../../diagrams/39/298ec9420cf660ab4ca18fc7a7961bc7.png)
![[Diagram]](../../diagrams/52/1cb40f3a3072745d796e3aa3235565a5.png)
![[Diagram]](../../diagrams/37/494fc78f655b7b53d9f577f4ff038670.png)
![[Diagram]](../../diagrams/22/358db0371e9ba6e0f0ab8ebab73fa2f3.png)
![[Diagram]](../../diagrams/44/047bc8a2ed1b113d7f65577359eb3e7a.png)
![[Diagram]](../../diagrams/45/ab88bdd7d9cb1d48f9cdb0542b18b5d2.png)
![[Diagram]](../../diagrams/31/be154d6a8691fd82815a44ab9eb0b562.png)
![[Diagram]](../../diagrams/44/79b706da07523e421bf01b162e4786e9.png)
![[Diagram]](../../diagrams/33/ebf85ebddc4fbd9dff821ba50a138d30.png)
![[Diagram]](../../diagrams/30/e5c580b0c5dbb731b28e7cb6973b974d.png)
![[Diagram]](../../diagrams/23/43f4bafbcdfbfbbcee474143f61b4e9d.png)
![[Diagram]](../../diagrams/17/94eb5017072bcdf6637c0c03817b5cb6.png)
![[Diagram]](../../diagrams/13/26b571ba0af25468c580942de2198e5c.png)
![[Diagram]](../../diagrams/12/5a2b7325750dd2e2f560ab04d137322d.png)
![[Diagram]](../../diagrams/12/03fcb4a0608be78a234991126463cb73.png)
![[Diagram]](../../diagrams/24/58518c6173b441ffdc2329ee8683ace5.png)
![[Diagram]](../../diagrams/10/a87fbba19ab4f6481df0dd097b37ee5a.png)
![[Diagram]](../../diagrams/20/b3543586c9c71fb312b271f58739840a.png)
![[Diagram]](../../diagrams/25/8991a099e0fd01ae07b314be36b22117.png)
![[Diagram]](../../diagrams/37/a11dd7c6a6f02876abedf20a4b3dcb67.png)
![[Diagram]](../../diagrams/47/dc5cd175f27123becfd56b56712bef9e.png)
![[Diagram]](../../diagrams/24/d82ce7f87c020fe09bd2630a69ccbb3f.png)
![[Diagram]](../../diagrams/31/eef894f5e724161396f1935deaf442e6.png)
![[Diagram]](../../diagrams/22/2cb2fcf8cf7ebd058f9ee535c0c54e8b.png)
![[Diagram]](../../diagrams/16/4619ee0d91957f16a0ccfa07c9bead48.png)
![[Diagram]](../../diagrams/11/cced3ac7e8a7492c907de7713756eac5.png)
![[Diagram]](../../diagrams/34/bd83f3793729000da8ed325b9b5fff95.png)
![[Diagram]](../../diagrams/51/337b6eeb4d4f513c29c77154e7021a8f.png)
![[Diagram]](../../diagrams/20/e947fe98851fb4be0352cabf5a8e2bbe.png)
![[Diagram]](../../diagrams/41/20edf7d304efcbfeb3e0c2623e40ad05.png)
![[Diagram]](../../diagrams/36/31dc6437d45f882297d5eda2ae89b7f5.png)
![[Diagram]](../../diagrams/39/bbfbcebcf965d7d3b5d10c8fb6999756.png)
![[Diagram]](../../diagrams/34/830f4333d9986d92558d9ffb92fc17c1.png)
![[Diagram]](../../diagrams/39/5fa7b230f65e696aae0e1eb0f338e5ca.png)
![[Diagram]](../../diagrams/18/148f806ba0cf410b63a4be2a55ed8b67.png)
![[Diagram]](../../diagrams/48/2039945063682651372bf25f04aa3e58.png)
![[Diagram]](../../diagrams/1/c8137074f40dbfcd86ac106c5f70fef6.png)
![[Diagram]](../../diagrams/29/3109ff9c91923406b8b4406c488425a6.png)
![[Diagram]](../../diagrams/17/3a48f6ac3fb906c2e80389f84803e0d7.png)
![[Diagram]](../../diagrams/1/d8d96728d541f91541edfa85d255365a.png)
![[Diagram]](../../diagrams/32/ed976238c0a4f4f88bf02c4e4a4631e0.png)
![[Diagram]](../../diagrams/3/c2957db361df3b8069831cb164b1fdcc.png)
![[Diagram]](../../diagrams/4/7cf89ed268f57937cdb5783932fab292.png)
![[Diagram]](../../diagrams/37/2328a41504beaeacde67db29a73e7ba3.png)
![[Diagram]](../../diagrams/30/bc1707ea15271ca95a3ee480320c2f53.png)
![[Diagram]](../../diagrams/5/d7af75069a734432ff4910523700f1f6.png)
![[Diagram]](../../diagrams/44/cca24ff1f61ba8d3dd4a6b3243fbc72d.png)
![[Diagram]](../../diagrams/10/1d3b28c68e388aad5cedea9b5e0c5f5b.png)
![[Diagram]](../../diagrams/50/6d261a5a1b83c73cefb6a314bf8a2a28.png)
![[Diagram]](../../diagrams/12/6e3cb32b13f5f3cd62a8347935af6ae6.png)
![[Diagram]](../../diagrams/3/53b1be7b71804fd067184adaef1ca578.png)
![[Diagram]](../../diagrams/20/06b43713c6a60258fc37c9c8875e0144.png)
![[Diagram]](../../diagrams/16/55c8f8fff676cf40241d75958a14bc89.png)
![[Diagram]](../../diagrams/6/d8e90f5f253872ff57deb86d6333b805.png)

![[Diagram]](../../diagrams/24/02575827b6b26693ebc2920c75454c34.png)
![[Diagram]](../../diagrams/25/33330493f6a0d2cf00c6a506a9240d0d.png)
![[Diagram]](../../diagrams/28/1e55e41d449e8475bdedede00d341084.png)
![[Diagram]](../../diagrams/38/c87cb2a647448ebb232a0099448a5326.png)
![[Diagram]](../../diagrams/21/1b63e84bca0f6a32d3dcb480e3e8ac4e.png)
![[Diagram]](../../diagrams/5/d7a98c4f9e40f21457acaaf085326418.png)
![[Diagram]](../../diagrams/38/40d99316f7610f3e17f0a2c1e1f3fc33.png)
![[Diagram]](../../diagrams/23/bb23b4fb446377fd1b0464d526d869fc.png)
![[Diagram]](../../diagrams/23/8847497dc7813adf0739e1e268122f1a.png)
 To see what
these functions look like, I plotted the KGS, MLRate, and AGA
functions as solid, dashed, and dotted lines, using their default
parameters (k = 0.8, s = 4/19, px_sigma = 1.04).
To see what
these functions look like, I plotted the KGS, MLRate, and AGA
functions as solid, dashed, and dotted lines, using their default
parameters (k = 0.8, s = 4/19, px_sigma = 1.04).
 One question is whether these probabilities are a function of absolute
strength. One dataset is the
One question is whether these probabilities are a function of absolute
strength. One dataset is the
![[Diagram]](../../diagrams/35/6d436717b4bca3ce4ef62fab34f4d383.png)
![[Diagram]](../../diagrams/38/1d4b8485267fa6d6a910a57ea342fbcb.png)
![[Diagram]](../../diagrams/35/e225313b27c5dce696cfdfb040bb9145.png)
![[Diagram]](../../diagrams/34/9f3cc56002193588364ffa026b010636.png)
![[Diagram]](../../diagrams/14/f290551abe4e857ae7fbcc42107c6f36.png)
![[Diagram]](../../diagrams/34/d6496b97904dc701845752e981ca35a2.png)
![[Diagram]](../../diagrams/19/728c172451ce8f4e28a4cd34771d98bb.png)
![[Diagram]](../../diagrams/13/49ab94eb8e18a987d3284ad447c59c39.png)
![[Diagram]](../../diagrams/23/42c139a268ec9a7f60a9ff6a976e6374.png)
![[Diagram]](../../diagrams/47/dc3d68471833b7cb815b4c2db473c430.png)
![[Diagram]](../../diagrams/47/e50d889648433ea1cd97ea4a9843eff9.png)
![[Diagram]](../../diagrams/17/f253d8f162028153d838c335452ea43c.png)
![[Diagram]](../../diagrams/17/8a733068acf11309c81056522a621f26.png)
![[Diagram]](../../diagrams/52/f7e6e924bbab7e9a79f7bc5983f746bb.png)
![[Diagram]](../../diagrams/16/88b54c3d5be7350baebb44caed72ec92.png)
![[Diagram]](../../diagrams/25/cfcdff7369de12b27d250986a470b7ef.png)
![[Diagram]](../../diagrams/41/5c1bad59d4c9fdf3e5d223856c52a29c.png)
![[Diagram]](../../diagrams/9/872054a605f85c7688746f03345974e4.png)
![[Diagram]](../../diagrams/47/bc7ddbe69471d7690d32c2f44afd3c11.png)
![[Diagram]](../../diagrams/21/f58cd674fc8c9bdb72bccaac535e12e1.png)
![[Diagram]](../../diagrams/31/57d78cf0d5b21be1e944751ed5a332e6.png)
![[Diagram]](../../diagrams/31/9ae416dd6105437a2cac538dd8137bd2.png)
![[Diagram]](../../diagrams/5/362c832f71b8d0d1e2a8043e950d8b13.png)
![[Diagram]](../../diagrams/2/1fdf5afbbb93782c2d71ad2793811482.png)
![[Diagram]](../../diagrams/11/89d3bbf27954a7ac211f5782da1542df.png)
![[Diagram]](../../diagrams/26/2afe1da7c96588642d6c52181598cfbf.png)
![[Diagram]](../../diagrams/45/e7b9b57bb7d7a344273843ec73a81aa5.png)
![[Diagram]](../../diagrams/22/0843a35d02c4e3622e5954cbb0d623e1.png)
![[Diagram]](../../diagrams/43/e8fdfd0039576134b696547fd5d3f541.png)
![[Diagram]](../../diagrams/6/a3896f407bbd067b33e8c5454b5862e9.png)
![[Diagram]](../../diagrams/8/44bfb7994f5110b9af8068f51686528c.png)
![[Diagram]](../../diagrams/28/7c062e0a72ec95337a678b33fff53afb.png)
![[Diagram]](../../diagrams/31/3497a7d83d20c8e64aa14102ba16086b.png)
![[Diagram]](../../diagrams/7/9472641a75beb7872e2096dc53e8548f.png)
![[Diagram]](../../diagrams/29/02a7f25bb33af44a8302ddeaa63e0c44.png)
![[Diagram]](../../diagrams/11/80525b2c44023da63ff2f671e5c5d642.png)
![[Diagram]](../../diagrams/31/2bf02148b1c6ea98606c2bf2679f2a5a.png)
![[Diagram]](../../diagrams/26/2d797594e720ec08f2f2475d61fa7fb4.png)
![[Diagram]](../../diagrams/50/0e4c9e5dc5ce5585961ddec3a43e39c0.png)
![[Diagram]](../../diagrams/8/e629bde394de6b7f369882d65439b46d.png)
![[Diagram]](../../diagrams/13/a1cf3cd209e4d7626deafb3d7228ef84.png)

![[Diagram]](../../diagrams/24/5965b711e042ed7aca3a9f310acca860.png)

![[Diagram]](../../diagrams/22/27c6bf83bac3b98f8fa74b561031d25e.png)
![[Diagram]](../../diagrams/50/d9ab8456a1be7819d308f64c2c9dc4ad.png)
![[Diagram]](../../diagrams/28/ebb1bbd242df94c59c302a1b3e619d4b.png)
![[Diagram]](../../diagrams/47/4a93d9bfd39cb0571d678ce68f30d17c.png)
![[Diagram]](../../diagrams/20/ce83317936ecd337f080634a9e9a2c42.png)
![[Diagram]](../../diagrams/14/461ca531546b706771a34e5fc1dd2453.png)
![[Diagram]](../../diagrams/12/a60fe29ebac6843af28955528a9a2286.png)
![[Diagram]](../../diagrams/21/3a05cb85d1b0c2f64e34272c4ce3efbb.png)
![[Diagram]](../../diagrams/19/5549a147dd56f1a7c62968bab64daef2.png)
![[Diagram]](../../diagrams/0/685946a955f1e185bd021e04ed4540b3.png)
![[Diagram]](../../diagrams/30/2e68504dc42e577501b4e7fc6a103a91.png)
![[Diagram]](../../diagrams/47/0f428df8873370bf614befd4f2f0ba9f.png)
![[Diagram]](../../diagrams/15/584dbce7818d32aa2c94c59feb7ac887.png)
![[Diagram]](../../diagrams/38/6ec218483770be75f1ae682d33fc2d13.png)
![[Diagram]](../../diagrams/16/f0394c627b59bcba3df9be97d6769ce2.png)


![[Diagram]](../../diagrams/44/3c4835ec5ac88d6f0f289bbf4e427da7.png)
![[Diagram]](../../diagrams/41/b20a6ef800b3ca9436156729a53f20e6.png)

![[Diagram]](../../diagrams/28/82c3b13ba2b2e8094d4ed92494faa424.png)
![[Diagram]](../../diagrams/24/cbb89d0e70948954dcb005aa7ca82b99.png)
![[Diagram]](../../diagrams/35/ad6aebb838886e31afa63a9cce9d2991.png)
![[Diagram]](../../diagrams/41/9f79d4ec7778c3fd2d07f0328f723014.png)
![[Diagram]](../../diagrams/32/e1a3817f493a02b0e4c863fdd1d0a8c1.png)
![[Diagram]](../../diagrams/34/8ce19e49d9c6ef157a7ded84acfdcfaa.png)
![[Diagram]](../../diagrams/28/b41b2fa8db3a7a4defb50e12f05c625c.png)
![[Diagram]](../../diagrams/23/2dc1f7721981abcebd5f4843fbd80a50.png)
![[Diagram]](../../diagrams/17/9dce6e4e71a09a1881619ad16f6b2795.png)
![[Diagram]](../../diagrams/38/dd77642fd260a7b3ede23d4d03bfeb9b.png)
![[Diagram]](../../diagrams/35/91f5c3a17b53a34992f71afba051e3fc.png)
![[Diagram]](../../diagrams/24/ff7d74023195e58b61a9bbf9b216a9eb.png)
![[Diagram]](../../diagrams/50/25378797d8d48a40b5af40afcc1ddc50.png)

![[Diagram]](../../diagrams/32/72537dcedef01e8f95ffe358f90b61a0.png)
![[Diagram]](../../diagrams/12/a040ef808fd4567031e9aa9e287b1c32.png)
![[Diagram]](../../diagrams/10/243ba2381f35a03acf5ab15511f2d06b.png)
![[Diagram]](../../diagrams/23/7622cd1e8192a1d827fb00c56e633675.png)
![[Diagram]](../../diagrams/29/99acd9138a545e655b4a07683e6272aa.png)
![[Diagram]](../../diagrams/1/d67025e322400dbedffd6999d1ed5453.png)
![[Diagram]](../../diagrams/9/57d0464c9e5d9b684e6c3b8a3e76f4fe.png)
![[Diagram]](../../diagrams/51/d0181426e8c04f4cc8af1d7af6661116.png)
![[Diagram]](../../diagrams/49/9772c364adee2aaee9bc4d5be81ff8c4.png)
![[Diagram]](../../diagrams/52/ef530169bea3db1f24667ff949076fac.png)
![[Diagram]](../../diagrams/14/4b663e263d63910997c6a12c2b475ed1.png)
![[Diagram]](../../diagrams/51/9aa5d9ba06cc09d93d00aa892e41af6d.png)
![[Diagram]](../../diagrams/0/09b780a8947c31ad223e6acf9215bfe9.png)
![[Diagram]](../../diagrams/38/0cf115b30f8db61c69ab89e6bde6571d.png)
![[Diagram]](../../diagrams/6/f0b046a6101c79fa0280791717bea3d3.png)
![[Diagram]](../../diagrams/51/a3a5ef779b5b4e761c07d70cda4a5e97.png)
![[Diagram]](../../diagrams/26/1aec17de29dc5f1ab6593bd2d32a4e43.png)
![[Diagram]](../../diagrams/36/6fe9cd14ab1a683e6e80ac4008f2d46b.png)
![[Diagram]](../../diagrams/25/fc5af4ebcd4b17a7e3ff3fb3a95ff202.png)
![[Diagram]](../../diagrams/47/b08531ef7c18a7679bf199ac4dd633c5.png)
![[Diagram]](../../diagrams/40/0bf7c6493068cddd7956e64380102681.png)
![[Diagram]](../../diagrams/24/4372e3831f09f8a91e1716f8a55b4822.png)
![[Diagram]](../../diagrams/35/f81fa6773bb589aa6656f4dcaf9aa31a.png)
![[Diagram]](../../diagrams/51/21c41e8a9cae0f574a3bb57ba0b5347e.png)
![[Diagram]](../../diagrams/26/ff1c790d038748358c9e6f0d753ca9a3.png)
![[Diagram]](../../diagrams/40/fbda413c20f257d9116df2565c0ea9e7.png)
![[Diagram]](../../diagrams/41/2a16316988ec6580f221907ccaf9f24b.png)
![[Diagram]](../../diagrams/7/0ec87ec9c9f3f089fb8aca9b93ec189a.png)
![[Diagram]](../../diagrams/37/a735584209117a12e0361e288f2cbd4d.png)
![[Diagram]](../../diagrams/15/8c7c9e9964bf048c47603ade46a35ae1.png)
![[Diagram]](../../diagrams/23/adc8bf1e55e1ddc8e524f27a155c07bb.png)
![[Diagram]](../../diagrams/26/d4acaffb86016162ac7d45c393ae69af.png)
![[Diagram]](../../diagrams/25/50ff5503c22816560c04843dc8422193.png)
![[Diagram]](../../diagrams/29/f3ff080c039ccc4d71b467a66ece97ad.png)
![[Diagram]](../../diagrams/25/3261e4ec7c04f5d31cba04c7e5019ffd.png)
![[Diagram]](../../diagrams/33/049db57bd115f0a1bc5e1a8a1603a1f6.png)
![[Diagram]](../../diagrams/13/fa8332102432f1d14db26fd275ff6176.png)
![[Diagram]](../../diagrams/43/edff82ab9aa00800c6b73efddbc60e8d.png)
![[Diagram]](../../diagrams/19/262dcd6011ca0ddd25dd39aba9937450.png)
![[Diagram]](../../diagrams/41/92c2d44efb47fa028ac297148bcc0940.png)
![[Diagram]](../../diagrams/34/6fbb240d3da8fb19b6f88c72d51a9237.png)
![[Diagram]](../../diagrams/12/22ee9ae45729d937218a43dbfbf135b6.png)
![[Diagram]](../../diagrams/26/de35a87511c1f7195ec44d52c6e3af82.png)
![[Diagram]](../../diagrams/1/2fe28d94696b301c83a6ae855f341535.png)
![[Diagram]](../../diagrams/34/cafe7d4a66f60f5d1cd0f008625c5d21.png)
![[Diagram]](../../diagrams/30/f761ceacb422144c2d76ab13de05b4da.png)
![[Diagram]](../../diagrams/26/85a5bd9b6dd1b124774f3f7e9a4c3e9c.png)
![[Diagram]](../../diagrams/1/cbea4fb8cb81688d1470b24a0a195c5e.png)
![[Diagram]](../../diagrams/34/2523ed7c7c2979c5377562445ed7750e.png)
![[Diagram]](../../diagrams/28/f3fab9870de62f469b13a2cf8b320915.png)
![[Diagram]](../../diagrams/0/b004c8dedc9f25561de46eaabba8c342.png)
![[Diagram]](../../diagrams/18/9ad67172c948ce86a6cfd89016e99c31.png)
![[Diagram]](../../diagrams/26/5f627d4d66dd6f9cd9d11aef0fc49a80.png)
![[Diagram]](../../diagrams/20/50f4dd6ad4b230742466e52c7d5dc9ba.png)
![[Diagram]](../../diagrams/13/6a893811842fa5011bbf44c4a2561274.png)

![[Diagram]](../../diagrams/28/fcb065ae7d92c289e9aea6a7bafd1051.png)
![[Diagram]](../../diagrams/2/8e7300466aeb312f7820f975a7a81617.png)
![[Diagram]](../../diagrams/27/f91560fe777dc4dd7ae3d4919afdbcf6.png)
![[Diagram]](../../diagrams/25/f3c0a5b6eda1079e9d04b33419bf2049.png)
![[Diagram]](../../diagrams/47/51bba7dead8ab847ca1865ffad2f1624.png)
![[Diagram]](../../diagrams/1/87d9da6a3cf34b2595a475afe800bd1b.png)
![[Diagram]](../../diagrams/47/6e540882bc233af48f5b68a50575c3d0.png)
![[Diagram]](../../diagrams/48/e197aca76bf4925f7af782b4d55a0809.png)
![[Diagram]](../../diagrams/47/7ca6585d421ef9b7322e7f5c3611ede6.png)
![[Diagram]](../../diagrams/14/a52553ed4fce674be0f54ef9194f70b0.png)
![[Diagram]](../../diagrams/38/6fc2c764693807ebacae56899d3cffe5.png)
![[Diagram]](../../diagrams/51/a3dffb98f4aafcfbeac3b77af57d7efc.png)
![[Diagram]](../../diagrams/24/ea24ae0947431af95ca4fdb8e27a7cd1.png)
![[Diagram]](../../diagrams/31/cd15d7f75d9b0d96ededcfbf843fc05c.png)
![[Diagram]](../../diagrams/9/1c06bea6917377f9505e124c277b9e3e.png)
![[Diagram]](../../diagrams/27/ea71e6c1a77c8f7399ff5914ca6ed92c.png)
![[Diagram]](../../diagrams/48/20952f0e7bc73dbfe3b182a51a75a66d.png)
![[Diagram]](../../diagrams/50/414c76704683e6eed25d242a51699005.png)
![[Diagram]](../../diagrams/28/4dfb0a3ea0f79a3cccb9792ffb7cb2ea.png)
![[Diagram]](../../diagrams/3/84de121604ef730e6e2a7d7796ed188e.png)
![[Diagram]](../../diagrams/6/80dfe488d860a7be4148448f8dac0208.png)
![[Diagram]](../../diagrams/40/36acf9415a0ac2a1a6cad1b4626fdded.png)
![[Diagram]](../../diagrams/31/27c414a850e06645e28f714702d255fe.png)
![[Diagram]](../../diagrams/45/08bc64873f359fff3abd38369919db79.png)
![[Diagram]](../../diagrams/24/149a6cd6b0f0556e6cb88eb2c6a9c1bc.png)
![[Diagram]](../../diagrams/44/72e4ac93ca4a5f95de08de401127aeb7.png)
![[Diagram]](../../diagrams/5/82daef26ac65817ecc5c60525f5f5003.png)
![[Diagram]](../../diagrams/14/3e47f55ed8f8e3945024e208c171fc2c.png)
![[Diagram]](../../diagrams/52/a9cce635cded66dea68c8aa966ca0f10.png)
![[Diagram]](../../diagrams/7/a6740b661187c2b59315aa14705453c2.png)
![[Diagram]](../../diagrams/27/9015ec238b12b133143b3741eec85f06.png)
![[Diagram]](../../diagrams/8/62035e4363461e7fde15f5a66b882ab8.png)
![[Diagram]](../../diagrams/21/93017ac27f07066e60b2be7488b0bf78.png)
![[Diagram]](../../diagrams/6/183fe9390158d2f7e126513c68c13d94.png)
![[Diagram]](../../diagrams/16/8d7552aac9cdfad1ab83c5a2575a5a8a.png)
![[Diagram]](../../diagrams/28/a24f1b653795c3e56cc16f1fcfde8521.png)
![[Diagram]](../../diagrams/17/9cf22dd09d1927eb7a7c28f87ed99f50.png)
![[Diagram]](../../diagrams/20/031f1ba8f6c671a7d9c9ad0c569ecda8.png)
![[Diagram]](../../diagrams/18/010e8217f1fc366b5a3ad90b180bf893.png)
![[Diagram]](../../diagrams/43/88f869075efc42350658fa2ed29db707.png)
![[Diagram]](../../diagrams/37/5900a89a9923a9f90925eeb6759fcd02.png)
![[Diagram]](../../diagrams/27/06f26a48b2a03a4fae03d7a6837921ca.png)
![[Diagram]](../../diagrams/35/fa1451e4e5b0d9f81d8825bdff4380ba.png)
![[Diagram]](../../diagrams/36/82849d3646c2a14258615ee082b74dac.png)
![[Diagram]](../../diagrams/20/ed1b8d8200118cc803cd8fb7bcf1d7db.png)
![[Diagram]](../../diagrams/24/21bd76f69ee1e8265788a3d589cb97c9.png)
![[Diagram]](../../diagrams/7/a82447089483e5e68c837bd4931346d8.png)
![[Diagram]](../../diagrams/8/ed1b10fa97a21958104dd0c516f11840.png)
![[Diagram]](../../diagrams/42/e925f8880166b6e6dac385e6663fa90e.png)
![[Diagram]](../../diagrams/30/7da9caf111299479e557fd69f2e37a11.png)
![[Diagram]](../../diagrams/38/464c9e983b12a1855495223f5ec4234c.png)
![[Diagram]](../../diagrams/42/8e49c64a08434cdfb68cd7a71f8fed93.png)
![[Diagram]](../../diagrams/24/48aa9bb44920e3be77da2545123f0f8e.png)
![[Diagram]](../../diagrams/18/310322eb580ec93a768e8e48961067a2.png)
![[Diagram]](../../diagrams/6/0216202d052f6c76613c2932eaf37ec9.png)
![[Diagram]](../../diagrams/2/2c841155ef4853441e2024c53cc942cb.png)
![[Diagram]](../../diagrams/50/7250c8734642561be86d93f7df8c9dcf.png)
![[Diagram]](../../diagrams/45/c57d972ba7f85e826fc8d14ab647c227.png)
![[Diagram]](../../diagrams/30/17a56510ad9f548dc67c4c87b64bd097.png)
![[Diagram]](../../diagrams/18/e7f27713adfa3484f1e7a6692572036e.png)
![[Diagram]](../../diagrams/12/320c1a2ad37886a423eaa040e7533fa5.png)
![[Diagram]](../../diagrams/31/5febb0e135fafb7f5a2cc8ab9eb0ed82.png)
![[Diagram]](../../diagrams/47/fb9005e93bfdb4908803c73479eca7b0.png)
![[Diagram]](../../diagrams/1/c5a96506acdb5e276f7e24f6dce3dcba.png)
![[Diagram]](../../diagrams/26/ef571c7fc9b770a9f3c666c98a4b569b.png)
![[Diagram]](../../diagrams/2/bc03b391ed8890d2a7e2c88c17674f29.png)
![[Diagram]](../../diagrams/30/e7241e31b854cc009d500dd73a111d61.png)
![[Diagram]](../../diagrams/31/4e7089ad331e3429489ff20d39a67eb8.png)
![[Diagram]](../../diagrams/45/b9f033e5835ef3a9a809df7fc69b34b6.png)
![[Diagram]](../../diagrams/21/466025bd818614638c297dbcb97c38a4.png)
![[Diagram]](../../diagrams/52/4b6bb44d50b97f4ee41e2e96d3a36a94.png)
![[Diagram]](../../diagrams/18/a3a7354a0b138609cf9452890254e479.png)
![[Diagram]](../../diagrams/13/bad42d9240b66c4191aaff6f835b6fcd.png)
![[Diagram]](../../diagrams/51/d63d19936e7aca16199b94d204d7a2b1.png)
![[Diagram]](../../diagrams/27/63ffa81aaedf49b7e53f8fd68a75d402.png)
![[Diagram]](../../diagrams/31/7bdea89900eabef6147f1846b3e1060a.png)
![[Diagram]](../../diagrams/52/6723651eeab4771bb2be5aab6d543e00.png)
![[Diagram]](../../diagrams/25/53befed1ac8c350f189b9309a24a0f75.png)
![[Diagram]](../../diagrams/43/0100fd91d8c3dd22db3e5023f8ec5a1f.png)
![[Diagram]](../../diagrams/48/4c6dc61974afd87066815e13036579a0.png)
![[Diagram]](../../diagrams/6/9fb7569a2e769572ed87f206f710b5da.png)
![[Diagram]](../../diagrams/4/4179565cbe961b0450b66f06e1077ebb.png)
![[Diagram]](../../diagrams/28/2b115b10513b3226dce93833c5cbaec9.png)
![[Diagram]](../../diagrams/24/0d748cb561c34072477a451c9a9a08ce.png)
![[Diagram]](../../diagrams/11/5226a5faee3b56bdb7ec30e71405b13e.png)
![[Diagram]](../../diagrams/20/9ba79a6224b4ae483eb306904b00e06c.png)
![[Diagram]](../../diagrams/10/daf5c3b4940bdef9b38367a51658052d.png)
![[Diagram]](../../diagrams/14/64bc14a7e4fbedff17a245b65c0cd273.png)
![[Diagram]](../../diagrams/46/2645917d733bf7a35dc90b9d66707edf.png)
![[Diagram]](../../diagrams/40/3af41c715cccfa672e52764821d18e82.png)
![[Diagram]](../../diagrams/51/5f1f772a62d5478eac75a8803ab20a6f.png)
![[Diagram]](../../diagrams/21/86d8fe17fbb0b231c2e02d11229c0ca3.png)
![[Diagram]](../../diagrams/31/9c809a22251541613837c33356b5a19a.png)
![[Diagram]](../../diagrams/42/b668ea028ac54d014cf0b54734c869b9.png)
![[Diagram]](../../diagrams/47/5e7e94ee73399ad574189d9615211c0f.png)
![[Diagram]](../../diagrams/33/cfa60c096e8c1d9ef0de9d581ec11fdd.png)
![[Diagram]](../../diagrams/2/db520fe432d7c9f6385181effb92d8fe.png)
![[Diagram]](../../diagrams/1/bd246a997a53440c897f19ca10188a4b.png)
![[Diagram]](../../diagrams/42/b1a07334556e9956a927ae67e7cfec26.png)
![[Diagram]](../../diagrams/44/240411c7f98df6e37526d3269e4a3643.png)
![[Diagram]](../../diagrams/4/e9c919453a23f8ac397bfcec848c0d07.png)
![[Diagram]](../../diagrams/38/ca79faa1c91e7dd675e84bf1e67109e8.png)

![[Diagram]](../../diagrams/27/a8b347b0908d66e6aa011e0b1e9874e0.png)


![[Diagram]](../../diagrams/36/0edfb979fa0740cb4fbc9bbae8d818c0.png)
![[Diagram]](../../diagrams/46/e2239748865ecc67a5a2df05189aee4a.png)
![[Diagram]](../../diagrams/52/2cb724981b5d017c6890d5b01a63798d.png)
![[Diagram]](../../diagrams/31/51ae84d65641ce15290cac7291fcfba3.png)
![[Diagram]](../../diagrams/45/d7c139db95cc6c108dd214063f0c7e44.png)
![[Diagram]](../../diagrams/15/738f9b88e98ea18f2752ea837e6d5c03.png)
![[Diagram]](../../diagrams/17/8f27e0ec66dfa27cf94ed2c6f5cc0494.png)
![[Diagram]](../../diagrams/13/104216fd1dee096e70e071112158cd72.png)
![[Diagram]](../../diagrams/17/3d2234f7624ce3eee25458eeab61aa45.png)
![[Diagram]](../../diagrams/28/803c65fad0bba45bfee12ae54f9656d8.png)
![[Diagram]](../../diagrams/34/2d12d48a4c4dfd601aa59e89fa05a926.png)
![[Diagram]](../../diagrams/38/59c91aed277885da47be724782ff24f1.png)
![[Diagram]](../../diagrams/43/b771a94ef9b591af6fedc8a0f9379b20.png)
![[Diagram]](../../diagrams/39/8fa4b4a309e7775e9d79565db2966c36.png)
![[Diagram]](../../diagrams/45/1fd667303a4852576f9fc81930720805.png)
![[Diagram]](../../diagrams/2/acd68a3c3dbc125c38b0282e08515ef5.png)
![[Diagram]](../../diagrams/39/d60859afac363e65d6df2efd0e2d7eea.png)
![[Diagram]](../../diagrams/28/d03e44e48110e462b88f055276232f0e.png)
![[Diagram]](../../diagrams/46/18324fcf6251e908cb7756b3ae367bf3.png)
![[Diagram]](../../diagrams/29/bea01fb28f1c53adc6c87ec4a455b1dc.png)
![[Diagram]](../../diagrams/51/baa89456ce0a61370cdb43982eda3975.png)
![[Diagram]](../../diagrams/41/f2bbfbb9dd2b3be79862ebf28f188324.png)

![[Diagram]](../../diagrams/6/3473644551decf3804dfdcf7a59277a2.png)
![[Diagram]](../../diagrams/39/8c5246dae41c76c2c1e92b9d597c15f6.png)
![[Diagram]](../../diagrams/51/6c64ea3aaba98bab6caccfe2945b645a.png)
![[Diagram]](../../diagrams/1/f0f2d3be60743fef848d938a0af1b203.png)
![[Diagram]](../../diagrams/18/3333a8c4ddab1a33f4a5e35de5504791.png)
![[Diagram]](../../diagrams/42/cf7e4267f47fdc4ad5e9c8db995a592c.png)
![[Diagram]](../../diagrams/27/91a826fec9a95c46f18f4f9f6c7ce321.png)
![[Diagram]](../../diagrams/42/f57c0ad36749c70f9c9b674c4e2d8402.png)
![[Diagram]](../../diagrams/40/dac038944987e3c1fcc0af5b5386cb13.png)
![[Diagram]](../../diagrams/14/270e1dfd8797dcc4fd6160b34e8e0fd7.png)
![[Diagram]](../../diagrams/9/3354aff1ecf9d9ecf4ef4a77bbaa95a1.png)
![[Diagram]](../../diagrams/44/01bbb661eec9e5d8370f63c7ed5adafb.png)
![[Diagram]](../../diagrams/41/a82ee944376878a592cfa4226f280b62.png)
![[Diagram]](../../diagrams/41/4b62c1f95ecc50e2ace55c588e5819a4.png)
![[Diagram]](../../diagrams/28/5c73dd8ecac42cab53a5d100695c62a4.png)
![[Diagram]](../../diagrams/33/08c3625aacbb549026555bee089059fd.png)
![[Diagram]](../../diagrams/43/882769eac1b4bb2b035bf6f4c2e94b30.png)
![[Diagram]](../../diagrams/19/3ef98858d2386dd4be610af7229c0c5a.png)
![[Diagram]](../../diagrams/35/49ad6980c60805d8494a31f9f0802c1b.png)
![[Diagram]](../../diagrams/43/eff55ab418a650a05c9a36e7e67644a2.png)
![[Diagram]](../../diagrams/29/0d2f9471311e25f6bcf41c95709cc6e2.png)
![[Diagram]](../../diagrams/41/ba3a50bed324936e0febaf4f9613996f.png)
![[Diagram]](../../diagrams/3/0c472e20425aac7406e6287c842b9a15.png)
![[Diagram]](../../diagrams/40/f38926b4413acd9650419be668090547.png)
![[Diagram]](../../diagrams/40/7d2648bf1f84bc3bb1450c6ec3fa2932.png)
![[Diagram]](../../diagrams/24/075b8ab8b9ce5873f60203686e95da92.png)
![[Diagram]](../../diagrams/37/b86260342311c126e6346c2e5637cc27.png)
![[Diagram]](../../diagrams/28/2e7db29ef6f599732e9dfc19cdea3a8d.png)

![[Diagram]](../../diagrams/5/50a881cc1c6d0f3ccb46b2d230430b76.png)
![[Diagram]](../../diagrams/40/ad7f3645481cf16faa65c25ac2fe2070.png)
![[Diagram]](../../diagrams/36/01efe6643d60c12b96720d86e24b011e.png)
![[Diagram]](../../diagrams/33/a8b214f8a1a1d63d73e16afebb787521.png)
![[Diagram]](../../diagrams/49/c5e3e7283aaff5f5a463ac90eb33fdfb.png)
![[Diagram]](../../diagrams/15/938543a1170fc1940f3ff2b5a168838d.png)
![[Diagram]](../../diagrams/47/4a4a335d0ec99635c06b9420e2bdbbfb.png)
![[Diagram]](../../diagrams/33/3d73ade8bf2ae0d291ff582e050d3227.png)
![[Diagram]](../../diagrams/33/c764a141eb37f2ac4db1f78ef5cfb58e.png)
![[Diagram]](../../diagrams/27/5914cdbb445694e7758bbe6244ac031d.png)
![[Diagram]](../../diagrams/18/e089760042ec024b2f05cf2b39bbde26.png)
![[Diagram]](../../diagrams/21/61c63bf3554a4703ff1345b4a59cb097.png)
![[Diagram]](../../diagrams/13/74d139730f12751c342760dbabde7443.png)
![[Diagram]](../../diagrams/38/636145b7774595e07afd7c90b4cea860.png)
![[Diagram]](../../diagrams/4/861296a0d5860f85339b2f96243e7946.png)
![[Diagram]](../../diagrams/47/7254c1811d2aa8c4b0653171e68c07be.png)
![[Diagram]](../../diagrams/26/50a4aea2f265f11530f24e9cda728dcd.png)
![[Diagram]](../../diagrams/34/3b40a015c61446d127bf48714c9c265f.png)
![[Diagram]](../../diagrams/48/598608e6b83dab24a1aa6233d5e7aa3c.png)
![[Diagram]](../../diagrams/16/721419d92892b608230ff2c15ef5b627.png)
![[Diagram]](../../diagrams/52/1021c1e6d919f17c6596a302d50bcdac.png)
![[Diagram]](../../diagrams/25/d719cd35d2504f39857d893015d27be2.png)
![[Diagram]](../../diagrams/11/ac7b8a21a622ccaa206ecb58b5659216.png)
![[Diagram]](../../diagrams/42/52c39fd3c6a6569ab5e4fb5c759922f6.png)
![[Diagram]](../../diagrams/20/525698860c0cff2052b4ed8412c80353.png)
![[Diagram]](../../diagrams/15/4b215f36da4eceeb26f09a2e488cd37f.png)
![[Diagram]](../../diagrams/35/5331f1cadf34bcd159ff52fb3480bb6a.png)
![[Diagram]](../../diagrams/19/7409e33461c73065ecebc2e4ece921d9.png)
![[Diagram]](../../diagrams/7/c7a3331eea9cb1f1920dfcf55fdf9f4a.png)
![[Diagram]](../../diagrams/42/b9fa318402e17b60f328329fe7f62b41.png)
![[Diagram]](../../diagrams/30/d0a8f08dd3df2b3e724dcb268980ddd2.png)
![[Diagram]](../../diagrams/52/007f9a8a4e726abfcdd456579e991558.png)
![[Diagram]](../../diagrams/19/0968399635b870271641b8e15423ae41.png)
![[Diagram]](../../diagrams/14/57ac157f1a84b59b9b43424aaba8b7f8.png)
![[Diagram]](../../diagrams/45/3ed5b8e2f5edb61d69323ca777f24339.png)
![[Diagram]](../../diagrams/6/5bbf026a15cbafaf82c8bc8c9e32fbbf.png)
![[Diagram]](../../diagrams/8/55323256fb479ac4c3d4350f08e6afac.png)
![[Diagram]](../../diagrams/44/d64589d52d082ce813460fa7fe318b22.png)
![[Diagram]](../../diagrams/45/747f8069f3e18ca3e1a5ca1f0dae011f.png)
![[Diagram]](../../diagrams/8/faf6046ad0675eed024acceed89647e2.png)
![[Diagram]](../../diagrams/15/7b7a291dbdf2169ef5d5a9f50c929a6f.png)
![[Diagram]](../../diagrams/22/c4332fb04114f2fcc0d80bfd9b5ff378.png)
![[Diagram]](../../diagrams/7/43ad4e084b3a97b904dbd945c0b4d7c8.png)
![[Diagram]](../../diagrams/9/1df27bccf05df10835ffe5bfb6b1a9be.png)
![[Diagram]](../../diagrams/31/f6423b7791ecd3f2a3420d3e8b26ac58.png)
![[Diagram]](../../diagrams/18/d9443bc5ed873dbd8442c14f64567329.png)
![[Diagram]](../../diagrams/4/997076b054565f9eec9fa5a667d8b17d.png)
![[Diagram]](../../diagrams/52/4c4f22908f491775fd12f4749fdda7d0.png)
![[Diagram]](../../diagrams/3/f6e097359a78d5daf823777feabc5773.png)
![[Diagram]](../../diagrams/15/276b183e21954e4e7564c2a70dae41d8.png)
![[Diagram]](../../diagrams/39/6590a7d514794137761dde03f2263320.png)
![[Diagram]](../../diagrams/11/4f99321975fb0587d7ebeeb357d193db.png)
![[Diagram]](../../diagrams/6/aa88177b6590de529962ee6ddb9757cb.png)
![[Diagram]](../../diagrams/1/782a8ead067fe52e6c72a87ea73209eb.png)
![[Diagram]](../../diagrams/15/f7f46982c7fbc6f221387c1b2ad19da2.png)
![[Diagram]](../../diagrams/45/1fd8de5608fc5449eafd8ee4d0262984.png)
![[Diagram]](../../diagrams/48/36a4551d5d25f75739957e3fec808126.png)
![[Diagram]](../../diagrams/40/ad71cf330ea2a48533d8fbfc8b099be1.png)
![[Diagram]](../../diagrams/3/9307de6d9f0c74b167658b5cc021a98e.png)
![[Diagram]](../../diagrams/40/6b45906cf6e3708c24c79042ae3ba2e4.png)
![[Diagram]](../../diagrams/2/7f90d156fc47fa08c84a51ef618dd8e7.png)
![[Diagram]](../../diagrams/48/b14fdd735d4f5ab77e2cf4250dc1c6a3.png)
![[Diagram]](../../diagrams/49/4bea6c93eb66e02e7e5a2e194918141d.png)
![[Diagram]](../../diagrams/42/8b8587522289a53f6f2720162b5b50fd.png)
![[Diagram]](../../diagrams/6/8e4c25c3a6cbc55465a32673369b77fd.png)
![[Diagram]](../../diagrams/26/2be6975e070bfd5fef60e0d53b6d0bab.png)
![[Diagram]](../../diagrams/2/e53b041b5fd8bbf242d8cb6b7ae63f5a.png)
![[Diagram]](../../diagrams/38/2ca711480ffbaee27064facbfec23fb3.png)
![[Diagram]](../../diagrams/50/d89d50fab46a95739f34f424c882aec6.png)
![[Diagram]](../../diagrams/16/4a0520fc452e16ea9fc7dfb81c30512d.png)
![[Diagram]](../../diagrams/6/9f09c81ad33873d7253e713346c817d5.png)
![[Diagram]](../../diagrams/40/51131535a7aff269c19f9b31a17ba6fd.png)
![[Diagram]](../../diagrams/45/d23e15562b54b0f5557eceb69bac7964.png)
![[Diagram]](../../diagrams/39/afe79b9dbc4e741b7969fb5a7136e6c6.png)
![[Diagram]](../../diagrams/30/a7d0514b88d94e27dc1c099eda1454de.png)
![[Diagram]](../../diagrams/9/3d681823ae3ba4d2364bf2d2569315bb.png)
![[Diagram]](../../diagrams/32/3d5b472702892c3fa0569fed1d8b23f9.png)
![[Diagram]](../../diagrams/31/fef46e2ba2ea11817bb7a73d40495d45.png)
![[Diagram]](../../diagrams/43/9fd1a395329ae255985248642e1d55e3.png)
![[Diagram]](../../diagrams/0/19235c8e53284b50d7472d7efc3a89d3.png)
![[Diagram]](../../diagrams/9/38c5938d8f441821dae371565cf3339c.png)
![[Diagram]](../../diagrams/47/27fe00dc6b9626de9d9c000812c488da.png)
![[Diagram]](../../diagrams/26/cc4e4f275c7f5b83d34ee89ca1d0984c.png)
![[Diagram]](../../diagrams/24/9a3233db83daab5845d0b860285e5e57.png)
![[Diagram]](../../diagrams/15/c732c2887f727246fb76ac5a581a2721.png)
![[Diagram]](../../diagrams/37/afa8d94f16932c50bd558edb5175b1dc.png)
![[Diagram]](../../diagrams/4/64c83fa8f9bb628b205946f2d8afa6d1.png)
![[Diagram]](../../diagrams/8/7a066dbce62e1dce20c935ae9c343509.png)
![[Diagram]](../../diagrams/26/7f71c4951e0ac4ec7a3432ae719e9306.png)
![[Diagram]](../../diagrams/3/c1fdd9079fbdde43a280bcf378ac1e64.png)
![[Diagram]](../../diagrams/43/a5cf6aab17b58a037590982a8c19b31c.png)
![[Diagram]](../../diagrams/11/bd3880a7680ae86e2794c74c7f0c4cef.png)
![[Diagram]](../../diagrams/36/fdc8e44fe91ac2c6be2856c517839961.png)
![[Diagram]](../../diagrams/46/b0542116d7624825fb74517f7bba040a.png)
![[Diagram]](../../diagrams/32/9e8b5180c807f919e0099f56e3aaa9e9.png)
![[Diagram]](../../diagrams/8/743f0cc02fe6b455974acc04ae590944.png)
![[Diagram]](../../diagrams/19/dbd5d0552df7766cca5193f37c7d71a5.png)
![[Diagram]](../../diagrams/30/894d2133cca4444e09e3494a705b6800.png)
![[Diagram]](../../diagrams/14/6d5fb919cba7f89c051e236c4e6d7961.png)
![[Diagram]](../../diagrams/50/58b187cc92fd24b03540c9790a3b263e.png)
![[Diagram]](../../diagrams/21/6d0431b742009339562e78db05559ea1.png)
![[Diagram]](../../diagrams/21/115220030ddc633c1e09c960b191e079.png)
![[Diagram]](../../diagrams/14/664e765809430ab3892589112f7df5f1.png)
![[Diagram]](../../diagrams/52/b98d37ab1cfc2d07c7a999764ff7d4c1.png)
![[Diagram]](../../diagrams/0/fa868c91d34035bac977e89f0ebe7b6f.png)
![[Diagram]](../../diagrams/43/dba243667dc92d00adb50e1c69d4c8ae.png)
![[Diagram]](../../diagrams/52/9a0c2ce172c469f9056f080d3a41b322.png)
![[Diagram]](../../diagrams/15/e82c859ada60fe918701da3d012e17cc.png)
![[Diagram]](../../diagrams/16/1cbb9ff4d9e24975460b36b8ee12faae.png)
![[Diagram]](../../diagrams/25/e2b60194bffb8614e8757bb96d213022.png)
![[Diagram]](../../diagrams/30/08219e5f7cdd995d20d4d0244efd1fc7.png)
![[Diagram]](../../diagrams/17/030cc556e23ef93e23aabb53b1ecf2dd.png)
![[Diagram]](../../diagrams/51/40e3dd56b6675f2c5cc57061eeff3091.png)
![[Diagram]](../../diagrams/9/926d957cb6618b0b0c358defeff7975a.png)
![[Diagram]](../../diagrams/21/75b03169ccb3c81d2132e07217ca8909.png)
![[Diagram]](../../diagrams/29/3cda4cd4e86946c1274206395f072872.png)
![[Diagram]](../../diagrams/40/9a853764c0fc4d33652ed84b595bc25a.png)
![[Diagram]](../../diagrams/1/bc0b6e3eef54692d06fee114c015a98d.png)
![[Diagram]](../../diagrams/49/6710bcf01336551b3b34e2732a0f6b85.png)
![[Diagram]](../../diagrams/35/e08cbee98d0923c3b21216dbd31be8f1.png)
![[Diagram]](../../diagrams/52/d28b63133fbd06dfde4ec935f558a6a1.png)
![[Diagram]](../../diagrams/14/b724faebea19959c9a23c8b9f496d16f.png)
![[Diagram]](../../diagrams/35/776c2fd6df753cc9db12d4c5ddd64ab4.png)
![[Diagram]](../../diagrams/4/cce017da2a01793f4241a6e51f55f29c.png)
![[Diagram]](../../diagrams/33/ee1bcf8626874fa8c618f47340f914ff.png)
![[Diagram]](../../diagrams/45/6b93d9269375abb7913e77bb683e2970.png)
![[Diagram]](../../diagrams/24/efd64dd300182a72b319f0c5e955bc55.png)
![[Diagram]](../../diagrams/25/19c9b0c3b01d77f551e4b8bc41d07993.png)
![[Diagram]](../../diagrams/40/a501846e5daf038d4fca98739b8f9820.png)
![[Diagram]](../../diagrams/43/6e11666dd0155f3cd5db622a9d3fa259.png)
![[Diagram]](../../diagrams/34/713cf304a905019d39bbc589e2f06b34.png)
![[Diagram]](../../diagrams/45/0349b7e207b56198b8822460c113ae14.png)
![[Diagram]](../../diagrams/8/983f8a294bdf50b93dcd4d1a9c0edaef.png)
![[Diagram]](../../diagrams/20/cc2d27085483fc4e00f82e3d0f9cea95.png)
![[Diagram]](../../diagrams/1/b57df60a6a614295f544c805930263b7.png)
![[Diagram]](../../diagrams/45/43106a8993b9ac20e041f2ef9c516f82.png)
![[Diagram]](../../diagrams/52/146a2c1926956fdbb81b6826d95874d5.png)
![[Diagram]](../../diagrams/38/dad7b2922de456f294b3662fda351958.png)
![[Diagram]](../../diagrams/5/28a8931ec7f9499dfb59896163fbc411.png)
![[Diagram]](../../diagrams/0/b74e4d5883cef713a6672a8ed3e03d18.png)
![[Diagram]](../../diagrams/15/fa91649085ba1728bdd56977083ec214.png)
![[Diagram]](../../diagrams/8/227e2395b5871cc2f5b8c11a00ff246a.png)
![[Diagram]](../../diagrams/37/9d5cfcb6391b5d8058edb99ecf580319.png)
 I can be reached at
 ![[Diagram]](../../diagrams/16/184e347f88a21e8baee166a8b4135a1e.png)
![[Diagram]](../../diagrams/50/e52fe4a6005abeb5f08c1159c86f0f76.png)
![[Diagram]](../../diagrams/17/9ad6809e8e1c006575048cb8efc32df2.png)
![[Diagram]](../../diagrams/12/0335eceeafd6ea26fd884e6230d49674.png)
![[Diagram]](../../diagrams/3/5018dc5e210c92de959dfce3adc9e2b9.png)
![[Diagram]](../../diagrams/1/f94147b4248f3572f43d7d731fca56bc.png)
![[Diagram]](../../diagrams/16/be9302dfab5afe730f134754e84208d8.png)
![[Diagram]](../../diagrams/12/ea997f04536086da7559d58fcc0d2208.png)
![[Diagram]](../../diagrams/44/d24839fc25929d50f7f7a22be1b92dfe.png)
![[Diagram]](../../diagrams/30/ce6a0a48f4323df2ab20b2a585edda56.png)
![[Diagram]](../../diagrams/50/5a8fef0c7e0778604b4657caa482c288.png)
![[Diagram]](../../diagrams/18/2ef8f31b02bf7835adc5d56e2b7e0ea8.png)
![[Diagram]](../../diagrams/50/36b40940ebd3131bba56dee99eb63a24.png)
![[Diagram]](../../diagrams/41/dc7eea476a28c29a12c5de3fb81a1dad.png)
![[Diagram]](../../diagrams/21/0c8a649a300ae3e665d1c6b2e38f0c2f.png)
![[Diagram]](../../diagrams/14/ce328802f821c0f48ba89bc5698da829.png)
![[Diagram]](../../diagrams/21/7f4a1e6a4e6ec9535794577c0da978f9.png)
![[Diagram]](../../diagrams/18/1f92ddcacc0d64a6ae20c8639b0813b0.png)
![[Diagram]](../../diagrams/30/e78e16559fefd2b65a0af41519899863.png)
![[Diagram]](../../diagrams/13/452d107f38c69b999022bcb54796e9aa.png)
![[Diagram]](../../diagrams/1/42a9629c7973fdf28f613479dd4a400c.png)
![[Diagram]](../../diagrams/39/c37bdb45d823f4231cc885a0c606f135.png)
![[Diagram]](../../diagrams/15/3a0a5dc3586588d73edbfc927cbd788b.png)
![[Diagram]](../../diagrams/47/4f59a93517ed65d0703e9f4c1b7602ae.png)
![[Diagram]](../../diagrams/28/2973d68fa4574f37336cbcf11ea6016f.png)
![[Diagram]](../../diagrams/47/0de329770483d4c1c3bc90247b531d14.png)
![[Diagram]](../../diagrams/41/1103b31b100cefd0933741221831e26d.png)
![[Diagram]](../../diagrams/45/01976c15d45c51185ba394f083bf86a3.png)
![[Diagram]](../../diagrams/46/d3692d901fbf19d6a910f67dd1ff9d25.png)
![[Diagram]](../../diagrams/52/b3c6865661caee17131c625e684c0c42.png)
![[Diagram]](../../diagrams/3/493d55a25d63aff669168c4d8a1515eb.png)
![[Diagram]](../../diagrams/11/7d8307319fad78078c2c7a39f22e6c49.png)
![[Diagram]](../../diagrams/21/013a862980c968d6a899bab3b9bac0f0.png)
![[Diagram]](../../diagrams/40/aa0da0554b2b1da4089497d9a72b6232.png)
![[Diagram]](../../diagrams/23/6550f6253981978b1c7453eb7a85be9d.png)
![[Diagram]](../../diagrams/6/8277bdc44790430e43a25ca0cd3bbaa7.png)
![[Diagram]](../../diagrams/46/6d73053883b60ece51e50c0cfdaa903f.png)
![[Diagram]](../../diagrams/30/67d2ab555640f0152aeb234350131a67.png)
![[Diagram]](../../diagrams/7/47ed1468e07444a592e60468146e6433.png)
![[Diagram]](../../diagrams/49/808c53cca234ca6537514905eec2a4d0.png)
![[Diagram]](../../diagrams/8/54c83ebf18a5c9cace19e761806ac110.png)
![[Diagram]](../../diagrams/29/338ee7126d5d398d5cc57af199239889.png)
![[Diagram]](../../diagrams/27/0911f72487cf7290aef2de6843546175.png)
![[Diagram]](../../diagrams/1/ba6cd32f8195afbb01abb43ebe2b10ee.png)
![[Diagram]](../../diagrams/32/fc6998ded5ff7b5c8444901a0f94c089.png)
![[Diagram]](../../diagrams/21/b7b85560c6e3376c44bc476eaaf16d6e.png)
![[Diagram]](../../diagrams/25/3b4b2f0e2d7ed224427e3485534bcb79.png)
![[Diagram]](../../diagrams/34/82755579915ff9de9aeb527aae87e6ef.png)
![[Diagram]](../../diagrams/41/352fbe2069efcb3c4cd640fed8289771.png)

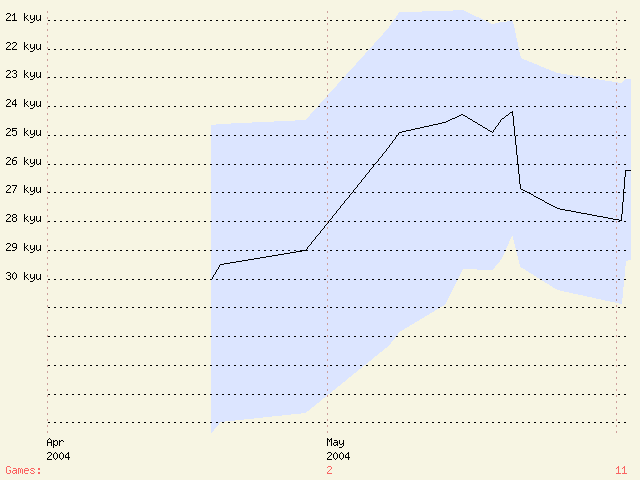
![[Diagram]](../../diagrams/42/6729a84617b47c3062e6c70240219977.png)
![[Diagram]](../../diagrams/4/8bd735d32a394107695d28bba4469c1b.png)
![[Diagram]](../../diagrams/18/8805d359bc20c3d49a35b5a5e738a014.png)
![[Diagram]](../../diagrams/7/ea52cd4dbf767da5c1a7b5bad705e024.png)


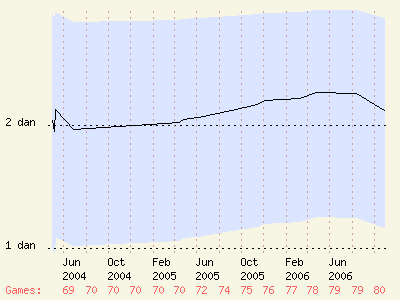
![[Diagram]](../../diagrams/40/228fb77f9c232c2fe578a45111fc94cc.png)

![[Diagram]](../../diagrams/7/bdef23dad32fa6c001b9b2032e8759c9.png)
![[Diagram]](../../diagrams/31/95880595222c6c816c2bdf90f25dbb5c.png)
![[Diagram]](../../diagrams/7/de243b83b455c5926d0be686bd0127f9.png)
![[Diagram]](../../diagrams/9/ba708a6ee5b8dd7efc5c352c08c67f71.png)
![[Diagram]](../../diagrams/1/02481c9fc457ba71522ad91324574bd8.png)
![[Diagram]](../../diagrams/16/e96a50ce5745da6445a9701ec64080d3.png)
![[Diagram]](../../diagrams/39/2d5a6414a0ae39bb68ec64356ed89ed8.png)
![[Diagram]](../../diagrams/6/020cd2236e59cfa97ae5f78ebfb9ce7e.png)
![[Diagram]](../../diagrams/6/bcd346ec8a0419cd19282fa18a1001e7.png)
![[Diagram]](../../diagrams/38/753cb246f26cb682700e2d31327c7760.png)
![[Diagram]](../../diagrams/24/8b6b5650c89bb420b66ea0f04dcd7acd.png)
![[Diagram]](../../diagrams/39/b387ecb4fdc743afc5700caa1866090a.png)
![[Diagram]](../../diagrams/39/52cf41444c64f15e6739879e49a18a3b.png)
![[Diagram]](../../diagrams/4/0b26122eb607843fc40bd0c49192838d.png)
![[Diagram]](../../diagrams/40/aea6728aec9f9f77645806c8e65dff7c.png)
![[Diagram]](../../diagrams/51/4af2688f6e500a56f4b1560872ef3a34.png)
![[Diagram]](../../diagrams/21/16924fd2af0ae588cd574a229e575cc5.png)
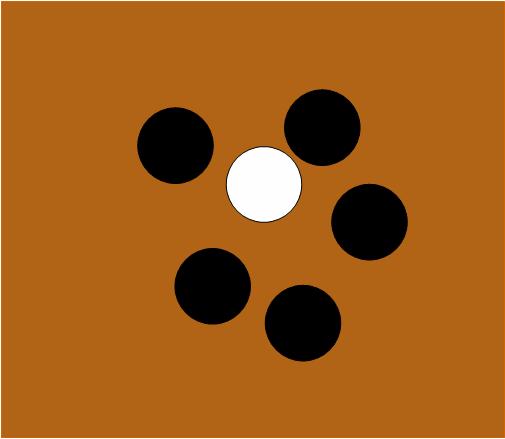
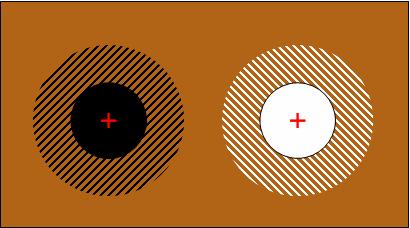
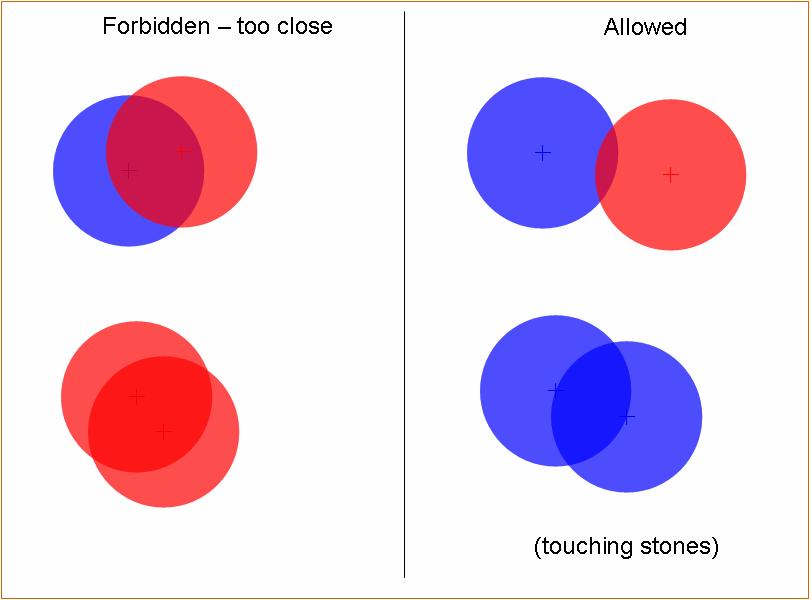
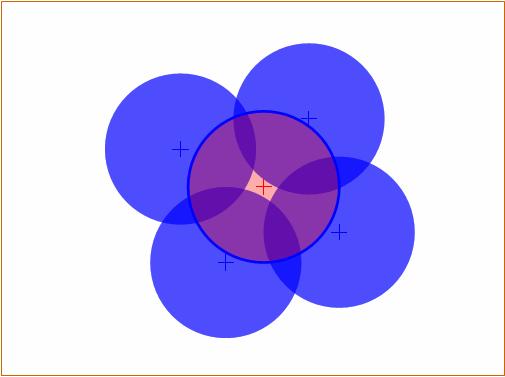
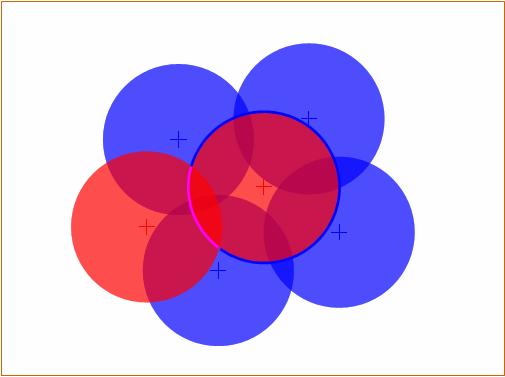

![[ext]](http://www.helm.org/s/data/euclidian/clam.JPG) http://www.helm.org/s/data/euclidian/clam.JPG
http://www.helm.org/s/data/euclidian/clam.JPG![[ext]](http://www.helm.org/s/data/euclidian/asymmetric.JPG) http://www.helm.org/s/data/euclidian/asymmetric.JPG
http://www.helm.org/s/data/euclidian/asymmetric.JPG![[Diagram]](../../diagrams/38/f99594f54050361b13393e5aba9f3e36.png)
![[Diagram]](../../diagrams/11/aad29f5fbef6f0ba37c7c972f05b0dc5.png)
![[Diagram]](../../diagrams/52/cad8519be3de02cfcc41fd7aeea8036d.png)
![[Diagram]](../../diagrams/46/909cc9e0d1e487cbaa9107dc6e9fe0a7.png)
![[Diagram]](../../diagrams/17/10fb931c0d81ed968a0aafe352a8e121.png)
![[Diagram]](../../diagrams/39/ffd2f3a4af137f460d4c4f2a0137bf04.png)
![[Diagram]](../../diagrams/38/0c03460d61c19674640bf18df90e17ff.png)
![[Diagram]](../../diagrams/21/26e896c3be6b53252c49869618f93e53.png)
![[ext]](http://goama.upstream.ru/gallery/albums/Champ-of-Russia/normal__DSC0003.jpg) http://goama.upstream.ru/gallery/albums/Champ-of-Russia/normal__DSC0003.jpg
http://goama.upstream.ru/gallery/albums/Champ-of-Russia/normal__DSC0003.jpg![[Diagram]](../../diagrams/21/7d4aa6fd9cbcbf2f1a5f219cea894e57.png)
![[Diagram]](../../diagrams/23/a164833e53a8ec9f2c547f8e60b1a154.png)
![[Diagram]](../../diagrams/47/00ff5c05ab4b8f1dfe2358ae3d49f298.png)
![[Diagram]](../../diagrams/29/8026674a9058bd87148a6a80c830d9c6.png)
![[Diagram]](../../diagrams/25/fa6e24d9a96834be3282e8cc74a90f71.png)
![[Diagram]](../../diagrams/7/968b81cb569a98e381dd65c2ff980dbe.png)
![[Diagram]](../../diagrams/33/b7d614e0c0bb47ffaba443e2c40a01ed.png)
![[Diagram]](../../diagrams/41/92fb1b7a86a420346eaad835d1bbd187.png)
![[Diagram]](../../diagrams/39/dcff6f239f8d6063d53d88a533ec2ac8.png)
![[Diagram]](../../diagrams/31/13f5c434ae77d895c04ea0070230af41.png)
![[Diagram]](../../diagrams/48/ddb2dc8ec5f4a89b6b4661de3a7f1d35.png)
![[Diagram]](../../diagrams/23/ae6830587980371ffaaa86079a3d884b.png)
![[Diagram]](../../diagrams/27/03481de52435451a9cc83b02087ed7ff.png)
![[Diagram]](../../diagrams/52/2a361537e17fc1d369efccc6e9b52ab8.png)
 which are 1-2 point tesujis) and
![[Diagram]](../../diagrams/28/0a1505bdae079e0e2d362f52972ad9ac.png)


![[Diagram]](../../diagrams/17/f29866cd265813d61b31f6e7c2f4d43a.png)
![[Diagram]](../../diagrams/28/5c73d05ed9e88fd56f05774208c6fd65.png)
![[Diagram]](../../diagrams/50/bfb671abb43ba9e1a454e8a9c158a316.png)
![[Diagram]](../../diagrams/25/a8e3353d5da403b75b3b3a99458a45b4.png)
![[Diagram]](../../diagrams/31/0aabfe623ab0219d3613f15e23ae67ae.png)
![[Diagram]](../../diagrams/11/941663a0739ae1376050b545ea1d7ac6.png)
![[Diagram]](../../diagrams/14/f5a1f5ba6a0ccce15f7e9279ec62ee03.png)
![[Diagram]](../../diagrams/28/e579178eb4ba9ddbd811fd0370e43f86.png)
![[Diagram]](../../diagrams/22/e94ed649fe61dc7aa7a69f8cef65ee1a.png)
![[Diagram]](../../diagrams/0/1afde18a324eaf2efdfec2bf5ae1968d.png)
![[Diagram]](../../diagrams/16/9a4bea80f3f57461fe7a3025e820f9b5.png)
![[Diagram]](../../diagrams/13/7deb453baeb182e14fb84c96ee36ffda.png)
![[Diagram]](../../diagrams/31/59c6a1bde5641949b3d30a58d5dacc05.png)
![[Diagram]](../../diagrams/24/e82e2549e44758651feb5ce63b5fdfcf.png)
![[Diagram]](../../diagrams/27/3ce64c0ff6e40f46aa88933dbbd52345.png)
![[Diagram]](../../diagrams/25/90ca52d0e6a3bf7f6c28b081587601d0.png)
![[Diagram]](../../diagrams/27/373cb1046c5b35272a6d3168218005c9.png)
![[Diagram]](../../diagrams/9/b4939e734fa0455de2233ae900571530.png)
![[Diagram]](../../diagrams/37/fdc8507bb943fb78cc3d71ddc44def49.png)
![[Diagram]](../../diagrams/41/e1547c793feb79d76fd09918141b49b9.png)
![[Diagram]](../../diagrams/7/fee4e8af3b8d6545ed16d9fe4cf8e781.png)
![[Diagram]](../../diagrams/51/02c53f8241c9aadb27f5f043cbe92ec6.png)
![[Diagram]](../../diagrams/17/7c6e54b5c40cbdf9c42994fc9632e1c2.png)
![[Diagram]](../../diagrams/25/4b3ee69261545c40c1f0d27cf34cd566.png)
![[Diagram]](../../diagrams/39/296998f26d7315c84351a61ad10b9888.png)
![[Diagram]](../../diagrams/41/b9a894e3f8433e24e13759254d0abd35.png)
![[Diagram]](../../diagrams/48/964ddabdfaa6b8a9f30d74ded1272b05.png)
![[Diagram]](../../diagrams/10/6e6bcb71da00814c3b1b8c30c4df6f41.png)
![[Diagram]](../../diagrams/38/3060c373d52587faa77ba657c2d15659.png)
![[Diagram]](../../diagrams/10/99a7515bda073b1e171dca51b1e4c898.png)
![[Diagram]](../../diagrams/8/c1c663d32b6b53bb557418688898e87f.png)
![[Diagram]](../../diagrams/3/c299c232b995cb392ce94171cf418f62.png)
![[Diagram]](../../diagrams/13/f7a97d1c1bec17a24baf247201aa8d9a.png)
![[Diagram]](../../diagrams/37/5697c1d1ebc398408e22bd658b6f2e28.png)
![[Diagram]](../../diagrams/43/423550f9424c08539f3d615a8cf1e265.png)
![[Diagram]](../../diagrams/4/875be140b88fc5ef2e82907d1726d57c.png)
![[Diagram]](../../diagrams/10/e0d6fb44b617b6401e8a37c65f0aa6ff.png)
![[Diagram]](../../diagrams/48/3e726bd2f0c1f97c97b09ed572420205.png)
![[Diagram]](../../diagrams/5/149e1dfc8ed77d6544f80bfef1cfaeea.png)
![[Diagram]](../../diagrams/2/12235829524e303428203299f60cc83b.png)
![[Diagram]](../../diagrams/46/ca347fef2a60a2104c7952c9ff3e4bee.png)
![[Diagram]](../../diagrams/39/90f0cbcf829b37fe699a45e6bab6e96e.png)
![[Diagram]](../../diagrams/7/0ac388587331a8da560c13a4d5cea327.png)
![[Diagram]](../../diagrams/32/2ef813c63f77655ea3866ca09ed916f4.png)
![[Diagram]](../../diagrams/52/1d0adfca9ab308c2209d6480499f450b.png)
![[Diagram]](../../diagrams/29/a755039627a85ced8e93f05fde85b3b1.png)
![[Diagram]](../../diagrams/39/dff333636863deaf292b9f3ab0375079.png)
![[Diagram]](../../diagrams/29/703fd6fc5d9100fa9a988eb531e268d7.png)
![[Diagram]](../../diagrams/29/40eae52797246d43246b05504d04bde6.png)
![[Diagram]](../../diagrams/25/bda13562b0a3817ca7e42539ccfc1929.png)
![[Diagram]](../../diagrams/46/f4ab3f106b0e8e7cf55abb410a850152.png)
![[Diagram]](../../diagrams/39/4b586aec3e2391ba90a2c819d0f031a5.png)
![[Diagram]](../../diagrams/36/86c78564a64f6bd379b0a9306a3acf01.png)
![[Diagram]](../../diagrams/36/c6bdf5da93876c4f36178fad8aa31c65.png)
![[Diagram]](../../diagrams/24/3b3ac5ee780c39a7fb8b361db325a266.png)
![[Diagram]](../../diagrams/45/6dce5a678500050fabc3cdd670b601f3.png)
![[Diagram]](../../diagrams/13/2b311b3a94f9582e7c74465ed2dec818.png)
![[Diagram]](../../diagrams/48/e3962199f5d9ecee1dffa849cba2e7c1.png)
![[Diagram]](../../diagrams/2/2917f3c4250e55a477df5960771986ae.png)
![[Diagram]](../../diagrams/26/56bb4901ab280bcde263266460fb309f.png)
![[Diagram]](../../diagrams/46/555f1466119c2d2ae62ba1cec98223a6.png)
![[Diagram]](../../diagrams/15/305b1e368121b8685d818c23e7b0b701.png)
![[Diagram]](../../diagrams/36/cc45e99a4345f5ba857a3c2f22ff571c.png)
![[Diagram]](../../diagrams/44/4c35ac82381f8440e10c88984ce41ee3.png)
![[Diagram]](../../diagrams/8/a3bf64767144ef6d6b159c4510540f1b.png)
![[Diagram]](../../diagrams/3/c53bd6ae672a349c26587a02500f0f74.png)
![[Diagram]](../../diagrams/17/022446ed1ed1672ffa6f353548f313b4.png)
![[Diagram]](../../diagrams/27/66f5e009b8004a90275c0ec9a598b425.png)
![[Diagram]](../../diagrams/18/ead505746b20bd7a54e9fd40170d8943.png)
![[Diagram]](../../diagrams/25/68ac098fae7328ea18b73fe832c41627.png)
![[Diagram]](../../diagrams/22/e1ccc3ed34e679ad0adf86dc1d4706a9.png)
![[Diagram]](../../diagrams/51/62dfc0e7e583f278d0d2f774dc50d09c.png)
![[Diagram]](../../diagrams/37/64f2c739e1223c9aff433647d1d87176.png)
![[Diagram]](../../diagrams/8/3a0321aed9e41aed0e112df04bc767ca.png)
![[Diagram]](../../diagrams/46/d899a5038de0a13212cfd5f62e9bf572.png)
![[Diagram]](../../diagrams/8/63f6654997ae540202aba3c41fd05fd5.png)
![[Diagram]](../../diagrams/8/26628ec3a5fdc92fd97b30e556ebbbd7.png)
![[Diagram]](../../diagrams/43/6fe574e6908e2821c4bbff0653798367.png)
![[Diagram]](../../diagrams/32/e5db601be4e3f181340d1265fdd417b4.png)
![[Diagram]](../../diagrams/7/35f0890a05b2e7f4348fd61b6beaca27.png)
![[Diagram]](../../diagrams/47/a1ac976394cfe98276959840539a1cee.png)
![[Diagram]](../../diagrams/38/6e9e0c6aeee1a2ac4d5ffafcfeff243e.png)
![[Diagram]](../../diagrams/10/8c2e14080d6cfb39841f52f305dc65c6.png)
![[Diagram]](../../diagrams/21/cbf8a06553f14e158173cd40659fa16f.png)
![[Diagram]](../../diagrams/40/24b08941403ffd9a3ed358a1ee8a9259.png)
![[Diagram]](../../diagrams/18/f46e8be40543efbca288c397be5f1792.png)
![[Diagram]](../../diagrams/0/39dd33f5ff65aa4e78b45ed9916ae903.png)
![[Diagram]](../../diagrams/6/8b6f4d60d994de248ea35a3f4e4f6c3c.png)
![[Diagram]](../../diagrams/33/3ade708d36360a4223b9186840e0c910.png)
![[Diagram]](../../diagrams/28/e3ea4b23a321db738c02916eb6538e25.png)
![[Diagram]](../../diagrams/16/1fed20a3841d1a457bfba05fb525a43b.png)
![[Diagram]](../../diagrams/35/403d5f4c241777e4bc1297256385aa8f.png)
![[Diagram]](../../diagrams/23/37e80be87e6f89749f415ac667ba6e00.png)
![[Diagram]](../../diagrams/26/9a1baa233436a77e040ea5519bc2dc6b.png)
![[Diagram]](../../diagrams/43/06037d12e17ffa0001743fc9b52e7596.png)
![[Diagram]](../../diagrams/45/436ecc341eab3d9c40a56b019ff77339.png)
![[Diagram]](../../diagrams/19/2c5ba0c51f19ca5d50a1246813675d5a.png)
![[Diagram]](../../diagrams/42/5f37d649bd286a031e28e75bd8f38ddd.png)
![[Diagram]](../../diagrams/15/ec80540c433d697c5c72a72f0397cd34.png)
![[Diagram]](../../diagrams/31/4c3f31664620144e2d9b1abcf5eadfc8.png)
![[Diagram]](../../diagrams/46/2740e9a8ed0742939bddbe7ccf09c8e1.png)
![[Diagram]](../../diagrams/35/4868bb1d00ac0831e95e4803448407fb.png)
![[Diagram]](../../diagrams/2/d9df9f0dda48c077da43ffac5b748b48.png)
![[Diagram]](../../diagrams/6/378608910b111a7c7123ccba3b2c8baf.png)
![[Diagram]](../../diagrams/42/c52a9e5b28e5e52c9b7fd4dfa6ada048.png)
![[Diagram]](../../diagrams/2/7a2e4dae54e5d125bb63b0c396f8cc84.png)
![[Diagram]](../../diagrams/12/50f3a8fd3b3cb523f462fce91c035681.png)
![[Diagram]](../../diagrams/45/8d22cc135a60e41aa47b85003590c827.png)

![[Diagram]](../../diagrams/48/4b4b2c0c8f47f1f8672f3598ed4fe7e0.png)
![[Diagram]](../../diagrams/47/f8effe6c2e2ca730cb06799c3755e260.png)
![[Diagram]](../../diagrams/46/a8e3d3d6326a18849c769829f8a84980.png)
![[Diagram]](../../diagrams/43/4820d93ffffa74ed8500d249ffb7a4c6.png)
![[Diagram]](../../diagrams/25/e7ebaaa65d88dcb2f9e5831d74b9b58a.png)
![[Diagram]](../../diagrams/2/1a377f2d452623ede9eade73ce84abc5.png)
![[Diagram]](../../diagrams/39/88208052be683f645778804f97de8aa6.png)
![[Diagram]](../../diagrams/5/a7e7e0b476a48204c62cc94a07b860ae.png)
![[Diagram]](../../diagrams/17/bbafc53a96c2ba982e2eb2a6cb9b1150.png)
![[ext]](http://goama.upstream.ru/gallery/albums/Champ-of-Russia/normal_DSC_0260.jpg) http://goama.upstream.ru/gallery/albums/Champ-of-Russia/normal_DSC_0260.jpg
http://goama.upstream.ru/gallery/albums/Champ-of-Russia/normal_DSC_0260.jpg![[Diagram]](../../diagrams/12/ead3b44c81fcc8c203f286400c1f427b.png)
![[Diagram]](../../diagrams/27/25b01f38de69085ed00a634ec5512a6c.png)
![[Diagram]](../../diagrams/17/b0d8f9cb9e4ac243ecfab35ab3897ee7.png)
![[Diagram]](../../diagrams/16/7432d6ecc321e02c081e3a18508bede6.png)
![[Diagram]](../../diagrams/7/b07a8c8522870d60ffb00beec1d3d8f0.png)
![[Diagram]](../../diagrams/12/3dfe662a39425d6fa4aa57bafb847299.png)
![[Diagram]](../../diagrams/28/064524e13ea2402ab9bd916ee3bdd58a.png)
![[Diagram]](../../diagrams/51/97df478d63ca69051dcb80f2ebcab54e.png)
![[Diagram]](../../diagrams/15/5171e19731aa47da15c6f0162447422d.png)
![[Diagram]](../../diagrams/32/bf21b54948fe08b5e9fab8a00711774f.png)
![[Diagram]](../../diagrams/3/2379dd192b5bf7cad4f7ea2e3246ba3c.png)
![[Diagram]](../../diagrams/11/146da907b7b9b57452462178a60cf3de.png)
![[Diagram]](../../diagrams/28/9ccd8ef922e270c3d5ef6e2a19086ca6.png)
![[ext]](http://www.almostsente.art.pl//sente_028.jpg) http://www.almostsente.art.pl//sente_028.jpg
http://www.almostsente.art.pl//sente_028.jpg (If that's his name, lemme know and I'll make a page for him.)
![[Diagram]](../../diagrams/20/103c6910ad2479adf600de995b549aaf.png)
![[Diagram]](../../diagrams/48/9e0894af6ed910d3233eee07c7c9682a.png)

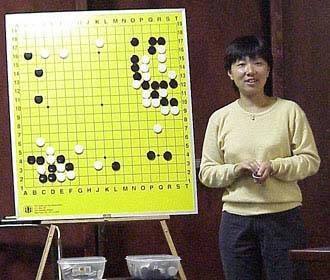 Go Teaching on IGS, KGS, in the Feng Yun Go School started already in 1996.
 [
[

![[Diagram]](../../diagrams/16/7122476610cd813f47d910ebea053822.png)
![[Diagram]](../../diagrams/41/1e221173877c2467b8645129727703f2.png)
![[Diagram]](../../diagrams/50/8e866fc11a3a25a11a476b46a20d8ebb.png)
![[Diagram]](../../diagrams/18/a8632d3434fb84a8f34a3fd5ecef49f2.png)
![[Diagram]](../../diagrams/6/3e9a83771518578baa034c9f6e0ef799.png)

![[Diagram]](../../diagrams/45/30760c17cf7f822a0403097bb08753df.png)
![[Diagram]](../../diagrams/25/77e68eb40fafcba4bac55a744e2bbf60.png)
![[Diagram]](../../diagrams/5/9bdd42e6e8ee1920ddcf52dc8de64963.png)
![[Diagram]](../../diagrams/36/f75e2a896693c78f2678428d3bb6c6a9.png)
![[Diagram]](../../diagrams/41/c57bfe71ada3737ffb7dc0a69018fae5.png)
![[Diagram]](../../diagrams/10/12080e45a820a72a8fc9e1194ed4ae31.png)
![[Diagram]](../../diagrams/0/75e05acc52b0c8a27a91d8186ea5d489.png)
![[Diagram]](../../diagrams/15/bb8417fa019ceb0a378f0328686ad728.png)
![[Diagram]](../../diagrams/24/04acc986b8fe44618a492318327e5aaf.png)
![[Diagram]](../../diagrams/51/a7d7fa388c125f3073d2182a5bb872c2.png)
![[Diagram]](../../diagrams/15/5b807e78a39db8e510b9fb10fffcf7bf.png)
![[Diagram]](../../diagrams/3/b47153f56f3fa0cec3e1a30640e598d1.png)
![[Diagram]](../../diagrams/45/39c2d7c383c754aab531855f73d8dbf3.png)
![[Diagram]](../../diagrams/30/35ff17cc6443e636e5459f294c43356f.png)
![[Diagram]](../../diagrams/30/7b25ab8dbec143b6411400216fc28713.png)
![[Diagram]](../../diagrams/45/468c3d19247f9e0168d6a1f0032dbdf3.png)
![[Diagram]](../../diagrams/11/3902bc0b1ba9ae660c0ce540bdc11cfd.png)
![[Diagram]](../../diagrams/2/fa65aa6f66feeaa0b44c861eec059100.png)
![[Diagram]](../../diagrams/40/fa204b99d3305bc38c1312020253b7f8.png)
![[Diagram]](../../diagrams/39/5091a61aaaaa99a02d017efc295ae66b.png)
![[Diagram]](../../diagrams/8/dcd76b82d551149709ed80fc76eb68e5.png)
![[Diagram]](../../diagrams/14/f8b6f6529e2247175b181187461b71a3.png)
![[Diagram]](../../diagrams/13/4eb31001d7d283ab81094f1b08f3b595.png)
![[Diagram]](../../diagrams/38/2d8ba200723aa9bafef70096a9ef8b4d.png)
![[Diagram]](../../diagrams/18/559d6d64aac96dc574189a0a1a219826.png)
![[Diagram]](../../diagrams/45/e28adfc2b2e2a3adb6c5f96732ca1bf0.png)
![[Diagram]](../../diagrams/7/177e82c921d26f8dd1c38a05cb02bd62.png)
![[Diagram]](../../diagrams/8/e6bb2baeb5ff180b44453e4c185977fb.png)
![[Diagram]](../../diagrams/25/89a9ecd7898ab9ae1a4324db2dd269a5.png)
![[Diagram]](../../diagrams/51/67e4c7a1d1afc7eaefcc632b920f3b66.png)
![[Diagram]](../../diagrams/39/4e374ee090bb7af4c60500e70dc36584.png)
![[Diagram]](../../diagrams/29/b71e93fd4a6264eaebdbddfbff7d5791.png)
![[Diagram]](../../diagrams/32/47543ac6be234b9dc2b9eaa21398e86f.png)
![[Diagram]](../../diagrams/43/35d55ff999bd2f3000c9eb30844d2a7d.png)
![[Diagram]](../../diagrams/13/319f012ec384301b68091218c6c3888b.png)
![[Diagram]](../../diagrams/39/904cc8aee0dd5ba64c56d17d4b1df921.png)
![[Diagram]](../../diagrams/27/b5fdbdbe41404bbdc2b2bb0ac3410fc4.png)
![[Diagram]](../../diagrams/20/1f46bd3ec201332f38f900acd2a5d495.png)
![[Diagram]](../../diagrams/3/3290e5880ed01382d4f5a938623bac68.png)
![[Diagram]](../../diagrams/50/beb8560aafedd8631b8fd426cad9a586.png)
![[Diagram]](../../diagrams/10/5ab793739c6f322696d525ae44aa906f.png)
![[Diagram]](../../diagrams/14/32d9da8485d1b296313e1863a945153f.png)
![[Diagram]](../../diagrams/17/2cc1045ad605c14fe4187ed84925ba25.png)
![[Diagram]](../../diagrams/52/78fc8be2c01740d2c04f3c6c2f289132.png)
![[Diagram]](../../diagrams/10/08be864714c6d7a356a1a3fc1cd33906.png)
![[Diagram]](../../diagrams/8/6c3e9520973b8e9bb7fe937532d8bbd5.png)
![[Diagram]](../../diagrams/18/2b3c123ac2d79211c6855421768215c0.png)
![[Diagram]](../../diagrams/45/8c7aa87ebc5591ae4fdf37e5fb40c868.png)
![[Diagram]](../../diagrams/39/1ad2be551ae237c41ad0401382a87619.png)
![[Diagram]](../../diagrams/9/a2287266243a566378dcf803ab347f72.png)
![[Diagram]](../../diagrams/32/f05c1791b184f86bdf0da2814e4a421c.png)
![[Diagram]](../../diagrams/7/c5c5ff3d2c1aefb691c7cff29b0827bc.png)
![[Diagram]](../../diagrams/15/eb86a869206e3c9438583fcf611db915.png)
![[Diagram]](../../diagrams/6/1722d9592b3efc93c9d77227d75b8df8.png)
![[Diagram]](../../diagrams/27/74fa93c2b1ed17634d489163b691d2d9.png)
![[Diagram]](../../diagrams/48/3f4c2488d9a639a9baa9fc1486e2ee69.png)
![[Diagram]](../../diagrams/6/95db97bf44810245eb09103c1b8df771.png)
![[Diagram]](../../diagrams/35/c2c0e851021d21b621d0b9879ca95518.png)
![[Diagram]](../../diagrams/26/8e8655d2c2a68f4f586eefcc1d0fc710.png)
![[Diagram]](../../diagrams/20/55c90154b628ebbcec8eb8016c6bca79.png)
![[Diagram]](../../diagrams/11/44ef01b537321d540d0c18f979be4953.png)
![[Diagram]](../../diagrams/15/f5190b9f25950036c9d78337005e8e3e.png)
![[Diagram]](../../diagrams/21/9827ea803c53537e0137516063ab0b01.png)
![[Diagram]](../../diagrams/35/40b6a3bfbff042245e3fefcaff5019d6.png)
![[Diagram]](../../diagrams/15/3683842be609ad209a20a160bf1e5de7.png)
![[Diagram]](../../diagrams/19/56e1775afe181c4ffce4fcaee8b61136.png)
![[Diagram]](../../diagrams/19/52326ad54dfea1610b3bff0ca47ec0cc.png)
![[Diagram]](../../diagrams/8/e723795fe8a81d08fa2e42f20bcb3e11.png)
![[Diagram]](../../diagrams/52/24ccebae7e765fc99c21817e6dd97b03.png)
![[Diagram]](../../diagrams/30/82349f3011c2666efe6e000820b808ff.png)
![[Diagram]](../../diagrams/43/e4f5548abe869d6d76ba2ee0dc620b76.png)
![[Diagram]](../../diagrams/28/fcf5948f3206574fa99aa30a63359b1a.png)
![[Diagram]](../../diagrams/47/0da27cdb76de7d51cfb2af7e9ce9c0b9.png)
![[Diagram]](../../diagrams/30/01b6ad33b79a5999ae6884ea450289e9.png)
![[Diagram]](../../diagrams/19/3f6c14b02556a3298d2c5fa868574650.png)
![[Diagram]](../../diagrams/32/faedc4c2c0e2da351e42da0ba095535e.png)
![[Diagram]](../../diagrams/35/b17443322b03da09c6669d0784d5aeca.png)
![[Diagram]](../../diagrams/25/2e0caf2a9c631139a58fce610e3b79b7.png)
![[Diagram]](../../diagrams/3/f40288b07c8cbb99e6bd1fef86f84566.png)
![[Diagram]](../../diagrams/8/673e60f8a2d72a17e57f390f37b7edc9.png)
![[Diagram]](../../diagrams/13/fb5c1d0de273cd9ee976b6fbf34f9365.png)
![[Diagram]](../../diagrams/51/9050b68993acbbaf48e4c3db1923034a.png)
![[Diagram]](../../diagrams/22/ccc06696266080a0b0d654fd6fbcdd17.png)
![[Diagram]](../../diagrams/48/327cc4e1185e767602c0062e5dda85aa.png)
![[Diagram]](../../diagrams/33/70dfbe3f2a3a4ed94e91658abd432ae8.png)
![[Diagram]](../../diagrams/17/c4377730b66afd6715e9fdca16bd900f.png)
![[Diagram]](../../diagrams/10/18e33fa78a137d765d8da6d9410c0aa5.png)
![[Diagram]](../../diagrams/19/107dbb3220c9ada907f823d297274362.png)
![[Diagram]](../../diagrams/23/7e03f77f97d08f3630eb73598a20b985.png)
![[Diagram]](../../diagrams/10/a69cec4a86b4181085b116e3071fd4af.png)
![[Diagram]](../../diagrams/11/a9f7f89c96c1f0babdda3165c452e249.png)
![[Diagram]](../../diagrams/48/ececa7064297960c61d9125f473dc0ea.png)
![[Diagram]](../../diagrams/40/7af5a6900ffa1a702319cf658936737a.png)
![[Diagram]](../../diagrams/11/40046bad9862f2735a3a28ae994614a0.png)
![[Diagram]](../../diagrams/37/89ab8639981ea4cd1bac671f77ac08b3.png)
![[Diagram]](../../diagrams/38/1660ca72a0a0b4dc6b57ad3624fa7add.png)
![[Diagram]](../../diagrams/51/6a847e0a80a5fa78dd627311918da855.png)
![[Diagram]](../../diagrams/50/7b73a40adc19a596b0d94dc87d86265e.png)
![[Diagram]](../../diagrams/40/6f65260d229ce718211ea25e7fbedd4b.png)
![[Diagram]](../../diagrams/40/20e08488cad236ddac2a0dcefa7a2379.png)
![[Diagram]](../../diagrams/44/fa383d5ede7b873e0655c5d22db336ab.png)
![[Diagram]](../../diagrams/3/37055c1687df34cc2344b7574d994928.png)
![[Diagram]](../../diagrams/2/81f4ee6652632e2ba6ddb0439765911b.png)
![[Diagram]](../../diagrams/50/121a1d8b4b7aa152180dc15b0c940a62.png)
![[Diagram]](../../diagrams/41/287e95f3723ab3d9835c37ad2b7a2d11.png)
![[Diagram]](../../diagrams/49/61931584d28d18646da2b495061c6520.png)
![[Diagram]](../../diagrams/24/90c83e074d13d93d64a9c27615e3c40a.png)
![[Diagram]](../../diagrams/30/bc46ed1ad8ee17f5778f7ef644a707e3.png)
![[Diagram]](../../diagrams/23/49d9707b5034d697c3d9d289f353a414.png)
![[Diagram]](../../diagrams/21/bd645e54d1aaf61e55a3b2c21a8d362f.png)
![[Diagram]](../../diagrams/22/b5942a910d93540ed9ea01a9a8c494f1.png)
![[Diagram]](../../diagrams/1/dc9f6c3b2e9a39bbcfb717d5238a9541.png)
![[Diagram]](../../diagrams/21/2f9a2f5d4e961520efc8769b263efc86.png)
![[Diagram]](../../diagrams/16/a1de4bd8ccb56faf14725575118b9194.png)
![[Diagram]](../../diagrams/33/c0b4092f2a046563442e31ddad013615.png)
![[Diagram]](../../diagrams/7/1c8e09f9af0b51b76c2d0815feaba4f7.png)
![[Diagram]](../../diagrams/37/1bf20a0246fa4bd84bca3e0f3c2a6db9.png)
![[Diagram]](../../diagrams/45/5445a885d18217b569f2d68fc18e9bd0.png)
![[Diagram]](../../diagrams/16/e19bc2dd8631e8ee6836deb641ae8d8c.png)
![[Diagram]](../../diagrams/11/fa059ae42c0d7867929cda4d40df0303.png)
![[Diagram]](../../diagrams/42/c2f179a0255f9c08fe3246fc3c7f0418.png)
![[Diagram]](../../diagrams/35/d45627b0c406bbdc81931b4679c834a5.png)
![[Diagram]](../../diagrams/48/c8ff9904fb63dd550f3eac0ef71643e1.png)
![[Diagram]](../../diagrams/35/5c4f4a4f6a8eb8607be22db9bcb786c8.png)
![[Diagram]](../../diagrams/14/0b9a35e8f7799b4351d5e2c8ff42b45b.png)
![[Diagram]](../../diagrams/13/a988b7c7ccb0252e799f1c09013809f2.png)
![[Diagram]](../../diagrams/40/acd8ad18627b963b01a97a4a85f9c212.png)
![[Diagram]](../../diagrams/42/93fd1b276852f7aa14f63d4d4f916bf3.png)
![[Diagram]](../../diagrams/12/73dee92765f29b362fa6efb2e0da978a.png)
![[Diagram]](../../diagrams/4/57e3739d7fe34457b1ca81e13df31d46.png)
![[Diagram]](../../diagrams/20/2ab138fd44a29422dab0938c266f329c.png)
![[Diagram]](../../diagrams/52/aa31273728b8d94b8c14a49ec6d76484.png)
![[Diagram]](../../diagrams/12/32fe7fb296c0b0ab8656c2c7a1b7c83e.png)
![[Diagram]](../../diagrams/6/da5c6c3b9aecc645f36cdc0ba01e1482.png)
![[Diagram]](../../diagrams/43/dadbe0a20155a91f0d7f776a1a7ae151.png)
![[Diagram]](../../diagrams/52/69453ad85e949f802a8f5c62bda2744a.png)
![[Diagram]](../../diagrams/2/d979c64f34062f6e46a396a37844fcdb.png)
![[Diagram]](../../diagrams/42/269401fb5109927b3c680c07337461e2.png)
![[Diagram]](../../diagrams/32/1277c8a91a5a4160e8d52aa77febc7a4.png)
![[Diagram]](../../diagrams/22/ba3e80e675c7f01898305fed29fdc966.png)
![[Diagram]](../../diagrams/49/8f2045a9bf9527e6e9be593e443e2c08.png)
![[Diagram]](../../diagrams/7/ce0b8af990ed5a3b269af8f4359645a8.png)
![[Diagram]](../../diagrams/24/e6a5e07c56e4ce72838ece65ae7c8015.png)
![[Diagram]](../../diagrams/52/d64bcc4ea9919aad79deced2126a85ed.png)
![[Diagram]](../../diagrams/8/6a8e0e4152e46203efdaac25caf85489.png)
![[Diagram]](../../diagrams/25/8d0a69c95265b04977708d4b14f723c5.png)
![[Diagram]](../../diagrams/19/ce17a2a4c8a51e41063db275f0a09097.png)
![[Diagram]](../../diagrams/13/2a898a0cc0f6970df74bf386bf9d0d4f.png)
![[Diagram]](../../diagrams/29/4d219ff3f8c0cfdd36949ed8356b9e0b.png)
![[Diagram]](../../diagrams/22/12f2aa976c12e73ee529ed311a1ddc70.png)
![[Diagram]](../../diagrams/8/016e50b704f16204b016b5093dcea099.png)
![[Diagram]](../../diagrams/40/d1abff1678f8b27e751847c8234882b6.png)
![[Diagram]](../../diagrams/23/e50e16e687460c8f6d4542e9385a42f0.png)
![[Diagram]](../../diagrams/44/72f3079e84f58798daf0003826932d7a.png)
![[Diagram]](../../diagrams/17/d32fd6cfe72bec1ef7cd7722ad8c9fb4.png)
![[Diagram]](../../diagrams/48/86b2f29740cd77aae8153dd2d0bb907d.png)
![[Diagram]](../../diagrams/3/9b6098a7997eed8a1d5c897c6202c002.png)
![[Diagram]](../../diagrams/13/eacb4d3983494fa44be3c28327acdd6a.png)
![[Diagram]](../../diagrams/3/e3dd8ccc05a117dd603f6135c9c5d067.png)
![[Diagram]](../../diagrams/36/1bb36f8f95c90832f7aa0cad496e0a09.png)
![[Diagram]](../../diagrams/1/6e3889b946f3cd507bd6afb36dd93e14.png)
![[Diagram]](../../diagrams/43/1c61e98795cc57b96695c8a40157b7d9.png)
![[Diagram]](../../diagrams/7/f43c7c68bd64c28e8364ba780efb5552.png)
![[Diagram]](../../diagrams/46/7261ed7ffdb593523d58a01dbc76c1bb.png)
![[Diagram]](../../diagrams/31/1498d0dfa58edda362d089784925e850.png)
![[Diagram]](../../diagrams/31/c222fd651d0f1f2b2d35299a6526decc.png)
![[Diagram]](../../diagrams/6/693c3ece4c95f84101087988788db3da.png)
![[Diagram]](../../diagrams/30/a68a76d4f3da0099de5991f499426853.png)
![[Diagram]](../../diagrams/12/c9ea7e3fe8772c4e3834eb1da9461efb.png)
![[Diagram]](../../diagrams/52/be60e87dd959f276967d03f3ca69be1c.png)
![[Diagram]](../../diagrams/46/eaee957bd056d03c2d12ae8cd0674d4e.png)
![[Diagram]](../../diagrams/1/b62ed232ad3e35128daa8c61dbeb88d5.png)
![[Diagram]](../../diagrams/11/d2a67594d68b6ea9aa515ddf3aa815b6.png)
![[Diagram]](../../diagrams/45/5e85e23e6eb11298cb9c74fa0c927e48.png)
![[Diagram]](../../diagrams/40/45d73bc4e9641ad588db82e7f0309370.png)
![[Diagram]](../../diagrams/52/75a53cc33520ab30a26067b6853b481d.png)
![[Diagram]](../../diagrams/2/672c0a85aced39daeff115e8fcb24930.png)
![[Diagram]](../../diagrams/0/3ea88422c0244d6349640e0bda03789d.png)
![[Diagram]](../../diagrams/52/385aa17f458cc3424373b4425d0cecc8.png)
![[Diagram]](../../diagrams/19/195af9fa63cb6b1b9ac9b750f27b52f9.png)
![[Diagram]](../../diagrams/48/9b93c48b2dd5a6cc6e7046fa82a24ca4.png)
![[Diagram]](../../diagrams/32/38206e9bd83314954b1c91c0d052a399.png)
![[Diagram]](../../diagrams/44/b10a206e18d582c48cb9e9656d1f02de.png)
![[Diagram]](../../diagrams/43/6aedddccc772f8f7b5b8b89131c22c50.png)
![[Diagram]](../../diagrams/31/5389ee39c615ec0a63d23afa066ce814.png)
![[Diagram]](../../diagrams/36/7cf7519409caa95ba0e7e9bb251c23b3.png)
![[Diagram]](../../diagrams/6/724cefd2cb28b095565a28311eb9005b.png)
![[Diagram]](../../diagrams/16/9b8096b917305f21af33e9198ee68021.png)
![[Diagram]](../../diagrams/44/b341a291475f8ca9f5c8cd8926e51d30.png)
![[Diagram]](../../diagrams/47/7aedfb61b0b6c5854e840b0656d1de93.png)
![[Diagram]](../../diagrams/48/d8e20f6303cb7d37ca9705e35c1217ef.png)
![[Diagram]](../../diagrams/18/70f86892c4c1901c9806914a6ba53a76.png)
![[Diagram]](../../diagrams/37/9668c9a5cb757ec2139b20c147713696.png)
![[Diagram]](../../diagrams/10/50ec70a19dd9d22aead361979bc3f47a.png)
![[Diagram]](../../diagrams/10/336dad794f5134213b3788966d8ef2de.png)
![[Diagram]](../../diagrams/25/99bf34bcb441a0b86f40b28039a9eaeb.png)
![[Diagram]](../../diagrams/15/cd37eb6a44f36af5671686348dfa5027.png)
![[Diagram]](../../diagrams/16/582a0e81522a997a91cfb4c3f3fd758b.png)
![[Diagram]](../../diagrams/51/0b86c28e51532d2b59e01aeb40b88192.png)
![[Diagram]](../../diagrams/20/bf76e14d8e8dd5b7a710504479441c9d.png)
![[Diagram]](../../diagrams/14/2fd3760a4857c92ae1523584e11d595e.png)
![[Diagram]](../../diagrams/6/6cd8267c847c379f8238dac53c5cb1c3.png)
![[Diagram]](../../diagrams/48/144d4a9ca13d6bff97794cf2484690fa.png)
![[Diagram]](../../diagrams/32/1ef76214b684f67de8bc180770f5c98b.png)
![[Diagram]](../../diagrams/13/44adad5aa38ec2945ac4456b39f2593d.png)
![[Diagram]](../../diagrams/12/3cb60eaa6cd163d1b046c5b786f10272.png)
![[Diagram]](../../diagrams/7/2e6a463cb47be32a9fe6b787cacb23f6.png)
![[Diagram]](../../diagrams/23/801ca732b30e037c5f7ced4a6b3a9d36.png)
![[Diagram]](../../diagrams/2/d1e5dd7b53089dc684716b5235593a06.png)
![[Diagram]](../../diagrams/18/3da3ced0ca6efd0989dddaaaed234944.png)

![[Diagram]](../../diagrams/29/affd9ab79d782c8758e99263000245f1.png)
![[Diagram]](../../diagrams/24/0f9bcc424edb362472f5e170e33fa630.png)
![[Diagram]](../../diagrams/11/045e4e06299608e2ebb6fcad77d6f582.png)
![[Diagram]](../../diagrams/43/98670773d4d62e6085aa7218485b004b.png)
![[Diagram]](../../diagrams/0/c8ebd9983419961cb3c146661e037253.png)
![[Diagram]](../../diagrams/22/34c0ea837f0a2142eb9205eeeeabaf06.png)
![[Diagram]](../../diagrams/21/61893800888231f4bcd74885fa2f31f8.png)
![[Diagram]](../../diagrams/32/c88bcfdcdd5b4637cb5efe89150cae0c.png)
![[Diagram]](../../diagrams/10/0496713f7fdb1d51d0ad25bb779fb4fc.png)
![[Diagram]](../../diagrams/38/651e8cbd830469a030d5934d1b6f964b.png)
![[Diagram]](../../diagrams/25/f880f454395c0b4368972558347fcb21.png)
![[Diagram]](../../diagrams/1/0da2f2fd2dbd730d87a062e7798c2149.png)
![[Diagram]](../../diagrams/14/ac5868399f4e8fd4ce8ee700d101a9b0.png)
![[Diagram]](../../diagrams/39/8e636c340341648dae04bde74fd12c53.png)
![[Diagram]](../../diagrams/18/0a6abe2744cdbb241bbf0232581a3a7c.png)
![[Diagram]](../../diagrams/42/adc4974a15f03b766b6007238f6dd753.png)
![[Diagram]](../../diagrams/20/1872cfea6026ef43388768fcdc2282e8.png)
![[Diagram]](../../diagrams/18/251d017cad4971f076cb795a916d9325.png)
![[Diagram]](../../diagrams/8/aa660886429472e2f61d453d4f6bf906.png)
![[Diagram]](../../diagrams/50/38ab587087e52221d098074e8a18a9fa.png)
![[Diagram]](../../diagrams/6/457c046f9ca73757ba196c46759cecd6.png)
![[Diagram]](../../diagrams/32/e0a676d39a52fcb06a88c448f453dcd0.png)
![[Diagram]](../../diagrams/49/2f707819e04a3eff696503e23767a2a7.png)
![[Diagram]](../../diagrams/4/30bf687e9d9f260f0007349990d61e23.png)
![[Diagram]](../../diagrams/34/96cc7d9d7fdbd8f4e371e8c96f6cdb28.png)
![[Diagram]](../../diagrams/32/95d190848fd4b0101c5e87b3bd31d8d9.png)
![[Diagram]](../../diagrams/51/fcb804280d47072bfe300ac8cdd7c50e.png)
![[Diagram]](../../diagrams/43/cac92545c5bd569c0b4f3d7ff6be2dfd.png)
![[Diagram]](../../diagrams/40/56bb7fac572c8599aa9cb23292618cf2.png)
![[Diagram]](../../diagrams/15/bb1e49bd53e875ac47b2caeea10e0eb0.png)
![[Diagram]](../../diagrams/10/e425ea33f953b7ed664ab9e40b8c133b.png)
![[Diagram]](../../diagrams/3/92376deb034b21a745dccb38f4dc78bf.png)
![[Diagram]](../../diagrams/50/6f16ffa7e329f95b6c516b9196387092.png)
![[Diagram]](../../diagrams/46/c6bd26d63366b7831d0df65620126440.png)
![[Diagram]](../../diagrams/33/1079773424ec1f7411cc4cd45f1084e3.png)
![[Diagram]](../../diagrams/50/1d65077e2e353263eebcb56cfc6dc6c2.png)
![[Diagram]](../../diagrams/11/19f405fd4b58eb0eeed069cca709e45f.png)
![[Diagram]](../../diagrams/34/e9012cb33493d0645e622f8686bd84d2.png)
![[Diagram]](../../diagrams/49/9cf8159c8e5af64207a95586cb36e143.png)
![[Diagram]](../../diagrams/25/b9fe3588cfc46e95cc75dc0f78df5ce8.png)
![[Diagram]](../../diagrams/27/74fcd0d5b50223ee734206d1be05c407.png)
![[Diagram]](../../diagrams/33/20232f03903cef268352abbfae26f14e.png)
![[Diagram]](../../diagrams/14/d2113dc005e3852e3510e26ab09d67dd.png)
![[Diagram]](../../diagrams/11/cf330c6fef55367b08bc63869db7c2e5.png)
![[Diagram]](../../diagrams/47/731cab253c1b008c284c95db701b8b09.png)
![[Diagram]](../../diagrams/11/baf5b97ab111c6bc3f72789dfaf7ed0d.png)
![[Diagram]](../../diagrams/22/54ca83476a1f3f14bbf0631568a7ee26.png)
![[Diagram]](../../diagrams/7/20e3c03f533109a9152658fedabae9c1.png)
![[Diagram]](../../diagrams/22/9199d26f295eeb66b7ace4308dab0027.png)
![[Diagram]](../../diagrams/19/123ceaff852ebc937362a89d4f1f704b.png)
![[Diagram]](../../diagrams/51/6be99f071b6e98ca3f841b3a3b07a087.png)
![[Diagram]](../../diagrams/22/bd61132738c55a839b75ab9fe6035388.png)
![[Diagram]](../../diagrams/15/06c2049f4b3ffa5dbe99404df34a93b6.png)
![[Diagram]](../../diagrams/7/a3fa0f783121bc58105b0d55cc0694b7.png)
![[Diagram]](../../diagrams/28/afe52a21e29dc984c7a284d73c8f0460.png)
![[Diagram]](../../diagrams/37/a5262c681d7b59fd180f40f1316cfb19.png)
![[Diagram]](../../diagrams/26/3bd76fc392d77761cd557ffe38f741c4.png)
![[Diagram]](../../diagrams/16/545c32f49512c1f58ce4e592ca14ad60.png)
![[Diagram]](../../diagrams/44/2b7f7ab3fa93aafda6205e9de51c18d7.png)
![[Diagram]](../../diagrams/46/47f4d3ea6ed55344eebf1bb3c9529961.png)
![[Diagram]](../../diagrams/44/799617abb53e970e674966167d1f22bd.png)
![[Diagram]](../../diagrams/10/85108d673aebbbe85a197f240d9c91d0.png)

![[Diagram]](../../diagrams/19/850255c2a55b3b39ff159ce23e78bba8.png)
![[Diagram]](../../diagrams/38/d6b6d9d601200edef70206f550851997.png)
![[Diagram]](../../diagrams/5/30c9a467f4a442bf46c799a633e5ee01.png)
![[Diagram]](../../diagrams/2/279b340109be7b1d9a27b973dfb2035c.png)

![[Diagram]](../../diagrams/4/241d478f5aad080bac3d7797bd0db405.png)
![[Diagram]](../../diagrams/21/88eb1516c37ab8b51ce4dd53d85b3cee.png)
![[Diagram]](../../diagrams/8/909cd6825cdfc3d807fe075eac703013.png)


![[Diagram]](../../diagrams/51/846d7fd647cf18fa6fd2621f40991a80.png)
![[Diagram]](../../diagrams/27/1b70c1cc8d19add628d1b572eed54505.png)
![[Diagram]](../../diagrams/34/9a5c4724d97906d387213940628cebd1.png)
![[Diagram]](../../diagrams/9/e3afbec24dc3963276b5ae7d04b00e27.png)
![[Diagram]](../../diagrams/23/4db76134456b4ebfbb1e5b9871f7adaa.png)
![[Diagram]](../../diagrams/41/c95ce29495e989dd2c3cf449162cf9c9.png)
![[Diagram]](../../diagrams/18/60e79cbc6e62e32232abcf0419a061bf.png)
![[Diagram]](../../diagrams/2/047bc3e879b546604a50455280537b25.png)
![[Diagram]](../../diagrams/11/0ba2fb51278ed8d85118a9c33e0877bb.png)
![[Diagram]](../../diagrams/39/bdc710ed445cff05441d1ecbfceeca58.png)
![[Diagram]](../../diagrams/7/f87c081923c6e41946925acc3232e996.png)
![[Diagram]](../../diagrams/52/4bbcf16a4592d759b8dc3e6db6fb28fc.png)
![[Diagram]](../../diagrams/30/3d6034bc669803041d01e4050264371d.png)
![[Diagram]](../../diagrams/18/db0de09739dfc7455260a55b3422bfb4.png)
![[Diagram]](../../diagrams/3/41baed73f651efff0e6f8e037369d4b4.png)
![[Diagram]](../../diagrams/39/7aaa087883554f38a8ee90d0b8b70b80.png)
![[Diagram]](../../diagrams/13/da7aa661c056f316b0f21e02e68f6ec6.png)
![[Diagram]](../../diagrams/37/fecab120809c2bbc42b065c50d91e595.png)
![[Diagram]](../../diagrams/38/1ecc21c5bb4c7c1851824d6782bf186f.png)
![[Diagram]](../../diagrams/31/7a043976c56304f9655f74ed46403f68.png)
![[Diagram]](../../diagrams/52/ebd5976f8b17378bfd99afcddab0ca05.png)
![[ext]](http://matthieu.walraet.net/go/tuchola2004/big/350-5007_IMG.JPG) http://matthieu.walraet.net/go/tuchola2004/big/350-5007_IMG.JPG
http://matthieu.walraet.net/go/tuchola2004/big/350-5007_IMG.JPG![[ext]](http://foto.luftbrandzlung.org/albums/EGC2004-Naoyoyuki_Kai_1/IMG_0009.thumb.jpg) http://foto.luftbrandzlung.org/albums/EGC2004-Naoyoyuki_Kai_1/IMG_0009.thumb.jpg
http://foto.luftbrandzlung.org/albums/EGC2004-Naoyoyuki_Kai_1/IMG_0009.thumb.jpg![[ext]](http://foto.luftbrandzlung.org/albums/EGC2004-Naoyoyuki_Kai_1/IMG_0009.sized.jpg) http://foto.luftbrandzlung.org/albums/EGC2004-Naoyoyuki_Kai_1/IMG_0009.sized.jpg
http://foto.luftbrandzlung.org/albums/EGC2004-Naoyoyuki_Kai_1/IMG_0009.sized.jpg![[ext]](http://foto.luftbrandzlung.org/albums/EGC2004-Naoyoyuki_Kai/EGC2004-Naoyoyuki_Kai_1.highlight.jpg) http://foto.luftbrandzlung.org/albums/EGC2004-Naoyoyuki_Kai/EGC2004-Naoyoyuki_Kai_1.highlight.jpg
http://foto.luftbrandzlung.org/albums/EGC2004-Naoyoyuki_Kai/EGC2004-Naoyoyuki_Kai_1.highlight.jpg![[ext]](http://foto.luftbrandzlung.org/albums/EGC2004-Naoyoyuki_Kai_1/IMG_0010.sized.jpg) http://foto.luftbrandzlung.org/albums/EGC2004-Naoyoyuki_Kai_1/IMG_0010.sized.jpg
http://foto.luftbrandzlung.org/albums/EGC2004-Naoyoyuki_Kai_1/IMG_0010.sized.jpg


![[Diagram]](../../diagrams/34/dace451e75696138d7eee8e7ccf8acae.png)


![[Diagram]](../../diagrams/45/67028713b534fbf5d20ecb216274efd7.png)
![[Diagram]](../../diagrams/41/eba5a826552ddbad5f90ac94cf87f546.png)
![[Diagram]](../../diagrams/3/29efa3241bc1095404fa9a7764452cf2.png)
![[Diagram]](../../diagrams/1/5861bc22bb2d59274dfbf268ce03ffa1.png)
![[Diagram]](../../diagrams/5/9630b31d1be3fd30880db981febcfd49.png)
![[Diagram]](../../diagrams/23/bb46d2fa45077349214bf8289aa6f6ef.png)
![[Diagram]](../../diagrams/36/b615f35f98ba206f5d74209c0060e8e9.png)
![[Diagram]](../../diagrams/17/d1f06a4f740e019f6969a7af208348e5.png)
![[Diagram]](../../diagrams/30/a2edb69dfe6f4a26fa020c672ab6822c.png)
![[Diagram]](../../diagrams/50/5058ec6d8fd40bf2a0ad163152a95b4e.png)
![[Diagram]](../../diagrams/12/eaaf1f33ca3b96e60f09bd6a0fbba95a.png)
![[Diagram]](../../diagrams/40/1f6d21ac2123d8d7d627f2af8fff7026.png)
![[Diagram]](../../diagrams/39/3fa8824e861e995aac2d9cc6abfeca23.png)
![[Diagram]](../../diagrams/11/fbf664ff0d43dcc7e7c6b763cd9cafc4.png)
![[Diagram]](../../diagrams/1/88933ec2dabcbbe76603ef21ed23543e.png)
![[Diagram]](../../diagrams/5/2a9216ed3df3ad79988edbbd3da7c018.png)
![[Diagram]](../../diagrams/3/efc27e5c305bec4b12d120265fbc1926.png)
![[Diagram]](../../diagrams/0/748ff4712950f078f4bb300b85e1bd69.png)
![[Diagram]](../../diagrams/4/1478e0caa6ac1b953b07a947aa5e866a.png)
![[Diagram]](../../diagrams/27/ed7f1d4c3c915d1891cec834f2e2b02a.png)
![[Diagram]](../../diagrams/13/2ec9f6a38b88d95c7c427a52c0063f4d.png)
![[Diagram]](../../diagrams/5/193b2efb97875fba5a344c47df1b494c.png)
![[Diagram]](../../diagrams/31/f4a596f17ce0f28470056c297be7f709.png)
![[Diagram]](../../diagrams/23/8f99ff894b83b01609a5142bf9c5bf23.png)
![[Diagram]](../../diagrams/38/ed17b3464382490f9a259707dee66621.png)
![[Diagram]](../../diagrams/39/b711b8491e3c9b99c7916f57c0ae3b9b.png)
![[Diagram]](../../diagrams/45/cc68b366e5b9cb4a104ca7b7d110f6eb.png)
![[Diagram]](../../diagrams/36/6bf3c0cf1e985065e5aaf3d121250223.png)
![[Diagram]](../../diagrams/37/4def2883f32abf59efdc8ed7bdfbc67b.png)
![[Diagram]](../../diagrams/29/9848808b24feaeee1bdaa5a4879bed5b.png)
![[Diagram]](../../diagrams/1/293793d63968a23dada112e4a832937d.png)
![[Diagram]](../../diagrams/21/63ee804f0704b5744dfeeead85fb5a0a.png)
![[Diagram]](../../diagrams/47/edee107883b73afc177fec0e4f2ba9e0.png)
![[Diagram]](../../diagrams/13/09be62d95202a80822ac0e3af1a3ee7b.png)
![[Diagram]](../../diagrams/51/315b4a68d7a452d789177b5740003fb1.png)
![[Diagram]](../../diagrams/25/66b62d2a656041f28e54a3b936ce8d08.png)
![[Diagram]](../../diagrams/26/83f8ca4dc4c693238b6a0bff52d31320.png)
![[Diagram]](../../diagrams/52/3502a6ab83ea3c5bbfa45ef23adeeb10.png)
![[Diagram]](../../diagrams/29/432a2c8fab6f5ab795d0d1bf36a098f6.png)
![[Diagram]](../../diagrams/38/258dd882fd5bf244ef652a19de3006da.png)
![[Diagram]](../../diagrams/35/febb99e8a78a41eaa0a94f613935c785.png)
![[Diagram]](../../diagrams/5/2339a9061c04e50cee733a82034fcfa0.png)
![[Diagram]](../../diagrams/7/9345b8958dd385accfbf8a9a01cddefa.png)
![[Diagram]](../../diagrams/22/bb875625a8f1cbd18c3b22569aa2d6bf.png)
![[Diagram]](../../diagrams/52/16e594f4bd90c6b048baa19ad49dfb35.png)
![[Diagram]](../../diagrams/45/be06231b8d64f68dbc70c339f638ed12.png)
![[Diagram]](../../diagrams/10/5e1d3cb547bc8c04285a4966eb2d30a7.png)
![[Diagram]](../../diagrams/25/2baaaaa8002c7473dd8de9fd27597f36.png)
![[Diagram]](../../diagrams/35/d25f9f69f25f74e43c1b86df938208a7.png)
![[Diagram]](../../diagrams/40/fc567ef8f6cf79be7ae71a68038fb9c9.png)
![[Diagram]](../../diagrams/4/96a69f1628bbdfde1b0d6c7ca038c71a.png)
![[Diagram]](../../diagrams/52/3bcac4e4f43309c8f6f54e3c0350a710.png)
![[Diagram]](../../diagrams/0/1930640dda746a49031ccf9a0837f691.png)
![[Diagram]](../../diagrams/37/7cf2a4db608750b7eb84151776732414.png)
![[Diagram]](../../diagrams/11/57852db537552b49a1ec3eaa631990ab.png)
![[Diagram]](../../diagrams/19/9267826f1d9447ccc095e041a21d5f36.png)
![[Diagram]](../../diagrams/39/5b6d85ff5180f5d77f7dc6ad0fa4da4f.png)
![[Diagram]](../../diagrams/13/9790da0c5417078561a3f2c251aac789.png)
![[Diagram]](../../diagrams/4/1dd897b532d455850a6f6daa4ab5179d.png)
![[Diagram]](../../diagrams/34/9ee693a1e2c95a7ff9f60c69d8d773ab.png)
![[Diagram]](../../diagrams/10/702153818efa85ce43bcf043848e1949.png)
![[Diagram]](../../diagrams/33/734c27466ba2f0edd137597008f4311e.png)
![[Diagram]](../../diagrams/7/3b878c471c99d9dd571cfbbfea3449c8.png)
![[Diagram]](../../diagrams/2/280fac44ddf2d4c5d86376c08e04eeee.png)
![[Diagram]](../../diagrams/3/1f04a5c5b04c1fd2ab1c60c77cdb866a.png)
![[Diagram]](../../diagrams/51/b855e64cc978fc7a9e3d4ae8d1892838.png)
![[Diagram]](../../diagrams/32/194678cf87a53f0c6c768ab703461078.png)
![[Diagram]](../../diagrams/33/a62e96f01b76c505dbf57bfd2021a159.png)
![[Diagram]](../../diagrams/52/cc92a1a44c7d4faf0fb81dce816b1e9c.png)
![[Diagram]](../../diagrams/2/5e58ed02f7d62304f6194f8ec290de69.png)
![[Diagram]](../../diagrams/22/97338bedc3304ca84f708abe4afed625.png)
![[Diagram]](../../diagrams/31/2d1c2da231eda874763a1f14e2903d4a.png)
![[Diagram]](../../diagrams/1/bf358137619e1c2a18ee2d66ab66ec41.png)
![[Diagram]](../../diagrams/37/22be432699d8a41d78ef6c0c314c5beb.png)
![[Diagram]](../../diagrams/26/fe853d239d9a17f809817caad435b4e9.png)
![[Diagram]](../../diagrams/10/2c91abc9185ce811a5c793ca37faed1e.png)
![[Diagram]](../../diagrams/26/e49a333f1f24b06f32097f68f34b4985.png)
![[Diagram]](../../diagrams/2/ed0b85450c663036eeaa5c146778532d.png)
![[Diagram]](../../diagrams/11/16dfb078067b65a0368f9719831390d1.png)
![[Diagram]](../../diagrams/21/3f866ce43ac9361c5c5e791b1d979a94.png)
![[Diagram]](../../diagrams/0/9e2ee060129c34e49bae681d329d5bc7.png)
![[Diagram]](../../diagrams/32/c2b461caf32e9d6d3e864657524606ca.png)
![[Diagram]](../../diagrams/23/302b36d3e2252abc05f7dd8ea421b9c2.png)
![[Diagram]](../../diagrams/24/95646be97ae6717adda77a5915ad1a35.png)
![[Diagram]](../../diagrams/6/93578db76ff918e4c1264e3804c33d8c.png)
![[Diagram]](../../diagrams/35/67c61aa389c1f0b08b9b6b21b31ae7ee.png)
![[Diagram]](../../diagrams/27/97a7315207c3d61f3696d7e81680087f.png)
![[Diagram]](../../diagrams/19/15571a49b450a55a0dfc9b3a65d425ff.png)
![[Diagram]](../../diagrams/50/d5d915ee764550c3e845ba4ad1fc5cc9.png)
![[Diagram]](../../diagrams/7/66d8cdbfe5be369689dd5b01168a11e0.png)
![[Diagram]](../../diagrams/4/da03954a1460c2629245abf9b35fb62f.png)
![[Diagram]](../../diagrams/18/cd7a47220ec2e6ad84fdbbfd868fecf2.png)
![[Diagram]](../../diagrams/27/072c77dd839fca25815c7de035d6aaf7.png)

![[ext]](http://toriyamaworld.com/hikago/gallery/screencaps/hika-anime-01.jpg) http://toriyamaworld.com/hikago/gallery/screencaps/hika-anime-01.jpg
http://toriyamaworld.com/hikago/gallery/screencaps/hika-anime-01.jpg
![[Diagram]](../../diagrams/11/87bb2c55ab7275e4c1126917134ee11e.png)
![[Diagram]](../../diagrams/13/63833bfc8910c5109ef15f30af6323ee.png)
![[Diagram]](../../diagrams/31/e2f48e49e5242c8ae0df388983144da2.png)
![[Diagram]](../../diagrams/5/bd04e15987d02e77c33b030669d46d4e.png)
![[Diagram]](../../diagrams/52/aa84032713244d56bbae1e95829b998c.png)
![[Diagram]](../../diagrams/29/43ae814fe630a2371c8d61d3a651f95c.png)
![[Diagram]](../../diagrams/36/d49154afa5ab481a82341ac851abf72d.png)
![[Diagram]](../../diagrams/4/722456f52b87413e5958ddff8876fbb7.png)
![[Diagram]](../../diagrams/30/5543c1b94044b8c6fcb6b6f161d07ad6.png)
![[Diagram]](../../diagrams/26/53398d1fc58d318df929d28a55757204.png)
![[Diagram]](../../diagrams/49/f10fa4e883f68071c155343978817e6c.png)
![[Diagram]](../../diagrams/31/c6c27cd5fad9e35984541c8c7463f3e7.png)
![[Diagram]](../../diagrams/49/5f60a6af9b89b925ce8f5c0a0d279354.png)
![[Diagram]](../../diagrams/6/e47d7421ec2a05d4031ad37d76f3a88d.png)
![[Diagram]](../../diagrams/47/91db8c77eca2446ebad0e93056b09d1d.png)
![[Diagram]](../../diagrams/48/8901038efb431b819c72541eb54db9a0.png)
![[Diagram]](../../diagrams/28/2bcf27ecba4658a885cf988c05439555.png)
![[Diagram]](../../diagrams/3/312176627db57bad9c249d1bf15c9cd5.png)
![[Diagram]](../../diagrams/20/d665159f38799ecdc0c2eee01c8563d4.png)
![[Diagram]](../../diagrams/32/9d25c525d2cd08d5e47fe059c404bacb.png)
![[Diagram]](../../diagrams/37/cff5ba05e12e5dfbc9b30bea36576fca.png)
![[Diagram]](../../diagrams/30/35d020518999f5a60c23fe2042108e5e.png)
![[Diagram]](../../diagrams/9/6397ec723580345697c76c03e77dfb6d.png)
![[Diagram]](../../diagrams/29/3c8822596b9b583ce287bb6198fcf415.png)
![[Diagram]](../../diagrams/15/7a3970361fbc9820e3eb2944655a981b.png)
![[Diagram]](../../diagrams/5/0dc401613e8c6960ef1499636d548826.png)
![[Diagram]](../../diagrams/29/cda05c66ff1651dbdd46ebf25129c714.png)
![[Diagram]](../../diagrams/34/0461f0645bc4d98298df0b09149e59f2.png)
![[Diagram]](../../diagrams/39/33269d876de3b299ebf969bdfa5c5e24.png)
![[Diagram]](../../diagrams/52/5cf7de151f216e14cdce07408cfe56a9.png)
![[Diagram]](../../diagrams/42/d0afcebbc97bcab87b8d27d530155c8f.png)
![[Diagram]](../../diagrams/44/9db0e052a82a48ef2a8cc9f8e2cbd161.png)
![[Diagram]](../../diagrams/52/1218dbad98ac4abea130ecfa9b4e3f16.png)
![[Diagram]](../../diagrams/9/ad0a51da2fdbef0fae1270316b5a0f0d.png)
![[Diagram]](../../diagrams/13/d032d621ff848a0fa9a4a96f807ddcd7.png)
![[Diagram]](../../diagrams/49/6a635a7599755357d96cc00082799b82.png)
![[Diagram]](../../diagrams/22/5ffa67c062b513b860ee8f9f22962dbe.png)
![[Diagram]](../../diagrams/14/f543a00503a49b44cf53a87012dd03be.png)
![[Diagram]](../../diagrams/35/c8c50de946c03acad0662e5e30358631.png)
![[Diagram]](../../diagrams/15/782d2c1ccfc2ab4c70b6212d6f28144a.png)
![[Diagram]](../../diagrams/44/4e75b06e15d58535cad0d246fbbb62e8.png)
![[Diagram]](../../diagrams/8/0edb9691cdc01a2a6959c047d17b2e6b.png)
![[Diagram]](../../diagrams/33/ae839f2e922c4dd7c80c212777d9a589.png)
![[Diagram]](../../diagrams/17/b522b6fe046040872aa4d205d3e81093.png)
![[Diagram]](../../diagrams/22/5410459d7fb3ee264fedd46074b0c1a5.png)
![[Diagram]](../../diagrams/31/666eb856b001a7b53e8ed108bd9604a8.png)
![[Diagram]](../../diagrams/28/0c0251d6867bfa4f3d1473e55bcc3949.png)
![[Diagram]](../../diagrams/2/cb98e11ab3ab0bbd3b05f225f4ca2a49.png)
![[Diagram]](../../diagrams/22/ee02ba83225e50255aac9b4f0238e59c.png)
![[Diagram]](../../diagrams/42/e0498f8c4c3488252b70c35068193f54.png)
![[Diagram]](../../diagrams/23/fce8fe6b25dfddc070d831c4b2f23fff.png)
![[Diagram]](../../diagrams/34/3d1d6f5d09943e426534c2b50c1b29c8.png)
![[Diagram]](../../diagrams/52/86c30ce6c5aab064139e9d8850f4dd75.png)
![[Diagram]](../../diagrams/16/6dfe5b498bcd29f264339c9d758b6927.png)
![[Diagram]](../../diagrams/16/e81ae1dc9fb77f45c8deab3affb764c4.png)
![[Diagram]](../../diagrams/42/284fc19931cddf1f7c9550f7450f0636.png)
![[Diagram]](../../diagrams/19/10aa514cc040307459f4cba6a32eccfc.png)
![[Diagram]](../../diagrams/39/dbf0b68862efca076534dd9e1f078401.png)
![[Diagram]](../../diagrams/45/03f2ae621c17c5422dac88c367ef44f9.png)
![[Diagram]](../../diagrams/14/3536d6654b39e7fd2b0ac2a343f04b9e.png)
![[Diagram]](../../diagrams/27/9564a3803e5f6aa19d775cb7257838f9.png)
![[Diagram]](../../diagrams/10/eebb39debd30b9213bc29d790b46355c.png)
![[Diagram]](../../diagrams/27/18ee0ae1a6b41f64fd7fe1d9765eba37.png)
![[Diagram]](../../diagrams/31/118e5587e2c0e5c8ea9300b64ab09c2e.png)
![[Diagram]](../../diagrams/30/ee0c55126fd773abaed0476e66ba8d7d.png)
![[Diagram]](../../diagrams/6/00a4b2ba128649cd9a82d5305b015ffe.png)
![[Diagram]](../../diagrams/22/84aef22c3cacd7c24ce078dc1bea7cb4.png)
![[Diagram]](../../diagrams/31/3abd662b92f0ce2a7c73f05af005c509.png)
![[Diagram]](../../diagrams/1/4263a538be26488bdf170921e61f2d98.png)
![[Diagram]](../../diagrams/30/b0338c300eda6dbda1553f6a1f4e0ce9.png)
![[Diagram]](../../diagrams/6/83e6933be0184c822785027ed0e79188.png)
![[Diagram]](../../diagrams/44/29952791373c7241f2fc968815093866.png)
![[Diagram]](../../diagrams/20/4f7f2a1efbf1208d642f1ae4aa6b29a9.png)
![[Diagram]](../../diagrams/32/c373242f4535d0db54e0cba95569d830.png)
![[Diagram]](../../diagrams/22/c9f69977bb759403b370de0a165a7867.png)
![[Diagram]](../../diagrams/36/c39e69a7f423183b883ba1502d9536f9.png)
![[Diagram]](../../diagrams/3/4a16e18d39d46b54c944f638f1c12a01.png)
![[Diagram]](../../diagrams/2/bd7f92541ebd2e05ce3b9a1043ea69e7.png)
![[Diagram]](../../diagrams/50/ffdd1f325a31f22ed3600dc702a1554e.png)
![[Diagram]](../../diagrams/37/e3d7cfceaaec2fc798d67d3fe04d20db.png)
![[Diagram]](../../diagrams/37/7e5b806e5dad6211c864c68d8fcabbbd.png)
![[Diagram]](../../diagrams/44/93783ef8508dd54466f52254c84aca4a.png)
![[Diagram]](../../diagrams/39/90aaf5086ebb8cad348bad22f65db218.png)
![[Diagram]](../../diagrams/36/90dcae1f4b08b4fccdb871c1f72f447c.png)
![[Diagram]](../../diagrams/49/6c16c9354cf7f599e6ebeeebbe3f4f0b.png)
![[Diagram]](../../diagrams/43/156b1d7bd6f047e3231cd006c5b44682.png)
![[Diagram]](../../diagrams/47/051484d7eb01d2b1cb3812d3dfa207c3.png)
![[Diagram]](../../diagrams/37/4bebf07f5224f1bff777198448cf1134.png)
![[Diagram]](../../diagrams/48/7b989007131e553ab772b2b26c36913a.png)
![[Diagram]](../../diagrams/3/18784343d405894902152e18b1160d25.png)
![[Diagram]](../../diagrams/26/66f167be6a21c3c72c713ab899d25288.png)
![[Diagram]](../../diagrams/32/93b4be9905df5caa390ff9cb42c6db52.png)
![[Diagram]](../../diagrams/6/d89af4cceb30fb156bd5c0622dc8f211.png)
![[Diagram]](../../diagrams/19/4a47e0ec303ddd97b8f959c6d509fe6c.png)
![[Diagram]](../../diagrams/2/245df852da759e2a63e7c7bebf502482.png)
![[Diagram]](../../diagrams/16/2ac204591aa3c555db80cc54316d6738.png)
![[Diagram]](../../diagrams/47/d44d6e0c6d80b2b1f1fa8469545dd5d8.png)
![[Diagram]](../../diagrams/25/01eb63c805cbd0ee3bf0af7f8267160c.png)
![[Diagram]](../../diagrams/18/4f5cd66ff20392a1918efbb6ba917cc0.png)
![[Diagram]](../../diagrams/26/c9cdcbebe3e7f3f34f7043a467ab398b.png)
![[Diagram]](../../diagrams/16/c2c1dcfe7f584ad49f19c33d7a0d76a2.png)
![[Diagram]](../../diagrams/25/380225e5078f44de2c22e89fb1b50d17.png)
![[Diagram]](../../diagrams/41/9d40ea69c2dd9a381f34f89ae42a19c7.png)
![[Diagram]](../../diagrams/27/77e72247d65613a6137784955d3d982b.png)
![[Diagram]](../../diagrams/27/5db81b2a9ed9adfe0c7f835a25f5174d.png)
![[Diagram]](../../diagrams/13/69444d3d445453cfd7f4c72923f2d0f0.png)
![[Diagram]](../../diagrams/44/0e1ef9859322cee935c89dff964be8b8.png)
![[Diagram]](../../diagrams/26/6617049b11cc9477a650f87b2e07e2bb.png)
![[Diagram]](../../diagrams/14/5d3e1158bac418a3c7544a15b57e1df3.png)
![[Diagram]](../../diagrams/38/d03038e248ddfda2bdd2cc2299b6c09c.png)
![[Diagram]](../../diagrams/30/a34fd1969dcbe212850573cc8575cc15.png)
![[Diagram]](../../diagrams/43/5f5f376581e62a89c3d0ff927241ae6d.png)
![[Diagram]](../../diagrams/47/60870c4a28972ee48ecc63a753fd71be.png)
![[Diagram]](../../diagrams/17/8de8644f8bb365c3c8bc788fa4d598eb.png)
![[Diagram]](../../diagrams/31/391caf6cf5fc6ac0bcb8d39ac59601db.png)
![[Diagram]](../../diagrams/28/a96791177d0444b2ea08b1b53d345bd8.png)
![[Diagram]](../../diagrams/24/4bc01814fd83fd839ce83a522a44669e.png)
![[Diagram]](../../diagrams/7/7b7705da94503c7b0be6f4277452f11f.png)
![[Diagram]](../../diagrams/49/eeb2d31e41ac9b78991791b9417012a4.png)
![[Diagram]](../../diagrams/6/789af88279f305c6658e92a800b5fe5a.png)
![[Diagram]](../../diagrams/52/820690fe089127ab88a3adb69ec3de43.png)
![[Diagram]](../../diagrams/26/a975adc3c10a879451f345c4ca0ff8b3.png)
![[Diagram]](../../diagrams/24/1cd12016f03a4c7f54ca253f450f6688.png)
![[Diagram]](../../diagrams/37/c69bfe3efcc2cb2fdc9b9274e0bc7129.png)
![[Diagram]](../../diagrams/2/9c7de82fe6036c324818f3c589af6899.png)
![[Diagram]](../../diagrams/51/19b0c6f8a0a72f7680186d56a62f41b9.png)
![[Diagram]](../../diagrams/38/75f43cb65cbd62bcbd4de46e8656a38e.png)
![[Diagram]](../../diagrams/9/a3f59ae70753c4510a42d00d8ba7d5d4.png)
![[Diagram]](../../diagrams/52/1e2f125192d03c62271b6d47ff30fb7d.png)
![[Diagram]](../../diagrams/11/665efb6363c30fafdbc798377b57c5dc.png)
![[Diagram]](../../diagrams/0/77ad76333a40234154d6d32dc104549f.png)
![[Diagram]](../../diagrams/51/7f86e87277acfcab6612c796a4b57cdf.png)
![[Diagram]](../../diagrams/13/2a1829877a6b2e7bc70d840c397079f9.png)
![[Diagram]](../../diagrams/1/98d0551253e3fad944a08422f2806de2.png)
![[Diagram]](../../diagrams/51/f075f1cdc8c8a1e4f23827b83f0f9b6f.png)
![[Diagram]](../../diagrams/25/e8a1ed0eb0f804a57abba93af82b5fbf.png)
![[Diagram]](../../diagrams/19/69e2a0f2078f6fb732f37c0eb5a79499.png)
![[Diagram]](../../diagrams/16/6f7a8de44357e96d3cb0f9f3be40c22f.png)
![[Diagram]](../../diagrams/41/71c22388febbf7d5eb108b99b9eb578c.png)
![[Diagram]](../../diagrams/15/dad2bcf4f0a5479d2ebaaeb92c7bba51.png)
![[Diagram]](../../diagrams/0/42e364f60bf110018d4f2fb25a5018ed.png)
 February 27th 2005


![[Diagram]](../../diagrams/11/34c6c1647530c76497804a71ebac55ee.png)
 ARRRGG!! Away for too long. Must get started again...
![[Diagram]](../../diagrams/2/0f4f8ef3d59a6de124d876bb04ce2541.png)
![[Diagram]](../../diagrams/51/0ab1367d2fdae52f78c589e05a4517ab.png)
![[Diagram]](../../diagrams/2/6f75dc6c4ca5be1549f85f5f96e386a3.png)

![[Diagram]](../../diagrams/28/d4a404a7db79e6446513cd83364b387e.png)
![[Diagram]](../../diagrams/5/e2eab6909e0471deb048d4090bf65aad.png)
![[Diagram]](../../diagrams/38/4f59b21a86c3af6a26eb1c7567f1f0f5.png)
![[Diagram]](../../diagrams/23/8b99e5e129091510062f7ed80ea6a27d.png)
![[Diagram]](../../diagrams/3/11c2b6b99bb7db9d19e5dc0c8870e115.png)
![[Diagram]](../../diagrams/26/1ff49893a730546ab2ee718e80c3552d.png)
![[Diagram]](../../diagrams/0/9163fb37b2413312e97869ca259d1c5b.png)
![[Diagram]](../../diagrams/35/ff67b2b319372c584ed9fd59510bd34d.png)
![[Diagram]](../../diagrams/43/6dbfa034b3c2a5fa44ec5ce2c860627c.png)
![[Diagram]](../../diagrams/33/31c9dd0687132a72056b0eb27f2ca8f2.png)
![[Diagram]](../../diagrams/37/bbee6dec142af7077f0bf58c1fbd0f8d.png)
![[Diagram]](../../diagrams/20/3a0887d5c89e49d20d24c40ae5bdefd1.png)
![[Diagram]](../../diagrams/20/2e422f3f7e49b9e2dd8f85178f3f4b3b.png)
![[Diagram]](../../diagrams/46/76cf5d113e821631a98429db7bc7097d.png)
![[Diagram]](../../diagrams/50/1c9fb1dc8df452d183715119265a7af0.png)
![[Diagram]](../../diagrams/26/ac0b3650dd5edda04848e3f7d28bc26f.png)
![[Diagram]](../../diagrams/15/c49e33e92ce5bc87d3c4c9541b4f11e8.png)
![[Diagram]](../../diagrams/34/db40278c3b5297dc598cd1d503ea47fd.png)
![[Diagram]](../../diagrams/36/c5854eef645750efdff891b4b2755211.png)
![[Diagram]](../../diagrams/47/6e38347b94f78e17c2b8b5cfc2e0e510.png)
![[Diagram]](../../diagrams/16/e56a2b187d29f62b3eaa7054fc51e3be.png)
![[Diagram]](../../diagrams/23/2b3623f0c94f435e0373bdf37a32c2f2.png)
![[Diagram]](../../diagrams/8/79032061726976b9dd88869839bb8587.png)
![[Diagram]](../../diagrams/7/ffc1e37702c649a7d440bb406478f20f.png)
![[Diagram]](../../diagrams/31/8631cc50813a886cf68ef6af0ce821a0.png)
![[Diagram]](../../diagrams/39/e10a16a704f075b57c41df4e7f713aa8.png)
![[Diagram]](../../diagrams/13/ea6c9f4040b8901566fb83f674e8ed29.png)
![[Diagram]](../../diagrams/36/6f1fcdf48baae1a8c6b2451cef40eaf4.png)
![[Diagram]](../../diagrams/0/3f9ae0acf3737ec719a58a5d4c5761dc.png)
![[Diagram]](../../diagrams/51/3655f964a13d5e172d0b63c9931d36ea.png)
![[Diagram]](../../diagrams/39/24e7f76daaa4c0d41b183a5699c6ec51.png)
![[Diagram]](../../diagrams/40/52032fe730be085d882bf1d3f5d4dbe7.png)
![[Diagram]](../../diagrams/41/0977444f25b48016d34b90cc03f7a912.png)
![[Diagram]](../../diagrams/52/bad4739ea6333d96b67856440e031aa9.png)
![[Diagram]](../../diagrams/34/550981125cc85ef20acb3eefa2f9a075.png)
![[Diagram]](../../diagrams/4/58a6ced89e73b951f58f3213833ef972.png)
![[Diagram]](../../diagrams/51/ce2326fb9fcf3d2d056b93b944509ad3.png)
![[Diagram]](../../diagrams/52/70fe353a440b712688ed945997ede2d5.png)
![[Diagram]](../../diagrams/24/6007854e1e15169b072c0cf7c23fa40e.png)
![[Diagram]](../../diagrams/46/788d1fc1db620718250b3f055493ddaa.png)
![[Diagram]](../../diagrams/20/2d4a7639688ed54f737fae05d020e8cc.png)
![[Diagram]](../../diagrams/10/7b96873959816b5a1b4a99480aa27902.png)
![[Diagram]](../../diagrams/40/bf1a555be2b0e669eb7b19e1f8dfad00.png)
![[Diagram]](../../diagrams/19/c656157e1d129319d8661fee08a16ac3.png)

![[Diagram]](../../diagrams/5/32f121a77879cc06cb6a6f4373948d96.png)
![[Diagram]](../../diagrams/18/d548b070cd28c65441ce594f972c31be.png)
![[Diagram]](../../diagrams/44/6dcc7ddc2d447bf0a169b1bf4a018763.png)
![[Diagram]](../../diagrams/30/21eb0d83396056fac19156d4c0be4315.png)
![[Diagram]](../../diagrams/19/1fab7682d2afed1743c6eec3a9e093af.png)
![[Diagram]](../../diagrams/27/945fa4c65c73fc5fd89ef6c4817d59a3.png)
![[Diagram]](../../diagrams/22/2c72e0abe7f9f60f15de33ed50d60e94.png)
![[Diagram]](../../diagrams/12/4bac49ec4f941edd547b529cb85fb93e.png)
![[Diagram]](../../diagrams/48/cf42f031ad8884ac24dd1a849a922dee.png)
 .
.![[Diagram]](../../diagrams/7/92b272c84d3ad7040d82d0e38f367059.png)


![[Diagram]](../../diagrams/0/6592f3dbe538f34290ec58fae99afd57.png)
![[Diagram]](../../diagrams/52/51cc8055629bf6b9b9112f195fedfe75.png)

![[Diagram]](../../diagrams/49/90d43fba25736ae06424749b46b293a7.png)
![[Diagram]](../../diagrams/40/433de6ddb1281ed6be1563f97a0102ab.png)
![[Diagram]](../../diagrams/19/f04fe74b836e402aed4a71b6fa18c3c1.png)
![[Diagram]](../../diagrams/24/ef7d8b9b646b1e0b58f396d3adb7fa0a.png)
![[Diagram]](../../diagrams/22/cb492a22d39a2ec5ead222baadec6293.png)


![[Diagram]](../../diagrams/13/d924ad4c6a49ca2e8b5d4f6f9111bb97.png)
![[Diagram]](../../diagrams/36/9213ee3fa30e33bf0c6bfbbff550e2a7.png)
![[Diagram]](../../diagrams/34/c93e9496a3a5c97da68a22ebd53e1bba.png)
![[Diagram]](../../diagrams/23/9dfc67c38dd7c59695287b89615b31b9.png)
![[Diagram]](../../diagrams/51/e9bf62dba4a9157cb5ba920cd9f5a9bc.png)


![[Diagram]](../../diagrams/39/735c9b155709a610256028ce87597898.png)


![[Diagram]](../../diagrams/21/c8bc81d80e5f332564d25caf4b9fae07.png)
![[Diagram]](../../diagrams/7/3cbaf03084595b49edf0689345255f71.png)
![[Diagram]](../../diagrams/13/df67f359aabf701061127eedae366ede.png)
![[Diagram]](../../diagrams/50/2b2738f23f20e583880069c31879e51d.png)
![[Diagram]](../../diagrams/34/11a5868babd711ba5585c80a301c7d93.png)
![[Diagram]](../../diagrams/44/8736b6223e0b8e351607e84084069b0f.png)
![[Diagram]](../../diagrams/3/851cfb1fa082911bf9e1ab1498ead1aa.png)
![[Diagram]](../../diagrams/24/667dbd7e4c1b20586bad98414ef35664.png)
![[Diagram]](../../diagrams/49/97c6197396f9f12c2010e27a2b868cb8.png)
![[Diagram]](../../diagrams/11/b1dd2fdc35139d746fa2a2b5bc07d08f.png)
![[Diagram]](../../diagrams/36/b0d5016b1e9fc43564ade10ea75b7234.png)


![[Diagram]](../../diagrams/35/30abf7450f826dd1977988fb9fe2730a.png)
![[Diagram]](../../diagrams/27/c63e7a2c8d35a3f41d9493aea4ef53dc.png)


![[Diagram]](../../diagrams/0/924ce80f79404792edeb898a4c15a355.png)
![[Diagram]](../../diagrams/26/10e131e28ff77afde7bb175df94464da.png)
![[Diagram]](../../diagrams/46/4f499f6ffc587e7bb193935557400859.png)
![[Diagram]](../../diagrams/24/f2184de72ead0dbc3243d83a3a5133f9.png)
![[Diagram]](../../diagrams/43/7dcd46db8613de2f4b5a85ef5b6dc219.png)
![[Diagram]](../../diagrams/4/0f58486191eaa0f3a27180cdcefaf688.png)
![[Diagram]](../../diagrams/38/106bcdc578631366d8b71645be86235c.png)
![[Diagram]](../../diagrams/5/d4186be5cba4413e00d2b5bfb91e34d0.png)
![[Diagram]](../../diagrams/15/0bf49cad888467f17f59a36299822677.png)
![[Diagram]](../../diagrams/46/71d7aa0a77de0292a0f251fd60c57ad1.png)
![[Diagram]](../../diagrams/11/d14f44d50f7522e7a0a9c9e290734ac6.png)
![[Diagram]](../../diagrams/25/fb04280d25004e49d1d1787893f5dd42.png)
![[Diagram]](../../diagrams/31/98b9a64cfdf94dee8e1f3f87b7964787.png)
![[Diagram]](../../diagrams/1/38547188460aedc6b605959d2d8cf735.png)
![[Diagram]](../../diagrams/34/409b9319e16ff099796d92c1e337532f.png)

![[Diagram]](../../diagrams/40/3c3df5b2aadd9426d0a564b6e91577d3.png)
![[Diagram]](../../diagrams/38/6bdf54800f123d4352ada69c614e63f4.png)


![[Diagram]](../../diagrams/8/f8a2ae448d7ee3295bb17c66e5689d63.png)
![[Diagram]](../../diagrams/34/5bebf8c1d2660384e423cb77c1d5290c.png)


![[Diagram]](../../diagrams/33/1d4f3e3b800a43d295d3f0619d418d5d.png)
![[Diagram]](../../diagrams/49/2e34913960b19020518295e69b7e1067.png)
![[Diagram]](../../diagrams/19/0b18a54f2926329b7fe8e1fddd5b3611.png)
![[Diagram]](../../diagrams/33/9626c7fffeb2680846e494c54eeb744c.png)
![[Diagram]](../../diagrams/48/022764e9aea0c5cbe2320be2b1ae117b.png)
![[Diagram]](../../diagrams/11/a86337b4209b69c733efc6c2af917bca.png)
![[Diagram]](../../diagrams/12/8dbfc1908701482496804d8a60782ec1.png)
![[Diagram]](../../diagrams/29/5cfeeb53946943eba7715e4031ed392f.png)


![[Diagram]](../../diagrams/52/cda881e785327f7e534b1059c76ae83b.png)
![[Diagram]](../../diagrams/10/383928423e9e2d80278f47a63c78fba0.png)


![[Diagram]](../../diagrams/25/458a9782fc1dc6fadfcff0f67df92213.png)
![[Diagram]](../../diagrams/27/8faa7f8525c888dfda6d1797fbcfe8d1.png)
![[Diagram]](../../diagrams/27/4b5fc192900111b2aedd29747304950b.png)
![[Diagram]](../../diagrams/26/7924a7960c58ad2d577b1a27a9b7b60e.png)
![[Diagram]](../../diagrams/23/eacf19e5100be5d641aeb0babc8dea5b.png)
![[Diagram]](../../diagrams/15/2e5c2555fe48d156b9df43d82b7dbcf7.png)
![[Diagram]](../../diagrams/32/38ecb0f6dbf7c9c32ee25176f95546ac.png)
![[Diagram]](../../diagrams/34/77700471a66cec7cf8edf885aed623a1.png)
![[Diagram]](../../diagrams/48/22131299128d3916a285610d02db6784.png)
![[Diagram]](../../diagrams/24/33e71061dfed14c9cb1f38dd08d52387.png)
![[Diagram]](../../diagrams/3/af53f69eca43afc6c7ee8144e6afd5b7.png)
![[Diagram]](../../diagrams/34/08e5521c6795d1374385ad73be17bd54.png)
![[Diagram]](../../diagrams/34/f8001b8a621510ba452d1a3a76875c45.png)
![[Diagram]](../../diagrams/16/22f551db03e7e3710aaa67090157f178.png)
![[Diagram]](../../diagrams/8/05698951b50ed9799a1a596eab5adc65.png)
![[Diagram]](../../diagrams/40/95123bcd796a83f53e4bd99ded277c46.png)
![[Diagram]](../../diagrams/48/a75eca1cd13b37ae532d080752455dbb.png)
![[Diagram]](../../diagrams/48/4a92af9b10d2fb9ce6b7c3232d1582bb.png)
![[Diagram]](../../diagrams/3/4386331746320ee348f4282dec4a1fcf.png)
![[Diagram]](../../diagrams/4/6fc81c1caaecef970b0d54b8def9b6e3.png)
![[Diagram]](../../diagrams/16/7e9f14e880495c1de551419c9c68b893.png)
![[Diagram]](../../diagrams/29/bf086284bf8c86b823300d85474fa258.png)
![[Diagram]](../../diagrams/2/d72e3de85eb9c1632e94a8056a6613a6.png)
![[Diagram]](../../diagrams/39/64ed0e881c26ce79a372a6aaeefe87bb.png)
![[Diagram]](../../diagrams/21/782a261cb5b2dd939d281fa438bfd27e.png)
![[Diagram]](../../diagrams/29/2699257482f389c6f55148f99efa1eb8.png)
![[Diagram]](../../diagrams/4/a94bb1b45128d8b8f1750ba2b04398df.png)
![[Diagram]](../../diagrams/31/18d1a0633cb575ff33abaebbe2d64524.png)
![[Diagram]](../../diagrams/45/70ec5a9d182fd3a9b3b9682d1ce7d056.png)
![[Diagram]](../../diagrams/44/3c3cb25d5f2ff05445d3c8896e17cb7e.png)


 5k
5k![[Diagram]](../../diagrams/22/b6fde4659278495c065e38974171c305.png)
![[Diagram]](../../diagrams/15/ae81720d68428725b51b48d9cf4cf69c.png)
![[Diagram]](../../diagrams/6/62410c45a17ae89584e43667a6e60878.png)
![[Diagram]](../../diagrams/21/a270251348a07bfcf814ec66fd884667.png)
![[Diagram]](../../diagrams/20/e0058d1e9b5f9817cec5273d53d98594.png)
![[Diagram]](../../diagrams/22/58ada8ef6bcc5969e3502b76ce8d17c7.png)
![[Diagram]](../../diagrams/7/0844b805cf1f47c46c3a4701fdf6f643.png)
![[Diagram]](../../diagrams/4/ee8918a297d953401b281f3964b89e9a.png)
![[Diagram]](../../diagrams/11/bbf060043ce11955812503245c52444d.png)
![[Diagram]](../../diagrams/48/19c7304be3c1ce9fa126c1f21093d992.png)
![[Diagram]](../../diagrams/44/c07f7970f651f5be9e194d9485a89cac.png)
![[Diagram]](../../diagrams/49/27cfd1d4aa39adf7d2f139c2976cc081.png)

![[Diagram]](../../diagrams/51/8713de1efcb770963afaa5b7650a467a.png)
![[Diagram]](../../diagrams/1/09b3f9f45df585872905060b40de5ca9.png)

![[Diagram]](../../diagrams/28/1836d68cfbdd2b187479ffaac84bb107.png)
![[Diagram]](../../diagrams/12/d706a6365ae593285b64f47e6eebd6a0.png)
![[Diagram]](../../diagrams/50/6cc61954dc9ad78bc04bb3db4ef73f28.png)
![[Diagram]](../../diagrams/18/625549d0cde770a69895f8f9f1e9bceb.png)
![[Diagram]](../../diagrams/34/97faaf9c98e751c073b3f6130abce4b5.png)
![[Diagram]](../../diagrams/4/8ea23f6a686ec89badcf266aba33b081.png)
![[Diagram]](../../diagrams/33/140e0955222771c2ce7c4af84e68e555.png)
![[Diagram]](../../diagrams/6/1a41bc54f1f508deb20bc1c07ed6b190.png)
![[Diagram]](../../diagrams/7/fb0878b5fee2147b7d1cdaa09a06fec9.png)
![[Diagram]](../../diagrams/11/c75f562bb6af9a17fbf549ed5942559a.png)


 See
See ![[Diagram]](../../diagrams/48/4478388b0875dca4726e4684dd373033.png)


![[ext]](http://www.shogunsgallery.com/images/4J375-1pic7.JPG) http://www.shogunsgallery.com/images/4J375-1pic7.JPG
http://www.shogunsgallery.com/images/4J375-1pic7.JPG![[Diagram]](../../diagrams/0/26616f7526b1b8236545ca00dc6a58c0.png)


![[ext]](http://photos1.blogger.com/blogger/755/1661/1600/Go%20Boards%203.jpg) http://photos1.blogger.com/blogger/755/1661/1600/Go%20Boards%203.jpg
http://photos1.blogger.com/blogger/755/1661/1600/Go%20Boards%203.jpg![[Diagram]](../../diagrams/41/00106cd894e12380d7a986ec2111b3af.png)
![[Diagram]](../../diagrams/36/8f0424f4b0d68c36ae4089988facd4ea.png)
![[Diagram]](../../diagrams/30/bea7b50ca1469f18a8965915c18592eb.png)
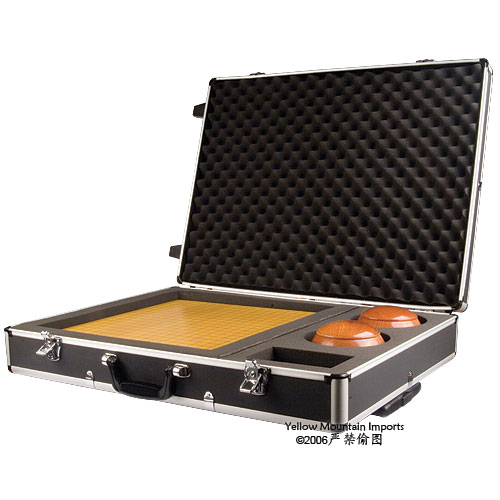


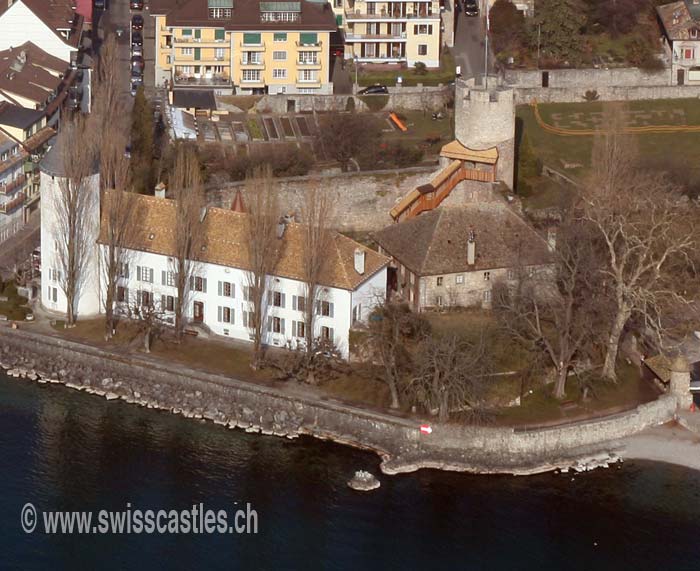


![[Diagram]](../../diagrams/34/f8f1a7a5d5c5f5a2452807565bdd0fee.png)
![[Diagram]](../../diagrams/36/bdcee4b673aece1f3af4811044780f3c.png)
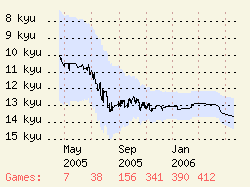

![[Diagram]](../../diagrams/42/d467d8cadab47b2548889f8244fd4290.png)
![[Diagram]](../../diagrams/36/21cf7499277b7daf7fc1b2e2d6b8efe9.png)
![[Diagram]](../../diagrams/33/0f2d5392d94fc14c9fd6fadc0857f9f4.png)
![[Diagram]](../../diagrams/36/f435ab847c52b4d11081c3a89442afd0.png)
![[Diagram]](../../diagrams/22/3e59d7dd7c7b0b04639b41b5ac035f76.png)
![[Diagram]](../../diagrams/9/0c4805df6118a6cc7a84b2976a0f396f.png)

![[ext]](http://www.angryflower.com/timefo.gif) http://www.angryflower.com/timefo.gif
http://www.angryflower.com/timefo.gif


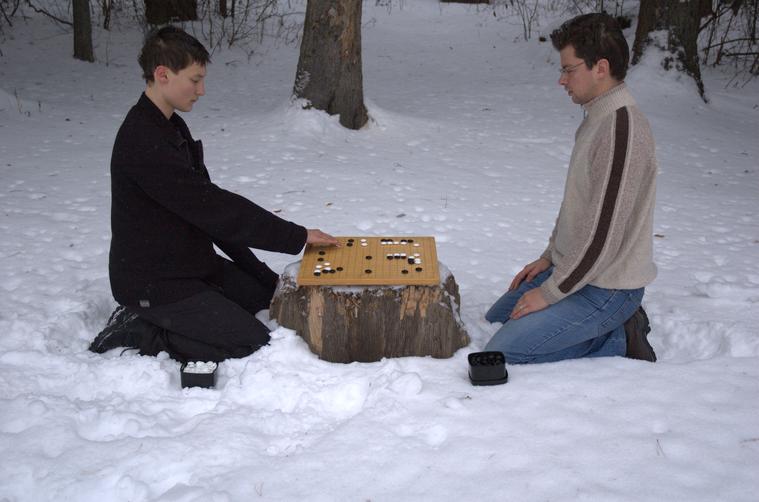


![[Diagram]](../../diagrams/7/2f4017bb9c02ed280c16f0a4e9e06b75.png)

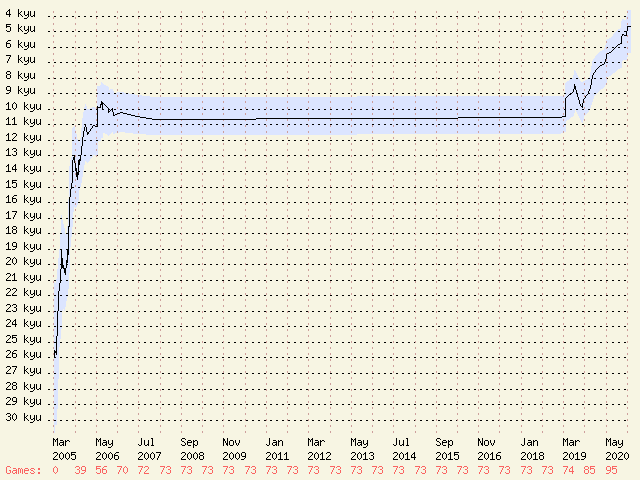
![[Diagram]](../../diagrams/28/92df67994daaea51c9bd50154750f72e.png)
![[Diagram]](../../diagrams/19/1410009beff34c7e7861ac8aafb15fe4.png)
![[Diagram]](../../diagrams/41/0ac6de987a8eb30b9de519bbbf1f6321.png)
![[Diagram]](../../diagrams/41/3b1e6b6cb2aac248512e06bc65ee95c0.png)
![[Diagram]](../../diagrams/1/e5d0bee680434da83f01843332e432fc.png)
![[Diagram]](../../diagrams/31/c7423e113c5634ac34fae3586c90adbd.png)
![[Diagram]](../../diagrams/19/59cad85f914798c14b2827de486cf846.png)
![[Diagram]](../../diagrams/19/21ea7e5744d31113c3156b1b7f17eb11.png)
![[Diagram]](../../diagrams/47/4a62c1bf08ee090d3a87a32c48b1685d.png)
![[Diagram]](../../diagrams/26/6aefd7c285aab2ab7fe034657f847b28.png)
![[Diagram]](../../diagrams/50/9d6abefdbe9326ef00e83bdadfd3d282.png)
![[Diagram]](../../diagrams/20/0950caf785bb651c49e56bf55b03f275.png)
![[Diagram]](../../diagrams/32/b98c361cf53e8e35149311eec98f10dd.png)
![[Diagram]](../../diagrams/36/4fe20dd8ba28ad599adf62dad0e13d8c.png)
![[Diagram]](../../diagrams/10/28595739a14e3651289df6e9c56d9934.png)
![[Diagram]](../../diagrams/27/6d238fe1b9ba10aa6a05dd04f84cd24e.png)
![[Diagram]](../../diagrams/49/3fc575bd8cae4a5a9c0662f0ed13b040.png)
![[Diagram]](../../diagrams/49/887d371d443bf39693f7aabf99649583.png)
![[Diagram]](../../diagrams/7/21e4ec9427ad76d4063fd8eed7ea6cfa.png)
![[Diagram]](../../diagrams/28/b70dee9ecf3d3b908f7fb77920e643ef.png)
![[Diagram]](../../diagrams/26/6819a4a32f18412335835120186a20d0.png)
![[Diagram]](../../diagrams/1/62c8168d05382cc3d6d2089644044f10.png)
![[Diagram]](../../diagrams/26/ecbf783eadd79cf8e270dc9eedc4357b.png)
![[Diagram]](../../diagrams/36/47aef43008b8c9106cb745678b08e9ed.png)
![[Diagram]](../../diagrams/28/7aa9e955f0aad97570166a40b33616b9.png)
![[Diagram]](../../diagrams/1/247c79a13bf47632166ba78fc668b18f.png)
![[Diagram]](../../diagrams/0/8159bac9affd7dfb64fd5f773004012a.png)
![[Diagram]](../../diagrams/18/080353b0e0dd7df6cd00aaf657115be1.png)
![[Diagram]](../../diagrams/0/6dbed209b22c894d6334dec9ed4e771d.png)
![[Diagram]](../../diagrams/12/c4d082903fb51140c829fbbd2e40cfff.png)
![[Diagram]](../../diagrams/50/6fbd5908edd4ed3a629c59af6ad8c841.png)
![[Diagram]](../../diagrams/24/0de44e9e0eb63ffd1fd13899b581c9b5.png)
![[Diagram]](../../diagrams/43/f769c8424fc7650dcec17ad5cea55e9a.png)
![[Diagram]](../../diagrams/29/1a900ff5a9e7fec2512956892f60820b.png)
![[Diagram]](../../diagrams/34/320ecb0de47c91222de09f89e079ceef.png)
![[Diagram]](../../diagrams/9/5948ac955283b15c6817612cf8864fea.png)
![[Diagram]](../../diagrams/0/c808937d5c4ee5bd600ac3b8a73c50f9.png)
![[Diagram]](../../diagrams/40/f5e65b37ee32ec078458b49f48724c9c.png)
![[Diagram]](../../diagrams/52/ffdfc36e0eaf2b4a7634baa674d6fccc.png)
![[Diagram]](../../diagrams/49/58830c28487ba40654c9f1d140c4c9dc.png)
![[Diagram]](../../diagrams/7/c296b680a0235683bcdd74ecf07647a6.png)
![[Diagram]](../../diagrams/24/3b3c4c033e48cb12c3520544461601b5.png)
![[Diagram]](../../diagrams/15/c25cb7dbe323141ca9546e7ac3aaed3b.png)
![[Diagram]](../../diagrams/29/3b29d248d478fb316370abb2f3924558.png)
![[Diagram]](../../diagrams/52/685ea4b0641c842d9dbe68d986d6a537.png)
![[Diagram]](../../diagrams/33/9ec9fbede0ee08c92589026eda256692.png)
![[Diagram]](../../diagrams/51/13655dfd67b128819b883fa495d11721.png)
![[Diagram]](../../diagrams/33/6ca242105e201eb6779be461f89e3d1b.png)
![[Diagram]](../../diagrams/4/5ae8ac82db28bf7961e26b6573eab42b.png)
![[Diagram]](../../diagrams/29/ae9cbf82ba9504888130eef4c9e0c926.png)
![[Diagram]](../../diagrams/48/b1a8dbdf1137497adf4cd5b71daea508.png)
![[Diagram]](../../diagrams/18/e0aff4b66c4eb67f893d864be15d28ab.png)
![[Diagram]](../../diagrams/5/36c72fdcfdbf568cd21f34ae876ffb24.png)
![[Diagram]](../../diagrams/14/8646c4ed58599e8fab759d45c9f3a068.png)
![[Diagram]](../../diagrams/41/6743399fae373d6881af707fa167f116.png)
![[Diagram]](../../diagrams/30/f931cfa97fa410362d97d3dec3912614.png)
![[Diagram]](../../diagrams/4/d50f324b15f1ea598572d370647cd255.png)
![[Diagram]](../../diagrams/39/58e902aff37f3b4d84fa38e711b59a11.png)
![[Diagram]](../../diagrams/34/f0573e2b43221cf9362e84ae34e65fa9.png)
![[Diagram]](../../diagrams/17/5bab07a37d113fb333fd47978acbfd33.png)
![[Diagram]](../../diagrams/9/325408508f7dbedbfa6817869e3f53a8.png)
![[Diagram]](../../diagrams/19/9444bc4230b77979ecd18c39c46efb18.png)
![[Diagram]](../../diagrams/15/b9e9bf1f029170f10eaec127bd4dac7c.png)
![[Diagram]](../../diagrams/5/ef4529530c86173488653c02ec6832e6.png)
![[Diagram]](../../diagrams/31/0030aeface2135e41e13b09b4ee005e3.png)
![[Diagram]](../../diagrams/10/b90ee0f25aaeafac55512c53b904add5.png)
![[Diagram]](../../diagrams/12/453e03247b224ca9902fca7834d90c1f.png)
![[Diagram]](../../diagrams/9/d7c472710732ba2c590c89950b055c77.png)
![[Diagram]](../../diagrams/47/12e23e7e87222517b001c75cd5eb1a06.png)
![[Diagram]](../../diagrams/7/0a149ccfdb0a0c0c6ac02d0093284d9b.png)
![[Diagram]](../../diagrams/39/f440aed4b9b6ade141f0311507661163.png)
![[Diagram]](../../diagrams/44/daf40eaca9cb5927ff26cb73096d4f19.png)
![[Diagram]](../../diagrams/24/30d57d9057ff3411d658d965050121f3.png)
![[Diagram]](../../diagrams/41/ab221eb31922329fc49223805ac5dd52.png)
![[Diagram]](../../diagrams/4/d9bd83dbdf3015b817216b2d29532089.png)
![[Diagram]](../../diagrams/5/efb8cec989a513a71270fe818c169d9d.png)
![[Diagram]](../../diagrams/45/5398baff209d0b4d3dc636f2eac3da3f.png)
![[Diagram]](../../diagrams/43/2ad6eb5a90b1161f43e6328db4c14316.png)
![[Diagram]](../../diagrams/28/854f25110cf9eb663affac7126b5ba84.png)
![[Diagram]](../../diagrams/9/9a7a34b316be5a53293675dbdfe24c62.png)
![[Diagram]](../../diagrams/26/f03a83aa297ac7bfa29c1ec7c4f298cb.png)
![[Diagram]](../../diagrams/34/e3f50d649af4b96b37c17abdd0ddfed3.png)
![[Diagram]](../../diagrams/4/d184fde70e116fba3a555b8f9610e28d.png)
![[Diagram]](../../diagrams/2/e86a37412c3152de6923aa68ec679e7b.png)
![[Diagram]](../../diagrams/2/c9e5caaecd8a20621dc5f8eb61645a82.png)
![[Diagram]](../../diagrams/50/41b27532d05ef0152910458bc4166f3d.png)
![[Diagram]](../../diagrams/14/e4c8d2b9d4078998bb5adf0eec0a80bc.png)
![[Diagram]](../../diagrams/29/d3bfe16c81c1843b698526fe0dcd0187.png)
![[Diagram]](../../diagrams/28/a396f877e45f8bc04f3fd0875c77c990.png)
![[Diagram]](../../diagrams/6/6dea8fbf5231684762e59f90e4059cd7.png)
![[Diagram]](../../diagrams/33/8fe51d0a057acfd956c964ffdea70f49.png)
![[Diagram]](../../diagrams/25/a7c5ff18964a76ee7649d3e439e6521a.png)
![[Diagram]](../../diagrams/51/421a5ef42baa53483f314f8df95bb637.png)
![[Diagram]](../../diagrams/31/8def1d39b85b088a54c6f44b79c6fdcd.png)
![[Diagram]](../../diagrams/37/f0b84e2590d0dd75f6e96ad91b68d908.png)
![[Diagram]](../../diagrams/29/4e3faa3a6fcc1e715220334f34280b83.png)
![[Diagram]](../../diagrams/42/9e1989395d1230dae3632d382f6e63a0.png)
![[Diagram]](../../diagrams/0/1f3e830d8220f36e6ffc5a75a9dacd55.png)
![[Diagram]](../../diagrams/13/3ed7f44b95221d3f915dfd965eb90607.png)
![[Diagram]](../../diagrams/1/1d6889e675c685b2bc658a9560af809c.png)
![[Diagram]](../../diagrams/37/7ff159e91674c103339ced10e12873fe.png)
![[Diagram]](../../diagrams/10/3a86e458e027885b42d77cd6834f469e.png)
![[Diagram]](../../diagrams/16/39c6d2529df8ce5f9d1896879b6fd6f7.png)
![[Diagram]](../../diagrams/9/f35a69a9f41242b9a3d5bfe678b4c649.png)
![[Diagram]](../../diagrams/17/c1722e878bfb16336c16707eccd5700a.png)
![[Diagram]](../../diagrams/7/24a2538503bacec809912850c52bc19f.png)
![[Diagram]](../../diagrams/15/39b51ed6d7007fbd5692ce8d2550b826.png)
![[Diagram]](../../diagrams/51/ca173b2580e287d076c94a42d388b0b9.png)
![[Diagram]](../../diagrams/4/07e913d0a6fd4e08a804339df950713a.png)
![[Diagram]](../../diagrams/15/94394a39ad4094a932fa3530c652d76d.png)
![[Diagram]](../../diagrams/34/fc40cef5681921e46dce9198eb5bb021.png)
![[Diagram]](../../diagrams/6/0a58cf5950f97b9244fae054607d5de7.png)
![[Diagram]](../../diagrams/17/b0c9027728a87e95c58498b8a99911fb.png)
![[Diagram]](../../diagrams/8/66808e3c3884c898142538a79f00a3ec.png)
![[Diagram]](../../diagrams/17/c6c96726bc93b590adc14d20d6ca0d22.png)
![[Diagram]](../../diagrams/48/8ee67f08232fe81f148410cb73e229c5.png)
![[Diagram]](../../diagrams/14/8520ef3a61c9ee541045b8361447002c.png)
![[Diagram]](../../diagrams/30/4d6eac1a8156bd81d29048e7ccd680c9.png)
![[Diagram]](../../diagrams/30/38e5d4327aa9a2adb7ad50dd9949c551.png)
![[Diagram]](../../diagrams/28/0514dbcc964a4ecac0875cd79b83db3d.png)
![[Diagram]](../../diagrams/27/6e0b7b735d611643811f23c4f625d7d6.png)
![[Diagram]](../../diagrams/4/75b04dd97d3489f77dbaa042277e0a7f.png)
![[Diagram]](../../diagrams/4/3d46e82843770e9241f90150a364316a.png)
![[Diagram]](../../diagrams/42/10db2d55153e8e9530ad1a34af9eae31.png)
![[Diagram]](../../diagrams/12/826ddd91a328e737bed81319f0bc25ab.png)
![[Diagram]](../../diagrams/50/54f4506f01dbec148c43c7acbb57ade5.png)
![[Diagram]](../../diagrams/6/0f38522f698d9d74f5e2f4aa4b999e8b.png)
![[Diagram]](../../diagrams/34/90eb3f53a1297b6e15b5fb34a06deec0.png)
![[Diagram]](../../diagrams/30/1b5ea6794a7b9101428b075b7a55c07a.png)
![[Diagram]](../../diagrams/46/25442f03202b8861eba814fce4507660.png)
![[Diagram]](../../diagrams/39/5c028f9153a3e58948b54f6a6228b2e5.png)
![[Diagram]](../../diagrams/14/6bec5987f69bf2246d989e092844a389.png)
![[Diagram]](../../diagrams/42/e66e7452fd72bda3b909f6a81f88378a.png)
![[Diagram]](../../diagrams/18/d36ea9b8dbb49b96da457f397cb89996.png)
![[Diagram]](../../diagrams/1/6c166e7f4ebc6e03de2f50677a7ce66e.png)
![[Diagram]](../../diagrams/11/317facb177a8799174fbf5fe0191b536.png)
![[Diagram]](../../diagrams/25/d42a3e1b6cb1f6acc83e429a38b83e1c.png)
![[Diagram]](../../diagrams/17/04c85ce1b70f2a9c31498a2bf30e90f8.png)
![[Diagram]](../../diagrams/45/17da4829c0f7d2394e936b3bae2bb976.png)
![[Diagram]](../../diagrams/34/fe029a6ffe62aa29e23c990242262a78.png)
![[Diagram]](../../diagrams/31/821fd5f302377fa3ef92c0e5405d4d21.png)
![[Diagram]](../../diagrams/48/af4100901157264287de2061f9100345.png)
![[Diagram]](../../diagrams/21/3c92ab900429da843d39eec4d7555bf8.png)
![[Diagram]](../../diagrams/29/921f5695fd24eeb6791138969a18aa2b.png)
![[Diagram]](../../diagrams/47/365b261159b2bff70a8bcfff9975fe6f.png)
![[Diagram]](../../diagrams/46/683712c66bfcb27a3138a69a73072d2c.png)
![[Diagram]](../../diagrams/43/2a341dc67967e4206ccbccd7aa805807.png)
![[Diagram]](../../diagrams/48/5af24ecd4c1d58049c9ace9ffd89d584.png)
![[Diagram]](../../diagrams/37/d8e2ce9bb1b6fa63badf2a0069ce628d.png)
![[Diagram]](../../diagrams/6/5ad38181db191a8027ab0a5806302908.png)
![[Diagram]](../../diagrams/21/e0f33fbbf26af61031a83b8aecfb46b3.png)
![[Diagram]](../../diagrams/20/ae1e94cb2a54fcb98f1c973dcca30b25.png)
![[Diagram]](../../diagrams/13/2681b91286e866ea2ebfdc70d4739dbb.png)
![[Diagram]](../../diagrams/23/fbe234b2b9b324fba4b3a6f6c95b283f.png)
![[Diagram]](../../diagrams/17/66d91668418bf133586686186de19482.png)
![[Diagram]](../../diagrams/12/5ed3ed9e2ab608665f054e75772a2104.png)
![[Diagram]](../../diagrams/7/8418e7c07a4d1e942f598da86ee8fdf4.png)
![[Diagram]](../../diagrams/15/3ecee32abd68ee6fba96266847b75469.png)
![[Diagram]](../../diagrams/19/c7f8d35fd10ac40eadc959b31e7d6bd4.png)
![[Diagram]](../../diagrams/1/26a2194737641e7ac3a169be7df46ace.png)
![[Diagram]](../../diagrams/10/df8c978ca51f4039764f796683324f0f.png)
![[Diagram]](../../diagrams/44/d8007cc28b131dca1e6202337085990c.png)
![[Diagram]](../../diagrams/13/1f51e52f5324660d7a5b44a512e17b25.png)
![[Diagram]](../../diagrams/6/908da2f08f78ff7655e7428757b135ca.png)
![[Diagram]](../../diagrams/23/cfe022be1922df1d746e2a5570ddc9f0.png)
![[Diagram]](../../diagrams/11/e99832f4055e4e8b17d54f2fdb395866.png)
![[Diagram]](../../diagrams/6/17812314181e1048ab0d21d6658e5790.png)
![[Diagram]](../../diagrams/26/f542e3e6193629dbe18554f1e9faa26d.png)
![[Diagram]](../../diagrams/30/5e75c63007bfb0f3b2794238a71cf9d2.png)
![[Diagram]](../../diagrams/7/491a07dbf3cac1dc6c1faf2cf1399e4c.png)
![[Diagram]](../../diagrams/43/bb80cd52bcd686b8372d51d256bc5bf1.png)
![[Diagram]](../../diagrams/13/25032a20e55779856280b2bbecf0adef.png)
![[Diagram]](../../diagrams/14/b1c4d7568155a955ee16ac678034a23b.png)
![[Diagram]](../../diagrams/16/5d29206b670cb1bf4299227b404ac88c.png)
![[Diagram]](../../diagrams/16/96a9e2f8bc271b721fbfc5f96c501f42.png)
![[Diagram]](../../diagrams/23/4dd054602fef42515874e2317a621200.png)
![[Diagram]](../../diagrams/44/f2259f289ff7f06e44f511744e3fc68e.png)
![[Diagram]](../../diagrams/52/c8191ee7aa8748cad08f7fd581a0457e.png)
![[Diagram]](../../diagrams/2/b51795d499f7f9e106e9df8773f4f394.png)
![[Diagram]](../../diagrams/21/43e0f6fd16a3b113f16eaffb05767efe.png)
![[Diagram]](../../diagrams/2/af53da654d39754c6a03494b9b4d1a85.png)
![[Diagram]](../../diagrams/45/3d965b1c097aad369e4d47b60bd788fa.png)
![[Diagram]](../../diagrams/2/c192ab947324eb1f71af8965d48dcea1.png)
![[Diagram]](../../diagrams/44/f1ecbd83d4064442ddbe8798656e6f1b.png)
![[Diagram]](../../diagrams/26/6383714e856072b5003158cfda00d994.png)
![[Diagram]](../../diagrams/40/f50f09ec453077f6bdc8a84788c0bd23.png)
![[Diagram]](../../diagrams/35/e1bc0781cd70404791da00560bfe7c7b.png)
![[Diagram]](../../diagrams/13/12dce2fa0c9051b4eb84b5b5bc9a41b0.png)
![[Diagram]](../../diagrams/13/c20e11e309997634c5c9c0323ac3a24f.png)
![[Diagram]](../../diagrams/16/0899eb9c308b69a468e4f4ce4c634ae1.png)
![[Diagram]](../../diagrams/52/1ca3766a6f351b6d26f8834fcf778a96.png)
![[Diagram]](../../diagrams/14/4dd1e98b92b8f1389b2f02d9eb63f09d.png)
![[Diagram]](../../diagrams/7/592437fa17c9d274a9a158d074928976.png)
![[Diagram]](../../diagrams/41/37aa73ca9f32130c68795c915d4713e7.png)
![[Diagram]](../../diagrams/9/a4848ea4e604c3de9fa1796e87dafdea.png)
![[Diagram]](../../diagrams/33/045c8ce036d1b345e178a3a6f41594f2.png)
![[Diagram]](../../diagrams/51/aa9259dee62360a11a7aa4922b09fa48.png)
![[Diagram]](../../diagrams/10/6e4d7713eba135c2277629cb08840ea2.png)
![[Diagram]](../../diagrams/30/1b03509164d25163525a2724651e4af4.png)
![[Diagram]](../../diagrams/12/e99fa3cc33bc940ddfb1746c9f9d71cd.png)
![[Diagram]](../../diagrams/9/69546a169bdb0b911b609bb484899145.png)
![[Diagram]](../../diagrams/12/392122d41520e245fc5873995c897cae.png)
![[Diagram]](../../diagrams/33/3461b69cd1f86aab0abd78c9ac64c159.png)
![[Diagram]](../../diagrams/29/34d403aab3af303fe5f4c8ab058d0fa1.png)
![[Diagram]](../../diagrams/14/a46519e7d946d4374728d660db0ae6d7.png)
![[Diagram]](../../diagrams/45/3c2f50a87f084eb93190de7fd365e622.png)
![[Diagram]](../../diagrams/23/0213b90ea218b04d4dc1a4a7983ff667.png)
![[Diagram]](../../diagrams/45/86aaa6fb5a54fd232df9d45378f7c7c8.png)
![[Diagram]](../../diagrams/18/9b347dc172d71b4ba9cbef0b726e03bd.png)
![[Diagram]](../../diagrams/34/67f783be7f5916fd04bc2fa9ff168735.png)
![[Diagram]](../../diagrams/15/2eda1b6617e2c37e95ba82d2c5633972.png)
![[Diagram]](../../diagrams/44/0e076c99a184131565683cb0812ab4c3.png)
![[Diagram]](../../diagrams/50/a0e1ceb621d29a660bfe021bed9d023f.png)
![[Diagram]](../../diagrams/12/6e98fbc0b4be92eca7ce032171577d78.png)
![[Diagram]](../../diagrams/8/c9508908a933845474f5bfcaeda4387a.png)
![[Diagram]](../../diagrams/5/2e9d231bd3c67cee870e29dde63cae48.png)
![[Diagram]](../../diagrams/31/ea28491c8e53e60a9ee6a6cb7a70fbd0.png)
![[Diagram]](../../diagrams/17/99ea074604925d852266130be9c64a34.png)
![[Diagram]](../../diagrams/31/91aebf07c1fac137277677c92315d624.png)
![[Diagram]](../../diagrams/45/a4eac8f754a8c35385ef7bff7a0bc69b.png)
![[Diagram]](../../diagrams/37/84d1e90d0f948ae74ddb0dc9f609ede9.png)
![[Diagram]](../../diagrams/48/12efd05d4a826d4334a041e319269d68.png)
![[Diagram]](../../diagrams/22/1f57563d0ccb9f050b0a23059ae7ea45.png)
![[Diagram]](../../diagrams/24/f8ae9a6e8acc3e748b07762e59f1a9ec.png)
![[Diagram]](../../diagrams/32/054e0df21d570ea44c23ef4addc5c393.png)
![[Diagram]](../../diagrams/44/553080d35186e15a97714450a1ed52d4.png)
![[Diagram]](../../diagrams/23/890b86c41cb7d713a08c7c35f94d15b0.png)
![[Diagram]](../../diagrams/51/3dc79886a801dd26903133babc2fa9ae.png)
![[Diagram]](../../diagrams/15/43f51f6f188e490ccd788c025b4e1e34.png)
![[Diagram]](../../diagrams/34/bbd7aaeb1f19f4bce9d11f0722dbd936.png)
![[Diagram]](../../diagrams/25/a8c1e654b64e783695d6da30b9a3ccd2.png)
![[Diagram]](../../diagrams/42/6f5c8c32973a8945ee96bc2c408ffabd.png)
![[Diagram]](../../diagrams/5/9647ab9ec2e9bd5338de27b7b3c231d2.png)
![[Diagram]](../../diagrams/4/1f06bf543c366606e8d9e04134f70e9d.png)
![[Diagram]](../../diagrams/35/0a55e5c7afe3cf41753a949db884759b.png)
![[Diagram]](../../diagrams/10/057a4034b74839794854d8537f72bccc.png)
![[Diagram]](../../diagrams/44/268948cb44a469ded876b92f77a3c774.png)
![[Diagram]](../../diagrams/29/78786f2da08eef8822cb5a97c1a61b13.png)
![[Diagram]](../../diagrams/27/c429106450578b3b5c2fff92ac058a79.png)
![[Diagram]](../../diagrams/16/aaae046fc21af7b8fbfff6b6fcecb435.png)
![[Diagram]](../../diagrams/10/c1841cf7d1dfec93c9b1ad5dddda8ba8.png)
![[Diagram]](../../diagrams/50/864e7bb710508fe737cb7f2b89aa4cf6.png)
![[Diagram]](../../diagrams/41/e21be4d509e4c1e2dac010642a53788c.png)
![[Diagram]](../../diagrams/49/5eabe21d6edb3219e16a22b87d81885b.png)
![[Diagram]](../../diagrams/8/598cf2f209dbd845a538846732da82d7.png)
![[Diagram]](../../diagrams/52/fb3274ed3f957ff1cd840a2f8f61eda2.png)
![[Diagram]](../../diagrams/23/43386446d3ecf63df50fbb5ba4b25210.png)
![[Diagram]](../../diagrams/28/4b0068f0bbff44a25c897196f0ad6595.png)
![[Diagram]](../../diagrams/45/1715b16b1bfde16a34b3b460ce4278d0.png)
![[Diagram]](../../diagrams/46/9f8b1dd33d77c941da1a7ce695dd22ee.png)
![[Diagram]](../../diagrams/5/cca8b61d1fd8066acd810779f56a98a7.png)
![[Diagram]](../../diagrams/36/576627bc39bee0c07eb87e5ef9446e59.png)
![[Diagram]](../../diagrams/49/ebceecf12cddc3fdc131cd247006c87b.png)
![[Diagram]](../../diagrams/35/af7fd6736704a0aafea0babdc744292d.png)
![[Diagram]](../../diagrams/1/3c1a96285332a1db4e0ed01e008b61e7.png)
![[Diagram]](../../diagrams/23/6aab39b58b5a34823eebf646579f3c99.png)
![[Diagram]](../../diagrams/47/3e458cbf9fa6d3edc9bf132591494cb4.png)
![[Diagram]](../../diagrams/26/37ba4494fb356ea3c3d989bb679d3db5.png)
![[Diagram]](../../diagrams/37/c332e8777bef951e2a4bbd861dd1b48f.png)
![[Diagram]](../../diagrams/4/56acf41cc23b6824b84ec5697c6b2d0e.png)
![[Diagram]](../../diagrams/28/decb27058f84f6a4d81549f81c50e25c.png)
![[Diagram]](../../diagrams/31/5211ed4ec278cefb0952b1d28d1d197d.png)
![[Diagram]](../../diagrams/44/ebdb9893983546818c0794d365714488.png)
![[Diagram]](../../diagrams/45/39fd4333f4d05af3e740874e858cf40d.png)
![[Diagram]](../../diagrams/23/ac305af1637304477fce71c300634e28.png)
![[Diagram]](../../diagrams/1/874014e605f26fe590473d81e8813602.png)
![[Diagram]](../../diagrams/7/34de17f548165593bd4001dfa36a4959.png)
![[Diagram]](../../diagrams/46/e5cc912f55372aef168c960d111b3463.png)
![[Diagram]](../../diagrams/21/d7f4914c052fc32fa02ba1dcd41172c5.png)
![[Diagram]](../../diagrams/27/20430dcfe1409c348dd9e14acea7a6cf.png)
![[Diagram]](../../diagrams/16/de425b55ebd0f5ebf758906150d5de48.png)
![[Diagram]](../../diagrams/8/ca51e09cad5ca5a8ddc4e8655021f31f.png)
![[Diagram]](../../diagrams/30/b773841943c2e5afa9ee7d251013b26e.png)
![[Diagram]](../../diagrams/28/05559d6403cc7a9f1ec2fe6b905ad52d.png)
![[Diagram]](../../diagrams/40/a82c5b52e6cbcc0e50f45098122b7676.png)
![[Diagram]](../../diagrams/50/01b993b96488aa723f4baea66872ed2c.png)
![[Diagram]](../../diagrams/6/6092c30a6e2fca4bd08b32f8f82b620b.png)
![[Diagram]](../../diagrams/4/5c4659e46192c70e874757f6245ffe9d.png)
![[Diagram]](../../diagrams/41/e64c677d14dd809ebfacbc69e8f4a850.png)
![[Diagram]](../../diagrams/28/f57457a656821d63fb58a1a04a817dad.png)
![[Diagram]](../../diagrams/45/1c998c2eb73f4aded17a15b2678cf8bf.png)
![[Diagram]](../../diagrams/29/3c465e4b5fa58a8e4b7f2a0ddcec0954.png)
![[Diagram]](../../diagrams/36/a8fdf24c8a0997d3fe0320207cb923d0.png)
![[Diagram]](../../diagrams/24/41b61fb43e20064666b903a401a86efb.png)
![[Diagram]](../../diagrams/28/773da1505ad8ec8baa9a5acc7cb36c39.png)
![[Diagram]](../../diagrams/16/c5cf38c7492a4f19a5a3f4b8c36d13d2.png)
![[Diagram]](../../diagrams/37/88d0fbd5448f320cfbfaf8abee51b058.png)
![[Diagram]](../../diagrams/0/2fd326d01c400e518ee273aa2ae251ff.png)
![[Diagram]](../../diagrams/5/4ba0b4bdfb8f133ab2852ba6bf84a542.png)
![[Diagram]](../../diagrams/44/11b6a5076578950cf3427ad17d0b7735.png)
![[Diagram]](../../diagrams/47/3da3eeab735b3aa160c00d088f79ce1f.png)
![[Diagram]](../../diagrams/49/547f87d6819ad1940f1b56ce49ec72a9.png)
![[Diagram]](../../diagrams/32/ad41431f4364a2efc91354af7d449d55.png)
![[Diagram]](../../diagrams/0/8362fdfbf15c503ad056d7a9bfc03e98.png)
![[Diagram]](../../diagrams/22/9ee55d0b4942dfdc7aad0b79f1e2e32d.png)
![[Diagram]](../../diagrams/8/420efb78644c0e2332005741de1360b6.png)
![[Diagram]](../../diagrams/48/bee5e8b6e9825587e193607c5c4c865c.png)
![[Diagram]](../../diagrams/31/a1f22687128ab35b261a55c14f7f5de6.png)
![[Diagram]](../../diagrams/50/401ade1ba423ada9f62624bd9c0adb74.png)
![[Diagram]](../../diagrams/46/f8a2972d9d9c40cb17a1755392d96105.png)
![[Diagram]](../../diagrams/11/109c03679a56d17eb61ae7afb87691ca.png)
![[Diagram]](../../diagrams/6/b6951d5876ea4466dae220d0615b668d.png)
![[Diagram]](../../diagrams/44/ed74c1d59d2683fb790aef585c020f06.png)
![[Diagram]](../../diagrams/7/e8ca03a332590e619f91eb4ceadff68d.png)
![[Diagram]](../../diagrams/16/a1fb55c9bf5819fdc205979b2cc8afcc.png)
![[Diagram]](../../diagrams/42/7ee693a62f26a51f6f31be8932ec7e1a.png)
![[Diagram]](../../diagrams/47/65a2aaf9f277b3851b80c955a5da9257.png)
![[Diagram]](../../diagrams/5/cf1d25323fc8ef14b8d4bac03532346c.png)
![[Diagram]](../../diagrams/24/92c992bf0e049b65cfa27a690936ea1e.png)
![[Diagram]](../../diagrams/16/2cdedde7ac6bd7a7a01dc49351ae3dd3.png)
![[Diagram]](../../diagrams/1/e326aa62780d90f596b8488a4d85b8a6.png)
![[Diagram]](../../diagrams/15/fb0364b687681340b80de2658cd020ed.png)
![[Diagram]](../../diagrams/31/861b506a2a9bfcd82ca43139b42290b4.png)
![[Diagram]](../../diagrams/12/7d77606ff1d70733b798ce08be1f75ec.png)
![[Diagram]](../../diagrams/1/c41c7533ace29b09f318d6e5c1646ded.png)
![[Diagram]](../../diagrams/10/07e9dd0752a6b479f4d6cc4ed6fe865a.png)
![[Diagram]](../../diagrams/51/d8000ff0922b674e448046e66a3e1270.png)
![[Diagram]](../../diagrams/28/09ce8668288c575e4d07007188fc01e1.png)
![[Diagram]](../../diagrams/11/8618f72d52045dc0ab5b81c93fe06934.png)
![[Diagram]](../../diagrams/8/8c6b3ba969ddd3ffb3944f80c2b1323b.png)
![[Diagram]](../../diagrams/41/6512d209dd39f7d3fb106c92a7de4c07.png)
![[Diagram]](../../diagrams/19/343a41b3a33fd9639e20c7852cd1eb0e.png)
![[Diagram]](../../diagrams/41/9000c032c2977b93f083d8ef3011f325.png)
![[Diagram]](../../diagrams/28/e4690e1bd80d477dfb60c11fc3399932.png)
![[Diagram]](../../diagrams/9/74181c363f9cb305380248bad5e2c35c.png)
![[Diagram]](../../diagrams/0/42225b6122d0180ad85b16eea0c8b4c5.png)
![[Diagram]](../../diagrams/31/5cc87ed395f85e50a5c09d629ab298cf.png)
![[Diagram]](../../diagrams/28/8bf8aa4dbe0e8ea2fdc1fe9fd0910680.png)
![[Diagram]](../../diagrams/9/34d74b45f9f2584a33e28f9c1f9fe897.png)
![[Diagram]](../../diagrams/44/4d7992d88230c02e77067a73e8f20519.png)
![[Diagram]](../../diagrams/22/ac635ba8445928c6c5b4de61909104a3.png)
![[Diagram]](../../diagrams/32/3ddeb248fc9628a5daaa3b9239395218.png)
![[Diagram]](../../diagrams/49/385a81837fcd3197f5d963ae0d1e475b.png)
![[Diagram]](../../diagrams/47/f851efb51dd8b0d93a04a4ff49a312f9.png)
![[Diagram]](../../diagrams/10/b5ad427fdbe464ec92a70232fff9971d.png)
![[Diagram]](../../diagrams/1/4e08b9304ed49d83148aa4e140114d58.png)
![[Diagram]](../../diagrams/33/88557d16974400555e20e2674b876ab9.png)
![[Diagram]](../../diagrams/5/e1eaab110a108314925239af782890b4.png)
![[Diagram]](../../diagrams/39/7cfc7dae593940a0613e01acbae3d26d.png)
![[Diagram]](../../diagrams/48/468051004258c87df45f79fac17bbdb5.png)
![[Diagram]](../../diagrams/50/26e6e27fd4d2396bf4cec89ea9e29f1e.png)
![[Diagram]](../../diagrams/11/855bd85d2a20e8246cb833799f8e00a7.png)
![[Diagram]](../../diagrams/14/b951c9c64d59282f061afb47228b01f6.png)
![[Diagram]](../../diagrams/30/51b7f1d16a7bca95c239443a7ceac923.png)
![[Diagram]](../../diagrams/25/7f5923593d3b8ca7bddbf2eb7f06f6a2.png)
![[Diagram]](../../diagrams/52/484985b1ad80b2b99ed91749d92e09d0.png)
![[Diagram]](../../diagrams/39/5bec74e4b6ddc4dfe88699d8df0637e9.png)
![[Diagram]](../../diagrams/9/025ee3f777389d0912ec45638a4bfd32.png)
![[Diagram]](../../diagrams/46/0c860447ed7f3ae6bf7a0161a6d8a3b7.png)
![[Diagram]](../../diagrams/2/76aec24c98c14f37d87d92bc6a335b1c.png)
![[Diagram]](../../diagrams/30/cfea049762eaa630431c14d08fd0e1d5.png)
![[Diagram]](../../diagrams/22/894b4e711c3d1cc4dd76c87eac30d1ff.png)
![[Diagram]](../../diagrams/13/16f66a2d62b4698ee80f24a37fb6fe07.png)
![[Diagram]](../../diagrams/24/f218860f205bfb3ffa701f6d08602079.png)
![[Diagram]](../../diagrams/0/f2d271b73e420942ed253b2da9332221.png)
![[Diagram]](../../diagrams/30/4c1377801b1aaaa33a236fecbd9670b8.png)
![[Diagram]](../../diagrams/9/684f2eb523e5879ee65fef45b12efe47.png)
![[Diagram]](../../diagrams/5/63dd37e439f43d80cd6df0917fc23991.png)
![[Diagram]](../../diagrams/30/64a1e5632d3dfa0598e7f6eca9567006.png)
![[Diagram]](../../diagrams/34/615f75ff50feff4d3cc95e8966eaf4d1.png)
![[Diagram]](../../diagrams/3/ea30422f77a80e822de2d12d43eb296c.png)
![[Diagram]](../../diagrams/3/8e6c65550fb8c53af1bfdec0b7285e61.png)
![[Diagram]](../../diagrams/46/86302a12c2a0b4eacfc4cf81d6738530.png)
![[Diagram]](../../diagrams/12/a660faa5f0748888e06d84bb6119c24e.png)
![[Diagram]](../../diagrams/20/036364313aef972bc955caa7c46c330d.png)
![[Diagram]](../../diagrams/11/ff3bb1940a1054b61df0ec8265a92179.png)
![[Diagram]](../../diagrams/13/edf9e59b25eabf6cc84785c3a36036b1.png)
![[Diagram]](../../diagrams/34/5ba0be94a3ea18fea6e0ec24d9c38631.png)
![[Diagram]](../../diagrams/46/33c2051f9b3aa4dedf72e888f057a950.png)
![[Diagram]](../../diagrams/45/3386b5680869e002b0288f3581d4ca43.png)
![[Diagram]](../../diagrams/36/00316df24d9a9d600bfc27d19b7e80b9.png)
![[Diagram]](../../diagrams/31/6a0d3642b6de810cdd09499a839e3fb9.png)
![[Diagram]](../../diagrams/21/9cab21f593b4d98f0d9c320a5b6d41f9.png)
![[Diagram]](../../diagrams/16/45291ca19f9746ee883a77b3b161f843.png)
![[Diagram]](../../diagrams/31/7e489c2b7dc0469f507f230c5a68be3a.png)
![[Diagram]](../../diagrams/35/6ccf22ccbe71338c9e978336a205641b.png)
![[Diagram]](../../diagrams/15/ee131c6e7700157777e3230a62b66f82.png)
![[Diagram]](../../diagrams/49/9f3bc813047d07148d4f98790ae934d2.png)
![[Diagram]](../../diagrams/43/755831154ccf2296cdfd95f273d119ba.png)
![[Diagram]](../../diagrams/7/812ba219d894a54b8123bd7a2ec311a3.png)
![[Diagram]](../../diagrams/42/c0c3cbfac1d692642168b13a9e5925b5.png)
![[Diagram]](../../diagrams/6/0db9bb031837ac919a9c20bb57d23769.png)
![[Diagram]](../../diagrams/28/fe5f79dcc3c182c8d7111771a9b86c15.png)
![[Diagram]](../../diagrams/16/84f3553884ac7bb9617e5802c0225296.png)
![[Diagram]](../../diagrams/32/ef4e54d7f942fc7e515db14ede663cb3.png)
![[Diagram]](../../diagrams/30/48a845e22e6d580b2561d0e0363ec247.png)
![[Diagram]](../../diagrams/37/1daca21c2b0e67d5eac67773430180d9.png)
![[Diagram]](../../diagrams/6/a0f34cb2a25c5b9e1d7ac819cb0537a3.png)
![[Diagram]](../../diagrams/18/dc17ac845f5072a0dc9f235ca43cd80e.png)
![[Diagram]](../../diagrams/29/dc17f3ae3b17e273dce8e2b0bc85af26.png)
![[Diagram]](../../diagrams/27/fd11837317184deeaad214493e8d90c0.png)
![[Diagram]](../../diagrams/10/03ba2f8e433b0ed74bcf80c4e1fd02aa.png)
![[Diagram]](../../diagrams/34/40de2b8f2891c448d20b1654591d52f9.png)
![[Diagram]](../../diagrams/32/43ea78469c003c4e4e22c89eec21ae45.png)
![[Diagram]](../../diagrams/45/3c5cb0adf588d7b06ba2fd3bc0d0d475.png)
![[Diagram]](../../diagrams/44/a6f6ce88be56d5519b30bc45f8f7c7ff.png)
![[Diagram]](../../diagrams/43/85b0159edb5ed0a57b38064b2898eed7.png)
![[Diagram]](../../diagrams/5/7229512a44be14bb77a455db530df7a9.png)
![[Diagram]](../../diagrams/6/a7d3bd8eafac50f21f1b2690e34fd201.png)
![[Diagram]](../../diagrams/40/0a358ba4eb1b071497fa9dadc40476cb.png)
![[Diagram]](../../diagrams/15/2eac027bab1ffe27ba25732f3745c093.png)
![[Diagram]](../../diagrams/28/a0d5c4dec4d73bb404e0c9023a497cd5.png)
![[Diagram]](../../diagrams/4/82c52746a17834915c7fb21c5a088668.png)
![[Diagram]](../../diagrams/13/07a61a9b699f7d6ce388b7af90a52da5.png)
![[Diagram]](../../diagrams/26/e0db9e6c8bc9be2fe9a5bbcd436c7ed4.png)
![[Diagram]](../../diagrams/5/a8a2cfa1b99be3a061b1cd49d6b8304c.png)
![[Diagram]](../../diagrams/34/77e348744de1b1451fb1d689e9c4343b.png)
![[Diagram]](../../diagrams/6/d921c72e10d9dbf4dac86d199d716131.png)
![[Diagram]](../../diagrams/37/2ded9e387d01cd13cdb9d98ec118553f.png)
![[Diagram]](../../diagrams/4/c2d1bd3c729263eb43bedb72f12cbb27.png)
![[Diagram]](../../diagrams/42/2dbe1f6755ad2d2edb71070c906f178c.png)
![[Diagram]](../../diagrams/47/a741972d7c11950e15f6eff0b2fa509d.png)
![[Diagram]](../../diagrams/24/b40823e0ac14881ffbe6bc7f13285716.png)
![[Diagram]](../../diagrams/30/a452a5bfb7e566a3d763b742073838f6.png)
![[Diagram]](../../diagrams/7/187d5a12e65085116ca6215ea109c189.png)
![[Diagram]](../../diagrams/13/4cc0e65cef25ad4b69efae82f5f9da30.png)
![[Diagram]](../../diagrams/3/8796b9c9f9ea736ba0e07b762b15a13d.png)
![[Diagram]](../../diagrams/15/4c520321d0a6acf1d898c185124f98d2.png)
![[Diagram]](../../diagrams/13/667dd889faf0701b52f37e75dea41c2b.png)
![[Diagram]](../../diagrams/26/3033e2d116baa921269dfb5b3c1e2d0a.png)
![[Diagram]](../../diagrams/34/8e55294b309affffd6c6a80ea363362a.png)
![[Diagram]](../../diagrams/48/b75f0714b5e9183866c38bf6fdde5e89.png)
![[Diagram]](../../diagrams/39/79f1ba91d25f6da2d3ab65b3cfddd4e1.png)
![[Diagram]](../../diagrams/15/0a60c4041498f38043ef3a8a74c5514c.png)
![[Diagram]](../../diagrams/17/c530e6a6d69c3520f7067197f6e9293e.png)
![[Diagram]](../../diagrams/17/68dffe28df0e6d1ba14284c89fdbf16d.png)
![[Diagram]](../../diagrams/13/d896751cbc93e30bcb62428c3f323c30.png)
![[Diagram]](../../diagrams/21/b329148da07f6d30e14ee1b9c9d051e0.png)
![[Diagram]](../../diagrams/43/dc88c55b87c24d879f8b9c4e4591a661.png)
![[Diagram]](../../diagrams/1/2727b0c23836a23dd48b94cee06f51bd.png)
![[Diagram]](../../diagrams/1/eb4ce8338eb24afd8f5d1026ba1281d9.png)
![[Diagram]](../../diagrams/22/387723cdd17aa8badab50db1ba2da5d9.png)
![[Diagram]](../../diagrams/27/2d45453b8dc7f5cd8b71a4eb1b3ebc0b.png)
![[Diagram]](../../diagrams/4/e6f866c7c458490741ef627843e2012a.png)
![[Diagram]](../../diagrams/50/927720be03006b3741d658998b0a9034.png)
![[Diagram]](../../diagrams/51/c66a5312ae4724014ad6cdf35b78ca1e.png)
![[Diagram]](../../diagrams/2/ea2bf680cde2afe60089c0d30d385815.png)
![[Diagram]](../../diagrams/52/12b2a3c41bfb5c39b0cba9482818f4c0.png)
![[Diagram]](../../diagrams/0/772e4ebde00c6525027d3842bc1d08e2.png)
![[Diagram]](../../diagrams/1/db56dcbaf219e825c6336c74cbd80f56.png)
![[Diagram]](../../diagrams/38/d118d3aad16800b707dd5d62dd7e3caf.png)
![[Diagram]](../../diagrams/17/52fff6925b31b5feb8d29c0f5b223bb5.png)
![[Diagram]](../../diagrams/28/e225bb3ac5a0ccb1caae689c44ceca4a.png)
![[Diagram]](../../diagrams/21/ce64edaa366d06829050e0f8b09ef74b.png)
![[Diagram]](../../diagrams/7/2cd7eac678efa49991e4dc7c5fff3df0.png)
![[Diagram]](../../diagrams/26/9efdae9fa23d36c91e80da18c60fe9cc.png)
![[Diagram]](../../diagrams/45/9cdd506d90484e503c97aa977c5594ab.png)
![[Diagram]](../../diagrams/22/737f24960122f9c061dde86101c2fc7b.png)
![[Diagram]](../../diagrams/51/3c6e477c11d3ff33f4b0331db4cebd25.png)
![[Diagram]](../../diagrams/25/f2187791c7cd061c7faec937cceecf81.png)
![[Diagram]](../../diagrams/27/7d125ee1d9c0b7d1d4e1e71c1fd3fc97.png)
![[Diagram]](../../diagrams/5/071237b9fbb966716ef52d7bdc6411f9.png)
![[Diagram]](../../diagrams/17/0ba30279c684aba27b841a377822f772.png)
![[Diagram]](../../diagrams/3/df1c4d265ae66fd10cb0c4d97dec1d7f.png)
![[Diagram]](../../diagrams/26/c847e12c81d5c25bd5c5d67ea9fba452.png)
![[Diagram]](../../diagrams/37/e1583b30c5e47a79a802eab374bbc990.png)
![[Diagram]](../../diagrams/51/34f62ac22bbe18687d0df333c9b3d1e8.png)
![[Diagram]](../../diagrams/15/6c32ed05652af27a1062c6ccc744e6fb.png)
![[Diagram]](../../diagrams/22/774b6eeb6d0dcb4a3f7a0b4f1c73dd8d.png)
![[Diagram]](../../diagrams/40/a98a588f5bfd75514811e010b5e2e5c0.png)
![[Diagram]](../../diagrams/49/00b1ffc6f55250e0f304d0a14af71e56.png)
![[Diagram]](../../diagrams/30/46a9127f74aa5b5efd6052a5c30e1478.png)
![[Diagram]](../../diagrams/47/7527ff6ea8f375164fc4c90136f3488f.png)
![[Diagram]](../../diagrams/19/b23b3f674980c43c6ae9ed9ee933f0eb.png)
![[Diagram]](../../diagrams/1/d3e42a4a53dc15fe606fe822fcbcc391.png)
![[Diagram]](../../diagrams/11/21eb812eafdfd6d2b878b2bb002319ac.png)
![[Diagram]](../../diagrams/5/119cd10516acd0d832f71d16214a387b.png)
![[Diagram]](../../diagrams/49/9fc5dc4db9e002f693cec3c6ff2dd27d.png)
![[Diagram]](../../diagrams/17/238ff7605596b6d2f1c77dd59ada34f5.png)
![[Diagram]](../../diagrams/44/74a62c2d18ef20d27ecc9b4b05e9c548.png)
![[Diagram]](../../diagrams/13/cfffccfaac7c49e0dc6c88587a1c43a3.png)
![[Diagram]](../../diagrams/7/70f3b8f06e1b75e62d3e96b20c4f6a7e.png)
![[Diagram]](../../diagrams/8/666de9971343f62cd74392b06a1b462f.png)
![[Diagram]](../../diagrams/31/64d55c7c6ca01813b6898a1575de0551.png)
![[Diagram]](../../diagrams/4/25b6cc7d31dfa884d8d31d51d70bb99a.png)
![[Diagram]](../../diagrams/24/84ca046e98c6fbeec9ecc0fbe515ae5d.png)
![[Diagram]](../../diagrams/39/f0f9455c164ac47d2c898782616c4e6a.png)
![[Diagram]](../../diagrams/19/d900d8702796f9d40c11351cfad8a691.png)
![[Diagram]](../../diagrams/35/6223ff5b7f5ed45d3b916e01f08fe265.png)
![[Diagram]](../../diagrams/6/4fd7ee91f3048b20244ded8a3bbea3d6.png)
![[Diagram]](../../diagrams/10/0f309be862182781dcbc7ef844ecccc3.png)
![[Diagram]](../../diagrams/29/c61f6fc507db3aff2223654eace5414c.png)
![[Diagram]](../../diagrams/15/8e9774faa8d99561510ba464759529e5.png)
![[Diagram]](../../diagrams/34/b24b200d1362a67cdd7322aef717af5d.png)
![[Diagram]](../../diagrams/29/e849e5f4a7ce2f86181824d566503f29.png)
![[Diagram]](../../diagrams/2/c91877d74ba7f3e65bbc30486779c0ca.png)
![[Diagram]](../../diagrams/24/a2f67b3f75f2f26390ad76c1d166edb0.png)
![[Diagram]](../../diagrams/13/e7f6e02d2e13149882478d03df10f846.png)
![[Diagram]](../../diagrams/30/c36dec1634ed866793efa7f1187b11e5.png)
![[Diagram]](../../diagrams/40/fe8155226464aa3c6ab4b271cd60c508.png)
![[Diagram]](../../diagrams/17/d0d8216d9656a0e4e1f639e9a24665d6.png)
![[Diagram]](../../diagrams/46/90bd08222d5b8d7226d68d667d98b66c.png)
![[Diagram]](../../diagrams/25/12a5518fbbad9edf5ad40fa740333758.png)
![[Diagram]](../../diagrams/0/b12bcc8c4eafb114b6414cc05f6d9a70.png)
![[Diagram]](../../diagrams/22/bc4774582a976bb7b53b37179af309b2.png)
![[Diagram]](../../diagrams/21/2d66d29fe5dacbe844e0273e2621e871.png)
![[Diagram]](../../diagrams/20/75d2d8c653c7c21c28ca838da917cc22.png)
![[Diagram]](../../diagrams/36/25edce451c5d484334744040650c4e9e.png)
![[Diagram]](../../diagrams/3/4d4cb374df91909fb13659a322349194.png)
![[Diagram]](../../diagrams/35/aaadc8a12d020dbdc7f2a496bea97853.png)
![[Diagram]](../../diagrams/26/171284324612aaa43374bace4d010812.png)
![[Diagram]](../../diagrams/46/e36b3e1731ec0698101024efc8e2dad2.png)
![[Diagram]](../../diagrams/47/bd84694ab144b5a9a9e67b8f654f3370.png)
![[Diagram]](../../diagrams/37/bb59e8e05fa1e3c8a68aebe8cc9de875.png)
![[Diagram]](../../diagrams/41/2c68bd3fa529b35f9ff5f00d76342ef7.png)
![[Diagram]](../../diagrams/3/be3b339c88ff092c55aafe3057e82106.png)
![[Diagram]](../../diagrams/36/b7c2e452c84e6299504b56f888386b19.png)
![[Diagram]](../../diagrams/41/c985324078b3a293ab533ac057e159b0.png)
![[Diagram]](../../diagrams/20/01614d057f700604f2fc70f30405b4e8.png)
![[Diagram]](../../diagrams/10/c54a0a524bb81bdbd6429471293fcd5b.png)
![[Diagram]](../../diagrams/47/87fa8abd8c7effe55a256963817c189f.png)
![[Diagram]](../../diagrams/9/a785f46f7b0ff489b580663ed9de2275.png)
![[Diagram]](../../diagrams/43/66f1ac88aff8fa25cb2215763363f16d.png)

![[Diagram]](../../diagrams/0/35f162ae02bb607b59b084f032d8d823.png)
![[Diagram]](../../diagrams/22/ac995be83059ba38863adb95bc77f7d3.png)
![[Diagram]](../../diagrams/19/7b77a6c79ae51462c2959ed26ded6cce.png)
![[Diagram]](../../diagrams/28/d1b02dc536d10e44afa01ff6e706e80e.png)
![[Diagram]](../../diagrams/45/ddbbecdd74a5aecf76211c946bcbd604.png)
![[Diagram]](../../diagrams/27/5562215372ff4485ef37fe9d1b25cec0.png)
![[Diagram]](../../diagrams/48/4094a9a3c3e64d830fd0ce515d4931d2.png)
![[Diagram]](../../diagrams/41/d25406f13c47578ee996b6715b2bcd9e.png)
![[Diagram]](../../diagrams/28/b6d3439c1826cf1dea76436f3356f465.png)
![[Diagram]](../../diagrams/20/4621ba681339433ca0739fa25dd64ec0.png)
![[Diagram]](../../diagrams/20/5ce7cab81abfca7001fd73a9ba0befff.png)
![[Diagram]](../../diagrams/42/98df21e4ea2cc3cee1b1de508e2da592.png)
![[Diagram]](../../diagrams/6/b5b4e55f76bb47763a4e36e9c180464b.png)
![[Diagram]](../../diagrams/22/d237c11dc2dcd3b0087e1fb8067785a1.png)
![[Diagram]](../../diagrams/40/7f86a24428115ede08fb0e1f9f3a7af2.png)
![[Diagram]](../../diagrams/31/3d2dc60732d2b3932e99d44452913e42.png)
![[Diagram]](../../diagrams/1/ebc40eb926084d2a85967fba1afa6d44.png)
![[Diagram]](../../diagrams/1/a84ab5c103a857e8213f1e1ea3ff0119.png)
![[Diagram]](../../diagrams/49/33576572e8ebce50970742205024ecfa.png)
![[Diagram]](../../diagrams/4/b2261b2ac2fae2e3c86077ca05da3bcd.png)
![[Diagram]](../../diagrams/51/2ef6bc4eaeb759d76e6009844dc8d91a.png)
![[Diagram]](../../diagrams/8/fe35087dcd0f588dca6c756b34335044.png)
![[Diagram]](../../diagrams/18/f8cba5045d628cb406106988b2bead86.png)
![[Diagram]](../../diagrams/45/18334d1a9a4b9d428e45b93e18259bde.png)
![[Diagram]](../../diagrams/18/67403419b785005939f8a18c3446d537.png)
![[Diagram]](../../diagrams/23/443c532517b364841643b5d9ff1b3c8b.png)
![[Diagram]](../../diagrams/37/1698695911d62eebccd210b2c30d1723.png)
![[Diagram]](../../diagrams/52/dfec07f0c4ce0f5603e4c1f57822bb66.png)
![[Diagram]](../../diagrams/32/0b607c15a434b1318340844a0589c4bf.png)
![[Diagram]](../../diagrams/17/c295bef7bcbc7a93f147379cb8d1dba9.png)
![[Diagram]](../../diagrams/47/408a6e1f8f792b9e2fe4a725e57316d0.png)
![[Diagram]](../../diagrams/26/017c9c97704106b46031fbc7b4459b06.png)
![[Diagram]](../../diagrams/23/912de89a0cbc27991acc800c89283390.png)
![[Diagram]](../../diagrams/39/54fa1fb14854fe18b3fce518662e6ed8.png)
![[ext]](http://upload.wikimedia.org/wikipedia/de/4/42/Schnitte_und_fast_richtungsgleich.jpg) http://upload.wikimedia.org/wikipedia/de/4/42/Schnitte_und_fast_richtungsgleich.jpg
http://upload.wikimedia.org/wikipedia/de/4/42/Schnitte_und_fast_richtungsgleich.jpg![[Diagram]](../../diagrams/9/5f838967ca4be860257e1109d7151cf8.png)
![[Diagram]](../../diagrams/15/1f51b30120b16491bc28e64697e2ad29.png)
![[Diagram]](../../diagrams/34/6aeff2630e96b1115ced2b0cd8955fb2.png)
![[Diagram]](../../diagrams/16/eceb5d29327fb94b8f582971abb7dee9.png)
![[Diagram]](../../diagrams/14/1d7cf64e3733c67014a5b70371da9142.png)
![[Diagram]](../../diagrams/48/6b19410fe7bd553e029ee4a1f03a325b.png)


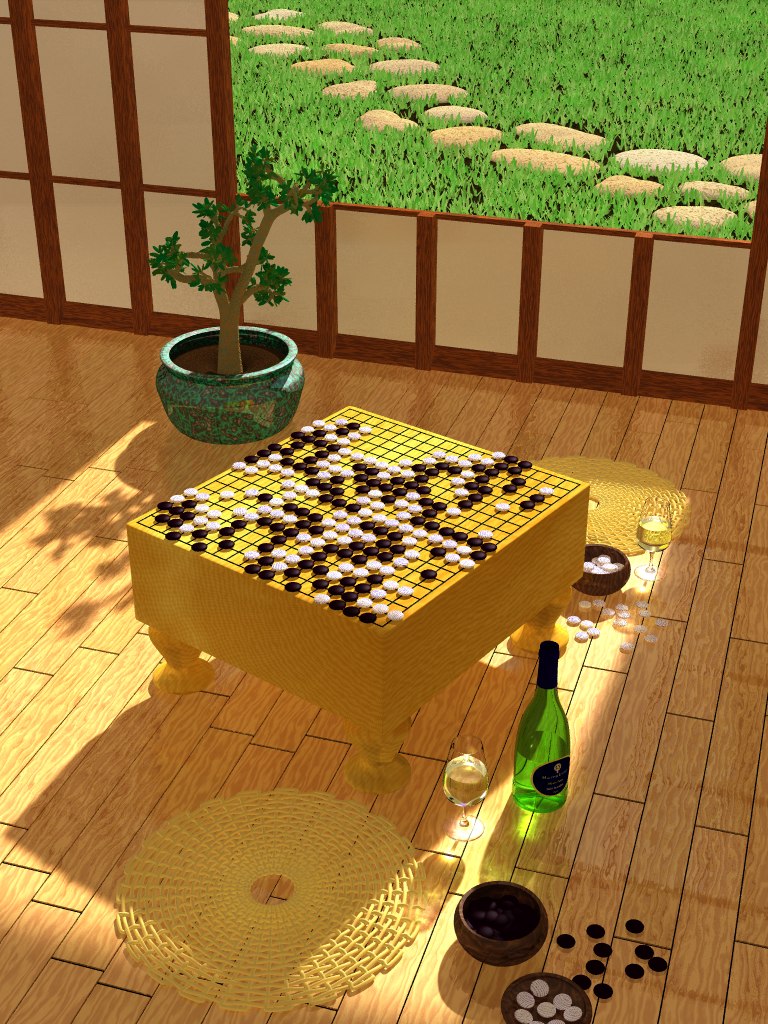


![[ext]](http://www.brooklyngoclub.org/jc/water.jpg) http://www.brooklyngoclub.org/jc/water.jpg
http://www.brooklyngoclub.org/jc/water.jpg
![[Diagram]](../../diagrams/37/200b7a9b39c5d9164b6f3b932ccb6925.png)
![[Diagram]](../../diagrams/22/f81a6ec1b93f1436c8d844b337fc6bbe.png)
![[Diagram]](../../diagrams/36/1cb808d898ba12c6223322ea7db8715b.png)
![[Diagram]](../../diagrams/37/19d2934665264a7e1a755fd3d55527e6.png)
![[Diagram]](../../diagrams/44/a6b0933cd791b61b5721f423bc96b7c5.png)
![[Diagram]](../../diagrams/34/4c20713abcc4effec6c7921b95816e5c.png)
![[Diagram]](../../diagrams/39/c0c4f04b93d105282614939c4fc67651.png)
![[Diagram]](../../diagrams/8/01bdf4a0e9e2f3feb664b02f77292654.png)
![[Diagram]](../../diagrams/14/986f5dbc6452d67bd76dc45f49eda1db.png)
![[Diagram]](../../diagrams/4/e3260a0f7f42dac840da7a68d82843ea.png)
![[Diagram]](../../diagrams/39/7e36923f9054bac57e5b443bbbdde755.png)
![[Diagram]](../../diagrams/14/7b85026111788e3401916b97dadfa18f.png)
![[Diagram]](../../diagrams/52/499c41a01f970da523de0ab6615a8777.png)
![[Diagram]](../../diagrams/22/97372275b191fa3c6c4f7e8614c696ab.png)
![[Diagram]](../../diagrams/32/9f0043d1c451596785913ce38b5d4042.png)
![[Diagram]](../../diagrams/10/0daddfbed833cf30a451f95d3263ba0a.png)
![[Diagram]](../../diagrams/30/ee3f1ae3a0105c577801c30fb3c732a3.png)
![[Diagram]](../../diagrams/25/bf6a1639b9d934bbb6af787a5bf6b510.png)
![[Diagram]](../../diagrams/20/d03fea5c9c505660ebe229f22fa5da66.png)
![[Diagram]](../../diagrams/0/3e372c8cc61bc31746d50f28be9ce707.png)
![[Diagram]](../../diagrams/9/b902dbd1c9758d7b738dc08cef7ef019.png)
![[Diagram]](../../diagrams/43/859850035c51c53d459c3b825d1fe0de.png)
![[Diagram]](../../diagrams/2/f04db90f8cdc168b998a787fe12d656a.png)
![[Diagram]](../../diagrams/39/156bca4bb2b0cf3ef1a32171aa8946e5.png)
![[Diagram]](../../diagrams/44/708a8fd3e18b4ccdd84eabbc82a404e4.png)
![[Diagram]](../../diagrams/16/4d51e43853d32f3dd9176a2813863db9.png)
![[Diagram]](../../diagrams/27/0f92850c8c6d85bf8b57b764e729b781.png)
![[Diagram]](../../diagrams/2/67ac0b179f7203a8deb5e8d2498914e1.png)
![[Diagram]](../../diagrams/37/ed5e3c685e902cc845d0dac0857ca0cd.png)
![[Diagram]](../../diagrams/40/2417f1b9d8e45bfe318cb0bf86044cb4.png)
![[Diagram]](../../diagrams/19/a93a325cd924cadc0f536d4ed06a2001.png)
![[Diagram]](../../diagrams/34/b81588b8152cbb46e5d1a47aeb08c29b.png)
![[Diagram]](../../diagrams/8/3dca1cc6b39710b88c21c43bf9848cd2.png)
![[Diagram]](../../diagrams/3/e1f7653e101216cb5ba2134cf64b493d.png)
![[Diagram]](../../diagrams/23/eabcabedccf0cfc1c2bb0f6ca559eddc.png)
![[Diagram]](../../diagrams/33/52273a792e714a44878869568bf6b6cf.png)
![[Diagram]](../../diagrams/27/a7871a5019b568be5129dd356ef42624.png)
![[Diagram]](../../diagrams/37/7319a54846f9a9013cd62a23074ffd6d.png)
![[Diagram]](../../diagrams/4/c02fe2f69be21a36ceeb1c3a96af4721.png)
![[Diagram]](../../diagrams/11/63c53aee4cbf5bc0154a9d530bc53951.png)
![[Diagram]](../../diagrams/25/34a758bfda2d9e32f328ad370e2d704e.png)
![[Diagram]](../../diagrams/1/63d5808c84c7b7ac064f8119ea6891d5.png)
![[Diagram]](../../diagrams/7/2f70d014dd57ae9e9b2ea3767cbc89a5.png)
![[Diagram]](../../diagrams/52/9f3c5c0085c85aed44f0b7c1c0900045.png)
![[Diagram]](../../diagrams/28/a09babc87b299b5ddca088544892e30f.png)
![[Diagram]](../../diagrams/6/913eaf9dbb3f0b827f5411976e4c714c.png)
![[Diagram]](../../diagrams/7/f134caab00be4c4f94018ed1924da7c1.png)
![[Diagram]](../../diagrams/15/9b1ff54e48d8bbcb45668966b666f6fe.png)
![[Diagram]](../../diagrams/35/db47c2ee1e8de607354b42e4eae2d8ff.png)
![[Diagram]](../../diagrams/49/a4634a89c3d27eff95e2f6777a7cc5f4.png)
![[Diagram]](../../diagrams/33/3c1835b25d1bb09cdcf7f747c57dbc24.png)
![[Diagram]](../../diagrams/30/1a2f52d8a659e7567f1150ab60632c08.png)
![[Diagram]](../../diagrams/44/914ced29733bed6fdaa066734df740c2.png)
![[Diagram]](../../diagrams/40/22c3e58e26c6aec5cb8e1da10206002e.png)
![[Diagram]](../../diagrams/26/348d70e04a3c110113d11c6f8e4956ba.png)
![[Diagram]](../../diagrams/4/46253f4167f96b9224ee1c636d607503.png)
![[Diagram]](../../diagrams/23/7d821441e89bdff616a25297fca0256c.png)
![[Diagram]](../../diagrams/5/f5511b4770356ddec9ad2661d7e81791.png)

![[Diagram]](../../diagrams/11/b9412dca3698dc535d3c5a3c2108d6f1.png)
![[Diagram]](../../diagrams/35/7b15b0dd306999600464f40e9a8ce8ff.png)
![[Diagram]](../../diagrams/8/fe56c77abd59276e809d9b2e97cfe49c.png)
![[Diagram]](../../diagrams/50/a2b5e52aff79a4082ecb683e2e51b749.png)
![[Diagram]](../../diagrams/48/ddd7143bbe712609c39171fc81bf1b34.png)
![[Diagram]](../../diagrams/18/26305945e686658a2340c9ed95b285e3.png)
![[Diagram]](../../diagrams/7/bc7d4a5808810e83ac0af2cf2639b175.png)
![[Diagram]](../../diagrams/7/f709f06685e4c2388f8d987300da9306.png)
![[Diagram]](../../diagrams/25/b201b31bd7c8311e156c6ad3ec65ad44.png)
![[Diagram]](../../diagrams/12/98154ec08f7374b5aeb836d8a785beed.png)
![[Diagram]](../../diagrams/30/64ec45fb9201b6983e8b9b13c2772816.png)
![[Diagram]](../../diagrams/42/bf75b4cda8f046992ded4ed2edb1a041.png)
![[Diagram]](../../diagrams/25/13135f7e39b4bf8a506e16b9d9621616.png)
![[Diagram]](../../diagrams/49/848781c4a8ad186bc8b2b4cf5cb07e5c.png)
![[Diagram]](../../diagrams/34/de64e3927702d1540f76f3599092120e.png)
![[Diagram]](../../diagrams/36/5b205d4a001a7b13dc4804c401fee9e8.png)
![[Diagram]](../../diagrams/33/3a99128652315bfed4059f0ca451b46e.png)
![[Diagram]](../../diagrams/1/7e6968de6db7fdeb467f4742c912db15.png)
![[Diagram]](../../diagrams/7/e716bb68c7b43f485daf6011ce5de022.png)
![[Diagram]](../../diagrams/30/67b2340bce98680faaf6b93c6bd667c6.png)
![[Diagram]](../../diagrams/31/3cd4a8d1f302a1c750bef7673f8ca60e.png)
![[Diagram]](../../diagrams/12/3750c63bcbcafa3fc2ceedd52dc84473.png)
![[Diagram]](../../diagrams/46/a9b77fc11bc8597381907754221ea278.png)
![[Diagram]](../../diagrams/11/d0d830d6f0affb9ad5c43646c6cf13d8.png)
![[Diagram]](../../diagrams/9/83595f695deeb000f424903d5034bfe5.png)
![[Diagram]](../../diagrams/32/944ba1ab29ed0b2500d52143af8218f7.png)
![[Diagram]](../../diagrams/11/aabec1fde1c814b5e5b71827a4fedec1.png)
![[Diagram]](../../diagrams/30/ca06c9fa3cfe5a108cf0974596a12d0a.png)
![[Diagram]](../../diagrams/26/a277b90a781123499bf9aa62495857ed.png)
![[Diagram]](../../diagrams/23/ecddbfeaff5319c16684068c82716550.png)
![[Diagram]](../../diagrams/23/b73e7d622df8b8528eb80609923c49e6.png)
![[Diagram]](../../diagrams/34/abe79c26428383697b41ce3b247eedd1.png)
![[Diagram]](../../diagrams/24/15047b76c0a6bca9ae52ea9944c9db9d.png)
![[Diagram]](../../diagrams/30/8627246100adad012de926bfc6fec44b.png)
![[Diagram]](../../diagrams/18/14cd88cf01bf650e17a50f3363e0c18f.png)
![[Diagram]](../../diagrams/40/7c5a18ee0a697ec05d9be5fb437f4a50.png)
![[Diagram]](../../diagrams/50/c8c42b320b55015a1d962aa1346bc50a.png)
![[Diagram]](../../diagrams/13/95bc92e6e74a3afc90933908c3e6fed1.png)
![[Diagram]](../../diagrams/51/b359447c64a4ab47a988298bdd032e57.png)
![[Diagram]](../../diagrams/46/1c4fa029fc66fd94faa12a206c3991cd.png)
![[Diagram]](../../diagrams/8/4ecabdd3b6608aad739a815270517fae.png)
![[Diagram]](../../diagrams/48/7fab95ea9c4be9b70c5b1e68490669d4.png)
![[Diagram]](../../diagrams/41/932e295542c36aa8c1212edd2106d705.png)
![[Diagram]](../../diagrams/30/0c07480f1a2678e20f763f7b2359c71b.png)
![[Diagram]](../../diagrams/25/2ed174fac22598f9d55423841be6c80e.png)
![[Diagram]](../../diagrams/47/c1b1128d8d4a6b11b3b77d9304260ac4.png)
![[Diagram]](../../diagrams/42/2105b7f49e127dc5c6466aafb2837361.png)
![[Diagram]](../../diagrams/40/d8abe4180f8b107c2c98bbe92c2d3eba.png)
![[Diagram]](../../diagrams/49/5adb65535739d6dfc227562cb84f3604.png)
![[Diagram]](../../diagrams/49/5a587fabf7f89ac6622a9c7884086111.png)
![[Diagram]](../../diagrams/30/735e73e313765fa8e7215975ef82b77e.png)
![[Diagram]](../../diagrams/25/9884bcc7d71b1a56b5040bff9ec6e42d.png)
![[Diagram]](../../diagrams/31/18ef888a14ebb38c67fd53003466eeea.png)
![[Diagram]](../../diagrams/47/b1965e5bca041d3617d69812d68a3c54.png)
![[Diagram]](../../diagrams/32/bdaa694345a5119228293c7637139f97.png)
![[Diagram]](../../diagrams/5/e32418ff25acb1337418f854d68a70db.png)
![[Diagram]](../../diagrams/43/43aee9689992e70a46932d04ca0e0c34.png)
![[Diagram]](../../diagrams/41/2058bef3f54dc1322629018dc715bb88.png)
![[Diagram]](../../diagrams/37/846c17ad133f42d163fe204595b3fea9.png)
![[Diagram]](../../diagrams/42/bdec3cfc596d28d549c4a3dcf5337e31.png)
![[Diagram]](../../diagrams/42/e10eb7dc30ea796d505c38f2c0de560c.png)
![[Diagram]](../../diagrams/21/e9e22f2e147bfadf0192372e08f5d74e.png)
![[Diagram]](../../diagrams/37/09a33395e88e76939d2a6fddd76a2efb.png)
![[Diagram]](../../diagrams/28/c5758459d1ce7ab85a8584bd5131dcd1.png)
![[Diagram]](../../diagrams/25/f69a39361d6ab49c1f1c218b5be7f787.png)
![[Diagram]](../../diagrams/6/a130dbe65400ef826b1d6678aa708bdf.png)
![[Diagram]](../../diagrams/27/99432ae797750fbcf5644e5f7a1a3c5d.png)
![[Diagram]](../../diagrams/33/b52c2a49d24ffe29ccfbf82df1d14d50.png)
![[Diagram]](../../diagrams/51/f238f21e576912c8249aef1d19b2c11c.png)
![[Diagram]](../../diagrams/24/6e68fa4dadb3529719a75903fa39cb2e.png)
![[Diagram]](../../diagrams/52/0aab1680fa20b92c326a7c9efbb982f8.png)
![[Diagram]](../../diagrams/4/f8a3a8828d55ca3eef9447a2a35756b2.png)
![[Diagram]](../../diagrams/50/bb960d9c93f0b0007659ed7f497ff60e.png)
![[Diagram]](../../diagrams/2/d595cee1a73f09416a3119dbcc73c733.png)
![[Diagram]](../../diagrams/27/2c8f3d118b4cc6910c6c25356f874fac.png)
![[Diagram]](../../diagrams/8/b839dca3979c1ff015a96ed579313f40.png)
![[Diagram]](../../diagrams/6/22f2686560509e7f1969a06b39c93b32.png)
![[Diagram]](../../diagrams/23/4e95c2a19d6ff0975d8df946a27ee3f8.png)
![[Diagram]](../../diagrams/39/611db09309ab81f0ed5631f17eb58be0.png)
![[Diagram]](../../diagrams/17/c31034ce3837c7c0442a2ba67db4d67f.png)
![[Diagram]](../../diagrams/38/a00a2af20169edd36cbf567756f8f46a.png)
![[Diagram]](../../diagrams/2/7f53def32cbff1d1cf1f2cf75100968a.png)
![[Diagram]](../../diagrams/44/eeb137f0168637671b0ae487dee1ac1b.png)
![[Diagram]](../../diagrams/17/e26b0eac947f428f977a3d1aace2d9c5.png)
![[Diagram]](../../diagrams/48/f87290245e26a2c0e44e3ff40511df84.png)
![[Diagram]](../../diagrams/50/2838ff9c532430225ea80de6a3e1eda8.png)


![[ext]](http://goama.upstream.ru/gallery/albums/style_weiqi/normal_go5.jpg) http://goama.upstream.ru/gallery/albums/style_weiqi/normal_go5.jpg
http://goama.upstream.ru/gallery/albums/style_weiqi/normal_go5.jpg![[ext]](http://goama.upstream.ru/gallery/albums/style_weiqi/normal_go4.jpg) http://goama.upstream.ru/gallery/albums/style_weiqi/normal_go4.jpg
http://goama.upstream.ru/gallery/albums/style_weiqi/normal_go4.jpg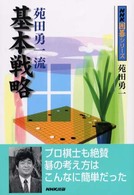
![[Diagram]](../../diagrams/19/c3972770380f4eed3ff8cb1937b1ae29.png)
![[Diagram]](../../diagrams/50/b899347c3b3b37cc9841248a2f9069a9.png)
![[Diagram]](../../diagrams/34/2077596a6e7f8e7af831673e772b6f7f.png)
![[Diagram]](../../diagrams/23/996dd6d37ae72c45da5582f49ccdef7a.png)
![[Diagram]](../../diagrams/20/cc396f3cac86f282f5c4b747f567cfb8.png)
![[Diagram]](../../diagrams/20/e3f95027dec9c1eb897c9c37be821707.png)
![[Diagram]](../../diagrams/35/4e1e4a208c5638d822d6b668bb3c637c.png)
![[Diagram]](../../diagrams/40/4ec5621695c6d8c4c20a0530299abcfd.png)
![[Diagram]](../../diagrams/33/ccd8d950161aa393ae4c04a29ac836d3.png)
![[Diagram]](../../diagrams/28/893656a8cf47e65802398608ad33c274.png)
![[Diagram]](../../diagrams/37/2687be566b630bf36759335b9ce8a8b4.png)


![[Diagram]](../../diagrams/29/bdfc3ebab9d5ecb60091f7be8ccc5ebd.png)
![[Diagram]](../../diagrams/32/22a8dedb559cbdc64192ba47e30d4fb4.png)

![[Diagram]](../../diagrams/40/84cd038a5c439ea1e2b2fb5d7a937288.png)
![[Diagram]](../../diagrams/33/d90195ec39bc35567abe97c9077b58df.png)
![[Diagram]](../../diagrams/4/6da63b4d2766682b3fbb774cc66fb8a0.png)
![[Diagram]](../../diagrams/25/9edbcef062199acbdcb8dfcbcb949baf.png)
![[Diagram]](../../diagrams/11/6848b3c9fd68f22aff517ba8a12d3dff.png)
![[Diagram]](../../diagrams/6/28193318f15b0737c490bd39fe9b8584.png)
![[Diagram]](../../diagrams/52/32501c14f677f28f7ed4ae4f31bf94ad.png)
![[Diagram]](../../diagrams/29/60f99f35675e19a65fbdd33817ef8c8c.png)
![[Diagram]](../../diagrams/6/0c2b8aa7581af676ee2df1d92c8b422f.png)
![[Diagram]](../../diagrams/50/127cf40d4fd45ed147a66c118ff2f701.png)
![[Diagram]](../../diagrams/45/cec11062b9c2fc872cf4f3cb4f1227f5.png)
![[Diagram]](../../diagrams/8/5698b2a98a612c7b7fa2d20f14a802a5.png)
![[Diagram]](../../diagrams/22/8f750eb51749c0e2b42b1a8f1dd8bb86.png)
![[Diagram]](../../diagrams/30/b6ef8ce07c7c4cbe4f4d4df349d8263f.png)
![[Diagram]](../../diagrams/7/a5951c447ac66ca7f069ec9b0b863e5e.png)
![[Diagram]](../../diagrams/18/277932f10487b91939a2da08f698b0e3.png)
![[Diagram]](../../diagrams/5/cb9b7f0edfb850bb90009a54326a9a45.png)
![[Diagram]](../../diagrams/25/bf1426c128a310551cfd586613c25e9a.png)
![[Diagram]](../../diagrams/41/e0eeb9978f4c3da4023e6b0121764968.png)
![[Diagram]](../../diagrams/37/a04d708c986c83ba3a0ba777043982b8.png)
![[Diagram]](../../diagrams/23/da60b5432f9b43428f710c79082d4efb.png)
![[Diagram]](../../diagrams/46/2ce12d550bf23fbe5e5e55b1164785f3.png)
![[Diagram]](../../diagrams/14/681f3d9ebc5f349fb29413e76a874d51.png)
![[Diagram]](../../diagrams/18/cb44c977b3c0e59ddd2f5e058346ddaa.png)
![[Diagram]](../../diagrams/2/5d7dd501561b3fbcd2cb4c28c204c674.png)
![[Diagram]](../../diagrams/31/f560237d9e051e6e7b2204ffacc3f736.png)
![[Diagram]](../../diagrams/43/3e3c491e3ccc33022bd2030701b65687.png)
![[Diagram]](../../diagrams/33/418ce43a82422d0baa2715765f428d76.png)
![[Diagram]](../../diagrams/16/ba20a984ddc3e189e36483e6454d7c82.png)
![[Diagram]](../../diagrams/10/dc24db1d539179737c662c29ceef4c7e.png)
![[Diagram]](../../diagrams/48/37b90473ff7074fbb80b9dd9188966ed.png)
![[Diagram]](../../diagrams/34/54eff7c1a9f422f9fcbaeb4a8ee59720.png)
![[Diagram]](../../diagrams/29/e3a29b66253ea45672beb85ff2d0fce4.png)
![[Diagram]](../../diagrams/30/ca40fb4d4da78b2b5e92bd9002fcd441.png)
![[Diagram]](../../diagrams/15/238b0c8e60249b505f6df7afc2fa3caa.png)
![[Diagram]](../../diagrams/27/79911e5c1a074158a716099a27ae99b7.png)
![[Diagram]](../../diagrams/2/fab136354f9eee755bd1654ba3b6b996.png)
![[Diagram]](../../diagrams/36/a97adf81f28f9f602cf47c6df27f801c.png)
![[Diagram]](../../diagrams/0/ee7570dff4862f0ea7080bf7c507f05a.png)
![[Diagram]](../../diagrams/4/a6dc0bed4aea5c2668cb56a2a3f0a98d.png)
![[Diagram]](../../diagrams/25/1f503ecb66370fc4ff74797f64e6a41c.png)
![[Diagram]](../../diagrams/28/fc530a6bfe6fd44893eff7f3aacd068e.png)
![[Diagram]](../../diagrams/33/6a7f5515f2f338eaee96e6b8308ddeb8.png)
![[Diagram]](../../diagrams/20/948b382d921fb5420d2ae35455c60242.png)
![[Diagram]](../../diagrams/31/dcc76c05424db41cf78d71647240be85.png)
![[Diagram]](../../diagrams/21/c1a525ecd4e872cce547267bed985dc2.png)
![[Diagram]](../../diagrams/27/2a30dfa6ea0cfaa50404203ec756cf96.png)
![[Diagram]](../../diagrams/26/4ac507305ee8e1b5e04af247029b1c81.png)
![[Diagram]](../../diagrams/38/8f15c55d31c5675af051278840162486.png)
![[Diagram]](../../diagrams/23/7d92e7de7d646b5e0198125948a4e785.png)
![[Diagram]](../../diagrams/50/037abc3c4d051d3dfea47ed0dd99f0cb.png)
![[Diagram]](../../diagrams/28/43b69c809ab65742e1e068bd0ee1ce22.png)
![[Diagram]](../../diagrams/30/e26fb0a5c53558f26242eb4fa38f4a9d.png)
![[Diagram]](../../diagrams/42/f9a9a7e4d7c2fc2e7b1997a6ac711c8f.png)
![[Diagram]](../../diagrams/23/e0c5c159d488111b9506e2fd1223e6c4.png)
![[Diagram]](../../diagrams/50/40e2f94ba1f0a12481b354f2fc69e78a.png)
![[Diagram]](../../diagrams/6/03d792fc34d50ccb014fb831fdb2659c.png)
![[Diagram]](../../diagrams/25/0c35f86bdc63bd9b9cb5b55cf967148b.png)

![[Diagram]](../../diagrams/27/61d0e4af2896690a94bf8e5da5128f4a.png)
![[Diagram]](../../diagrams/28/f9a160341db77b6783522c1dfc4ce5bb.png)
![[Diagram]](../../diagrams/11/b3fd738676df5604287065836a242a71.png)
![[Diagram]](../../diagrams/24/236483b67b4e08baa9a14215e4087e61.png)
![[Diagram]](../../diagrams/19/c79c92d8475e881eb4c671f11cf5266b.png)


![[Diagram]](../../diagrams/21/39a73ff3205470557f66388efb376f24.png)
![[Diagram]](../../diagrams/44/6356dd395d30a249116366ce0e213cdd.png)
![[Diagram]](../../diagrams/45/3bde8f8c0834eaa5e714f997c017c953.png)
![[Diagram]](../../diagrams/8/98d2034579039bf591b7001285d538d7.png)
![[Diagram]](../../diagrams/44/61a2da24dd3cd5d18ed700aea3ada370.png)
![[Diagram]](../../diagrams/7/da4821654f86cd023098b4fe2d74449d.png)
![[Diagram]](../../diagrams/13/c4f04a8516075de1c25471e9487f2eed.png)
![[Diagram]](../../diagrams/30/42422a971d79a30ecaef117d994e2d2d.png)
![[Diagram]](../../diagrams/19/f55aa7e0c52e1601b34011d4a529e244.png)
![[Diagram]](../../diagrams/10/03203ddd3bac4650cb61ecf363b549cd.png)
![[Diagram]](../../diagrams/3/8cbd1327f2bbdc25a1c9f23eb8e5ca84.png)
![[Diagram]](../../diagrams/42/fa41d4478d9cfc412b3f68adec5a6ddb.png)
![[Diagram]](../../diagrams/44/dc241ff48ef1792f5ce46d9fcb8221f2.png)

![[Diagram]](../../diagrams/28/2c800ff523fb1c1348fc2d0c5f39184b.png)
![[Diagram]](../../diagrams/19/96e8172f97de0c791df8fd29a02021ea.png)
![[Diagram]](../../diagrams/1/700e56ab265043250c0699941a7bd4f3.png)


![[Diagram]](../../diagrams/37/84d2e62263aa7fc7851c9d24d0a17e5f.png)
![[Diagram]](../../diagrams/28/e6f46ecd8f71291b1471370ecadb9fc8.png)
![[Diagram]](../../diagrams/37/28751a0549fb107ef7393c15d22363bb.png)
![[Diagram]](../../diagrams/41/0094c35b7af450fd0317818e4ae83399.png)
![[Diagram]](../../diagrams/50/d22da02893caad3c5ac7bfcf66db8876.png)
![[Diagram]](../../diagrams/48/f445e71e37ac2852301028cdfa5e30ca.png)
![[Diagram]](../../diagrams/47/732980d821a67824aac16dc4038301fa.png)
![[Diagram]](../../diagrams/6/8b8ffd3c2aeede671dd9a07b87099bc7.png)
![[Diagram]](../../diagrams/38/828d2c105b9f896694bc687c0c5147e1.png)
![[Diagram]](../../diagrams/8/0738769df6403bd6c3d5e71b2809b187.png)
![[Diagram]](../../diagrams/16/4f149c229e93c8bf9bbc221878d0d355.png)
![[Diagram]](../../diagrams/1/3bdafc7943ebcbd97f33ab73ff308a09.png)
![[Diagram]](../../diagrams/47/8a2273517cfc0c631997a6a1a326a3c7.png)
![[Diagram]](../../diagrams/48/afa7fbc0daf66c16884fbbfd4778840a.png)
![[Diagram]](../../diagrams/48/3ad920a61ded142416966611a2915514.png)
![[Diagram]](../../diagrams/49/4c4f6f0dd3bc25d4d761c599f45c1deb.png)
![[Diagram]](../../diagrams/39/3fb12eabd4ccad0e7565bbd523d23358.png)
![[Diagram]](../../diagrams/29/e1bbabeba5076855588b76e9fa6f2ae8.png)
![[Diagram]](../../diagrams/8/bdae16f90b2312ebe149d1dcf7b963b6.png)
![[Diagram]](../../diagrams/48/bda40c36495bf556db7ed8d69929b8f6.png)
![[Diagram]](../../diagrams/52/c11e1befa4dd08802e1f545937935a7c.png)
![[Diagram]](../../diagrams/15/f40121105f317db7a67bf6885c905a1a.png)
![[Diagram]](../../diagrams/51/9e2a3080e9241456369bd33f69a04609.png)
![[Diagram]](../../diagrams/30/c129a89111e6916dee39399438cbb86b.png)
![[Diagram]](../../diagrams/0/548d56f8d46d75edb67c10b8bd3fc865.png)
![[Diagram]](../../diagrams/3/4d8eb8cb118f8c9520733758297ee0eb.png)
![[Diagram]](../../diagrams/10/7a86141cfdc854148897a95677f84f16.png)

![[Diagram]](../../diagrams/50/06bf0b55a49e770bdaf433a7f71e48a6.png)
![[Diagram]](../../diagrams/36/81accea2ffeef5952366cf5c2e74e2e4.png)
![[Diagram]](../../diagrams/31/12b94832b313c8b96f1d717bae0ff903.png)
![[Diagram]](../../diagrams/3/de07faa185be6d65a25ece5a82267b45.png)
![[Diagram]](../../diagrams/12/0b9ed6305b4cb26590a9711a2d85f5f4.png)
![[Diagram]](../../diagrams/50/5d77aa5a4b642aea7bce2f035a04c46f.png)
![[Diagram]](../../diagrams/30/508d27599696f16d00df61ad6dfd7d99.png)
![[Diagram]](../../diagrams/3/8cdb1327cb9680797b3d812cda751480.png)
![[Diagram]](../../diagrams/50/9ebc431eef218e2f7a1e334769082ef6.png)
![[Diagram]](../../diagrams/31/cb2188c89b99eebc15c9ab7a8c59e116.png)

![[Diagram]](../../diagrams/27/88a56ee1e068e614dd364787abe718c5.png)
![[Diagram]](../../diagrams/24/01ff6f7867c87b96eaacc2e4a113fd50.png)
![[Diagram]](../../diagrams/8/0b38126fd01d6364a0497dc5b398ab54.png)
![[Diagram]](../../diagrams/18/7000f4f3e2147adc9ba512a812c8e023.png)
![[Diagram]](../../diagrams/19/6678818ced5edfa41a08764bc3993442.png)
![[Diagram]](../../diagrams/5/b25c5f7d42ebba430d52cd6530fe70cd.png)
![[Diagram]](../../diagrams/52/22feb8f8309a26e9484b68e431068882.png)
![[Diagram]](../../diagrams/34/d38641b6c85dcf0e35f13f2aa9571a5c.png)
![[Diagram]](../../diagrams/10/f91688bc2b28c615a5fe658d323162e9.png)
![[Diagram]](../../diagrams/12/ce9c430c1510d426499b821a9d4c368d.png)
![[Diagram]](../../diagrams/43/d642f5397c5577c22afdd4d984344d5d.png)
![[Diagram]](../../diagrams/29/2b27e96613b4ee68f40e85f0c0bfe806.png)
![[Diagram]](../../diagrams/4/52d5a66ae1bc0b6f120ef0f8c2f19ca3.png)
![[Diagram]](../../diagrams/31/9169e949923e17e90e63916ce452bf16.png)
![[Diagram]](../../diagrams/27/8c393b21242936800e0f0c0ba9fcd030.png)
![[Diagram]](../../diagrams/2/12234a3837dd24818df3d4f77d67b18f.png)
![[Diagram]](../../diagrams/50/0907aa0041937639de93f592cbb08d19.png)
![[Diagram]](../../diagrams/30/6980704f51c0e136967715e8fcb1c1a6.png)
![[Diagram]](../../diagrams/31/83ec63658903eb8a35526ccea4335c37.png)
![[Diagram]](../../diagrams/9/ee8b4c12b41e4d2e4e89b47aab2ca43f.png)
![[Diagram]](../../diagrams/42/34f0fd1e4538123f3655a84541fd3e72.png)
![[Diagram]](../../diagrams/24/77710b7061a3e1b89193f76eec374048.png)
![[Diagram]](../../diagrams/21/a0a5def744b6b9360158a58866c4ee44.png)
![[Diagram]](../../diagrams/9/6770b31d703b4ceab4fea14a09cde191.png)
![[Diagram]](../../diagrams/0/255f87b8f31c2511eb7966a3667d7853.png)
![[Diagram]](../../diagrams/2/ebd0fcf5a0dbc452cefdde1166ee6051.png)
![[Diagram]](../../diagrams/17/d60cca46039fc410c8d5ffa4c8cfc779.png)
![[Diagram]](../../diagrams/8/410089738b2ee0dd2aedc6ac3aa857ae.png)
![[Diagram]](../../diagrams/46/66dc98e454cd85dc6794baca41acb55b.png)
![[Diagram]](../../diagrams/25/b89f624e14fb4bd0a7fdcb67a736e69a.png)
![[Diagram]](../../diagrams/28/cbf4603819346a8b8516a89c96f3f6a8.png)
![[Diagram]](../../diagrams/12/7a24881ecc5863667b82215764d5a8a8.png)
![[Diagram]](../../diagrams/36/a8cacf1b2093f15b20cc2e8d5b5d3202.png)
![[Diagram]](../../diagrams/20/5b7a7ea85c750e0a4c2211fdbda0ca7e.png)
![[Diagram]](../../diagrams/43/6685c0942899f9642779e58f7ad58e77.png)
![[Diagram]](../../diagrams/27/d4b4ee68d6c0f4f1b9f33df0db1b0f6d.png)
![[Diagram]](../../diagrams/52/4c3cf5d29ba6f94d0b8bef1c31652163.png)
![[Diagram]](../../diagrams/19/dca74c8c54c9d59ab92db348f7615642.png)
![[Diagram]](../../diagrams/44/bf54cd2bb757e008a96e0f14fd317640.png)
![[Diagram]](../../diagrams/43/33968257c760d56a216e02417768a2fe.png)
![[Diagram]](../../diagrams/9/1895fbccce305f011d514dc214b7f0d6.png)
![[Diagram]](../../diagrams/5/b2b1eb2b5df714f11d582dbdd16824f0.png)
![[Diagram]](../../diagrams/30/93a77d64a7015b93c16d0dea6124c6c9.png)
 (Magnum 44)

![[Diagram]](../../diagrams/43/d4ad176e2990766e4d898c2e5d05632f.png)
![[Diagram]](../../diagrams/47/6361eb65ca8989621b1fd21542803627.png)
![[Diagram]](../../diagrams/42/851c10c155575df02c86b3e044515bae.png)
![[Diagram]](../../diagrams/7/784b382971c361d7be9cdab81817ebe8.png)
![[Diagram]](../../diagrams/19/6df4224660be1d45380034925a440acb.png)
![[Diagram]](../../diagrams/43/477831e6f236e13cb555c15b81c28cbd.png)
![[Diagram]](../../diagrams/6/ed9f4e8178421589a4fed2d2f92cd1c5.png)
![[Diagram]](../../diagrams/11/4758f09a3ea758dc02f16ad0b1127612.png)
![[Diagram]](../../diagrams/13/9c66fd87ca5bdf2091662925a164bfaf.png)
![[Diagram]](../../diagrams/39/e0ce58c763465db207f3b5970438dc31.png)
![[Diagram]](../../diagrams/0/d2fe6d9b142d97d444ae34289947f41e.png)
![[Diagram]](../../diagrams/13/3d2f51c04f5c33079a6f999a601586f3.png)
![[Diagram]](../../diagrams/10/d17c080a23c8657a398ccdc3bc2d815a.png)
![[Diagram]](../../diagrams/28/420a92979e81b0baee2b8480edff597c.png)
![[Diagram]](../../diagrams/33/8c00e16cd3aa4dff9cf97a2d5289c6c5.png)
![[Diagram]](../../diagrams/25/cadd612871a972a5b9a065db47e734df.png)
![[Diagram]](../../diagrams/29/84296ef6ac31a9d244448d85492f5bd8.png)
![[Diagram]](../../diagrams/40/0f4fbcc45ad424de7255a5657e7cf6dd.png)


![[Diagram]](../../diagrams/33/8e8d6d284c034c85d4bf6484d38791f5.png)
![[Diagram]](../../diagrams/42/9f4f5d43a81fe4935a8a2c6a7a5fb62f.png)
![[Diagram]](../../diagrams/51/0d423c5905b54beeb457dbaa9fcc69d1.png)
![[Diagram]](../../diagrams/16/b7ea74412e26dd7f520edfd83c7c1919.png)
![[Diagram]](../../diagrams/2/196e10473cf74f10eaa75210ed57c0c3.png)
![[Diagram]](../../diagrams/13/4421790374a1f80ae59b9ea3e46d003c.png)
![[Diagram]](../../diagrams/48/a594ad6e9982a68179208ae1ba379e13.png)
![[Diagram]](../../diagrams/12/fa63ba26ef6ea50079d0c317d47526ca.png)
![[Diagram]](../../diagrams/7/c89972931a9265a15a4f2028636a4403.png)
![[Diagram]](../../diagrams/35/09b88f9759845ff7d9c8b22ecfd8a2ec.png)
![[Diagram]](../../diagrams/52/19b42867a2116c692159e9a5385f3378.png)
![[Diagram]](../../diagrams/34/6a3251a78abe804777b1393a527279e7.png)
![[Diagram]](../../diagrams/38/8fba7d425837b3d482d719c10bd52231.png)
![[Diagram]](../../diagrams/3/1d837b8a698b7ba4a27c4c9627ccba93.png)
![[Diagram]](../../diagrams/19/b9a8f7f06d38d8779622b5d35a64d19e.png)
![[Diagram]](../../diagrams/7/793c0464c061fbeb4a4ee29828f18955.png)
![[Diagram]](../../diagrams/34/b0a8fb5f4e55a21d38bca49dff47bd00.png)
![[Diagram]](../../diagrams/7/742109b63f3d3eee78faa7a8f7ccfa63.png)
![[Diagram]](../../diagrams/0/2af833690d1a6e686ad2f815b03c58ce.png)
![[Diagram]](../../diagrams/29/253eb2daeec6ac842825eb5531f004b3.png)
![[Diagram]](../../diagrams/14/eed667856c1f602454b7a92d84375f4f.png)
![[Diagram]](../../diagrams/6/9992386b001f9f2a35f79b326a84be87.png)
![[Diagram]](../../diagrams/31/0159d833e7a75998b3481dd1618d6318.png)
![[Diagram]](../../diagrams/40/240c6692472bdd2bbb571bb366c2ba77.png)
![[Diagram]](../../diagrams/40/7c9ae592243dcdc4d3af61c1629fc4df.png)
![[Diagram]](../../diagrams/6/a5cb19a3bfbd3b9c0d60183c83aa5564.png)
![[Diagram]](../../diagrams/43/ee24cb65b820871c21a063bdf6699592.png)

![[Diagram]](../../diagrams/16/5051ec5b247635b70dec38d324ce36e3.png)
![[Diagram]](../../diagrams/39/16159fac4017c2c041b53743d4f846b7.png)


![[Diagram]](../../diagrams/5/d01fc35c640ec35a1e3ce67e17cf092e.png)
![[Diagram]](../../diagrams/21/87a5056def30766f503c6a226ed26af3.png)
![[Diagram]](../../diagrams/39/fed1ad0f0f67b080e1fefad301f5e416.png)
![[Diagram]](../../diagrams/1/8b6282f85d0496776e76a989bebb68bc.png)
![[Diagram]](../../diagrams/4/d421d7ea4a8c83781cefb0920b56eaa4.png)
![[Diagram]](../../diagrams/45/166467e6b206e0a676839483cc461d2e.png)
![[Diagram]](../../diagrams/19/acce2ec01e889755c0411bbcc724e653.png)
![[Diagram]](../../diagrams/31/c78a618c0deb4b2531599f5d555c4e86.png)
![[Diagram]](../../diagrams/28/6d6e394bdd91629ba9d20d5a898577b6.png)
![[Diagram]](../../diagrams/7/cb852d2cad8002c4ccf109ae1b2c13ba.png)
![[Diagram]](../../diagrams/0/cdb9786a9bfcdca042ad95b62efb1fce.png)
![[Diagram]](../../diagrams/39/8082d3df48793af29dd79f6f0329b02d.png)
![[Diagram]](../../diagrams/31/c54e232a708aa61183ab842878d3df3a.png)
![[Diagram]](../../diagrams/19/a655677c3a07b03fc2b0191e7aaffd7f.png)
![[Diagram]](../../diagrams/36/6c3f8527f6b4fd8bd22ca4b7ad0cf573.png)
![[Diagram]](../../diagrams/38/1edd90fdeeda4a34788ed52aeebc2ef1.png)
![[Diagram]](../../diagrams/27/d2fb8636aeb4ac92cd427afeb68cfc39.png)
![[Diagram]](../../diagrams/46/253d458c0051d5709b9ff1fe444e3f95.png)
![[Diagram]](../../diagrams/46/da8b3914aaa5f704f6458226a2273ee1.png)
![[Diagram]](../../diagrams/33/97330a2780a6440d527c4339a00d94ff.png)
![[Diagram]](../../diagrams/3/fb4cc5c849bd61984c7870db002e3b6a.png)
![[Diagram]](../../diagrams/8/231e11b8cf9660783c096ff2ebeccd4f.png)
![[Diagram]](../../diagrams/52/4f1318fe2a92fee3b4e1b98a0ae2c4b9.png)
![[Diagram]](../../diagrams/36/cfb732047ca71a39c80014dfe7d9de12.png)
![[Diagram]](../../diagrams/43/d7ad446575a7ffd98d27a29b132368dc.png)
![[Diagram]](../../diagrams/30/4e9af5e9180f933c7c6fccc8ec2c2221.png)
![[Diagram]](../../diagrams/4/ede5a6e44e5999a102b87b3ba62d4c3d.png)
![[Diagram]](../../diagrams/0/fc6e1581ae909db21404d6af2731694b.png)
![[Diagram]](../../diagrams/21/3e7071454a8176aea58e646eb45dc2aa.png)
![[Diagram]](../../diagrams/34/4784b3199a9bec1dbf7940a071c9c602.png)
![[Diagram]](../../diagrams/22/6cfb3d3d574d3ecebb00421609a3a9a6.png)
![[Diagram]](../../diagrams/40/b4070f08a87c19979f56dbbf0c9e443a.png)
![[Diagram]](../../diagrams/30/5347ee4f3bc95906f2cb27cab39b192e.png)
![[Diagram]](../../diagrams/29/8444280c32eca8fb6dcaf04877c43cdb.png)
![[Diagram]](../../diagrams/13/1c079cc8524cd30291e0ede96d6630ba.png)
![[Diagram]](../../diagrams/22/92f1be7c51567b7e9497fb5a294a7b40.png)
![[Diagram]](../../diagrams/31/e40a64ba69892e8febf7734f9a69ad5c.png)
![[Diagram]](../../diagrams/30/15fad2aca957c38f459456a0fc5b539f.png)
![[Diagram]](../../diagrams/32/c202a0b7de6ec0bf1f4a83220e025f97.png)
![[Diagram]](../../diagrams/4/3dad0d03c151af5f21496fc8b83ff061.png)
![[Diagram]](../../diagrams/32/0157165874d7b9da4fa455f49de3f0fb.png)
![[Diagram]](../../diagrams/50/fb15f4f678f5a32355edc4b2926b0efe.png)
![[Diagram]](../../diagrams/30/ffb9618280575821246620e649431b2d.png)
![[Diagram]](../../diagrams/23/8ac9e7b0ef84a539342142870805b66b.png)
![[Diagram]](../../diagrams/36/c9a0480a7a4a4c890808e11a2d419f69.png)
![[Diagram]](../../diagrams/24/ec9a786f2b393e27c7afc9349033dedb.png)
![[Diagram]](../../diagrams/35/fb6f1ea346c7161d5cb2b8fdda6995de.png)
![[Diagram]](../../diagrams/35/d7b5d3f96907bbc4fc6159d0a6153efb.png)
![[Diagram]](../../diagrams/30/96aeb8abcb7544c2137e0f70bc65e4e1.png)
![[Diagram]](../../diagrams/20/bc0462d0bf65a77d9eb0c907896160c9.png)
![[Diagram]](../../diagrams/17/921b936e506fb557a4fc029330093373.png)
![[Diagram]](../../diagrams/11/b4347601cbce12b3d7be9e77da8dd23a.png)
![[Diagram]](../../diagrams/19/30861ae041294531c07844d5970468c7.png)
![[Diagram]](../../diagrams/24/f9c2935f27a877ac2a8521e641d3ef4f.png)
![[Diagram]](../../diagrams/17/7eb16bd1b414e1880369210a58daf95b.png)
![[Diagram]](../../diagrams/11/51d8a778681f6e861a10c82c003845ed.png)
![[Diagram]](../../diagrams/24/be18410494f142129ac0d39d9067b93c.png)
![[Diagram]](../../diagrams/48/a57dfecddb3ca3e65abc67e9b664cd3d.png)
![[Diagram]](../../diagrams/44/11e9e8773f50947405b6162bb01617c3.png)
![[Diagram]](../../diagrams/9/0b88b02ae8cda7eb835d52d62fdc6bdf.png)
![[Diagram]](../../diagrams/23/ae12da867cf9dac7fd9f9cf6d5558cc1.png)
![[Diagram]](../../diagrams/11/d7f3d9585c8fa2dd129661e15cc4bb31.png)
![[Diagram]](../../diagrams/33/2f33f90a8c2bdd0673b8deae7eb888a8.png)
![[Diagram]](../../diagrams/36/b874d582e3c02d7117e8e0ee912e5686.png)
![[Diagram]](../../diagrams/23/a3ddca747a70333d76f0da49128abad4.png)
![[Diagram]](../../diagrams/6/e00424afc46f5846b7075e57be54d69e.png)
![[Diagram]](../../diagrams/15/9a4a1eba44a5ca4c3f982478f6d29c97.png)
![[Diagram]](../../diagrams/20/29cbcf3a429cf1fa64a59649a0f82a62.png)
![[Diagram]](../../diagrams/28/22e44f90b9164652b7138a1716c2e54f.png)
![[Diagram]](../../diagrams/25/413e5aa5ecfda5d6c9a55267f8aaf971.png)
![[Diagram]](../../diagrams/20/03931b720d4a467396749db546bf1137.png)
![[Diagram]](../../diagrams/48/607bed8829f14df55d935d89ad755e87.png)
![[Diagram]](../../diagrams/27/3b84cf78b3401c0cb2f12f494c46089d.png)
![[Diagram]](../../diagrams/48/e58c39a2b799cce1b7a93b1e36c61620.png)
![[Diagram]](../../diagrams/41/7581dfa9216547cd8d24addc6bf700b7.png)
![[Diagram]](../../diagrams/20/6da52798fe816eed273b46dc48340bb7.png)
![[Diagram]](../../diagrams/19/69d661250d7122512471f6d2919f71c0.png)
![[Diagram]](../../diagrams/2/18d6cf27c8146a211c129893402a467f.png)
![[Diagram]](../../diagrams/10/e510d94c292b377413064cdfbe7b811f.png)
![[Diagram]](../../diagrams/48/9df966b39e8f6fb3e79d9eebdf49a584.png)
![[Diagram]](../../diagrams/3/eb19fb9f3bc4f8ae0d569057b688d41d.png)
![[Diagram]](../../diagrams/2/4bc38840ada0596f497d96e21425d524.png)
![[Diagram]](../../diagrams/51/2aadcea71ec61976dbeb1403e7548eef.png)
![[Diagram]](../../diagrams/40/a45b07f3c040f833ed729946cff6ebd4.png)
![[Diagram]](../../diagrams/37/87298c0140b644d3cc17d1264162f588.png)
![[Diagram]](../../diagrams/27/8c614edf0f68c140e518d3622562db46.png)
![[Diagram]](../../diagrams/27/5c40eec5605f044658d311cb07993d88.png)
![[Diagram]](../../diagrams/38/728fc9fb4613609a70713bcd9f4d71c7.png)
![[Diagram]](../../diagrams/31/775d1ff4b545dbcaf7cdc0b72d56914a.png)
![[Diagram]](../../diagrams/24/de42ea07985d79185f745d77618e3a02.png)
![[Diagram]](../../diagrams/23/bee84ab22d98b47f03a247097314c781.png)
![[Diagram]](../../diagrams/19/9b72b34001d76d2ceffe2bf7091b7b3b.png)
![[Diagram]](../../diagrams/49/9f9da23964149f751aa334b159a73c58.png)
![[Diagram]](../../diagrams/36/2b34345ec75ae61e80c81b5561957099.png)
![[Diagram]](../../diagrams/43/4262cc502693d8e4cb1bc30649d25670.png)
![[Diagram]](../../diagrams/2/687b3385814ec1cf5a76d43ad3e016eb.png)
![[Diagram]](../../diagrams/30/0a458641da2d1514c41e3958f83b2d44.png)
![[Diagram]](../../diagrams/13/6b2cdca4e031c2b33b3f04b05eddc8a7.png)
![[Diagram]](../../diagrams/11/5ed3780540e61856a210bbc7187dac51.png)
![[Diagram]](../../diagrams/26/77b841ab5b3cffb232ba8cff0e32c593.png)
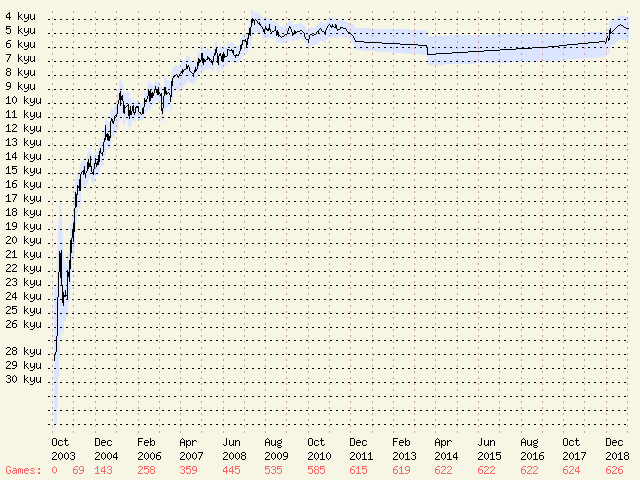


![[Diagram]](../../diagrams/12/7bc5160475f8f6b0b103351a5682a6aa.png)
![[Diagram]](../../diagrams/40/b7aa30be09e293c25914a0785d8d7b4f.png)
![[Diagram]](../../diagrams/36/c3ca0065e21b6a1dc16be97101e9bfcd.png)
![[Diagram]](../../diagrams/2/cf36a6c79dcd4be02d202ab6ecad2a1d.png)
![[Diagram]](../../diagrams/21/62e4a113564e4492481c43ec30a652cb.png)
![[Diagram]](../../diagrams/49/2ff319be9f62824bfd16f4b07e80e8f3.png)
![[Diagram]](../../diagrams/32/053bec9b92a6beeee487d3a5ce2afdf0.png)
![[Diagram]](../../diagrams/38/fd9e410fe8c8382785d87d980d137e4b.png)
![[Diagram]](../../diagrams/47/8e2de61be8113a4667694eee6ae2188e.png)
![[Diagram]](../../diagrams/26/57b10d883d20ad1e6ce3f53bfcdd5d60.png)
![[Diagram]](../../diagrams/43/297bc372b8606d8338a4a94b928b2e9d.png)
![[Diagram]](../../diagrams/19/ec903cbd89c18f511b62cb75d8d679f5.png)
![[Diagram]](../../diagrams/3/77ccf4369ab83b25311027fbe1bb4c22.png)
![[Diagram]](../../diagrams/45/4b23aea041b645ff7c855d4a1ae84490.png)
![[Diagram]](../../diagrams/26/ceb95b6c59bce2347a3af560c46bbc8e.png)
![[Diagram]](../../diagrams/7/730a0f729e71ce7bbf606ce36e774649.png)
![[Diagram]](../../diagrams/38/e96ab6e546de49d12f22e67ea1ac36d0.png)
![[Diagram]](../../diagrams/52/29d2c2766e3b73d4a332b5180847f1ef.png)
![[Diagram]](../../diagrams/30/0c88351166b58bd44b12a36af2c9456f.png)
![[Diagram]](../../diagrams/11/e615b61b6f82e4f6f9cb41f7458f2d79.png)
![[Diagram]](../../diagrams/28/3e8f243a5dba9050a045713cbe9b4c59.png)
![[Diagram]](../../diagrams/42/141a998c7d6014b479f0ee66f8693a88.png)
![[Diagram]](../../diagrams/30/ef2c38d9299197ec65b001bdce721f4d.png)
![[Diagram]](../../diagrams/37/f1069c10fdba7d09b72b58bf7f5563e1.png)
![[Diagram]](../../diagrams/32/369d8694aaca0b2aba1fcb1ba5626e7e.png)
![[Diagram]](../../diagrams/41/731f8d92dc6491bbdbaa9471a5e2a16c.png)
![[Diagram]](../../diagrams/18/8303133842633c17ec2016db702dfdd0.png)
![[Diagram]](../../diagrams/27/62fe24d0d514916b49c32fa93ca8693d.png)
![[Diagram]](../../diagrams/38/3a418539f60d05d376d355d12f889a2a.png)
![[Diagram]](../../diagrams/15/cd5ffee1ae25fd9643c4a6faa2156f42.png)
![[Diagram]](../../diagrams/27/74448c19292c836b94e87fbeeff2ea7e.png)
![[Diagram]](../../diagrams/42/a939d4ec5d162a9c831e20372168ae65.png)
![[Diagram]](../../diagrams/7/8ce9468f2bd9a8b3a965a540a59fbf8a.png)
![[Diagram]](../../diagrams/18/3742a9a3996dbbe9dd84156f74466cc4.png)
![[Diagram]](../../diagrams/2/3f80425240cc43179d9a90310237c58b.png)
![[Diagram]](../../diagrams/11/b2c641214645a58bffb3d5fd04a778bd.png)
![[Diagram]](../../diagrams/16/6916366cb3d190d78abc1a8efb309cc5.png)
![[Diagram]](../../diagrams/2/5d5f3b61de129cdfeb1bdb7f1f23c580.png)
![[Diagram]](../../diagrams/42/7d9b9920402c4e23abb34f2b7783210c.png)
![[Diagram]](../../diagrams/44/2b0ff651bfe7f8eb7840c4450b9c720e.png)
![[Diagram]](../../diagrams/26/f35f9a4a5d6b6df6e4b2323716f31d20.png)
![[Diagram]](../../diagrams/3/65af7daca4a4fcac6e579c0505ea4f2c.png)
![[Diagram]](../../diagrams/1/9f46fbed68198975fdceab4ff38527d5.png)
![[Diagram]](../../diagrams/7/5f3a12e72fb3aa2c537d4ea5b764de15.png)
![[Diagram]](../../diagrams/12/94d9270f4cfa511d5b3c444db03fd77c.png)
![[Diagram]](../../diagrams/35/107919db963682534075ec7138332872.png)
![[Diagram]](../../diagrams/39/2a1d512ba2d8b9c014ac78066eb7bd38.png)
![[Diagram]](../../diagrams/2/6067dc78d696b434d18633fe25b4b0b9.png)
![[Diagram]](../../diagrams/8/1b86bd9c3a7f66c17fa539682f2f9e9a.png)
![[Diagram]](../../diagrams/6/20cd68f79530c5ced1e56f22f9c90769.png)
![[Diagram]](../../diagrams/3/d4e256869f2d332e76a0053759217fbf.png)
![[Diagram]](../../diagrams/51/06e827acfb917b4d34dbd290122b70d3.png)
![[Diagram]](../../diagrams/31/be289361f5117c69b71d8ed571f37fc1.png)
![[Diagram]](../../diagrams/12/91cce93bb358feaa0c52d402f920dd75.png)
![[Diagram]](../../diagrams/18/36cf8dc41021e2c3ff629b205539bdd2.png)
![[Diagram]](../../diagrams/27/c4469479f522897b21e580ca685d66f3.png)
![[Diagram]](../../diagrams/10/6fa56f02d3197082e9e7428010a1089e.png)
![[Diagram]](../../diagrams/34/a5d7fea0a736b53763badce65a7008a0.png)
![[Diagram]](../../diagrams/3/c4b12076550cc9af1012f4d4ffd71039.png)
![[Diagram]](../../diagrams/37/885397ccedc507f44c2a0bd7158baf42.png)
![[Diagram]](../../diagrams/2/696cf59bc244d6d0791970ac01e32a0e.png)
![[Diagram]](../../diagrams/3/549a1578b80da21bec30feb7b3912737.png)
![[Diagram]](../../diagrams/5/664e5409b0b1b52fa0e78ff5142a8100.png)
![[Diagram]](../../diagrams/11/2970436e9256113a42aba001a8216e7a.png)
![[Diagram]](../../diagrams/3/5832718128a8aa1f9f834430419ec03a.png)
![[Diagram]](../../diagrams/47/23c9d738080de2b37ffacca78f074b0d.png)
![[Diagram]](../../diagrams/46/0bf132dc3d003161251a6bfd6dbe19ee.png)

![[Diagram]](../../diagrams/46/f74d7018766e9b29cab35f5ee74a7397.png)
![[Diagram]](../../diagrams/52/c72fca9c8c421e5ee3c1bbd85982e609.png)
![[Diagram]](../../diagrams/35/02ec057ffbaf3c0b34e4155663933ba4.png)
![[Diagram]](../../diagrams/9/486c31f457f72c47cab66f951271fe57.png)
![[Diagram]](../../diagrams/5/ae0971e7e3a7416d96a55e27158e49d7.png)
![[Diagram]](../../diagrams/28/6817e42b9c03c23c277c4fba0d501b3e.png)
![[Diagram]](../../diagrams/8/2039dd2223dfb66c678ffdd68d6baa5d.png)
![[Diagram]](../../diagrams/21/af39aa40fb39ff81fa4d4a78c5fcd5d5.png)
![[Diagram]](../../diagrams/1/ac55ae1fc7e9755b5d08a2c831e0f953.png)
![[Diagram]](../../diagrams/0/4d4e388d43683a20d567728730d1caf0.png)
![[Diagram]](../../diagrams/0/391912ce6c95fa28571f42937bfb6fd4.png)
![[Diagram]](../../diagrams/5/6a47169c2da150899f7f48c82b891e07.png)
![[Diagram]](../../diagrams/35/06a38f4aa6cb158b114de6ae67cd0dd5.png)
![[Diagram]](../../diagrams/50/918f21d07df2ed6fa65eb383620a070f.png)
![[Diagram]](../../diagrams/22/170a71a3681b44708e5172de8a3949da.png)
![[Diagram]](../../diagrams/13/e1695e51bbb2acc4c41bac35fb26183b.png)
![[Diagram]](../../diagrams/11/622052139d4eb41ccf0f839726f6e3ee.png)
![[Diagram]](../../diagrams/6/bcc241b828e7714436fc92b244cd7044.png)
![[Diagram]](../../diagrams/10/e6950d43b49126fd0bccd13973661936.png)
![[Diagram]](../../diagrams/39/bdddcbc2a0f88a95132f7922551da8b8.png)
![[Diagram]](../../diagrams/6/b899dca0f460558e8e27c9f274e774db.png)
![[Diagram]](../../diagrams/32/7ffbb156c48a600e39b0dba01b4f8f26.png)
![[Diagram]](../../diagrams/44/7c739a6bdc04a31ecfb45748a836d0bf.png)
![[Diagram]](../../diagrams/39/b8f7200bd964bec3b527cb2d89243c51.png)
![[Diagram]](../../diagrams/22/ecb6402f9ec4b6b4dfa20a149618547c.png)
![[Diagram]](../../diagrams/27/1f3f454060d4d9e685b8da45f9c77293.png)
![[Diagram]](../../diagrams/40/d231f8fc629023f8903d2a7940b9ec79.png)
![[Diagram]](../../diagrams/27/8b479c2f9f4cae6f182697701fb7ee64.png)
![[Diagram]](../../diagrams/39/badca78ff0378d26e115e5d8c5721a3c.png)
![[Diagram]](../../diagrams/27/6ea4dcd2003b667d0bda5590c9c4bc37.png)
![[Diagram]](../../diagrams/24/280e37cc2e53df87858b6299f25e28c3.png)
![[Diagram]](../../diagrams/20/17cfb879954517e2cf2da217b043752e.png)
![[Diagram]](../../diagrams/30/6efb807daf7f5ff305f3bb04e032edde.png)
![[Diagram]](../../diagrams/42/41de549534233451df4eed75438e88e0.png)
![[Diagram]](../../diagrams/0/ff09ebd01a575bab2e2b3bd7fb63adb2.png)
![[Diagram]](../../diagrams/0/24ada7fc2af1a0db93bb014b9e683883.png)
![[Diagram]](../../diagrams/18/d0522d97ec19a766d0b7e7943b9bd2b2.png)
![[Diagram]](../../diagrams/36/fd4c75cbf6178a36093416a86f8e1514.png)
![[Diagram]](../../diagrams/22/07c0a62c583a0c151f6742b5d059ac90.png)
![[Diagram]](../../diagrams/37/3b79650f2db7e9292d08ce9d1447cb91.png)
![[Diagram]](../../diagrams/2/241633f52e4f7143c332c1fe27c1f488.png)
![[Diagram]](../../diagrams/47/3038d10ec10ef1c2a30c17a212ab402b.png)
![[Diagram]](../../diagrams/39/c6a10def893de3037bc8a66ab5b74d24.png)
![[Diagram]](../../diagrams/31/ed85a13220672740613b6549bdad55e7.png)
![[Diagram]](../../diagrams/21/8b6e18dd192cf56bd789cb875d2dedc0.png)
![[Diagram]](../../diagrams/19/129398b998ff5673e350b096c6773b12.png)
![[Diagram]](../../diagrams/5/19b1a10e723c9e3f706699833438a9bd.png)
![[Diagram]](../../diagrams/41/f52c66c175b5e80fab90b57c3126b377.png)
![[Diagram]](../../diagrams/25/6ea6553e747557d10ac55afa026bb63a.png)
![[Diagram]](../../diagrams/2/ad387c744da3832e54a7c3a253ec7f6e.png)
![[Diagram]](../../diagrams/20/e6c240d92e9368c3a564a4aa5b07a20e.png)
![[Diagram]](../../diagrams/12/ad676e6064e597e949c45a93df917676.png)
![[Diagram]](../../diagrams/18/8d2ed0ea69b6ce37c308f8c10c63bb93.png)
![[Diagram]](../../diagrams/11/10335bca9d573fb6b05d9ab8458acecf.png)
![[Diagram]](../../diagrams/10/bdaf70b9797e7ea25a4fcdc9fface3be.png)
![[Diagram]](../../diagrams/0/f76775a0ec0a10abf77ad3784ad844e9.png)
![[Diagram]](../../diagrams/36/3e4e6d9078d4472e76342266b881fcde.png)
![[Diagram]](../../diagrams/9/b191a6f6316699e05f16e8159849eab5.png)
![[Diagram]](../../diagrams/27/347e5e923cec9c5694089cb856999f59.png)
![[Diagram]](../../diagrams/43/013440022de114795f3b76abb5e55c3d.png)
![[Diagram]](../../diagrams/2/e9d9be301c6fb517656861f02e5aae48.png)
![[Diagram]](../../diagrams/26/9fd211e57f4baba4b83d545572fdff6e.png)
![[Diagram]](../../diagrams/41/866c753376ce2d0490185fb34b386445.png)
![[Diagram]](../../diagrams/18/2b64921216d21e5771c422a44276dd36.png)
![[Diagram]](../../diagrams/25/cc3a7686f8b4b4212153d7d38433ef1b.png)
![[Diagram]](../../diagrams/16/82ecbccbbebc93c053bcfb415612172f.png)
![[Diagram]](../../diagrams/1/accbd38c59ad7a039eedfdff464674a0.png)
![[Diagram]](../../diagrams/7/d6f980b30eff9a72362c9ae4315a5de8.png)
![[Diagram]](../../diagrams/45/55a368d4dd38ab4b492d76a854ba3ef2.png)
![[Diagram]](../../diagrams/3/0d39221e8b1173fd5229ed38767876de.png)
![[Diagram]](../../diagrams/15/cce7702cd0569d4dba51cb3f302eb8b6.png)
![[Diagram]](../../diagrams/43/b5a67bd8b230412601a0159f0a75f7d0.png)
![[Diagram]](../../diagrams/43/9aaa65e46504545233eeba3f987eedd0.png)
![[Diagram]](../../diagrams/0/e4b13fe0cb74a0981257c070f25f8f3f.png)
![[Diagram]](../../diagrams/29/d8143608a2859ad25e65f32f9578a9b1.png)
![[Diagram]](../../diagrams/34/54962ee9c55704516da58117f08e68af.png)
![[Diagram]](../../diagrams/49/980b4f2fba0d86e03a138ff4f11c3521.png)
![[Diagram]](../../diagrams/46/b2d01a55f50ece1d345060eb2006c4ff.png)
![[Diagram]](../../diagrams/26/ce462c747eff70a1cf227ee81d7c8e43.png)
![[Diagram]](../../diagrams/49/2c10cbf7754ea95b650cb878c82c8040.png)
![[Diagram]](../../diagrams/18/6e31064a175bb5ccf9768e82d12cf3a2.png)
![[Diagram]](../../diagrams/42/a8ef428160e1f7fc04d8f4d22af1a5fb.png)
![[Diagram]](../../diagrams/6/a8203c0dccae388d6714ad46425d823a.png)
![[Diagram]](../../diagrams/37/be8e1abbfd2dec6255d479b46030a08b.png)
![[Diagram]](../../diagrams/7/93ae79cebe3f6a2555780aa21096867e.png)
![[Diagram]](../../diagrams/16/965fba4b3467012d0204f95662469351.png)
![[Diagram]](../../diagrams/23/7a3d18f699dab515e98379714ccc1679.png)
![[Diagram]](../../diagrams/48/668b0c8dd937349fe0ca9e6863372118.png)
![[Diagram]](../../diagrams/17/4fc6913266967aa024455d76b9e19491.png)
![[Diagram]](../../diagrams/38/58ae7e3a1e6b0bd32e1cb7a9f6e1d623.png)
![[Diagram]](../../diagrams/34/32e739152495520ce00b447c08f10067.png)

![[Diagram]](../../diagrams/34/fea3d418bf515238fa89ee73db04095b.png)
![[Diagram]](../../diagrams/52/615a491804d849ad44e583a746d59dfd.png)
![[Diagram]](../../diagrams/1/57306a073da3ea7e3651531d315ccc3f.png)
![[Diagram]](../../diagrams/2/28b4040584db1c3452bf99a74cb920c8.png)
![[Diagram]](../../diagrams/29/b50b41a10186c3cc594e81c38e4fea07.png)
![[Diagram]](../../diagrams/14/6c64458766ba1a7f89decac26dd07c57.png)
![[Diagram]](../../diagrams/51/2e4d23afc154eeab7ffe8fed933abb7a.png)
![[Diagram]](../../diagrams/45/0acfe3cbd30d95c49bdbfbe3bec82c34.png)
![[Diagram]](../../diagrams/39/cc16bd848e0af7540ddf2537d6d86937.png)
![[Diagram]](../../diagrams/16/a328a9da42cea1032dce0b4ce4042fc1.png)
![[Diagram]](../../diagrams/27/8e73989f27570def1ab894ac7aca9a05.png)
![[Diagram]](../../diagrams/26/9d294d00ed3539bcbb1910689a09c650.png)
![[Diagram]](../../diagrams/11/b86558d95f9b58b5e85b3ef4f1183bf6.png)
![[Diagram]](../../diagrams/33/e50a19e89c0175bcd9e8256ab8766e1c.png)
![[Diagram]](../../diagrams/35/aa78cc0b6c338b7177e9fc2fa2b08551.png)
![[Diagram]](../../diagrams/20/2e065b6b33a33e340b642ed9f8131d22.png)
![[Diagram]](../../diagrams/49/a9bc3c2a1ce644dff7f98ee0e41a1d78.png)
![[Diagram]](../../diagrams/34/f42eb3f09842192ae8d3b9990fe6cbba.png)
![[Diagram]](../../diagrams/31/c36d948c65a2a34c666b11fa090f137c.png)
![[Diagram]](../../diagrams/3/a0e3ac9f080f94e1110a43f2233c267a.png)

![[Diagram]](../../diagrams/18/054bb915c5a7dc5867985ae2b41f901e.png)
![[Diagram]](../../diagrams/32/0b098d002975e20c8dea7c08872302a2.png)
![[Diagram]](../../diagrams/36/fdd65d7df1e371ce5458e62d9d969020.png)
![[Diagram]](../../diagrams/24/b82b4a846b7f0ee81e6e00435e46ed7f.png)
![[Diagram]](../../diagrams/31/0763744c20de155e9609acf11f33c7ef.png)
![[Diagram]](../../diagrams/29/87b7bbf93f6af9984412021a9d443584.png)
![[Diagram]](../../diagrams/20/0966fbeb95f2220a8a6d86cc01529a06.png)
![[Diagram]](../../diagrams/44/8d8a27ec0fee2b738ad449cd1e4654ba.png)
![[Diagram]](../../diagrams/24/b63239fe65ecaec3db5e7c46bae9bb0e.png)
![[Diagram]](../../diagrams/23/82a1598924afb1a6ea76efa1657d0389.png)
![[Diagram]](../../diagrams/21/ef24bc8b8b4db09c914e9994d8252009.png)
![[Diagram]](../../diagrams/24/bf9e6335150983007aa848371812293a.png)
![[Diagram]](../../diagrams/51/688e6d43334d079f2dda5a5a880ea664.png)
![[Diagram]](../../diagrams/24/d9ef3cd6b1421bfb33807838bcc7ba7f.png)
![[Diagram]](../../diagrams/30/99a5403130718c0d420a65dc078231fc.png)
![[Diagram]](../../diagrams/8/3487ff226f57e48b034f552e16831dc9.png)
![[Diagram]](../../diagrams/50/4c1d0337a5614a2f678a636d00e917ff.png)


![[Diagram]](../../diagrams/31/d9d7e6442ddd9b938f27bf391b01908c.png)


![[Diagram]](../../diagrams/1/61835d2b0fad67ac6934b2b3248e8d94.png)
![[Diagram]](../../diagrams/34/1a38e8d404c381f96ef134568b9c1a65.png)
![[Diagram]](../../diagrams/50/41726ad93ad84714d678b36b59e9ec8e.png)
![[Diagram]](../../diagrams/18/456b37d4f09a2abe41dfd5dc8529cb27.png)
![[Diagram]](../../diagrams/37/9355a931f368ba34c79a03f047622bb3.png)
![[Diagram]](../../diagrams/40/062334cb4d593773e2d9013363aea76f.png)
![[Diagram]](../../diagrams/37/55121a6f77dd78abf5102cac2c853010.png)
![[Diagram]](../../diagrams/0/6625997173a5a239ad5eff2c9e9ea2f3.png)
![[Diagram]](../../diagrams/39/4359a27911f23e7b7cfe5fd0597ebbb5.png)
![[Diagram]](../../diagrams/19/f0a1606a79fb02d4b38b5081d9784b1c.png)
![[Diagram]](../../diagrams/28/c2693d8f422e28f63cc5509d27961398.png)
![[Diagram]](../../diagrams/17/26a47512cb7075df67d341c8989fa76f.png)
![[Diagram]](../../diagrams/14/3e91fa598d1f6e1f70b1d9b258288e51.png)
![[Diagram]](../../diagrams/17/420ef97bf9a7587aad0d42380ea86347.png)
![[Diagram]](../../diagrams/30/5bbb63d5a5d0dcc1ea0e529e8269df91.png)
![[Diagram]](../../diagrams/16/3dfe54254a8a1817991b2272de40a811.png)
![[Diagram]](../../diagrams/17/67b4f7cc2b305c941d67abc20bfa3a32.png)
![[Diagram]](../../diagrams/24/d87a3a0105b0a66bd89e730ed49b9bd8.png)
![[Diagram]](../../diagrams/37/d63fb1709dbc35b2780a52b65e5f9e56.png)
![[Diagram]](../../diagrams/32/9b585b40b8fe9ef9b98a84b25fd4b3c8.png)
![[Diagram]](../../diagrams/33/860d24d88b08517d1375cfa7dc03f6ae.png)
![[Diagram]](../../diagrams/41/69e6ff5cf70749e757e6c0a8f1edde3f.png)
![[Diagram]](../../diagrams/31/8c794f386cbfee153957e8386c6dcf1f.png)
![[Diagram]](../../diagrams/32/2d89f89788928a118dbf650a03022563.png)
![[Diagram]](../../diagrams/32/d8abd3f2a1c52cfdb7ad7d8eea61729f.png)
![[Diagram]](../../diagrams/35/48bec6ea7d171a9d190ce2174c1d8371.png)
![[Diagram]](../../diagrams/16/9ed949d8c7ea29481c17ff9c994fd197.png)


![[Diagram]](../../diagrams/49/2fc5508e51ef036e36c1a654a7bf31f3.png)
![[Diagram]](../../diagrams/15/b3685ef32bd471b96ec58b180a4b735f.png)
![[Diagram]](../../diagrams/47/f6a4619bf0d97845c6853b6678a60ead.png)
![[Diagram]](../../diagrams/47/b8363a29ac6a4f62ad0ebb7669b1f4da.png)
![[Diagram]](../../diagrams/51/6bcbe4c91f52711d978a7fc528fb1714.png)
![[Diagram]](../../diagrams/13/519fd3c5fa241b0e180f9800cf16c2c6.png)
![[Diagram]](../../diagrams/34/d29a69bc52bc4cddee841826a67574da.png)
![[Diagram]](../../diagrams/7/1bb8e82b491dad1ab8ea35b12125b2b4.png)
![[Diagram]](../../diagrams/30/72b9280dcddc3a6cce4a9dd1ab737e29.png)

![[ext]](http://stevefawthrop.goplayer.info/GoBookCatalog.jpg) http://stevefawthrop.goplayer.info/GoBookCatalog.jpg
http://stevefawthrop.goplayer.info/GoBookCatalog.jpg
![[Diagram]](../../diagrams/29/cdb6ee491b1de5c75cb93aa5a72bcdbe.png)
![[Diagram]](../../diagrams/28/07f02107028b7b54ada80b466cb10df3.png)
![[Diagram]](../../diagrams/3/4165e46e2bac0891db97551986dae32c.png)
![[Diagram]](../../diagrams/38/8d97423e6583e9b20efc08d4dfa4ee6b.png)
![[Diagram]](../../diagrams/19/83ef0d527d6e142918a8e5e475a162ef.png)
![[Diagram]](../../diagrams/42/fd732f5f39f40a1d60949c860f259d78.png)
![[Diagram]](../../diagrams/33/c92c0e4beb28a4c347d746fd26332a2b.png)
![[Diagram]](../../diagrams/11/594c51e20e93d566da594e44f8ab06f0.png)
![[Diagram]](../../diagrams/32/b4dd1265050bd22ad247d6106008bed9.png)
![[Diagram]](../../diagrams/16/db7171c0c21da607a295b38b6e016dc8.png)
![[Diagram]](../../diagrams/22/b44b584a2cc47027961c923ca0d1117f.png)
![[Diagram]](../../diagrams/40/1a7a0675f9957cc5bcd5d846785fe56a.png)
![[Diagram]](../../diagrams/38/dc487e9b0753933195924e11c8f6a76b.png)
![[Diagram]](../../diagrams/45/0c606c3ed983d8e0ada1d9bc7357e9c3.png)
![[Diagram]](../../diagrams/30/be03abf27fe2b9f55a20482e605d54f6.png)
![[Diagram]](../../diagrams/39/cd49935e4610fe4365723b7405df112c.png)
![[Diagram]](../../diagrams/28/64a19fb549eec2a4aadac0d576656ec5.png)
![[Diagram]](../../diagrams/8/c4428ca68077487e0a2a87375b77b9ec.png)
![[Diagram]](../../diagrams/0/09634ab29193facd6ff2420426752095.png)
![[Diagram]](../../diagrams/2/80086941e92783bb6d2360b52007f743.png)
![[Diagram]](../../diagrams/42/8300a36619fc3839e67a61e228b3b630.png)
![[Diagram]](../../diagrams/41/fdc266e18bab918daec21415059c62e5.png)
![[Diagram]](../../diagrams/22/138819d2261a71ede9ec75822f4a446a.png)
![[Diagram]](../../diagrams/15/861361ebd74f31e5f332eb9e3c935ac1.png)
![[Diagram]](../../diagrams/21/0e1a72e77defb4819c824933493a820b.png)
![[Diagram]](../../diagrams/50/510e41821daa2e8935af6a6948d94ae3.png)
![[Diagram]](../../diagrams/17/e6d94ae83c4153f7362fb0890f2cc973.png)
![[Diagram]](../../diagrams/18/d49a5f060078c9ef1be25c3e7b621d5b.png)
![[Diagram]](../../diagrams/50/9ce1322c7b9a7f956e641257db06fb57.png)
![[Diagram]](../../diagrams/0/22675627885dbc98025472902c27bf5b.png)
![[Diagram]](../../diagrams/1/541c879d80cdbea403ddfb7367cec999.png)
![[Diagram]](../../diagrams/1/867560e8eb093caae438d21e5ab3c092.png)
![[Diagram]](../../diagrams/39/b7b4ff99fcf2c8a852d313a2cae0ecbf.png)
![[Diagram]](../../diagrams/46/0e41c5c43537ac9854aed32edf927277.png)
![[Diagram]](../../diagrams/46/aaf37edd6a496788b5bcc5829956b037.png)
![[Diagram]](../../diagrams/13/c80e3bd5ad88daa49dc4273426e676bd.png)
![[Diagram]](../../diagrams/6/12eba3585ad556683f7e08d15bc474f0.png)
![[Diagram]](../../diagrams/1/169f0fe5dc8a3e5a7c99d6d72ce81715.png)
![[Diagram]](../../diagrams/6/2f7e3f9fc70588df65efaca33fe0363b.png)
![[Diagram]](../../diagrams/44/179499237309024f99c021eb635b40f5.png)
![[Diagram]](../../diagrams/44/5db6e876f5949c5e90179ca8bd4ec78b.png)
![[Diagram]](../../diagrams/15/240b3e8722c941bc07b40816a0cf1c51.png)

![[Diagram]](../../diagrams/21/efa538492b1411a59a4d2abca89154e7.png)
![[Diagram]](../../diagrams/51/3dbf7052ee8fa8e868f1ecd5d43b8781.png)
![[Diagram]](../../diagrams/18/8c73b5b6cffa0f9ea245bdfea332ef8e.png)
![[Diagram]](../../diagrams/45/5f75a1a2766cba1807a6f8cc6cb503ba.png)
![[Diagram]](../../diagrams/38/15c46e04528889294329f8a2c1949a18.png)
![[Diagram]](../../diagrams/24/41aa1d1df985f7b8876b702bce0cc5ca.png)
![[Diagram]](../../diagrams/19/40884c1a14b4283c8087445a1edbb4f0.png)
![[Diagram]](../../diagrams/21/ab1271ece4e923fec0624dc502c988f3.png)
![[Diagram]](../../diagrams/28/a77ccf49f160104abdc93d64ed78df28.png)
![[Diagram]](../../diagrams/9/64f873cb4286e0c07da18816c281a1da.png)
![[Diagram]](../../diagrams/33/5f2815a85fef22c51720eb3f02f8b5b5.png)
![[Diagram]](../../diagrams/52/24bdc1998efe322947eecb380300db08.png)
![[Diagram]](../../diagrams/43/9397d0cae6cbd9e2d21f556fce510da2.png)
![[Diagram]](../../diagrams/34/5cb9330d79e50cf2401f0d80670eec54.png)
![[Diagram]](../../diagrams/50/2d657754f19dcb529b64a152b351cfef.png)
![[Diagram]](../../diagrams/7/2206a6f98c5bc9aab603a997cecc9841.png)
![[Diagram]](../../diagrams/51/c2b8465bcba3b2b7b000a2c5eb6a420f.png)
![[Diagram]](../../diagrams/44/d446c30e40debf0d899b45b0bbb75d17.png)
![[Diagram]](../../diagrams/28/6a4ca4fee0622fdcb188bad63912863a.png)
![[Diagram]](../../diagrams/38/eefafa80f4da4aedb20f341b7b843165.png)
![[Diagram]](../../diagrams/12/88c710992c87f83315cf749bedcdaa0b.png)
![[Diagram]](../../diagrams/13/0b8809004a41ae85f805f5e026583b32.png)
![[Diagram]](../../diagrams/39/7c55b34e596cebc46559a6d5cd59cd0f.png)
![[Diagram]](../../diagrams/38/28fb6cdafbb627ab56777b8678227ff4.png)
![[Diagram]](../../diagrams/42/968f179a059332c1504e3344a3f39cfa.png)
![[Diagram]](../../diagrams/48/7b1313ea19147cb7a22b82c0ca4ab043.png)
![[Diagram]](../../diagrams/18/0700c7771679030b76a9393ce33348fe.png)
![[Diagram]](../../diagrams/7/b2f52d21af80b7c8ccd4d65365d08ca4.png)
![[Diagram]](../../diagrams/45/a86fb903cf59a812a030d5348ccc9147.png)
![[Diagram]](../../diagrams/47/3b3ef1d6c4112e68c4cb9cdae8f1334f.png)
![[Diagram]](../../diagrams/27/fe76415fd8b5def570d76f447e51621c.png)
![[Diagram]](../../diagrams/22/a9889c4bcb8ab47c3261567f6379516e.png)
![[Diagram]](../../diagrams/4/9c117ad1e59af122332ddded141dd348.png)


![[Diagram]](../../diagrams/37/1676ff431b69f64442640992d5116d05.png)
![[Diagram]](../../diagrams/12/f71ba30954903d74d17ae5151a1c06e6.png)
![[Diagram]](../../diagrams/6/728a71cbe80fc389606da7fae69a74c7.png)
![[Diagram]](../../diagrams/38/f4280a97633a67370570327556e6886e.png)
![[Diagram]](../../diagrams/38/7599f134a8960e26ec9f78b854ad3778.png)
![[Diagram]](../../diagrams/41/e250bd360a1c441f93f9de4553380f00.png)
![[Diagram]](../../diagrams/46/bb4f3a14fe51db8fd7cbd0812662226f.png)
![[Diagram]](../../diagrams/52/a2da4755e1834a9091ddb3a65a93b530.png)
![[Diagram]](../../diagrams/7/7746b64f49c797b927dea8fd6f772a08.png)
![[ext]](http://www.themysteriouscitiesofgold.com/misc/hikago_op2.gif) http://www.themysteriouscitiesofgold.com/misc/hikago_op2.gif
http://www.themysteriouscitiesofgold.com/misc/hikago_op2.gif![[ext]](http://www.toriyamaworld.com/hikago/gallery/HikaGo62-01.jpg) http://www.toriyamaworld.com/hikago/gallery/HikaGo62-01.jpg
http://www.toriyamaworld.com/hikago/gallery/HikaGo62-01.jpg![[Diagram]](../../diagrams/21/52570ab0165786fa6eaa920c1497095e.png)
![[Diagram]](../../diagrams/11/3dcfc4b8efbd4249a09210b371dc669a.png)
![[Diagram]](../../diagrams/50/ceca4c29e95ab176f55e27edbe7d8afd.png)
![[Diagram]](../../diagrams/21/58e9d5a2b534235e414b2f3d51ecd70f.png)
![[Diagram]](../../diagrams/47/fe0bfa3f3ffef17d7adde6c88224d80e.png)
![[Diagram]](../../diagrams/52/e58670c0832b169fbe97a4bc85203419.png)
![[Diagram]](../../diagrams/27/567ba34257a98ec515f32f5a25860870.png)
![[Diagram]](../../diagrams/10/dc5b26dda40c556a85483d06fa49bb99.png)
![[Diagram]](../../diagrams/20/5c2dbd529e2a1ebcdd11c4f616d8bead.png)
![[Diagram]](../../diagrams/13/e65a7df0fda7fdd68fb43b2300804ebe.png)
![[Diagram]](../../diagrams/10/f3e4200fd9816c09c9d9a3fad0fb3950.png)
![[Diagram]](../../diagrams/52/6d1494be6d590093be0cc8df658cff97.png)
![[Diagram]](../../diagrams/15/47b80c4040bb510a5928a36960239e81.png)
![[Diagram]](../../diagrams/43/9b310f384392df51ab5ec67cfcd1b478.png)
![[Diagram]](../../diagrams/23/12bd3e50c83bbdf7c11947f2cd6f6ac9.png)
![[Diagram]](../../diagrams/8/e5f16c3ae0de5509e3a35b445ba72cb6.png)
![[Diagram]](../../diagrams/34/57a67ab78aa48c5ebdbe22ba74bb0c10.png)
![[Diagram]](../../diagrams/19/3db68819184a701f37c9fa3df97c2043.png)
![[Diagram]](../../diagrams/17/dd3382a408a69847c9db51c1ef469bfa.png)
![[Diagram]](../../diagrams/48/089b4f01ac3b608a0d42d3fdfa247587.png)
![[Diagram]](../../diagrams/32/d093954739b9b23453b8599b83b9ee92.png)
![[Diagram]](../../diagrams/30/820c4fcf1c8332ceb087f491a8cb2a05.png)
![[Diagram]](../../diagrams/32/cf61f5bee83ed1127b07843965f0d4b1.png)
![[Diagram]](../../diagrams/14/559841cc6162b46ac1c2eecd14be6402.png)
![[Diagram]](../../diagrams/28/ef656b9ec4ed89e183892467f3ada643.png)
![[Diagram]](../../diagrams/38/ca57ae605250f95a20102616da04d6fe.png)
![[Diagram]](../../diagrams/34/7e59ae6df418263ab75963a7eae5e6bc.png)
![[Diagram]](../../diagrams/52/f355916e40368d9a68d7672450b1ee59.png)
![[Diagram]](../../diagrams/12/94146d82bfa7e7cbb5227b4ab38af580.png)
![[Diagram]](../../diagrams/47/6bfa803cd030dd6cddaa70927feed9a2.png)
![[Diagram]](../../diagrams/35/83817324483475633da3480f6ca790e7.png)
![[Diagram]](../../diagrams/15/ba07552397962696a9f33a47407efa50.png)
![[Diagram]](../../diagrams/16/0d2690970c80e8720ec6f7bc00b2df63.png)
![[Diagram]](../../diagrams/42/df9adee2dbb6c1383b2a929a67b95a53.png)
![[Diagram]](../../diagrams/15/62f014c41b659dbaf008529d653c7dec.png)
![[Diagram]](../../diagrams/52/771be9b14e92b65f68325b615fb14368.png)
![[Diagram]](../../diagrams/52/3b6c1bde84a79a637e860e800eac85cd.png)
![[Diagram]](../../diagrams/17/5d9bf97e90bb0f6e39762e39c5552404.png)
![[Diagram]](../../diagrams/12/e9f0ccb542289a9878eb3f1c5144bf42.png)
![[Diagram]](../../diagrams/3/00aa9b83f4b950ee675a331b8c2d5119.png)
![[Diagram]](../../diagrams/26/f22e4c2e0c41c54cb35170368a349fc9.png)
![[Diagram]](../../diagrams/13/f77cb4cb14b824300276a15eaae2e677.png)
![[Diagram]](../../diagrams/23/2bce5c0a666b0a6a3c3f04ae067a3949.png)
![[Diagram]](../../diagrams/5/066d23a0f125c10b274769b52256846f.png)
![[Diagram]](../../diagrams/20/8e0a3c301e16ee5f3d960e91512b9f4f.png)
![[Diagram]](../../diagrams/31/aa402c6167fee1950de6dcfef6ad10d5.png)
![[Diagram]](../../diagrams/35/bfb982d15e4741c8c84192c20197a5de.png)
![[Diagram]](../../diagrams/7/8c960f950a721d71f6017499c2a6329d.png)
![[Diagram]](../../diagrams/51/6cd67e66d096ce79b520b3b612ac6a52.png)
![[Diagram]](../../diagrams/24/ed21a5e73a80a1efce39d3f8e6f43344.png)
![[Diagram]](../../diagrams/33/0969fee7d14699219e8aa05235692a48.png)
![[Diagram]](../../diagrams/18/c18b5731086005be10d3b65d1ea0ddab.png)
![[Diagram]](../../diagrams/45/c5d2daaeb22f0b55374664afe97400c3.png)
![[Diagram]](../../diagrams/43/fb33e688a758d56e3aeb16935f5efbe2.png)
![[Diagram]](../../diagrams/19/bfe479020417743c5a8a8de75c965d91.png)
![[Diagram]](../../diagrams/26/a0ffdd3e901e813364b7629540db7877.png)
![[Diagram]](../../diagrams/0/80e0ccfbd658385becb06a9442cc6568.png)
![[Diagram]](../../diagrams/24/d94fc7b3c19b280d75b21e22bc33549f.png)
![[Diagram]](../../diagrams/7/2b05dc0dbeecb44d5ef5be14a7ae8b1a.png)
![[Diagram]](../../diagrams/20/169a0048783ca7374013bc18166b4793.png)
![[Diagram]](../../diagrams/51/121d1897f2cf7a1d258014f135912838.png)
![[Diagram]](../../diagrams/40/3d2cd5f86caa6d5e559daf14a7801595.png)
![[Diagram]](../../diagrams/9/6bda272010f299a5029936641fe60a09.png)
![[Diagram]](../../diagrams/49/c9d12db67745be00b3872b32d6f809bb.png)
![[Diagram]](../../diagrams/8/4d503d1a70342e702ba948c93a6e30fd.png)
![[Diagram]](../../diagrams/16/bdfd366524fa5ba1bb289ffed53becf3.png)
![[Diagram]](../../diagrams/48/67a9d380f579a184ca3e6e6a26f73304.png)
![[Diagram]](../../diagrams/39/1677a21e39b62cadd9f50605110f5bf1.png)
![[Diagram]](../../diagrams/49/d098cf77bbfeb89a3b34eaee7b7200b5.png)
![[Diagram]](../../diagrams/14/24f94c090a8d23e710eb2979c55b836b.png)
![[Diagram]](../../diagrams/10/ba2b4b0e182fe0de2611efaaf1c19b07.png)
![[Diagram]](../../diagrams/26/c62bf64c4882da06a475f68824b7cb81.png)
![[Diagram]](../../diagrams/3/e0257b4dfe55f490cc680ef7038ac102.png)
![[Diagram]](../../diagrams/34/6a14ce5b91d9d7cf243ad10663d5f5d0.png)
![[Diagram]](../../diagrams/30/ceb8ad88c0312294dc69526340c97ac0.png)
![[Diagram]](../../diagrams/47/b0bdfe48e43e7d4c47fde7d32958bb15.png)
![[Diagram]](../../diagrams/32/d8469b2f62a0a53cd6e6820312de3216.png)
![[Diagram]](../../diagrams/23/3e65119800f27233c784e7080d54e97d.png)

![[Diagram]](../../diagrams/2/9bd028a0b88cfe8bef2385294c3b4c07.png)
![[Diagram]](../../diagrams/31/aa5844a6017e3aff7c8f282c6070f995.png)
![[Diagram]](../../diagrams/32/6e551c6d09f7d39cea7a196d338d619a.png)
![[Diagram]](../../diagrams/12/1f653a905ef4b688bcc023c1a1e133f4.png)
![[Diagram]](../../diagrams/28/c3c838e1c26188c313bd7f90cfd0e5f0.png)
![[Diagram]](../../diagrams/36/f1f6f75d25c7c31a9e1a98fcc755f9fb.png)
![[Diagram]](../../diagrams/34/f6312d7c686e1cf49facdfc0f28be143.png)
![[Diagram]](../../diagrams/2/d04e818aed7e4fbc97ad4ac19366b38e.png)
![[Diagram]](../../diagrams/38/ec1f7ed005d811e192c9b7b870a249ae.png)
![[Diagram]](../../diagrams/26/60fc672c194e222f6bf6a6dd9a2c9e96.png)
![[Diagram]](../../diagrams/39/91a7e8ccb0960211e214654987545db1.png)
![[Diagram]](../../diagrams/36/a4ac87f0ffb71c0cf52545a185402e1d.png)
![[Diagram]](../../diagrams/10/ebf27bb21f7562fabd0819b80b5e2f91.png)
![[Diagram]](../../diagrams/20/cd61b23a049f15591cc730775a896ac9.png)
![[Diagram]](../../diagrams/41/1eb5510849d44e02c4c94fc5b37fd6c6.png)
![[Diagram]](../../diagrams/13/b69399b2602a1863ee2388e02d6dd97a.png)
![[Diagram]](../../diagrams/27/350883188d6d12de48b843664a0411ee.png)
![[Diagram]](../../diagrams/26/72c0d63c40761b043d7177b4c78a88d1.png)
![[Diagram]](../../diagrams/9/6652453346dccea5e4421abac72f1330.png)
![[Diagram]](../../diagrams/14/0e94d6a7327b5e5910681203ab70a29f.png)
![[Diagram]](../../diagrams/35/270205cce2fe8028695017812b94b08e.png)
![[Diagram]](../../diagrams/17/63aa8e2edc34685a4880f7a2e8d7935b.png)
![[Diagram]](../../diagrams/1/c185c8ed2ffabc479b4fdd0e0eb87cf1.png)
![[Diagram]](../../diagrams/39/84195d9adfbb4740c98cc95fefadc1bb.png)
![[Diagram]](../../diagrams/37/e243d3ecc337ac00bfc5951c4c817766.png)
![[Diagram]](../../diagrams/19/0805319efdd1e53c2944590b5055e6b3.png)
![[Diagram]](../../diagrams/51/2f831b87cf2ca9d16a621624972451f0.png)
![[Diagram]](../../diagrams/39/de880016bf6098f1670c06225ba2876b.png)
![[Diagram]](../../diagrams/8/c77062042f00935300cbced43ddb10e0.png)
![[Diagram]](../../diagrams/6/91f82edf08b7c58381212fbbbc8219a3.png)
![[Diagram]](../../diagrams/24/3a3695530c9981a78629c9c4da9fdf03.png)
![[Diagram]](../../diagrams/47/4809e85e6291e1519ecf18e84f78b20c.png)
![[Diagram]](../../diagrams/21/b545cc88d77ccff92c0ac41c1ff36a08.png)
![[Diagram]](../../diagrams/22/1c7124cb01faf517bb4582de0ea8d221.png)
![[Diagram]](../../diagrams/41/627cca465934073f93a42f54ed01934b.png)
![[Diagram]](../../diagrams/50/402d2e942774373b5cadcd7ab8c41580.png)
![[Diagram]](../../diagrams/9/aff1e5d3b0f9ea62aca03ea764ac50e2.png)
![[Diagram]](../../diagrams/48/cfe1a1133825badb5c5862daf3d4cc31.png)
![[Diagram]](../../diagrams/16/37e670beb512f10f4fb70a9a54532bb5.png)
![[Diagram]](../../diagrams/41/573e87226f95c8325134da6cc4c846ff.png)
![[Diagram]](../../diagrams/30/116e39313812576ba9c890ab3302d550.png)
![[Diagram]](../../diagrams/18/d25358cdb83a70ed7a9bf873cf0a3a9e.png)
![[Diagram]](../../diagrams/6/83f161588639660f9227945e42a46e8e.png)
![[Diagram]](../../diagrams/20/5a1507607a55aa03597581c246f0cb34.png)
![[Diagram]](../../diagrams/24/d1c07e578fd9da1979d1cd174435c8aa.png)
![[Diagram]](../../diagrams/48/b96b841cd60fbaf89dedbe4e2a2497c9.png)
![[Diagram]](../../diagrams/46/36b94897ad6e03e7dbe966f43908f0a7.png)
![[Diagram]](../../diagrams/15/416deec392aaa3999bde282e1657dfce.png)
![[Diagram]](../../diagrams/2/e5dceb8cba9c31542e92030fad086027.png)
![[Diagram]](../../diagrams/46/30e870eb078a50992d099c039753798d.png)
![[Diagram]](../../diagrams/30/f0e29d480c38986e6e2120414b7e0266.png)
![[Diagram]](../../diagrams/24/756e9bd84ea9669256602fac3a5d6806.png)
![[Diagram]](../../diagrams/42/61a3bea60e96221819d9976cb05e12ee.png)
![[Diagram]](../../diagrams/34/bca0202f95d9806215423e099f662e26.png)
![[Diagram]](../../diagrams/24/1a54bea3f64bfef958bda26232b7243d.png)
![[Diagram]](../../diagrams/5/135bcc41a1bb92ca7589fcb179b45dc1.png)
![[Diagram]](../../diagrams/20/44c3dac8e6ab763563c92d9d8e6e9d72.png)
![[Diagram]](../../diagrams/44/da3edf93a7210c6c6dde4e28083edf03.png)
![[Diagram]](../../diagrams/16/4af92a6de2d56be481f66b7272aafa3a.png)
![[Diagram]](../../diagrams/47/3afd4222d5b0c62119c10c9e32f18214.png)
![[Diagram]](../../diagrams/10/2d888bf3a50a8e8c02c01ead0093c550.png)
![[Diagram]](../../diagrams/36/cf3730ac9df5e38fa7bb1305c2e4a830.png)
![[Diagram]](../../diagrams/39/85d571bc5db09282d1d7822b278e7ec4.png)
![[Diagram]](../../diagrams/19/5deee5c856a19424f2406d8274c93d48.png)
![[Diagram]](../../diagrams/3/f0f57cc347252ec6fb107cdec0d4ff21.png)
![[Diagram]](../../diagrams/9/1f5927a675a571b51cea29da3c9dc4bd.png)
![[Diagram]](../../diagrams/25/488c2e7bb0788be52e0498d168584bb2.png)
![[Diagram]](../../diagrams/26/9afc7537b6693243f988a8f7f6d71f39.png)
![[Diagram]](../../diagrams/34/713390ad7a06bb0dca43b95cd605c616.png)
![[Diagram]](../../diagrams/30/c42390dc32de797ac0f1bfe66c59009f.png)
![[Diagram]](../../diagrams/16/48eba8030f446ce2a8e1494de63fd43d.png)
![[Diagram]](../../diagrams/42/8dc9698dc4857a81f7bda2fc8992d92c.png)
![[Diagram]](../../diagrams/17/1025c96f3b717cf43ce69d1f805711e0.png)
![[Diagram]](../../diagrams/17/be7740ae92f9d328f13b48cb39fbf42e.png)
![[Diagram]](../../diagrams/7/26a388797a6f38ec4ea7379aa7d3fc4a.png)
![[Diagram]](../../diagrams/48/110ffc5b3577b7e8f036f66685ce2383.png)
![[Diagram]](../../diagrams/6/278693d10873a7bbd74bdcf5cd736f28.png)
![[Diagram]](../../diagrams/21/d84045ddb0b9c2f932170abdf4bd7c08.png)
![[Diagram]](../../diagrams/45/ea4dcc3d9dce160d986b8fbbff599eff.png)
![[Diagram]](../../diagrams/17/7e31500c67c36bd32907f0a6bf105e3f.png)
![[Diagram]](../../diagrams/18/81ef05019b8971dea40db21342ffc36a.png)
![[Diagram]](../../diagrams/15/aa8cb48641785da01438ef254fee97a3.png)
![[Diagram]](../../diagrams/35/92921eba68d402927fff04ceebcee18d.png)
![[Diagram]](../../diagrams/18/16c846f09d1806827e9aaaa035a24ce8.png)
![[Diagram]](../../diagrams/48/bdd8c2c1722a110b96fc4e1459b67427.png)
![[Diagram]](../../diagrams/40/f3f1383e1e1c243f98198681f68f15c0.png)
![[Diagram]](../../diagrams/40/fc2a633c576b38e5acec2e42981e2f4c.png)
![[Diagram]](../../diagrams/18/b46f3deceafb2e3ee3ec1261b2282d15.png)
![[Diagram]](../../diagrams/26/dc797f81a51ff663d8722acf41840292.png)
![[Diagram]](../../diagrams/42/f7a00b69484a07b7bf962d2b18bc41c3.png)
![[Diagram]](../../diagrams/34/bb3530966051ff5ad7d0bf5d57ddb487.png)
![[Diagram]](../../diagrams/49/f7f764b3002d2d365e4e436bd2d21e57.png)
![[Diagram]](../../diagrams/5/99631943e4fa106f84cd4ea36174040d.png)
![[Diagram]](../../diagrams/36/abc3b5ec6cd0d7f5d790e11407e3a9c4.png)
![[Diagram]](../../diagrams/42/5e94fe5b96f421225061c945f9cd4fb2.png)
![[Diagram]](../../diagrams/42/8430c9deb072003a634ce569a779e301.png)
![[Diagram]](../../diagrams/36/f1d7544f8a912364c59d75bba2be9ccb.png)
![[Diagram]](../../diagrams/39/7da99f188a41d4a9f4673e0300c3447c.png)
![[Diagram]](../../diagrams/2/5a38db46c7b0ce0632cdf6bad7f80ab2.png)
![[Diagram]](../../diagrams/28/254714627e4d465201e700371b8baa52.png)
![[Diagram]](../../diagrams/47/62d52169b4999195e2e370e5ef0619ef.png)
![[Diagram]](../../diagrams/0/7153e1c49086cc5b37462591a02c0c0b.png)
![[Diagram]](../../diagrams/19/9f2c0b2997edabc8b6df0b49287bf517.png)
![[Diagram]](../../diagrams/13/a06d9436b90cb980ea60cfcfd5b2caa8.png)
![[Diagram]](../../diagrams/3/ea30a3d7897050d9695c54018adaf3cc.png)
![[Diagram]](../../diagrams/43/571746c5fd0b9c7cbe2bb1f977921d3c.png)
![[Diagram]](../../diagrams/48/8608f302f1ec6cbd4b4efca55dff313c.png)
![[Diagram]](../../diagrams/1/79c92943d53c3415ab5de9ad140b91c4.png)
![[Diagram]](../../diagrams/19/bca50fb93555622322fde7b0bda72509.png)
![[Diagram]](../../diagrams/35/4ee55b1ddafc10abe5818049378f4e4a.png)
![[Diagram]](../../diagrams/27/498b90cf8c0117c2f9cc5d348c7da258.png)
![[Diagram]](../../diagrams/38/59ee1f0cfc6c5c48a0474c5ec468e6bc.png)
![[Diagram]](../../diagrams/3/791d8541c8a5456125897deeadf235de.png)
![[Diagram]](../../diagrams/43/3aa6c0aa459b889764d9069be8e0b03f.png)
![[Diagram]](../../diagrams/4/f5a18980137e884ef6d71bd591434fdb.png)
![[Diagram]](../../diagrams/8/785e074a47020ba03151f53313a737d7.png)
![[Diagram]](../../diagrams/43/933bdae914395170083d69b05d9f3498.png)
![[Diagram]](../../diagrams/49/912806baf798b345b946cbec9a557314.png)
![[Diagram]](../../diagrams/38/72aff3ca026640e199ad114a1100c912.png)
![[Diagram]](../../diagrams/23/3e3a40697f5121efdf52a57615ba0513.png)
![[Diagram]](../../diagrams/21/a949a586d763b648136cca3f06905b12.png)
![[Diagram]](../../diagrams/29/681d811246658db370b966055e777738.png)
![[Diagram]](../../diagrams/3/51e2d75e05640b83e2eee782a2de8eb5.png)
![[Diagram]](../../diagrams/52/0e710f080dfac892aeaa50855d7e07a3.png)
![[Diagram]](../../diagrams/34/fcd679750e1dce181fd1b44ba4531411.png)
![[Diagram]](../../diagrams/33/e75292e40bf0d6b841653288207849c6.png)
![[Diagram]](../../diagrams/46/ff419257b8d630725207060faec56046.png)
![[Diagram]](../../diagrams/12/fe97cd044888e347ce885ff853154190.png)
![[Diagram]](../../diagrams/30/d7f0281093a52875225dfcc8f983c7f1.png)
![[Diagram]](../../diagrams/9/61370d4628148701748dcf4cd1510bf8.png)
![[Diagram]](../../diagrams/14/38b3a89a67044b5f41e7a8713021796b.png)
![[Diagram]](../../diagrams/2/581e24417752abea532b93068279d68c.png)
![[Diagram]](../../diagrams/50/f036eb3640546ea0b849f851b1812177.png)
![[Diagram]](../../diagrams/25/8a03f2e8731f81549d3fca44cafcbd3e.png)
![[Diagram]](../../diagrams/26/20e5ec971ef755463834cfe0f7a5ffd1.png)
![[Diagram]](../../diagrams/35/30184a7174e89a16ce97f075a7b0466c.png)
![[Diagram]](../../diagrams/7/bc9ea68bbd7391b8ad3f7e3221b0e37d.png)
![[Diagram]](../../diagrams/22/24b1162837f61e37ecae5181d3ad221d.png)
![[Diagram]](../../diagrams/42/258a3aab5fbea0fbae7d4605f4979a19.png)
![[Diagram]](../../diagrams/46/2a666372333d6403eaa67007d200b1a9.png)
![[Diagram]](../../diagrams/41/9ec7f2139c297dc8cb38c2595915a4ad.png)
![[Diagram]](../../diagrams/45/42d843666e9a60791ae1c55652b54195.png)
![[Diagram]](../../diagrams/50/468528b7c066d33fc54f631cb3d2fe51.png)
![[Diagram]](../../diagrams/33/f224ada79a879b46bb4655eb6719269f.png)
![[Diagram]](../../diagrams/18/acac8678a78ed5f9cec3f87c9c549ec9.png)
![[Diagram]](../../diagrams/33/23b7910f717ddc36bae70352271b2c39.png)
![[Diagram]](../../diagrams/43/0c223523c26b81384369858ff1ba6363.png)
![[Diagram]](../../diagrams/25/583850fceef45b060e73335d260a168e.png)
![[Diagram]](../../diagrams/38/7be74ec8a23cf3151e8362c1dc051308.png)
![[Diagram]](../../diagrams/33/75639c0056028e4bde1a735319b9e1f3.png)
![[Diagram]](../../diagrams/32/7e0bbda7d8bb6a0777cb8785175376c5.png)
![[Diagram]](../../diagrams/13/0a6f1a5fb867153662769c36cdd1fa42.png)
![[Diagram]](../../diagrams/43/ba3836dc8517e214f692f55b2511e299.png)
![[Diagram]](../../diagrams/35/7d8d0242ef3f605efea88862d68c9cb8.png)
![[Diagram]](../../diagrams/11/29d16f2b3d1772649b2e86e6bbc3ba36.png)
![[Diagram]](../../diagrams/19/93d8138579e36d11e011eeeb8bbe917d.png)
![[Diagram]](../../diagrams/19/06042d9e74e7f16de58d0903912506e1.png)
![[Diagram]](../../diagrams/4/c3f752b5a5da126cb6c9ed25c01796ea.png)

![[Diagram]](../../diagrams/36/7a5beb7667ff8d1be429fb72f4ffbf07.png)
![[Diagram]](../../diagrams/31/6dcaec24a01521af83b624d1b27374d0.png)

![[Diagram]](../../diagrams/19/a2e976e722c3c9423cff1bccd60f10cc.png)

![[Diagram]](../../diagrams/39/ec00236d62b1f53273ffd297d4042f90.png)
![[Diagram]](../../diagrams/42/eefbd2e5db687536e7f5725005e2ae6d.png)
![[Diagram]](../../diagrams/31/caf663aafa4a68ff0098e77de8a375b7.png)
![[Diagram]](../../diagrams/45/9d1bb16d677198bb5147d96e28b06a8f.png)
![[Diagram]](../../diagrams/33/6397d853d57a2916c70f40cd9b68f4d5.png)
![[Diagram]](../../diagrams/17/d922646bc37feeb10bfcf2becb67d48e.png)
![[Diagram]](../../diagrams/30/05c45494c0e48b1089a2e0a592dd077b.png)
![[Diagram]](../../diagrams/44/789ac20a76e9083503cdfd404cfe2c49.png)
![[Diagram]](../../diagrams/22/8cc0d3374bbc82904a6f1a5fb5cef33d.png)
![[Diagram]](../../diagrams/38/ce9961e6334d8903685c2aaabd812330.png)
![[Diagram]](../../diagrams/1/8f969c4778dff9e722525c1a10d28904.png)
![[Diagram]](../../diagrams/21/eb0afacb63896a7c51248e8190692c8d.png)
![[Diagram]](../../diagrams/43/a54b19fabbf9e54362401f6a814b49e8.png)
![[Diagram]](../../diagrams/8/3b4a3d26c3dd0332840656ff64ed1ac0.png)
![[Diagram]](../../diagrams/10/6766ad7b2ba5356555f0871430e8fb51.png)
![[Diagram]](../../diagrams/48/bbf88d460e17e8cb98b52efcdd65c5f9.png)
![[Diagram]](../../diagrams/34/9bab0b473d88727061b3c125456e38de.png)
![[Diagram]](../../diagrams/13/9780e2864d4cbe4dd17a9043e01075f5.png)
![[Diagram]](../../diagrams/47/8a3efa30accd8200db20fb2bd92b5669.png)
![[Diagram]](../../diagrams/12/5650ac50e882f8e04540646f5b83d79d.png)
![[Diagram]](../../diagrams/28/5da2927948b6ed0cde80c57d3763e3c7.png)
![[Diagram]](../../diagrams/30/920c4f50ff8bf9c7ed047eb6bcff1cef.png)
![[Diagram]](../../diagrams/21/09a6559379c0971b50dc7b1ca2095dd3.png)
![[Diagram]](../../diagrams/36/fc4924d83ccad50558952b70aa54deff.png)
![[Diagram]](../../diagrams/30/354b2f8dd148e90d89d96940f75a24f2.png)
![[Diagram]](../../diagrams/1/865603e8d96803adc5793ae4c485464c.png)
![[Diagram]](../../diagrams/20/6d3a005441e6a292079980db485149ba.png)
![[Diagram]](../../diagrams/34/6cad14eaa2270ebbebfd845f715d8d4d.png)
![[Diagram]](../../diagrams/52/bd706c89985780f5dea6d3dc602deec2.png)
![[Diagram]](../../diagrams/28/217f294ae82e234e679501404120393b.png)
![[Diagram]](../../diagrams/50/68e2cb639748dc578dc9e17078a09f34.png)
![[Diagram]](../../diagrams/27/378bd95675849831be78e6df20015dbc.png)
![[Diagram]](../../diagrams/16/989315aece824447f77fe905869c6150.png)
![[Diagram]](../../diagrams/34/518aeda5c2c8882dee28da43e7cb03b7.png)
![[Diagram]](../../diagrams/19/2143af04c27c60bede3e4a61e2485df5.png)
![[Diagram]](../../diagrams/25/77888477b8b86fb5c08641ad7b50a46d.png)
![[Diagram]](../../diagrams/20/b1445f3d198a8cb5b0264d1cda645648.png)
![[Diagram]](../../diagrams/47/6bdf36d1e3d6149546698b9752228f73.png)
![[Diagram]](../../diagrams/21/8de13a6592c007e19a4b0a378b6b0afd.png)
![[Diagram]](../../diagrams/19/dd509deddff1fd9f1d7ca6b7d05fc0d1.png)
![[Diagram]](../../diagrams/49/99f192e6aebb302302a2810ab4487221.png)
![[Diagram]](../../diagrams/44/2ec4c7ca5ae975513ac372230819effd.png)
![[Diagram]](../../diagrams/1/06f1b3fbc82bef39e884ef0a7a83a64e.png)
![[Diagram]](../../diagrams/12/78636988176c6c460791896cbb240207.png)
![[Diagram]](../../diagrams/13/b925a10393b0ea58f8ae9391fc1fc2b4.png)
![[Diagram]](../../diagrams/27/591942fe77f7cc5c29cdfe95f3bb9107.png)
![[Diagram]](../../diagrams/3/a75d3f439fe26513432b5d718a1f25bb.png)
![[Diagram]](../../diagrams/3/0c413d8da31ccc3ca32224ca7d2a9887.png)
![[Diagram]](../../diagrams/49/ec16da2d796fa835f5990505f54bc33d.png)
![[Diagram]](../../diagrams/38/44c93403d21ec338a2a46f107559cbbc.png)
![[Diagram]](../../diagrams/4/9b12fe29ae288234fac138b1ff09b607.png)
![[Diagram]](../../diagrams/14/055410a34e05fe0d0810fece688ea911.png)
![[Diagram]](../../diagrams/1/171964f634b50cce025468d13eda6667.png)
![[Diagram]](../../diagrams/1/31a54801b12a9b2f87acd0b00c3195b9.png)
![[Diagram]](../../diagrams/50/7ad65c2f22cbc4d83093d38fc52e2469.png)
![[Diagram]](../../diagrams/19/03e88c6bc442244ab406309e7aab5a5a.png)
![[Diagram]](../../diagrams/28/79992f8b8414be37319492ef1182ef1f.png)
![[Diagram]](../../diagrams/17/589e4af722179dcd9fb49b528b4e9939.png)
![[Diagram]](../../diagrams/3/db6e85d8f1b233fa77e46d12098a85ef.png)
![[Diagram]](../../diagrams/43/e55e246b8fe015119d1680bf38736d33.png)
![[Diagram]](../../diagrams/6/4352f7533acff768b3c4715695edbb5c.png)
![[Diagram]](../../diagrams/13/57677abab49c122861f3240ccd986851.png)
![[Diagram]](../../diagrams/9/7e3fc26f13ec44b4ba32bb618b835481.png)
![[Diagram]](../../diagrams/43/cb988a2b082d2e2665f3d471662d400d.png)
![[Diagram]](../../diagrams/27/4402424b98ff4ba619fbbc99bbe3ee2c.png)
![[Diagram]](../../diagrams/31/25284390b785b5a016542d5183a12beb.png)
![[Diagram]](../../diagrams/41/41da7bad98c46b8c7e17d51bb9711b2f.png)
![[Diagram]](../../diagrams/27/8203d07f32b0fc5e13d526b2d50f3167.png)
![[Diagram]](../../diagrams/26/4f347c821ba03f75f110932d4af8b47c.png)
![[Diagram]](../../diagrams/17/33936711bace15c9e0be80e2e2fcc3c6.png)
![[Diagram]](../../diagrams/37/4b4ff6fef45cd15cfa5cc4884c8e0220.png)
![[Diagram]](../../diagrams/0/de6a9d1ba7f38b7580423bb0dc7e663f.png)
![[Diagram]](../../diagrams/7/16494fb98633f5b2b79aab7cd4a62b01.png)
![[Diagram]](../../diagrams/4/8f6a748474b4b5c898fe84314e390b0f.png)
![[Diagram]](../../diagrams/42/2c53c3179ceb5d0a27ecf4dd15ed5d88.png)
![[Diagram]](../../diagrams/45/f0945afd2ec1531486b22e9651cf5168.png)
![[Diagram]](../../diagrams/13/fe7feba87e07687b7c08fd1848ce0bda.png)
![[Diagram]](../../diagrams/17/8d7f04e23f78521c5f924185c2304408.png)
![[Diagram]](../../diagrams/20/654fbdf38cb62f70eddb528dd08793bb.png)


![[Diagram]](../../diagrams/14/1dca6f811dc7386a00bb110d3352a738.png)
![[Diagram]](../../diagrams/36/c346babd15e4e5a860372f852528f483.png)
![[Diagram]](../../diagrams/2/ee3038793374fcdaae3e9435ea87f028.png)
![[Diagram]](../../diagrams/39/ebaac047c9f0b784d1abc3932b25a916.png)
![[Diagram]](../../diagrams/21/a7b9c4500863b563520388eea5a1bb9f.png)

![[Diagram]](../../diagrams/7/1119371271fe709e1df5d59c675d6c5d.png)
![[Diagram]](../../diagrams/18/2a681bf6bd13386054aae9b372e3f518.png)
![[Diagram]](../../diagrams/11/55ff762d7e7d04de0b57ed51d1943fe7.png)
![[Diagram]](../../diagrams/37/258945c70ba9df7db67944129d05e367.png)
![[Diagram]](../../diagrams/23/b6609ee90aa02207a028dce966d528a7.png)
![[Diagram]](../../diagrams/15/785470f1128bab0642a6d584000e12c3.png)


![[Diagram]](../../diagrams/52/83fa2a64021334a70ffc372138e5ee7a.png)
![[Diagram]](../../diagrams/52/7552d92e2af0e57297cb8bb5b87d4700.png)
![[Diagram]](../../diagrams/24/4d4317d14faa30126ff0702766140e8a.png)
![[Diagram]](../../diagrams/15/1c95eb223a340624652e8a3c81650ecb.png)
![[Diagram]](../../diagrams/4/4f48f9334b1a7464a25d6b7dbe8089f7.png)
![[Diagram]](../../diagrams/8/d5e3d601d5258008db473882c4cc00a7.png)
![[Diagram]](../../diagrams/0/227af8db792471a85e11e2edc0b79c1b.png)
![[Diagram]](../../diagrams/46/dc345849c393dbc6d2a7c445043bca17.png)
![[Diagram]](../../diagrams/24/c20fa171535ac950e57d0795974fb3f8.png)
![[Diagram]](../../diagrams/51/69523ecb90b32564b175cb5de009947a.png)
![[Diagram]](../../diagrams/26/1b34f073428d6fbc04373c3d2c9bee94.png)
![[Diagram]](../../diagrams/49/ec94088e78521f5fb750c055e3e8ae83.png)
![[Diagram]](../../diagrams/0/0cd7efbc027c9fd7f3728ba1bd18998d.png)
![[Diagram]](../../diagrams/18/27f30c0f5cf83bff1ebd0930d0c45ffc.png)
![[Diagram]](../../diagrams/49/dea7d766b666040d104454aa77183fc3.png)
![[Diagram]](../../diagrams/10/906940da711e6c2a98925b33069d7145.png)
![[Diagram]](../../diagrams/30/2a88b60593db0bfc24f08e9f803957b1.png)
![[Diagram]](../../diagrams/4/dade676d8a8aa94af1e05af0554558d8.png)
![[Diagram]](../../diagrams/8/fe0ab7c9c889d5ce8e148c3754e2f2f9.png)
![[Diagram]](../../diagrams/35/979f60f807a6040169d5b6b2f5a60a03.png)
![[Diagram]](../../diagrams/9/3360ff008af32abf2122caba6d868ddf.png)
![[Diagram]](../../diagrams/40/7e20a7943cb34743779abc5917884fb4.png)
![[Diagram]](../../diagrams/26/23c12ed8dc4b192d4c2b337197a54ee0.png)
![[Diagram]](../../diagrams/45/df81e61a46f8ae9ad8b2258f2e9a846e.png)
![[Diagram]](../../diagrams/21/44916f11e781572abf96ad29e3d0cdec.png)
![[Diagram]](../../diagrams/43/eedaa59036d5101b4757f5d8d1e157ce.png)
![[Diagram]](../../diagrams/1/9945e085f7aedcc4ccc48f071152363a.png)
 : this page is an
  : this page is an
  : this page was only edited as
 ![[Diagram]](../../diagrams/11/edd1c7e0b036754c34081c8f67336aa1.png)
![[Diagram]](../../diagrams/23/45cd8a7c236eacb1a0c23841d8914863.png)
![[Diagram]](../../diagrams/4/e2c465bd43526aa47292aec156d3f9cc.png)
![[Diagram]](../../diagrams/9/8f60a36086c052a4b6cdce8cad117df5.png)
![[Diagram]](../../diagrams/46/a24d600311980d8ee1591f419129afad.png)
![[Diagram]](../../diagrams/14/6ce1493d5480b7a63c48ee367ef27e6a.png)
![[Diagram]](../../diagrams/18/7e3307153d777791e4937022ff7ddb75.png)
![[Diagram]](../../diagrams/35/604d9ab32439ba06dae7291411e21752.png)
![[Diagram]](../../diagrams/14/9b66f13d2afaca32722eda70ea2ab41b.png)
![[Diagram]](../../diagrams/8/3c1381437c199db7f868df8835a63551.png)
![[Diagram]](../../diagrams/42/7f1eb98ef67adec10e1ad0b05c3f49b4.png)
![[Diagram]](../../diagrams/23/c414d9cccbc06c35293921b4ab679d85.png)
![[Diagram]](../../diagrams/6/21e836c3b0c884e815a831a5383a6749.png)
![[Diagram]](../../diagrams/52/8f0454e1fc517ff6ea8681d36e304170.png)
![[Diagram]](../../diagrams/29/f59631cb126cb4a8a7025d78bfbe01ab.png)
![[Diagram]](../../diagrams/30/6bd572dd60c3cd17fd92faf4f0048707.png)
![[Diagram]](../../diagrams/9/c620fbc2f63c2028002aeabbc20e4c23.png)
![[Diagram]](../../diagrams/32/7a4f5b29058305c7495ed543ce669e29.png)
![[Diagram]](../../diagrams/16/812da6f5981cb8295051e6d0be96b092.png)
![[Diagram]](../../diagrams/22/cac105835d1711df4a526bbb1737582c.png)
![[Diagram]](../../diagrams/45/ed72a7d31020be784488f6c9a163fa86.png)
![[Diagram]](../../diagrams/11/84c64c71a2213232469f4eaed1e89c8a.png)
![[Diagram]](../../diagrams/26/8ac5fe20027ad9430ac6a0490248f2f4.png)
![[Diagram]](../../diagrams/46/2641d9f82db2f3ffd5b4b67b81dc25b2.png)
![[Diagram]](../../diagrams/44/a5d50cc467c047ebd7356199dc9f5ed5.png)
![[Diagram]](../../diagrams/31/78c8d1484a4b6b8a8508bc91515f55f7.png)
![[Diagram]](../../diagrams/5/65a23444cc59da2653574e3ddec3a698.png)
![[Diagram]](../../diagrams/22/44b2c3effa75fb565e810bd57dc04f24.png)
![[Diagram]](../../diagrams/49/6faaa0f5195b2820eb37a0bf5d239863.png)
![[Diagram]](../../diagrams/45/a302499ccd420571ea46be6a55559b3d.png)
![[Diagram]](../../diagrams/2/bd34e697ee3ca32a7e0c1e477c141abc.png)
![[Diagram]](../../diagrams/31/535502d257d29a041646d63eab3c2ed3.png)
![[Diagram]](../../diagrams/25/17c528fdc3227d52f9da0a8853397561.png)
![[Diagram]](../../diagrams/11/3ee18c5fdb3bb9fcf105c19703d8bf39.png)
![[Diagram]](../../diagrams/11/84f02331308dd5b6facf7e766239eea9.png)
![[Diagram]](../../diagrams/38/0e6364a7577149f73a6b369ebb18e9fb.png)
![[Diagram]](../../diagrams/41/85c2c7c777a42f230dd3a2f8d377f579.png)
![[Diagram]](../../diagrams/50/70024ef62d91ba52ae46fd3ef21edf15.png)
![[Diagram]](../../diagrams/23/ce8a08d13b7f5d4937b04c2e1ef397df.png)
![[Diagram]](../../diagrams/22/6de4abf99f3fe2456b4f7467d492f553.png)

![[ext]](http://users.skynet.be/rexburton/proverbe.jpg) http://users.skynet.be/rexburton/proverbe.jpg
http://users.skynet.be/rexburton/proverbe.jpg![[Diagram]](../../diagrams/46/3871a0fbe4ecdb7fe449d5727572e713.png)
![[Diagram]](../../diagrams/47/54060676c48e0a2a18344eb4dbdb4c9c.png)
![[Diagram]](../../diagrams/17/80901ac81f4d138fa5216d678fb79f22.png)
![[Diagram]](../../diagrams/1/61395855571f55f41331d815a8cc768a.png)
![[Diagram]](../../diagrams/12/dd3bd965f4966f6bdc1fc52df781a56a.png)
![[Diagram]](../../diagrams/19/c5cf3ce9764a8ec43fe0d67bf2a6d1eb.png)
![[Diagram]](../../diagrams/8/47154f4e8a9b552cee5686ef41a8ad27.png)
![[Diagram]](../../diagrams/1/e6e170fbb5ab44a25fd00c44edd72be2.png)
![[Diagram]](../../diagrams/22/6d6f282a7b956ea398686e3bafd373f4.png)
![[Diagram]](../../diagrams/23/c4d0a50ee0655481b64241da2e526a70.png)
![[Diagram]](../../diagrams/17/06cea6766f47a491ea2182d8dcb3183a.png)
![[Diagram]](../../diagrams/41/c0e43658329af0852434a0d4230ee0d6.png)
![[Diagram]](../../diagrams/35/6f1c037a958603bb3a9df1893b270ace.png)
![[Diagram]](../../diagrams/46/3eadad21dd17ed4d651dc57dd8d2943b.png)


![[ext]](http://bresler.org/Go/BookCovers/FaYangLun_front.jpg) http://bresler.org/Go/BookCovers/FaYangLun_front.jpg
http://bresler.org/Go/BookCovers/FaYangLun_front.jpg![[ext]](http://bresler.org/Go/BookCovers/FaYangLun_back.jpg) http://bresler.org/Go/BookCovers/FaYangLun_back.jpg
http://bresler.org/Go/BookCovers/FaYangLun_back.jpg![[Diagram]](../../diagrams/11/0deb995bfa6e76e17c66448590b0dfac.png)
![[Diagram]](../../diagrams/28/9509426626b606f691f26f963828e543.png)
![[Diagram]](../../diagrams/14/9f4041c444371306ad269c016e9ce364.png)
![[Diagram]](../../diagrams/31/51e16c6aff764d5d3f74fa661a5c7aec.png)
![[Diagram]](../../diagrams/30/f5e6d6d7fa5e995fddc3a47bae8e97ef.png)
![[Diagram]](../../diagrams/30/308513d5127815543f1f608233832146.png)
![[Diagram]](../../diagrams/28/d70df6a65dd05f5a86427f3bedba502b.png)
![[Diagram]](../../diagrams/8/bf9a67324ecd35d287bf1c0d6c4ff77d.png)
![[Diagram]](../../diagrams/44/2e7fd1fd8e33c64b4b6cdc56dc325d9a.png)
![[Diagram]](../../diagrams/52/7c907d87e643a1ed893bbd456b779c69.png)
![[Diagram]](../../diagrams/42/f4bcab6a01782ad0ea8aebc64c614a45.png)
![[Diagram]](../../diagrams/46/ce0ef9410972897504237934bda28223.png)
![[Diagram]](../../diagrams/21/b5ff9b27694d56fb2f5bdd49cdae87b3.png)
![[Diagram]](../../diagrams/9/06a70a42e5a8edc37ef3a82460d3a8b9.png)
![[Diagram]](../../diagrams/12/ed255227b23b415369c2348535fa5dc0.png)
![[Diagram]](../../diagrams/15/fd98fc6e466e246d0f42fc6fe63f8fec.png)
![[Diagram]](../../diagrams/1/b76c0700c9fcfd24253fb6b098c05277.png)
![[Diagram]](../../diagrams/26/08e2f45df08c2adcd5e0a6ab9abaac6f.png)
![[Diagram]](../../diagrams/30/6ac54b2d795ab1c7d9be3fc669888617.png)
![[Diagram]](../../diagrams/48/5eb52282624f69d1d60bad69ed996521.png)
![[Diagram]](../../diagrams/44/eae3976a2429d5954d3adfccafee3488.png)
![[Diagram]](../../diagrams/2/b85a053c927881fd075e073afbf39bdb.png)
![[Diagram]](../../diagrams/33/d3b07b7e81e6ae66dffa7fee29243499.png)
![[Diagram]](../../diagrams/48/a3f8c750fa4ff7a0c9487f0dd283a8b1.png)
![[Diagram]](../../diagrams/8/4e915821588d1d0ff9a214215afc691d.png)
![[Diagram]](../../diagrams/17/4d083dfe7c490f9387fc59f43bea6e8b.png)
![[Diagram]](../../diagrams/15/0aebb17845fe2ce7d2863d6b3c5b2a19.png)
![[Diagram]](../../diagrams/47/3c85172ea6accecaf164184bc3af0c2d.png)
![[Diagram]](../../diagrams/22/99132c84b3ccb211aa5b5f0740e9ff34.png)
![[Diagram]](../../diagrams/21/15a7dc788c3230e525e5ebd385aff54c.png)
![[Diagram]](../../diagrams/8/4d0d13356a74acdbc4ac403d595a00c8.png)
![[Diagram]](../../diagrams/35/4263ead72fdfd262c4af8d0eea0886d6.png)
![[Diagram]](../../diagrams/37/a64343828a4ace4cdf880f3b3b91d000.png)
![[Diagram]](../../diagrams/52/9f2109500c764cc15248b58651c28a77.png)
![[Diagram]](../../diagrams/39/312d0de87529971f1740b7e08d3e7e9c.png)
![[Diagram]](../../diagrams/3/f4c822f564cf7934e7628d72a53f7e09.png)
![[Diagram]](../../diagrams/48/f9a53b207e3ade30c7537e3b3f88115c.png)
![[Diagram]](../../diagrams/44/f69c71a2f1f393b01c19e9ea9b980d1a.png)
![[Diagram]](../../diagrams/26/a7479666fbafa8ce7e3ed4413bfcb7a9.png)
![[Diagram]](../../diagrams/32/a01d51289ab7f4f5dce9ea4f46925b32.png)
![[Diagram]](../../diagrams/7/4d46b0130cb34b6e3e2359538ac88830.png)
![[Diagram]](../../diagrams/45/118b7e6156f2131a88df084546b73fb2.png)
![[Diagram]](../../diagrams/8/ea3e30170bcfa06ce2ca6a1c6347ace1.png)
![[Diagram]](../../diagrams/48/199d4656be29b0b1206f80e8f777b657.png)
![[Diagram]](../../diagrams/12/8af77975c95f4ce2f0e887f65fb15e9a.png)
![[Diagram]](../../diagrams/30/2986604bc463739307b139e887f92ea3.png)
![[Diagram]](../../diagrams/13/579da8c9382d68ad787b854aa7887c7f.png)
![[Diagram]](../../diagrams/24/e4bc14bc7559a4934e51b133a55a29f6.png)
![[Diagram]](../../diagrams/0/93fb556d76366a72a06284b43182e14e.png)
![[Diagram]](../../diagrams/38/487a026de75468412dd82f66c1873359.png)
![[Diagram]](../../diagrams/31/2ee3db497241ce85396d660f470e3573.png)
![[Diagram]](../../diagrams/52/6330e10074b99eee13738717648ab672.png)
![[Diagram]](../../diagrams/33/0161b016ab6c7d26ae5362e01c1bf59c.png)
![[Diagram]](../../diagrams/37/676d89b301ba34d11808b7e8e02b75b5.png)
![[Diagram]](../../diagrams/34/08d2fda35b83d6f82f770a2c66864520.png)
![[Diagram]](../../diagrams/11/340b52a8ab0159cb4b13d67ba5d44f9c.png)
![[Diagram]](../../diagrams/45/2742c9be0e84cc969355d792f3ab82fb.png)
![[Diagram]](../../diagrams/0/ed245ee87ab41c820eda8d1d105f890b.png)
![[Diagram]](../../diagrams/30/50710dc2b5aa861573cd11911bf8f207.png)
![[Diagram]](../../diagrams/49/ef58266b73e8305167f18c5d4ec46e19.png)
![[Diagram]](../../diagrams/1/70148f9b05ef795e4b62da939e85f9a4.png)
![[Diagram]](../../diagrams/47/0579ea35503e9ad5ca8f27a82539c83b.png)
![[Diagram]](../../diagrams/8/5aa86fd9a8dda2db0dc02d0517e148a2.png)
![[Diagram]](../../diagrams/23/e2a54fea348e83d2722aeeea8a7028bf.png)
![[Diagram]](../../diagrams/52/dc7b67e6af3b21abd0ea66fe21bdad1c.png)
![[Diagram]](../../diagrams/8/3c94ad2963ce9279ce14358cdb43bfa0.png)
![[Diagram]](../../diagrams/38/7d742a16d51e6b7251d7c3d8b6098000.png)
![[Diagram]](../../diagrams/46/2bd3d6640193c99984da19d50219cc9c.png)
![[Diagram]](../../diagrams/46/f0b564a2331c20c0060db80829579950.png)
![[Diagram]](../../diagrams/6/bc16a9c68f01b4dec287057d7703337f.png)
![[Diagram]](../../diagrams/28/347c51188f351de24a726c3e13b3fa1b.png)
![[Diagram]](../../diagrams/7/f35699a444ba78c965cbd12c01abd660.png)
![[Diagram]](../../diagrams/13/b2122393edb676a959b831b9b85ccc33.png)
![[Diagram]](../../diagrams/16/e03dada413e0b48e24e2a98d84776f51.png)
![[Diagram]](../../diagrams/8/0b565ae95a8c8d024ca01a127eac3c6a.png)
![[Diagram]](../../diagrams/11/7bfd0cd9eb7a53e759c82d4118a3f8fc.png)
![[Diagram]](../../diagrams/7/17e2088ce7dc1cd36424a49ff508c7b3.png)
![[Diagram]](../../diagrams/23/4a852c34f10fe271c86a3e47405d8f5f.png)
![[Diagram]](../../diagrams/23/76a95bb082be8faf94bdb7952da559c2.png)
![[Diagram]](../../diagrams/27/0e0c9df645ff3eed823d8d1bcaa9d143.png)
![[Diagram]](../../diagrams/3/c5a48e620157b16863a9ac3d513943f9.png)
![[Diagram]](../../diagrams/34/091f3ef5d8f671c494d7517558beb2cf.png)
![[Diagram]](../../diagrams/17/d4b1124359434ef397fd066bfbaed6bf.png)
![[Diagram]](../../diagrams/34/12163d21eab43c0797c444230a7659f3.png)
![[Diagram]](../../diagrams/6/bc36c39667c11406f9ff172da7af758c.png)
![[Diagram]](../../diagrams/2/75aaeb864d218e97a10afe5e7bfa57fe.png)
![[Diagram]](../../diagrams/47/4365784a5165485003dfafa3f8055077.png)
![[Diagram]](../../diagrams/14/ad851c259f67f11387c2052464e7134a.png)
![[Diagram]](../../diagrams/30/81b7e840c5acaeafa197e8034ece5536.png)
![[Diagram]](../../diagrams/22/1c607ec8cd320d5954dab6d04b05aea1.png)
![[Diagram]](../../diagrams/40/cad895249a484efcc5fa8ecc1735a394.png)
![[Diagram]](../../diagrams/38/68b50ff7ebec331d5174d5cef513a879.png)
![[Diagram]](../../diagrams/1/58a16bf70232dd8473c83850ac1f6159.png)
![[Diagram]](../../diagrams/24/1178f5a0d08aeba817f67c09b22913c2.png)
![[Diagram]](../../diagrams/23/b8842fa532b615a36ca58d29d3c7aec4.png)
![[Diagram]](../../diagrams/26/0da3c1ed7c561035b74ae52ffea367e6.png)
![[Diagram]](../../diagrams/26/53d786bad734446f562580a982995c2b.png)
![[Diagram]](../../diagrams/24/379a98f8d303f300dd7ac7276aacd9fa.png)
![[Diagram]](../../diagrams/0/b690fca63b34b62e927735832685da9b.png)
![[Diagram]](../../diagrams/30/1118e806d0d45337caabaeae3a267f32.png)
![[Diagram]](../../diagrams/33/ba46fa2442e78f49837b836a7fb94c6c.png)
![[Diagram]](../../diagrams/22/3b41457c63ee7187e42696197328ecbb.png)
![[Diagram]](../../diagrams/39/089383007bcd0bcc7dc60f8f15b72462.png)
![[Diagram]](../../diagrams/33/105dc13c8ec3cea1e36601236213f62b.png)
![[Diagram]](../../diagrams/4/9c01c633e838a943bb37f15c4141cbe2.png)
![[Diagram]](../../diagrams/0/aca7d463b1ec5db33d371df7e3c9ba54.png)
![[Diagram]](../../diagrams/9/89020111f2c3f772178bf888b248941b.png)
![[Diagram]](../../diagrams/52/eccdea8cd1bc607c9eeea5fa0ff1b38c.png)
![[Diagram]](../../diagrams/37/3c19692c0e774d92d30dbbfa70cf3233.png)
![[Diagram]](../../diagrams/33/7d3298b43702f3d9fd155c5666069168.png)
![[Diagram]](../../diagrams/36/c87a95e771ae1386a49219eb8df17349.png)
![[Diagram]](../../diagrams/31/d571d165631735f1ab7db7d702cbf9e2.png)
![[Diagram]](../../diagrams/39/71ed516623c2c5a0b14e854bbe4321ab.png)
![[Diagram]](../../diagrams/21/82179bbf2578f3553115abdaf32e1b4e.png)
![[Diagram]](../../diagrams/30/9b4fb44dd9718b318d1ef167fb7930bf.png)
![[Diagram]](../../diagrams/46/a62900cd83673ea77cb971f4b7724944.png)
![[Diagram]](../../diagrams/16/2a10a31561ce3af26c49a849ea8b32fa.png)
![[Diagram]](../../diagrams/51/12c6343aaf30ac236dca5a3beb0c6b16.png)
![[Diagram]](../../diagrams/34/726a580a1d56c90b71cbfa37b32d934b.png)
![[Diagram]](../../diagrams/50/6faccd3ed104beb759818b8adaed82f8.png)
![[Diagram]](../../diagrams/30/cb3d452216b78736f8298c0a62da9bf1.png)
![[Diagram]](../../diagrams/52/66de228025eca1b2df40ab0794128cd4.png)
![[Diagram]](../../diagrams/44/cf0eb1c7f6020935ca552b03ffc89db1.png)
![[Diagram]](../../diagrams/5/6b30596a3880552adfd6ab9d9bd14cad.png)
![[Diagram]](../../diagrams/44/9af75649fa053c31ac90750f1eeb0963.png)
![[Diagram]](../../diagrams/49/1c938bd26a37bf9817c0f8aa371cc749.png)
![[Diagram]](../../diagrams/15/537a3daeff729112a1bd816cd1185fe9.png)
![[Diagram]](../../diagrams/10/82db15b9f71b419b8f3b0e90ffbf111f.png)
![[Diagram]](../../diagrams/2/deb3ba522d219a29dc50835b96038cbd.png)
![[Diagram]](../../diagrams/33/17493b052cadfe6e53c60d6c7f1fe061.png)
![[Diagram]](../../diagrams/6/721ac9db40cf40cb33644609177892d3.png)
![[Diagram]](../../diagrams/44/b5878f9e3f173c6a3b4a46fd295942fd.png)
![[Diagram]](../../diagrams/49/7fa61348e56575fe94dade689e0244a5.png)
![[Diagram]](../../diagrams/48/7b333954e876ebeb708f10feb9128219.png)
![[Diagram]](../../diagrams/48/03b3ca34eba7b9afbe9fa45672c58dd9.png)
![[Diagram]](../../diagrams/47/0897083317e794b0ac87c00357c54684.png)
![[Diagram]](../../diagrams/9/768cc2c439357f286dde1c20ef19f8ba.png)
![[Diagram]](../../diagrams/13/8468284dfd7097ea5abce928140cd0fe.png)
![[Diagram]](../../diagrams/26/9430716aa85608aa0a26ccf47bb8b697.png)
![[Diagram]](../../diagrams/52/f6cb43c6b70f4b01cef771f1a1e55669.png)
![[Diagram]](../../diagrams/22/fbdc058ee8955b9c79dd2efe899e590d.png)
![[Diagram]](../../diagrams/5/cb117e230cdf4fcf5c357aaa65b6a973.png)
![[Diagram]](../../diagrams/52/93af7c4998b2dbe19ab8d609493ace61.png)
![[Diagram]](../../diagrams/24/d6e6aa82600b30ac84211b1e08b6b0d5.png)
![[Diagram]](../../diagrams/38/13dcde93e52280566912da9d8b73f38f.png)
![[Diagram]](../../diagrams/14/20751d84a5bc51d0b280fa48ab620e0f.png)
![[Diagram]](../../diagrams/0/35788886a8f2133cef024d0b9a83166f.png)
![[Diagram]](../../diagrams/17/864bfc247ffe687c41630d3fe75a52a6.png)
![[Diagram]](../../diagrams/39/8fca2dcd27b4449d6ab46bc90eea2576.png)
![[Diagram]](../../diagrams/6/4633f1f531c7e898cdb2096fdba62a10.png)
![[Diagram]](../../diagrams/33/277e015fec344fee2731b99550c2d3f8.png)
![[Diagram]](../../diagrams/40/2e45fad6e177fce6eb43569c7f758d72.png)
![[Diagram]](../../diagrams/32/e2d5936835a2f7ef93c678224df267fa.png)
![[Diagram]](../../diagrams/51/183cc837ab6dc2676b4918b0390d2179.png)
![[Diagram]](../../diagrams/24/bc48072418d89dfcb1303bd0277ff821.png)
![[Diagram]](../../diagrams/2/54ee45c1015458dc667df1d6bc859c52.png)
![[Diagram]](../../diagrams/49/436323eacb0ef35ed64e1660ecb6afc8.png)
![[Diagram]](../../diagrams/14/5f89be73ca32713dc490dd8457061cbe.png)
![[Diagram]](../../diagrams/24/d887a2fc52d52c109f5ac20468c7f583.png)
![[Diagram]](../../diagrams/38/06bc37818d06a0414f291775fc3760b0.png)
![[Diagram]](../../diagrams/34/a9613dd660b487e55ffcab74fea4fec8.png)
![[Diagram]](../../diagrams/43/7e7a20febb206380b813038986610f88.png)
![[Diagram]](../../diagrams/51/29474f992fc47888d47192ffbe6ac850.png)
![[Diagram]](../../diagrams/6/57be74ff6c519ec98afa2dd7837b3b97.png)
![[Diagram]](../../diagrams/45/02b5d380d54ce60a347cb061db7221e8.png)
![[Diagram]](../../diagrams/12/8d597709d5cc3d1b0920a568cea27800.png)
![[Diagram]](../../diagrams/14/9448d9b46a58a46a3551bb368f0bfe77.png)
![[Diagram]](../../diagrams/18/e9c3b10a4e0e59ffd47d1a5ed1b090b8.png)
![[Diagram]](../../diagrams/49/08a78df49b2d43e3e1722c3515919f1e.png)
![[Diagram]](../../diagrams/29/016e1d9d177f7af92e184c2d1deb3d95.png)
![[Diagram]](../../diagrams/45/7ac01fa2aa2995cec4aa1b7f40ce609a.png)
![[Diagram]](../../diagrams/43/0045bb1217e7dab655351d9228b66979.png)
![[Diagram]](../../diagrams/11/dc5a2e948d6fe23a352b7756c3bfef1e.png)
![[Diagram]](../../diagrams/38/490431f6364d874b1aa73c9b1aa9e3aa.png)
![[Diagram]](../../diagrams/9/1638b2ef81c0c17b64badddcbfbb6a48.png)
![[Diagram]](../../diagrams/32/fb77cf9276bdf1ca635ca8b50e82f38e.png)
![[Diagram]](../../diagrams/34/964687e6deac33ca891ee7e6f326e228.png)
![[Diagram]](../../diagrams/39/5cb3f08c89130ca531c124b484b7dfb2.png)
![[Diagram]](../../diagrams/29/e6b31b5e6506fdbe3279a437396c10e2.png)
![[Diagram]](../../diagrams/51/19b696f79e98933dff532caffc5523f6.png)
![[Diagram]](../../diagrams/40/ddb46bb6cf2b77b9635b1ab76b3a3794.png)
![[Diagram]](../../diagrams/2/eaf8b550211ff4fee663821b6dc7589e.png)

![[Diagram]](../../diagrams/33/49128e5439db4701c03cbaf69ff251f4.png)
![[Diagram]](../../diagrams/29/754fd5e23ee10545e98f2ae1fae70853.png)
![[Diagram]](../../diagrams/40/5b4c7c0ea906c7081c6fdce228c172c9.png)
![[Diagram]](../../diagrams/32/d07c170daef0fcfe1a05094199d4c00b.png)
![[Diagram]](../../diagrams/49/898f883c2fb5ef31555706e9a20a51dc.png)
![[Diagram]](../../diagrams/46/bc1da3d500cef050497b975b4604ca34.png)
![[Diagram]](../../diagrams/8/bfaeffdbd6b2f5fd11c3137f58e230b7.png)
![[Diagram]](../../diagrams/46/e83f281fe0a85b6af859652838844601.png)
![[Diagram]](../../diagrams/31/92adfcacb95d3d30cb36d43f4f455826.png)
![[Diagram]](../../diagrams/14/0c2c80ade5fc8f636616e65094e6474b.png)
![[Diagram]](../../diagrams/9/a608e65ed733eb751889a6f7b3fd0d4d.png)
![[Diagram]](../../diagrams/14/352cc5dab83f256232d4f6d5d26c1311.png)
![[Diagram]](../../diagrams/17/7637cd7447b176c2f03e3b7df1592233.png)
![[Diagram]](../../diagrams/35/005869d2df61688efc2e6a83018e7a09.png)
![[Diagram]](../../diagrams/25/45650d473275f2d8bcca656eb55728ed.png)
![[Diagram]](../../diagrams/11/334b675e9bcc573b77fdf2e8d51b16c0.png)
![[Diagram]](../../diagrams/44/11d8df4347d1d798648a8ac65d1488e9.png)
![[Diagram]](../../diagrams/21/96df3ee82257994521815616a9410396.png)
![[Diagram]](../../diagrams/6/94fb12788fc7a2e2803626fc28d43ca7.png)
![[Diagram]](../../diagrams/22/6adccd598960e37212e01adcc5942041.png)
![[Diagram]](../../diagrams/31/cd7b79e60229f0331c942b31a4fedb87.png)
![[Diagram]](../../diagrams/11/c6d737c59707885e625773979d45f043.png)
![[Diagram]](../../diagrams/1/aa57d62644c008f3ffff70e4fd1e8a4c.png)
![[Diagram]](../../diagrams/25/a43d5c5959c494d4f2baf49b7af5031d.png)
![[Diagram]](../../diagrams/51/762d8365cdb3089373e3d05c684ec5a8.png)
![[Diagram]](../../diagrams/38/46e3a8b4d6cf4885d57f391baa8d3de5.png)
![[Diagram]](../../diagrams/8/0e02d859fb376030d0eea9b7e3ed2a8a.png)
![[Diagram]](../../diagrams/52/1afc891801b89fc74c7536b2a39e62b4.png)
![[Diagram]](../../diagrams/23/2553de9247dd638163466347d6ec9ae9.png)
![[Diagram]](../../diagrams/38/f72eb3ddef3fd225e824ddd4d8fb82ee.png)
![[Diagram]](../../diagrams/46/fc5f83889004aa9ef2b3b8fc28527b84.png)
![[Diagram]](../../diagrams/39/02a2002ab06ab96e8deafcf1b71ec59c.png)
![[Diagram]](../../diagrams/2/82ce9b9e1a6df173fa33bb5be8bcfa55.png)
![[Diagram]](../../diagrams/40/6f2c98c89b5f6bd829380d26ac16f570.png)
![[Diagram]](../../diagrams/12/aa37ceaf432d04a2b2c41386cb91f2e5.png)
![[Diagram]](../../diagrams/43/7a795a5bab83d8ecb05dbc859f7b695d.png)
![[Diagram]](../../diagrams/8/15f11b20f4a864ef2da65f1458b2c220.png)
![[Diagram]](../../diagrams/47/955843988cacc2d1de003f3050a51cfd.png)
![[Diagram]](../../diagrams/34/dbfb9c696f7d4d0132df045386f04b03.png)
![[Diagram]](../../diagrams/52/de9d13977caf0d80821fe92d51dc40c3.png)
![[Diagram]](../../diagrams/41/1770bd111d4739dea5dc06029bdd860a.png)
![[Diagram]](../../diagrams/43/8d9345c7701031ce46c299d5ebe4fcd6.png)
![[Diagram]](../../diagrams/22/60d77e3097ed1600d1870a2b5296ffc8.png)
![[Diagram]](../../diagrams/11/26c93e43f4aedb85bd93dca6a9b42a7c.png)
![[Diagram]](../../diagrams/19/050c052bb58e9522e2e76c9017508bbd.png)
![[Diagram]](../../diagrams/43/9e14489c91de32e08057fe3fac2ab4f6.png)
![[Diagram]](../../diagrams/5/0a8b8da218e6243ad06d2097171dc0c3.png)
![[Diagram]](../../diagrams/38/cb6b1ebbd258fad2f845927672f1b7f6.png)
![[Diagram]](../../diagrams/4/a31180a2914f5773f0f951aa0802600b.png)
![[Diagram]](../../diagrams/44/8aa38e68b417d2819ab8f3ddd51fba19.png)
![[Diagram]](../../diagrams/14/6e21644514700757819519f6da577159.png)
![[Diagram]](../../diagrams/9/feea0f12c04c8c80b84aa64d5c94b5f5.png)
![[Diagram]](../../diagrams/11/fb72ff56521fdbd6913d866a47b502a2.png)
![[Diagram]](../../diagrams/10/febe25ac2a756d48ea474dff481f7ffb.png)
![[Diagram]](../../diagrams/49/81233d56c76bb7da431db7e85703ff54.png)
![[Diagram]](../../diagrams/41/0dffcf943efa06e1c490d94270836055.png)
![[Diagram]](../../diagrams/19/b21c2f3ba865bacaeb2ae952651e5d8d.png)
![[Diagram]](../../diagrams/23/dc8c983853a97eb3ff5ca94c36999a8f.png)
![[Diagram]](../../diagrams/8/600e011aefde65a845d1ac63b464596e.png)
![[Diagram]](../../diagrams/16/aec08383769b313443b12fdf7fe06865.png)
![[Diagram]](../../diagrams/21/84e09bad60eabcc94fb8c859f53b5f87.png)
![[Diagram]](../../diagrams/25/fef2ebf5a667b4c9225d5de2ed9686c8.png)
![[Diagram]](../../diagrams/52/a18a3d027e8149db11515696caed1b98.png)
![[Diagram]](../../diagrams/21/5bf973281eb05a8f55f94d65d6d90406.png)
![[Diagram]](../../diagrams/35/02282633cd6bc9668f1ce4d866f2843d.png)
![[Diagram]](../../diagrams/37/6aff2a47a61eab1f69a35fcd4e59c226.png)
![[Diagram]](../../diagrams/29/526240ad58bf14e4d9af5cd70d7f601f.png)
![[Diagram]](../../diagrams/34/bb0ec624ed66d50f6f6b910a8f38652d.png)
![[Diagram]](../../diagrams/14/aee0b033d520ec7c1f562ef0a3164c5a.png)
![[Diagram]](../../diagrams/3/b2543711b03fe915f6b7e44e04db51e8.png)
![[Diagram]](../../diagrams/14/e89ca5d57313cb385964006b79b105ed.png)
![[Diagram]](../../diagrams/42/92e8f8f44d5fbef9a3f78442816f3922.png)
![[Diagram]](../../diagrams/22/e2503cf0bc7524552fd240346340e65b.png)
![[Diagram]](../../diagrams/7/9ba650cad71608bdbad4d5cf2fa02cf1.png)
![[Diagram]](../../diagrams/29/23aabc01ef29be3be40493ce16ce97df.png)
![[Diagram]](../../diagrams/9/87ff4046ae908dfeec02ba6b2dec6e03.png)
![[Diagram]](../../diagrams/15/83a44a44b1613130e73c8eeabc2d3f8f.png)
![[Diagram]](../../diagrams/39/f7e6c22702963c038bd478e62fce326c.png)
![[Diagram]](../../diagrams/23/2438dfc5a1474c2a55baee25e3ccd9e1.png)
![[Diagram]](../../diagrams/36/06fa65318ccd0e90c1418870f648e950.png)
![[Diagram]](../../diagrams/50/efdc29a9949a73b582e91056df597ca2.png)
![[Diagram]](../../diagrams/31/a18c0f55a64401ccc50b9e441f30006e.png)
![[Diagram]](../../diagrams/25/773cc8b9308aa794dc0246a85df15858.png)
![[Diagram]](../../diagrams/23/c090aa70b4ca085de3f8cdc9a7dd7bab.png)
![[Diagram]](../../diagrams/29/e44530e1d39c1dcec8396a698d1caa9a.png)
![[Diagram]](../../diagrams/36/a3a84b0ec03736d177ddbbd054b36b03.png)
![[Diagram]](../../diagrams/31/ac902a5a2a6c6b473c065bc44006a67f.png)
![[Diagram]](../../diagrams/34/698b492b7d6dfb4967cd04f6123702f5.png)
![[Diagram]](../../diagrams/0/f8b7f9fa4a05ed74650c4718619c3acb.png)
![[Diagram]](../../diagrams/33/a04435afd81092eea48cae8c4ab515af.png)
![[Diagram]](../../diagrams/1/ebff9dbb52d2e16a33e7ccfd86ca4fce.png)
![[Diagram]](../../diagrams/1/8c0ad7f6954428896b546c6212d2dc41.png)
![[Diagram]](../../diagrams/8/fde21bf711b951ee321583737bb843f8.png)
![[Diagram]](../../diagrams/21/9fd1c058e848f5454092a79e024f0089.png)
![[Diagram]](../../diagrams/30/9881d8ba957d167f601210417d75a62e.png)
![[Diagram]](../../diagrams/4/29fbcfb38e179d66c4d638e5cbe4c725.png)
![[Diagram]](../../diagrams/5/6b912b7dcc87ac0d58944e1285ae984d.png)
![[Diagram]](../../diagrams/30/30047af4f159f3d13596d7a5a5139503.png)
![[Diagram]](../../diagrams/47/b1bdfb257b96a92a41406a0a158d1785.png)
![[Diagram]](../../diagrams/46/d38bba8598b9de2fc525829e2b7afe4a.png)
![[Diagram]](../../diagrams/49/56db8a3163d115671272487488fb120e.png)

![[Diagram]](../../diagrams/19/b35616b92060503f6f16835d2b7b46aa.png)
![[Diagram]](../../diagrams/15/c3b6c6098337e7f3481b87211ae1a42f.png)
![[Diagram]](../../diagrams/44/574cb1dee01213f6f8f304f26094e3a2.png)
![[Diagram]](../../diagrams/26/5ee2266189cdf4f1d18fd945394575ac.png)
![[Diagram]](../../diagrams/37/d75f7ffbfa2c2973c088aaec6cb9abdf.png)
![[Diagram]](../../diagrams/18/efe10eaa6d24259eaca0a991def4d68c.png)
![[Diagram]](../../diagrams/3/7d5ddae139453ed7e1e2ad4a023fe4d7.png)
![[Diagram]](../../diagrams/50/d2e8ec6609c7efbf6e49cea67d46b202.png)
![[Diagram]](../../diagrams/27/297a94c4db21d8516c51e909a6829001.png)
![[Diagram]](../../diagrams/24/534875550252cbf13fee39188dc07fe9.png)
![[Diagram]](../../diagrams/34/1c3166670893ae9538d441e336c3509c.png)
![[Diagram]](../../diagrams/16/b326b9bf17cc285afda1add38564722c.png)
![[Diagram]](../../diagrams/1/9fac860151a9a809ea84c07221260c23.png)
![[Diagram]](../../diagrams/15/e537c7e37adaed9025bf3a750f9e4c5f.png)
![[Diagram]](../../diagrams/33/f3ed2aeccc1c357b8ae3e3b59b529ba6.png)
![[Diagram]](../../diagrams/13/250142ce799a461dd0e64cea2dcc6f84.png)
![[Diagram]](../../diagrams/37/0ab52c93d76f159ab26b5db174e27744.png)
![[Diagram]](../../diagrams/36/627ea7c3a02012c0f11eeb34f048dd61.png)
![[Diagram]](../../diagrams/7/6019712bee2ef487be6336acaac6b485.png)

![[Diagram]](../../diagrams/50/23a3079455ac53d08907a8367602df3f.png)

![[Diagram]](../../diagrams/35/078f7e9c4a84f553904695f00beffa92.png)


![[Diagram]](../../diagrams/3/6d8943948ea78b437f96df22a6246c43.png)
![[Diagram]](../../diagrams/10/13a12be0e363bf35acb7b492b5ea7d72.png)
![[Diagram]](../../diagrams/44/398a59c71fbcecbac37ba256da352ee1.png)
![[Diagram]](../../diagrams/42/3c52d5bec5cde9b747eaf7675745f2bd.png)
![[Diagram]](../../diagrams/47/9b792fa7bf192d97d286b2e543e7c391.png)
![[Diagram]](../../diagrams/47/31975c70011ed156fd6996e0daad7484.png)
![[Diagram]](../../diagrams/42/84ce0e2c677bfadca1f9e8a31d101320.png)
![[Diagram]](../../diagrams/49/2f4364ff29f61f546f622fc4e168d4d2.png)
![[Diagram]](../../diagrams/48/d0e3e6751e02cbd5ab6d4224ebdae4cf.png)
![[Diagram]](../../diagrams/44/07544de3384e082dd7007ead5b540c5f.png)
![[Diagram]](../../diagrams/27/b77df799185e55e6580c973648d44f3d.png)
![[Diagram]](../../diagrams/43/214154e999c13cbe7cd965c27926f27e.png)
![[Diagram]](../../diagrams/33/0cca0e0f567b258e9e463c9b254d1433.png)
![[Diagram]](../../diagrams/46/de69755c11dacccff924b7b0bd58464a.png)
![[Diagram]](../../diagrams/34/133cc01a587c717ed331e1654d4b738c.png)
![[Diagram]](../../diagrams/34/86ca45eaf3bbe83990be76aa2834bdab.png)
![[Diagram]](../../diagrams/17/10f9ac9f29f0dcbcab544d09bc0d4302.png)
![[Diagram]](../../diagrams/51/49f50c16403aa874e67322a3a7b1fc4e.png)
![[Diagram]](../../diagrams/39/caaf11e06265e42be69e55bcd214ee3c.png)
![[Diagram]](../../diagrams/41/1024f07d3f39bddb4c7b90950420a9cb.png)
![[Diagram]](../../diagrams/45/6dd2608914909715dd321414e27d8f81.png)
![[Diagram]](../../diagrams/10/b4f7cf3f92ab96f722d748ffaca6c5ce.png)
![[Diagram]](../../diagrams/13/6c016899e6fb97e42620178631fa0c08.png)
![[Diagram]](../../diagrams/28/005afd4e3019966f3ba0ffbedb7d5f0b.png)
![[Diagram]](../../diagrams/33/a621ceb5e7a4a50255c019f67fd01081.png)
![[Diagram]](../../diagrams/18/6e8f36aee690fce3099c512faa9debf5.png)
![[Diagram]](../../diagrams/2/0afda3671f5e80bf9a697779abd8a31e.png)
![[Diagram]](../../diagrams/2/b22c4b352f6d91d6dfea7c88f7d27f8a.png)
![[Diagram]](../../diagrams/28/a30a4a95d64cd8eed36ad03c09cb2368.png)
![[Diagram]](../../diagrams/38/3a1d8855035b069f55b433636eef87bd.png)
![[Diagram]](../../diagrams/7/21a218d8953d4c62c6f9c4b4be822626.png)
![[Diagram]](../../diagrams/19/b6a24bf8b8f553b285869160f7e31637.png)
![[Diagram]](../../diagrams/22/6de7d1245f7dfe040dee723397385935.png)
![[Diagram]](../../diagrams/33/370fdbfc798ecfa98fd342f2b8cad38c.png)
![[Diagram]](../../diagrams/32/d6c36374f58b9079251f87d1ed65de98.png)
![[Diagram]](../../diagrams/28/e9510c038857fcce0b46220277eb7674.png)
![[Diagram]](../../diagrams/34/d2ad88f660c03104fe9c3feeeb05a44f.png)
![[Diagram]](../../diagrams/7/3673122f80eba29073196bb96e667fab.png)
![[Diagram]](../../diagrams/0/bdf9f0e7cd745559d9453cf09ce86a52.png)
![[Diagram]](../../diagrams/28/7c47c9d4a577faf4b703ff688bd17115.png)
![[Diagram]](../../diagrams/2/758b80241ed678611d3c34c4cbec9b2d.png)
![[Diagram]](../../diagrams/12/640ce8a627fff8b82ae25861ab6e6261.png)
![[Diagram]](../../diagrams/18/33a963c4475c5bc4bb37a50873ee7e9c.png)
![[Diagram]](../../diagrams/50/23b38972ff980f590e5c1722985c184d.png)
![[Diagram]](../../diagrams/27/35924d811bda1aacbb132e32db8cbe83.png)
![[Diagram]](../../diagrams/35/429a40a299082c94c7f8b1f130ed840d.png)
![[Diagram]](../../diagrams/33/e7b751938bae85e89ecd0cbc3b0db01b.png)
![[Diagram]](../../diagrams/50/b8088b01089eeeb01402178c43d53e2a.png)
![[Diagram]](../../diagrams/50/8d424ad6d442408c4291f132ef6f6bfd.png)
![[Diagram]](../../diagrams/51/4fba7d66f32d8020d6ce07e95ae806e3.png)
![[Diagram]](../../diagrams/40/2fc2e4932d9c8b5945adb1aa57958dad.png)
![[Diagram]](../../diagrams/0/40a0e7a1ff35b7257e410054863df988.png)
![[Diagram]](../../diagrams/32/58d2e43538e07475937ad6c0ed8a4c35.png)
![[Diagram]](../../diagrams/25/ba47f4d7e035455f20c5e03ea7fb8b26.png)
![[Diagram]](../../diagrams/26/a308ff6c2f7fb7ff314125d51dd953df.png)
![[Diagram]](../../diagrams/34/530432ca688aa34dead98d9518ef209c.png)
![[Diagram]](../../diagrams/22/843a9c7f36f8b4bdd5a2e495286311aa.png)
![[Diagram]](../../diagrams/46/d7bfa9c975290d09d326825564fc7805.png)
![[Diagram]](../../diagrams/44/ba2ad28581edc85eea011122f7914ea1.png)
![[Diagram]](../../diagrams/47/8890b4c568d8d66dcae4a2e3812ad94f.png)
![[Diagram]](../../diagrams/6/bb5e2fb1d71842c642dfa59993e32b5a.png)
![[Diagram]](../../diagrams/8/ecddad3e3aeb4231a607d28c57b027eb.png)
![[Diagram]](../../diagrams/21/ed4f8366c6a5f38c64499f944a054a2b.png)
![[Diagram]](../../diagrams/23/3f25e9066ec29b22b76b618a3ab3f604.png)
![[Diagram]](../../diagrams/25/ace582c7df43a89cc05d1f4c42412d14.png)
![[Diagram]](../../diagrams/29/7de015afe4d3cb26362c00d267e8d572.png)
![[Diagram]](../../diagrams/24/d2d16bb2b9891bbb0254babf81184dbf.png)
![[Diagram]](../../diagrams/19/4ba69050785b4662ac3ac25a41fbb0a9.png)
![[Diagram]](../../diagrams/34/623de79d77454cc858de7718d92a1314.png)
![[Diagram]](../../diagrams/50/544d350dc1b258b8fda25170f15ce946.png)
![[Diagram]](../../diagrams/20/d8a44601719d0eae8a40f25c65d242df.png)
![[Diagram]](../../diagrams/3/ad1e966987c2b1c6e78dd9a43946af4e.png)
![[Diagram]](../../diagrams/11/535ec033bed02802678091f60efe50fb.png)
![[Diagram]](../../diagrams/15/61cf8a53d69763b0546142f57e580578.png)
![[Diagram]](../../diagrams/39/47ba414d72fd1653ba1c7544cfd7b4af.png)
![[Diagram]](../../diagrams/35/841d474eef66a42bc25e824dd7201d7b.png)
![[Diagram]](../../diagrams/48/c8ea98481e3aee94c38904f15ca9ef06.png)
![[Diagram]](../../diagrams/40/0db8e0f7aabfb34187f1b0d83601ad06.png)
![[Diagram]](../../diagrams/31/3cac3bd73dfb865382e4cb3f285aecc2.png)
![[Diagram]](../../diagrams/22/3acb1e954f13c7aa5c2d7b1ab8246739.png)
![[Diagram]](../../diagrams/19/f12d5deb122f4cf40302c5fcf0ada5cf.png)
![[Diagram]](../../diagrams/19/ecebbb227d472d8bae212a2d2165d969.png)
![[Diagram]](../../diagrams/20/c971035e92ed699787128393bc86e08f.png)
![[Diagram]](../../diagrams/21/5139323d8dbfb2177f1382ebd755a0f0.png)
![[Diagram]](../../diagrams/19/3fb236e120a5d120774b3ecdc3181c3d.png)
![[Diagram]](../../diagrams/2/63c8da344137e6500fbc85ad12bb722f.png)
![[Diagram]](../../diagrams/4/5053ebd3fba4ddf17ccd7b12935bdd0c.png)
![[Diagram]](../../diagrams/52/c501f77c1b2663015e5de654e1f65d41.png)
![[Diagram]](../../diagrams/20/11b19dc9dd7e2ba35d1b02e83d585ab5.png)
![[Diagram]](../../diagrams/12/de09693e30c88f4c9608fd9c28e31087.png)
![[Diagram]](../../diagrams/24/4c2aaca29aabe2256e34d34e305d5e4a.png)
![[Diagram]](../../diagrams/41/a5a67cb6f747a944cee7762b92d8c214.png)
![[Diagram]](../../diagrams/18/daca45562536f36a614530c24562194a.png)
![[Diagram]](../../diagrams/35/0a1d779156d3151816881ac35e0bf4b9.png)
![[Diagram]](../../diagrams/0/f96c383d96257a0ad82bd7075b6962a6.png)
![[Diagram]](../../diagrams/15/80b89c03f75dd5bab516433ac84c1105.png)
![[Diagram]](../../diagrams/26/66e71f2f4b34bd3264bd78799da76b9e.png)
![[Diagram]](../../diagrams/11/9c813086767d3077c9070d8be29a4cef.png)
![[Diagram]](../../diagrams/31/63cd7e3aecc4fe48758cf0323f9c21dd.png)
![[Diagram]](../../diagrams/50/91016275f026f5a36072f4c3a6ffc7ce.png)
![[Diagram]](../../diagrams/34/f233d4dfdbc8e64a36ffaae26eded9de.png)
![[Diagram]](../../diagrams/10/7a69e72d574691a2ee2e4c2144fa1cef.png)
![[Diagram]](../../diagrams/16/4676890defd4bef054c8ca93eb5f595f.png)
![[Diagram]](../../diagrams/3/cd858eced7679e4d7aa3a0baf8d863ce.png)
![[Diagram]](../../diagrams/40/aa26259cc754b7ff8d139df32bd9adc4.png)
![[Diagram]](../../diagrams/32/61c3a5b069d3cd1fade4c269ee488bd9.png)
![[Diagram]](../../diagrams/42/1abadece59622a223ccd4be76e3a4260.png)
![[Diagram]](../../diagrams/43/91f4add28060e6aeac2f6d2638c52c98.png)
![[Diagram]](../../diagrams/9/cb65cf2e13e5b145eaf948cdf5107fca.png)
![[Diagram]](../../diagrams/6/dbfd15be2dfeadd790603b11cd550424.png)
![[Diagram]](../../diagrams/52/31844de893d9e8a08cf77b9291ebe338.png)
![[Diagram]](../../diagrams/7/e6884a1d15c439d6700818eb93a2c8b9.png)
![[Diagram]](../../diagrams/16/5e3e12f52a7853f1b2d6179081940f49.png)
![[Diagram]](../../diagrams/39/1ed46501b412872f2fe8a51d478ab744.png)
![[Diagram]](../../diagrams/29/371a26653833aa5504afd45e9c6863f2.png)
![[Diagram]](../../diagrams/48/fbbce4e1801c1cd843bd8d754db4a46c.png)
![[Diagram]](../../diagrams/32/38613592aec7dcaf563bb014454e6c42.png)
![[Diagram]](../../diagrams/4/0603757bbaf6c736b66ec53c67223f13.png)
![[Diagram]](../../diagrams/37/fce43f58f74086e732950ee97fbffed9.png)
![[Diagram]](../../diagrams/49/c6a38e8674168a1dda28605bf5354e41.png)
![[Diagram]](../../diagrams/34/b21fb3261ebc1f6d3b167aaa21e2e981.png)
![[Diagram]](../../diagrams/36/1c1c14c24615161a343e2fbe9e188b65.png)
![[Diagram]](../../diagrams/15/0cc5cb710b8cfa346bdcdc39b654dbf6.png)
![[Diagram]](../../diagrams/34/65fbaff8e3af013bf9d990a3a7399a1e.png)
![[Diagram]](../../diagrams/18/7381f24044702affd6b0945bb9832f35.png)
![[Diagram]](../../diagrams/31/f0ba5629bb47fc74a04376aa376a88d2.png)
![[Diagram]](../../diagrams/26/2d7479fb25bdd8957d1ef169b55a9993.png)
![[Diagram]](../../diagrams/9/aa807f1a81940a9ecc9af58377c1f85e.png)
![[Diagram]](../../diagrams/16/0e8840c2d76fdb960ef4536fa1269b94.png)
![[Diagram]](../../diagrams/3/a9af5760978109b281589bc98ca067c7.png)
![[Diagram]](../../diagrams/5/9ef4f6ac8cb3aa8d466f1898fa85a4e1.png)
![[Diagram]](../../diagrams/49/cc54270720cf7f490be770c034ff9875.png)
![[Diagram]](../../diagrams/21/10f74bd4c26fa7b94121dde8450306c1.png)
![[Diagram]](../../diagrams/13/e4be9fec1d367476e5fc05cdd9034c29.png)
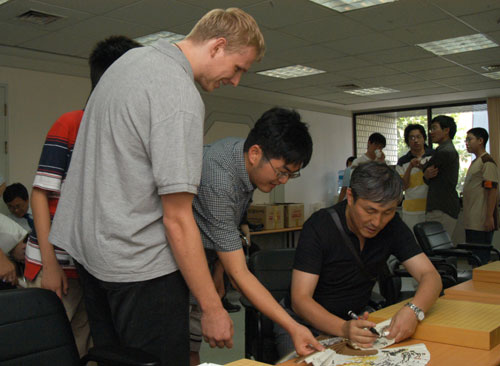
![[Diagram]](../../diagrams/46/f18807244a6481f0c043d1377667f9ee.png)
![[Diagram]](../../diagrams/26/3a78c4a24c7afb745ed72a9de919024b.png)
![[Diagram]](../../diagrams/18/861cc0118d134fd1c88da382ba121c25.png)
![[Diagram]](../../diagrams/20/c880eb8bd3177fb1b40e5715b4e90353.png)
![[Diagram]](../../diagrams/34/2e4392e070a71baf611dc5e0439d4afc.png)
![[Diagram]](../../diagrams/2/7f5993d813a0f382be010e1736d0f81d.png)
![[Diagram]](../../diagrams/31/6b6a2e4898a28b8566dfde6658e58fb4.png)
![[Diagram]](../../diagrams/38/9f9840e372548e38856e7b455aa36e64.png)
![[Diagram]](../../diagrams/11/e79bd0699b18645c682e4c7fef38309f.png)
![[Diagram]](../../diagrams/50/5b78247ed4972d4fa601a25e49f7f06b.png)
![[Diagram]](../../diagrams/24/a8f425fa289523034e840e6f870ee555.png)
![[Diagram]](../../diagrams/4/b96833446789a8a3f58a80643e753bd4.png)
![[Diagram]](../../diagrams/38/9d5f0e627f43a237b928afb76924f0e0.png)
![[Diagram]](../../diagrams/1/c1f5057970cebe5e0a2e6758d41f21c9.png)
![[Diagram]](../../diagrams/14/f96bd65a39c09320df2a249b15acbb3b.png)
![[Diagram]](../../diagrams/5/e3d5d8b9ec622f5ba7858488a4fa8ccc.png)
![[Diagram]](../../diagrams/2/e471c759b638de957e5787155257e6d9.png)
![[Diagram]](../../diagrams/4/7dd35d82c711994318a810e369c91f0b.png)
![[Diagram]](../../diagrams/24/1c8609170dfec31b65b6136acc8adec1.png)
![[Diagram]](../../diagrams/37/84079e05d4022702d842c9b20e8dfc71.png)
![[Diagram]](../../diagrams/5/011e0122514970ad8fb80fdbc644dadf.png)
![[Diagram]](../../diagrams/7/394ddddbe3880834d9e387b8d64b925c.png)
![[Diagram]](../../diagrams/30/c1a52d74c6b03d7a857329b00f3ac786.png)
![[Diagram]](../../diagrams/5/5565512324ceca6a54d2ff7498854a4a.png)
![[Diagram]](../../diagrams/27/dd6e64a7e8171861e0df5f148f77bd56.png)
![[Diagram]](../../diagrams/28/5296bd13d06b8521cf8baacd659fa476.png)
![[Diagram]](../../diagrams/6/204b188eadd70d98da49b660f533902a.png)
![[Diagram]](../../diagrams/42/d8dd9b2c68a7386e8858e63507d1cf63.png)
![[Diagram]](../../diagrams/40/cde5083b76374ac8c2e4d5dba76993bb.png)
![[Diagram]](../../diagrams/13/2918ee71fd08b7441eea773ea43b7730.png)
![[Diagram]](../../diagrams/46/ba41386ee84848187729bbdcd8db1b52.png)
![[Diagram]](../../diagrams/27/8b340e0ef79fd80e6d16a7ba1718ad91.png)
![[Diagram]](../../diagrams/29/593e5328830e4c70a3fdc38cf984879f.png)
![[Diagram]](../../diagrams/36/e827d949981190659d90f4faf0c5fc7a.png)
![[Diagram]](../../diagrams/14/48ced094a4fd71d19c0c0ac4bddc7d27.png)
![[Diagram]](../../diagrams/39/4abb779c13173f0e124413cb0f6d51c4.png)
![[Diagram]](../../diagrams/49/73f4ad17b180b972197e55d2a5ea904c.png)
![[Diagram]](../../diagrams/1/becdded46d9c6e7cc63367ac246472ac.png)
![[Diagram]](../../diagrams/35/4dc974d7e9eedd1cf92eadbf062d7d34.png)
![[Diagram]](../../diagrams/9/33ed42398d73415b910030df338aadb0.png)
![[Diagram]](../../diagrams/23/a3e7cc67a63dfb8602840f812da401c7.png)
![[Diagram]](../../diagrams/36/0b11bb002f1ab3414015cce75f800be2.png)
![[Diagram]](../../diagrams/47/ab7448ad0bc646071d674120a960f15a.png)
![[Diagram]](../../diagrams/51/2c3f0912800dc225c92f76a8b94cf196.png)
![[Diagram]](../../diagrams/37/05445f7027f76ddf892e2546246ff383.png)
![[Diagram]](../../diagrams/21/0b5a800e05dc6df1f2eb4c8476169212.png)
![[Diagram]](../../diagrams/20/07e5d59b70e2c9b0481c4f06bd893e93.png)
![[Diagram]](../../diagrams/6/4f83c4988de6626050e8241e3135dd4d.png)
![[Diagram]](../../diagrams/30/760640f1da689f9a91fba676700ddfe7.png)
![[Diagram]](../../diagrams/13/7b73837a463a6d558df2f49098edbc37.png)
![[Diagram]](../../diagrams/6/60569e6a98bf04b793f36566243be31e.png)
![[Diagram]](../../diagrams/5/189acdf66d3361730f14931c470fddd3.png)
![[Diagram]](../../diagrams/48/fb230c0a818ef10b6a8add5dc248040a.png)
![[Diagram]](../../diagrams/39/2d62be4651fbc0c34e64542361b085ac.png)
![[Diagram]](../../diagrams/36/62d8966217ee2a011cd56a610cf5eaa2.png)
![[Diagram]](../../diagrams/27/2102b133d50d51890c4b474d40a2d2e1.png)
![[Diagram]](../../diagrams/12/3b561899c7d2f1f6e5074847f57db12b.png)
![[Diagram]](../../diagrams/48/ed842d9c8b8e29ea7e6b98206853d48c.png)
![[Diagram]](../../diagrams/25/28f8ec51fe5a60b4c2eb2fcfe63c82d3.png)
![[Diagram]](../../diagrams/11/5ebbb61577691d8e80b1327834b40609.png)
![[Diagram]](../../diagrams/23/05882f402f32a08d97fb77ecae210804.png)
![[Diagram]](../../diagrams/33/1e4a90a2f8d4d8e0818080f54e434b41.png)
![[Diagram]](../../diagrams/6/47006deac04cd1fcfbe7d246dd27378e.png)
![[Diagram]](../../diagrams/33/17033c981afaf36d39379993f89bf8ce.png)
![[Diagram]](../../diagrams/11/0a099b0596fd10d9d502533d8f74bd3c.png)
![[Diagram]](../../diagrams/7/517775ea6f1a2da106d000c7bbda0597.png)
![[Diagram]](../../diagrams/5/7e5873793a9a56cc6d430fadee691458.png)
![[Diagram]](../../diagrams/31/487a9e767b2b7470717ff94e5e05f67d.png)
![[Diagram]](../../diagrams/34/49896d0bdb8ed1a4950a1b6476541671.png)
![[Diagram]](../../diagrams/23/8249dfce375b511a3e2022c67886a636.png)
![[Diagram]](../../diagrams/38/e18e2c1a384d2aec450ecd982dcb70f8.png)
![[Diagram]](../../diagrams/4/9caee7208e59cbcd4b5df2e84d8c7a01.png)
![[Diagram]](../../diagrams/49/f7922dcef5b9996f8ad55069f6fe4274.png)
![[Diagram]](../../diagrams/50/b21228ad464a6ebf4311386d36b3bfae.png)
![[Diagram]](../../diagrams/8/a4341683709d2e8c774b43639e2779a1.png)
![[Diagram]](../../diagrams/48/c8811bc7d3b02d7c36e5f353fb74cee9.png)
![[Diagram]](../../diagrams/15/770a512f25628b1a166c54aed5522aed.png)
![[Diagram]](../../diagrams/43/46d8c3260e01dd93e327fc0a4ba721fc.png)
![[Diagram]](../../diagrams/4/6de3fb3011e66ee540863a14077b5620.png)
![[Diagram]](../../diagrams/8/616cb3d577ce97d1cf2f8de0610a03a1.png)
![[Diagram]](../../diagrams/7/2c3bbb06f25807856185b7cec076bd4e.png)
![[Diagram]](../../diagrams/3/ebf55b81ac6cfeae575192f3369f71e8.png)
![[Diagram]](../../diagrams/38/4fcb2e95853265e870e5656bffab485d.png)
![[Diagram]](../../diagrams/35/09bb2cb6809c731fb495268bb64bd465.png)
![[Diagram]](../../diagrams/24/29686a0ecba63cee73753b52dba217d7.png)
![[Diagram]](../../diagrams/52/a9a61bb2c0c18dca5d298581b3605ab9.png)
![[Diagram]](../../diagrams/45/b27371f51703c27644002a3b0586eaf9.png)
![[Diagram]](../../diagrams/20/b53f6269567c0e2923f844840bb92520.png)
![[Diagram]](../../diagrams/45/dbe72fc54b2d76c69f5b8181cd132706.png)
![[Diagram]](../../diagrams/36/42082bfc593b4ce675344ba18a173147.png)
![[Diagram]](../../diagrams/48/534821ddffe6272d6c6d167fa3e173dc.png)
![[Diagram]](../../diagrams/7/4257dae3e6b184b9b0f88836aa1759fd.png)
![[Diagram]](../../diagrams/19/657d6671d19a2da957c0bf955b9d75bb.png)

![[Diagram]](../../diagrams/3/9bcdb5ccd1988290a1f2ddd9417b73f6.png)
![[Diagram]](../../diagrams/51/416abbed4d1354855ea0906a8cc5b3ec.png)
![[Diagram]](../../diagrams/34/6e6ab99bf9cabf06c43de9a5d39f297a.png)
![[Diagram]](../../diagrams/12/95d45ea3681a5a1a122375094f0664ba.png)
![[Diagram]](../../diagrams/23/f7c0082a0fd290575ceae228265eb8ef.png)
![[Diagram]](../../diagrams/52/f77c31ac2f07e42b300fb610868f4b55.png)
![[Diagram]](../../diagrams/45/ec94cfd38f00c7e11e6dc85d44e4fced.png)
![[Diagram]](../../diagrams/46/d840daa34ac686233645fd51c43f4a08.png)
![[Diagram]](../../diagrams/13/6e660b65cb4e74ae2a167eef11359ca8.png)
![[Diagram]](../../diagrams/35/e2a50b5ef965646256eee125e5e33280.png)
![[Diagram]](../../diagrams/1/d5184e15379c365bf00b6cb023294ced.png)
![[Diagram]](../../diagrams/3/66bc5fe9003325abb8009f07b0eaeaf8.png)
![[Diagram]](../../diagrams/24/75672e1b928d621721b43cc8ea6b9707.png)
![[Diagram]](../../diagrams/7/78eb9cf855af36232785cd330eee7252.png)
![[Diagram]](../../diagrams/38/61c81cc3a068f69587d48e66da980a75.png)
![[Diagram]](../../diagrams/10/3f2ef87be98cfdec0934cee5bf8bb8cc.png)
![[Diagram]](../../diagrams/22/b06819053c53fb547cfc3769245c5ccc.png)
![[Diagram]](../../diagrams/16/e790018dd60a21f4a58a6ff9e7bdd453.png)
![[Diagram]](../../diagrams/40/5c59419e4130971343f4a827c3a965fd.png)
![[Diagram]](../../diagrams/49/8baabf408cb23df2e6c605fc73f5339d.png)
![[Diagram]](../../diagrams/31/9f9a53f909ee2c10ee1e1f43b78e3a96.png)
![[Diagram]](../../diagrams/34/f6a69e345d276dfb2465baae1be28fff.png)
![[Diagram]](../../diagrams/51/8628629d61cb3cb3c4200253fa68c2b2.png)
![[Diagram]](../../diagrams/40/12136b4c5e6937e40d2415ee67c0356c.png)
![[Diagram]](../../diagrams/27/5e31a1f6888ee531edb4b4f61af58525.png)

![[Diagram]](../../diagrams/18/e118ea1f86057b1e44b7f06d3825041c.png)
![[Diagram]](../../diagrams/16/204b5419a5a055d9f5b0f2d21556a538.png)
![[Diagram]](../../diagrams/41/0174dc35c0309a821addc14329560899.png)
![[Diagram]](../../diagrams/38/02bd103ed6134d0824c6b03f801417e3.png)
![[Diagram]](../../diagrams/21/f3015fccdf69415159f92c3596035553.png)
![[Diagram]](../../diagrams/17/2e63228ba2b931c8004548c4aabafc8a.png)
![[Diagram]](../../diagrams/12/199e9017126f3fee0b34c984025f1ee0.png)
![[Diagram]](../../diagrams/42/0ecdf25cefbee84b556abb0c91ddc1b1.png)
![[Diagram]](../../diagrams/30/af9ae1131c1e61269117047e453866aa.png)
![[Diagram]](../../diagrams/32/d38383d9c486446fec16e7334b68534f.png)
![[Diagram]](../../diagrams/16/e3d4ba80c914127c2999741cd25afe67.png)
![[Diagram]](../../diagrams/18/205d7ea182767cd338f06f9caf855e7e.png)
![[Diagram]](../../diagrams/37/2338b735c8d73c99133de740f0e6158a.png)
![[Diagram]](../../diagrams/0/5a8d79e0fe47826b47605270d95d5127.png)
![[Diagram]](../../diagrams/48/9a62b07039e3f8ebe7fb721ca55d4f1d.png)
![[Diagram]](../../diagrams/51/cbe565c4fe85b437bcd3c73d8b0bacb1.png)
![[Diagram]](../../diagrams/40/85dd402d440baf2481aea9b25a158ffc.png)
![[Diagram]](../../diagrams/31/27374563399ce5e6abac50c2883e6d3c.png)
![[Diagram]](../../diagrams/35/b30acfa466ba74f2e2d880f8d1975e19.png)
![[Diagram]](../../diagrams/28/448e2864744c6fee79326a9389d2b2d3.png)
![[Diagram]](../../diagrams/23/6466a4375ed449cfb731336322b87b08.png)
![[Diagram]](../../diagrams/51/12bc6c720dedf3a278b506d34e318da1.png)
![[Diagram]](../../diagrams/21/b2d3542037631b77c389d70b274b5d94.png)
![[Diagram]](../../diagrams/41/5d66418dec2dcd3cf6a32414a5e00425.png)
![[Diagram]](../../diagrams/28/541bf2157a908b5d13cbb22b4646b60a.png)
![[Diagram]](../../diagrams/47/58ede72dc04787379fb98c312bda9a02.png)
![[Diagram]](../../diagrams/42/2bd86bc50832f1bb1d455b95631ceb98.png)
![[Diagram]](../../diagrams/30/687f7dd1793f3c6ff60993794cd5672d.png)
![[Diagram]](../../diagrams/36/e56999c04dc67adbcf9c14159951b68b.png)
![[Diagram]](../../diagrams/12/c11da9786acd61170b820f1bbd48cf33.png)
![[Diagram]](../../diagrams/26/82c5f08436b501dae27fae648fa4875b.png)
![[Diagram]](../../diagrams/45/97fa48af0300e509869e213dbd0657f7.png)
![[Diagram]](../../diagrams/6/ad4ca82596e7fe300cbc254d13fd896e.png)
![[Diagram]](../../diagrams/41/3fbe9b393f218dfbf4db56072d97d524.png)
![[Diagram]](../../diagrams/33/f9d69015e4d6c809470f123be21fd593.png)
![[Diagram]](../../diagrams/30/2f26f2b981c059267f96b7ad3e6509a6.png)
![[Diagram]](../../diagrams/21/798fd434bb9b583943da8efd62bcdbf0.png)
![[Diagram]](../../diagrams/41/53a9b25da4d496c275bf6060e2896126.png)
![[Diagram]](../../diagrams/29/b61d84e9e97daf31b6bebc85606d8e46.png)
![[Diagram]](../../diagrams/1/63be5bc9bbe5425a834333bcc7d7f8e9.png)

 ]
]
![[Diagram]](../../diagrams/6/b5ee103c8c25fd5d41a7f528b7459b2b.png)
![[Diagram]](../../diagrams/7/89581c6ea729a8866082632dcf465848.png)
![[Diagram]](../../diagrams/12/5d8a67c5b4062aab7e12f2efcaf93cf2.png)
![[Diagram]](../../diagrams/39/7c653ef064514eea9b97f58d5d9035cf.png)
![[Diagram]](../../diagrams/10/cf3515d647b30e55dad9dc8f1d021154.png)
![[Diagram]](../../diagrams/28/44590d6434eeac613b85d33d9f312137.png)
![[Diagram]](../../diagrams/4/d7ba034c066b530f490fb4df8d5cea03.png)
![[Diagram]](../../diagrams/21/a857ae62b21fb22601c597132558eb82.png)
![[Diagram]](../../diagrams/12/9027ec7c26dc757cb02072b2763e4205.png)
![[Diagram]](../../diagrams/18/cc9401b43d4466433f943dfcb7616041.png)


![[Diagram]](../../diagrams/31/dfcc726242e88e6d80f127a9ba05589e.png)
![[Diagram]](../../diagrams/3/df6493b61e842559944210cbc2fd08ba.png)
![[Diagram]](../../diagrams/30/513cf3619626bb1f0d3ed068480548cf.png)
![[Diagram]](../../diagrams/20/e26e0934f8edc7c90d25bf6f5e3770b3.png)
![[Diagram]](../../diagrams/16/6784d9761ed275077e4b6449d0b6611f.png)
![[Diagram]](../../diagrams/34/fe6de48494dfae5ca2a8ff321ba4eff1.png)
![[Diagram]](../../diagrams/30/fa21201b2984df5016a800a8d7d6ee01.png)
![[Diagram]](../../diagrams/5/2fd929e7941e1ebe530cbe1338d944ff.png)
![[Diagram]](../../diagrams/13/0483ddd5dd7080afb0ec02213b43aa82.png)
![[Diagram]](../../diagrams/26/fbe94b1ad891187b2b90e7c19ec013ab.png)
![[Diagram]](../../diagrams/5/0f5fc4db0a1f4cca61f863870465b99c.png)
![[Diagram]](../../diagrams/51/66567e065b56f9d60025205ab9302a0e.png)
![[Diagram]](../../diagrams/28/75efbfd73d108873ae53421ade9e41c9.png)
![[Diagram]](../../diagrams/26/ccdaeeb32177d05b39058e4cf087f7e7.png)
![[Diagram]](../../diagrams/47/5b6ae59e4423af0d41dc44a12f0b3b47.png)
![[Diagram]](../../diagrams/25/3fe256beee12ff727035f6f21a2eda95.png)
![[Diagram]](../../diagrams/36/64e734f127e847e39eadb18c0407ab46.png)
![[Diagram]](../../diagrams/7/f1da13c3175873934c78d5ece4b4fc74.png)
![[Diagram]](../../diagrams/21/f4c8aa5e9ec9942369255775b676184f.png)
![[Diagram]](../../diagrams/16/f33ba3de622b0a3f2c521d9bc14a30e1.png)
![[Diagram]](../../diagrams/28/cec715097fc384067a34e2e32abfd996.png)
![[Diagram]](../../diagrams/19/a9b75fc1e69015bd357fd7196536980b.png)
![[Diagram]](../../diagrams/4/fbcb30f2122b04f0656eafe2637732fd.png)
![[Diagram]](../../diagrams/27/b417ccfca10e77037a2feac28517fdda.png)
![[Diagram]](../../diagrams/13/33e6df6f0c6dad606fb386000c004b44.png)
![[Diagram]](../../diagrams/43/0cbb7a31f7c78dc8f1ea835e1886f6a5.png)
![[Diagram]](../../diagrams/28/8ac333627fc4fc1d5cfd656564dd4e51.png)
![[Diagram]](../../diagrams/20/f1c7dfd821865be5ebd4c4d84ab2e872.png)
![[Diagram]](../../diagrams/48/9d4227a8ab9f8ba3ccf4c4214829a8d5.png)
![[Diagram]](../../diagrams/16/75a4a82e57987ea7d9caec4c0355fbba.png)
![[Diagram]](../../diagrams/48/e1c3c2cf1f618194fc9926c45e08ab66.png)
![[Diagram]](../../diagrams/45/7fdaeff993945ac82a5027be8e0f8536.png)
![[Diagram]](../../diagrams/46/1dd0aadbd790e63b3c727826801bcbd2.png)
![[Diagram]](../../diagrams/13/9eeb0b0410e875015c1abeed4f9c2471.png)
![[Diagram]](../../diagrams/36/ee042f047728c5e63fd8fb3b1e79d790.png)
![[Diagram]](../../diagrams/51/89ab5b3caf3fe9680b55d5cfdd0fffd4.png)
![[Diagram]](../../diagrams/22/57aeeb499bd7053ea96fd07afde5aedf.png)
![[Diagram]](../../diagrams/7/aa78f4ae7084de25130230a0f70cc5c2.png)
![[Diagram]](../../diagrams/13/5d72153effb0b29f20851809afcb84c5.png)
![[Diagram]](../../diagrams/50/446d1ef5b2b63ce7bc4629fd3c036984.png)
![[Diagram]](../../diagrams/51/895830a6881e15f90b061133540bc422.png)
![[Diagram]](../../diagrams/13/2700ba483fb46e5d71f1623d9df54e70.png)
![[Diagram]](../../diagrams/49/504bf32af4bf9b114ac2159915200815.png)
![[Diagram]](../../diagrams/33/e39feaf9f76fcd8bf89a8403ef9417c0.png)
![[Diagram]](../../diagrams/14/dd6d735a1a5ee8efafd3e88363b501ec.png)
![[Diagram]](../../diagrams/4/2ca97fb0bb3623ab52f65195260858b1.png)
![[Diagram]](../../diagrams/30/a0e450158129d94793440e52bdf9648c.png)
![[Diagram]](../../diagrams/28/663df2d3b32d6748001356e0e9464af9.png)
![[Diagram]](../../diagrams/19/51ad9d77b9a9ff94c3fe89f86f6fc91d.png)
![[Diagram]](../../diagrams/18/873e52c588acd80aaff2cf012fbef696.png)
![[Diagram]](../../diagrams/37/1d11854bd6a830b74bd55eb75eb38571.png)
![[Diagram]](../../diagrams/36/cfe49179bd3c033673521680a5565f41.png)
![[Diagram]](../../diagrams/22/01e39b7b478c43219a4edb5c1241591f.png)
![[Diagram]](../../diagrams/4/2c211fb99360e61f02f8c08a1a3b5634.png)
![[Diagram]](../../diagrams/9/08fa14e7142dbbd718095a0d5e7e951b.png)
![[Diagram]](../../diagrams/10/514eb35afb5b2ac2c22044147554f58d.png)
![[Diagram]](../../diagrams/37/56f0903b27ede207eec6dc8a546ffaed.png)
![[Diagram]](../../diagrams/34/1781e83b1ee4a9bac16f0c6a5fecc79c.png)
![[Diagram]](../../diagrams/40/c14b19c23fdb9e02f0435e68e36073b7.png)
![[Diagram]](../../diagrams/48/ebbb92a27023f1181eb5fbe628d997c9.png)
![[Diagram]](../../diagrams/12/57772552ee7699f4d1e8c0511341b458.png)
![[Diagram]](../../diagrams/34/f81a1e0f3da1f8e95054025611ec9091.png)
![[Diagram]](../../diagrams/52/0910b6f3412ccfb285b562edca4372f9.png)
![[Diagram]](../../diagrams/8/2ef09dfe69c5a5f00427882a3e535ae9.png)
![[Diagram]](../../diagrams/8/b36ec2ae181789e3050278810febabd3.png)
![[Diagram]](../../diagrams/34/14f7ca60b362888c5de8bf333d4d80cf.png)
![[Diagram]](../../diagrams/42/513971606d4d684797c47a213d57ca91.png)
![[Diagram]](../../diagrams/1/3f06aef5260a9a2cf1428b6e67c4e0cb.png)
![[Diagram]](../../diagrams/33/0e98859913c5f1522e2ac4967f3eea00.png)
![[Diagram]](../../diagrams/37/5c77f1c744713dbaf63ef3d90d66fb4c.png)
![[Diagram]](../../diagrams/18/f695594ee24c3ff83e6902d8d5f56fee.png)
![[Diagram]](../../diagrams/10/d2a792f2a95dc6976a0d03901ccc5869.png)
![[Diagram]](../../diagrams/9/93a6656ab781512a933e718d0fe7d9cd.png)
![[Diagram]](../../diagrams/11/5c2bc2a91fe8c44d4fb52ac0123dbb64.png)
![[Diagram]](../../diagrams/31/2da98b531177dcd80e1998abe4eb1aef.png)
![[Diagram]](../../diagrams/41/6375cbc0a19eb02e35233b93f999b6b4.png)
![[Diagram]](../../diagrams/5/ee76f95d3f0a8205da789d01d7c2c23a.png)
![[Diagram]](../../diagrams/15/b490d24be993a04922d5506ca1489993.png)
![[Diagram]](../../diagrams/4/97c134e5de3d71ea6a3c9dcad09a4d68.png)
![[Diagram]](../../diagrams/23/43a1afa3d7b8387312159533faeccd13.png)
![[Diagram]](../../diagrams/4/2f0d25b84bfcbe55c04e064e0f9433c8.png)
![[Diagram]](../../diagrams/12/b3d617b893c5b87875b8f0676ddcdc7f.png)
![[Diagram]](../../diagrams/29/088850d0d5ee8f084def1588fac5c682.png)
![[Diagram]](../../diagrams/28/83b0da3e783630c2c89e4a0ec5436c8c.png)
![[Diagram]](../../diagrams/41/0779a9def5a5085955b562f9672c3348.png)
![[Diagram]](../../diagrams/26/13d99ac5b5b768e57253f827bc5e301a.png)

![[Diagram]](../../diagrams/7/cc959014b241efd5f21f3461b838b6bc.png)
![[Diagram]](../../diagrams/18/7dff7e965d33d181696e855f94bf90c0.png)
![[Diagram]](../../diagrams/37/5d23a07ee00a5c6e9cdcc3dcd366dcdd.png)
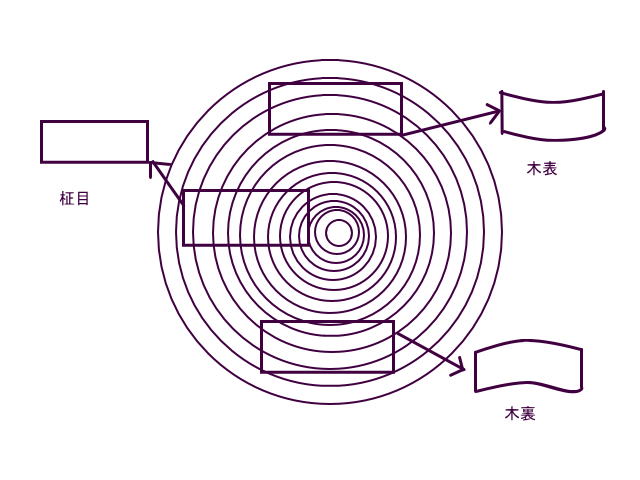


![[Diagram]](../../diagrams/46/ae7766d41feadeb6c01facd5ff46b5eb.png)
![[Diagram]](../../diagrams/9/8783b60c62d5abf6d03e71e5afa91117.png)
![[Diagram]](../../diagrams/42/6354f14fa5d814799bf0439c36c3b52c.png)
![[Diagram]](../../diagrams/6/4c72af27927b33149dff3693721f8060.png)
![[Diagram]](../../diagrams/27/b26b8f7bf01fe7eee99de8eb0f45b621.png)
![[Diagram]](../../diagrams/38/77bfc57a6f286802377f4647e8da97f5.png)
![[Diagram]](../../diagrams/38/654c2fff107ca63d2968ee6fd22a3a1d.png)
![[Diagram]](../../diagrams/37/c3b7058ba6d742176ca07f9861417f82.png)
![[Diagram]](../../diagrams/45/f775f1d6ca8de1a5e54a367d15b806f3.png)
![[Diagram]](../../diagrams/27/8a7e4d094dc2750731ff3331968c19a6.png)
![[Diagram]](../../diagrams/44/0f078b9d09293541e8c05b8d350d0322.png)
![[Diagram]](../../diagrams/19/10f6899abf6c5834600fdbba398aad85.png)
![[Diagram]](../../diagrams/7/f08c3383a3e33573af82765f7b90a4d4.png)
![[Diagram]](../../diagrams/18/3991e078faf076e46bc394620c184fc9.png)
![[Diagram]](../../diagrams/15/c1ccc96e8d8c77ff4131ac64760c2550.png)
![[Diagram]](../../diagrams/44/2653b72b186bafd36609a46e7d5f7b12.png)
![[Diagram]](../../diagrams/12/26646ffdab083c07e59604b2090bbcc7.png)
![[Diagram]](../../diagrams/37/b0a9be91435dab58d7c3f1e358260174.png)
![[Diagram]](../../diagrams/46/852ab73f4d7b66ceee234e871903154b.png)
![[Diagram]](../../diagrams/37/6b381b295257c183e5f6ebb6b474aec2.png)
![[Diagram]](../../diagrams/1/e82726f9131231c709d618a38a43cafe.png)
![[Diagram]](../../diagrams/27/ac5950347495234657621fe5ada0ba59.png)
![[Diagram]](../../diagrams/16/9186faba9260085dec71e50b67ca0ef8.png)
![[Diagram]](../../diagrams/46/3f2812770f638ef2ba9a11d27cdb74e9.png)
![[Diagram]](../../diagrams/51/cb91a9d527ab889d38d7ff65cce52490.png)
![[Diagram]](../../diagrams/49/47dda5c60467847cf319e385115bdaf8.png)
![[Diagram]](../../diagrams/9/70c5cb6dbe8a277edaf69fe85d2c697c.png)

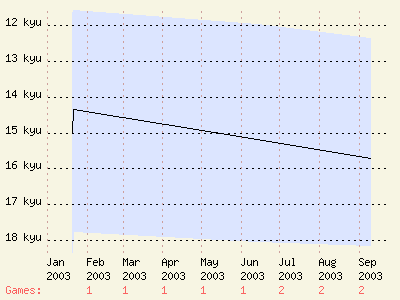
![[Diagram]](../../diagrams/13/401e4cd4681d0c8fd23e4e50d92dc6e5.png)
![[Diagram]](../../diagrams/47/289d797a1d2f50a64b03b300d7893931.png)
![[Diagram]](../../diagrams/7/e470a12757c7e384293f51c5ffe0030e.png)
![[Diagram]](../../diagrams/27/2c8e743b1bf03dedd5d3db9618811fc6.png)
![[Diagram]](../../diagrams/32/681d26adeb4d794d0c8f526472a859c7.png)
![[Diagram]](../../diagrams/43/878d298ffb27a34c256f4016c03bdba6.png)
![[Diagram]](../../diagrams/20/234bbeb047743bd563c2a45ee8bf1ee5.png)
![[Diagram]](../../diagrams/36/53ddf7f7d13550e409c5bd03e5c3e1a6.png)
![[Diagram]](../../diagrams/15/21b9fe92458ccf8d68c27db9cc121fb9.png)
![[Diagram]](../../diagrams/30/40c826cb0d7db894de529a4f8c400e24.png)
![[Diagram]](../../diagrams/51/58335eea0d3350ce803d989392b7f447.png)

![[Diagram]](../../diagrams/36/bd3ede827be24e3bee69c552b88d0361.png)
![[Diagram]](../../diagrams/4/f34e806c2846ded207aa573cbb907895.png)
![[Diagram]](../../diagrams/7/68aa4b3811142714e794e1ff501785d7.png)
![[Diagram]](../../diagrams/46/0e943d6c617d5a4dcfa2381118ce7068.png)
![[Diagram]](../../diagrams/44/e30262a961b52b8be03712657f6930ed.png)
![[Diagram]](../../diagrams/11/e115802994755e2b1538bab0022c9bce.png)
![[Diagram]](../../diagrams/14/ec1119c1bc84b7c5b6f8b8c3057ab056.png)
![[Diagram]](../../diagrams/52/fa6f3518b10f77474c4c709ee0b38831.png)
![[Diagram]](../../diagrams/6/5c0094df4e817185d0b83bcc0c979283.png)
![[Diagram]](../../diagrams/43/d9741b6ae585169c510ff1513be929cf.png)
![[Diagram]](../../diagrams/46/8562e4b1ee2a960de9d20ae25db9c837.png)
![[Diagram]](../../diagrams/11/b9b8c834ef131a0c651e206d5adb1c29.png)
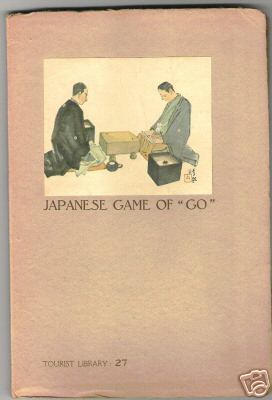
![[Diagram]](../../diagrams/22/8f77b7fde59946f65e42c38347fa02c8.png)
 . When I checked it in a good dictionary (edict) the result was a couple of names. Including Fujiwara, but also Fujiwarano
![[Diagram]](../../diagrams/27/8654725305a2eb10196c0e90269dcbd9.png)
![[Diagram]](../../diagrams/23/3e95223d87c6c92ff8dbe949fc9fea65.png)
![[Diagram]](../../diagrams/14/824de878a216f3731db60f1f0bc4a370.png)
![[Diagram]](../../diagrams/35/057de0a1496eb13807246197c971b23a.png)

![[Diagram]](../../diagrams/5/5b04519b90f602eaedf9a37dd09463ee.png)
![[Diagram]](../../diagrams/15/e1053701bbe6bab9b905179f6baabf5d.png)
![[Diagram]](../../diagrams/37/58649c317cd9e043ea61c6e48e8aee71.png)
![[Diagram]](../../diagrams/17/8b7415e9d42e4c25b86e0256d2f52a59.png)

![[Diagram]](../../diagrams/47/31d6a3e7ff1dc974e2d9ad445a192287.png)
![[Diagram]](../../diagrams/46/f5262d5c7da4cf820cb0171865bce991.png)
![[Diagram]](../../diagrams/47/1b50e0f68fcdea3261c057d4ea60014a.png)
![[Diagram]](../../diagrams/47/0c8d3a8a6050ea01b163abacfa2e1f1e.png)
![[Diagram]](../../diagrams/24/3df7fa6874c8a0ddbfd6106861c2c0ce.png)
![[Diagram]](../../diagrams/18/d121562b3ef996affbb62ca2d40a112f.png)
![[Diagram]](../../diagrams/52/b453f5795bd9be4f5bd3404fdd68b566.png)

![[Diagram]](../../diagrams/2/b27e2e61ed792b3f3001c288a8fc31fd.png)
![[Diagram]](../../diagrams/31/0b70ca21b11243d1ca2e3ae4b7f20a59.png)
![[Diagram]](../../diagrams/22/8ada7642161dec01519367b61be8afe9.png)
![[Diagram]](../../diagrams/36/7f5d313bd83772198ce7b6f0d42b6c50.png)
![[Diagram]](../../diagrams/49/ee596f31a6c24e40cf5889dc57fdaa3c.png)
![[Diagram]](../../diagrams/33/b3f5bc964e17524a792efc488dbacb65.png)
![[Diagram]](../../diagrams/44/e919d7d0d894983777bab10661203d3f.png)
![[Diagram]](../../diagrams/42/ea79b2a33748136cdbf4fa15914a2a42.png)
![[Diagram]](../../diagrams/5/04b961078f2c44d73efabf070f334410.png)
![[Diagram]](../../diagrams/9/316f47e9b8343c33bd967469afde6531.png)
![[Diagram]](../../diagrams/33/a46e648a7ec62c8e4a8d67580bbb897b.png)
![[Diagram]](../../diagrams/34/dc4395d2527e12e1c6c68e790f5b5108.png)
![[Diagram]](../../diagrams/42/cec240aad7948d9fe04d27932092715a.png)
![[Diagram]](../../diagrams/0/fb855151dacfeabefb5fd5548a51ddb9.png)
![[Diagram]](../../diagrams/27/f4426a7a57c5faa91436e8e57104c778.png)
![[Diagram]](../../diagrams/16/9ae880555b82bb511903a505e3e9568d.png)
![[Diagram]](../../diagrams/42/0f73003a009a2031b3f70e21a724864d.png)
![[Diagram]](../../diagrams/8/f74ef5ebffd09f8f6b90719271e1c5ad.png)
![[Diagram]](../../diagrams/49/5a988be10d200b1804323856f9c56e12.png)
![[Diagram]](../../diagrams/12/c989fe194a89f55ca8984ac5271dff3b.png)
![[Diagram]](../../diagrams/34/52424d86515e32d4fc7c3a9c4b5f9279.png)
![[Diagram]](../../diagrams/38/c087c3762abd26bad176827f6ade6f23.png)
![[Diagram]](../../diagrams/23/ef9aec4e6dd988700f9600be8945ed61.png)
![[Diagram]](../../diagrams/35/c5361e1f96febacd5d8ba506b3d70c36.png)
![[Diagram]](../../diagrams/16/4731d39a2ce9ecc90798e52f20a8857b.png)
![[Diagram]](../../diagrams/44/b1536800f15c0d4d737059287d96892b.png)
![[Diagram]](../../diagrams/50/4936e5968a29c7f51a78d2db9c71ff85.png)
![[Diagram]](../../diagrams/36/6b98440557877085f6b302dfe1d45373.png)
![[Diagram]](../../diagrams/42/0fd74c1fefe8accf51d0b9ef2f4ef849.png)
![[Diagram]](../../diagrams/34/5751b7d4f71b6d620f55f637642fbfc3.png)

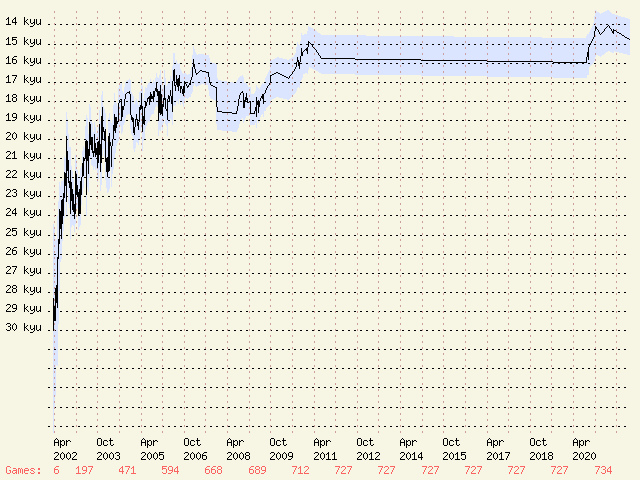
![[Diagram]](../../diagrams/25/9c75a3f6e504af1b469e337c25b2d22a.png)
![[Diagram]](../../diagrams/26/1eadbbe6663e39e184f5cd4c456914ef.png)
![[Diagram]](../../diagrams/4/aac697be989efd5b00307ba3da76731f.png)
![[Diagram]](../../diagrams/3/885e6e19c7edd645bf15524816c05a12.png)
![[Diagram]](../../diagrams/6/2ada68d699d2741b174378f447b6c608.png)
![[Diagram]](../../diagrams/47/e380179e8a266147372298ac4664046a.png)
![[Diagram]](../../diagrams/30/9361d628026ef723eeb2430f5e804676.png)
![[Diagram]](../../diagrams/13/dc78a53bab790b327e0a4f9fda8e4ea2.png)
![[Diagram]](../../diagrams/22/b5bcb9272728eddd5967bb383dee85dd.png)
![[Diagram]](../../diagrams/35/0dea3f4694c722757e17f7a06620d50b.png)

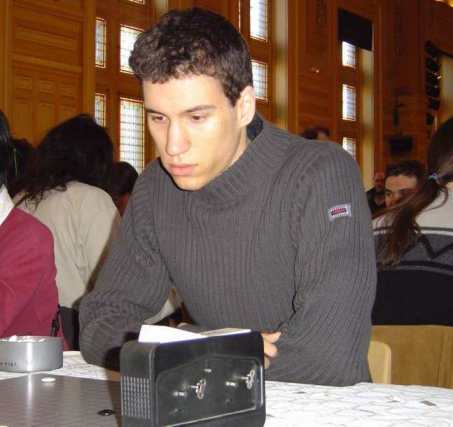


![[Diagram]](../../diagrams/20/115f653dd4c6c4bb263d5f60b53da765.png)
![[Diagram]](../../diagrams/25/37c2e5739db2a4e31368a32363a0d0b5.png)
![[Diagram]](../../diagrams/31/374e9e61ad02887f66c36fa28f0b1342.png)
![[Diagram]](../../diagrams/10/83a6dcfc9b5a4874b809bcf2c7feb3de.png)
![[Diagram]](../../diagrams/13/acdaaa05d68cd325eed3b7e31f5390a1.png)
![[Diagram]](../../diagrams/30/b5fdad92ce899f218b6cac239a87b45b.png)
![[Diagram]](../../diagrams/44/722460a746313607f13f1f28eae18678.png)
![[Diagram]](../../diagrams/28/e9aa9c5d742b744eb954f95593cef24b.png)
![[Diagram]](../../diagrams/43/1a8a9d6ff99c180011db7c2939736c87.png)
![[Diagram]](../../diagrams/50/b85d0403c2d26ce4e3f8398a93d805ea.png)
![[Diagram]](../../diagrams/2/3d0192a233dfce1f26c7838c6af938df.png)
![[Diagram]](../../diagrams/15/7f4c11f7e9fa57b6bcc08b14d8995d46.png)
![[Diagram]](../../diagrams/45/a96adcc5761b8ecd2278bb0a25c2338b.png)
![[Diagram]](../../diagrams/21/18b8586096d2ac6c4e5107813284755b.png)
![[Diagram]](../../diagrams/48/4646ee9833e6ce5171da3e4dd581ddd8.png)
![[Diagram]](../../diagrams/33/7ef38278bcbfda4256a9ef82d399e510.png)
![[Diagram]](../../diagrams/22/a7dda4129f6011ba1abd2d0438e14929.png)
![[Diagram]](../../diagrams/42/97ba53c3f6683e82dcabdc17f5c4fc31.png)
![[Diagram]](../../diagrams/35/ab5a9d15b2a5f8665d250386b4e6bb93.png)
![[Diagram]](../../diagrams/3/e77f5c3323a6fde45e8fd9f3369e74b4.png)
![[Diagram]](../../diagrams/41/a7a4a3e2b0354aca18630656130647cf.png)
![[Diagram]](../../diagrams/37/080d1e3cb3e8f84bff5d0717c91c582c.png)
![[Diagram]](../../diagrams/12/2a730b7febfa41c61d6b2e0de9acd58e.png)
![[Diagram]](../../diagrams/18/7322d39eb7f893be18e36cc6c1fe940c.png)
![[Diagram]](../../diagrams/41/c16eff1470ce1a9a7eef6f7f3a8a445d.png)
![[Diagram]](../../diagrams/45/6772f1b9bc89232ff5fce856b0fcfccc.png)
![[Diagram]](../../diagrams/32/3e097e6473a8ff203e93f9829179699b.png)
![[Diagram]](../../diagrams/6/f32a2015b32190cc1f138f9b811c2ee5.png)
![[Diagram]](../../diagrams/34/9f8b3721c7a0bfd8d4e53a9cfe975b2c.png)
![[Diagram]](../../diagrams/12/7c03923a3c139f3afeca4023ddcd28c3.png)
![[Diagram]](../../diagrams/7/9b2ba2a0759da47ec40d2ffcdbeed322.png)
![[Diagram]](../../diagrams/20/f8c61cae778705218540e3205de4af0d.png)
![[Diagram]](../../diagrams/34/025112751c75a957e569ad81c6135a14.png)
![[Diagram]](../../diagrams/6/215afd26a4501f524f3deaa4e733997f.png)
![[Diagram]](../../diagrams/51/7bd5bab313e8e69c0e7ab6d519e76380.png)
![[Diagram]](../../diagrams/8/7ad6afb8820918cefd4c43401c5fe61b.png)
![[Diagram]](../../diagrams/25/fd63fb187bbd716b8d45ee2beafaf543.png)
![[Diagram]](../../diagrams/5/1505e111c2d057f482d3550240fb1bac.png)
![[Diagram]](../../diagrams/4/b9ef016ce924840ba53e774991475f90.png)
![[Diagram]](../../diagrams/4/8562116a02f5c610353c6d4b538ff7bf.png)
![[Diagram]](../../diagrams/13/8d70579a6d7ec824a3efbecdeacf6ef3.png)
![[Diagram]](../../diagrams/41/47cf47f7c2c5f47c709be3c46a8be38a.png)
![[Diagram]](../../diagrams/42/3be78da9ce0eabfd8c78ac716c435834.png)
![[Diagram]](../../diagrams/12/52909579f0e8abfeb652db0ad48308c2.png)
![[Diagram]](../../diagrams/48/2c0d4e0b8cd8365e3f7273165ccf881a.png)
![[Diagram]](../../diagrams/50/26ca40c1feb6737bea71030d9b1afe2a.png)
![[Diagram]](../../diagrams/18/3962fc5d6c17dbd05295ed4f7774e8f0.png)
![[Diagram]](../../diagrams/36/b2316deacabec3114e6b3b05f43709f6.png)
![[Diagram]](../../diagrams/30/1a9905439f11edb532f9f883b04fe543.png)
![[Diagram]](../../diagrams/16/b085fe18e6edea1dc01719cefb7852fc.png)
![[Diagram]](../../diagrams/5/528916d3b41b88c80ec9bb46113bf5f6.png)
![[Diagram]](../../diagrams/3/0914e744c16cc16ff0991eb8421a35b6.png)
![[Diagram]](../../diagrams/42/39a4a0efe98cbb4161e9c5d9df9d1ef7.png)
![[Diagram]](../../diagrams/45/66a250811d5b26eef3509e1fcf4e07c5.png)
![[Diagram]](../../diagrams/0/2088b88f70fb2cb9ecb637f6ac7c109b.png)
![[Diagram]](../../diagrams/31/0e2611bb5b867e7ffbd8aa078366346c.png)
![[Diagram]](../../diagrams/10/b777086bf64940644390cb873a7e7a75.png)
![[Diagram]](../../diagrams/24/25d25e079fb7f90a34e21ba5ca05fc86.png)
![[Diagram]](../../diagrams/48/7e9fba188945e3bcf06c17c3c3242419.png)
![[Diagram]](../../diagrams/20/5395d8dfeef4eb1878628f5ad7d57970.png)
![[Diagram]](../../diagrams/20/0225d129bd985154a6379e28d87ff432.png)
![[Diagram]](../../diagrams/21/4ae358d9c68e84089920837fa2b98438.png)
![[Diagram]](../../diagrams/12/0902a862915d5f5ef37635ee67255c3e.png)
![[Diagram]](../../diagrams/21/ac2025d431ed4500375a64eaadfcc7a7.png)
![[Diagram]](../../diagrams/13/ce77c1fa7828769691df46d189c5c1cb.png)
![[Diagram]](../../diagrams/13/f25a30db4b87fe6f333b79f2549855a2.png)
![[Diagram]](../../diagrams/33/23fd9b9e446d2210f6d6092f80329706.png)
![[Diagram]](../../diagrams/39/dd2ee608473bbb78738fe20f1a41db99.png)
![[Diagram]](../../diagrams/33/9547838dd39efbc798051010891b0d7d.png)
![[Diagram]](../../diagrams/9/98b4b7ae348bcb376a5dc8a23198ba01.png)
![[Diagram]](../../diagrams/25/5909a4d26e1062ce150373f019b1e52d.png)
![[Diagram]](../../diagrams/26/c41140776e4e59e6a03dab5d375e0e79.png)
![[Diagram]](../../diagrams/24/cf1a2eab3499921c4af68f0d996c8656.png)
![[Diagram]](../../diagrams/36/e16467e492ef9d8e4766f473519ca799.png)
![[Diagram]](../../diagrams/43/33a6149d7234e77b29953be9cdec2b3f.png)
![[Diagram]](../../diagrams/5/058dc15f76150cf738891748b0c2f0d4.png)
![[Diagram]](../../diagrams/45/05f2964957f8ca18df85dd28b20cacf9.png)
![[Diagram]](../../diagrams/1/7793d05b4c18000224ac19bcbe603910.png)
![[Diagram]](../../diagrams/20/cfdaa0b95849248441155715c79a2ddd.png)
![[Diagram]](../../diagrams/40/61ddd963a82b2b72d64302281bf7550f.png)
![[Diagram]](../../diagrams/23/ab5e448d8b09cbe644485ffbed86eb9a.png)
![[Diagram]](../../diagrams/17/2b71bfca59a31158a6e4c8c7827b217f.png)
![[Diagram]](../../diagrams/44/cb1f6aa8ba816c35a31f030ba884d5e1.png)
![[Diagram]](../../diagrams/21/aaf7a6c2a3f27c3ceb0efe6bfd6d2563.png)
![[Diagram]](../../diagrams/6/1eb0d1e80b4c078c5d593d3200c246c7.png)
![[Diagram]](../../diagrams/29/e7a610f6caa6b87430b8975c792a0c7b.png)
![[Diagram]](../../diagrams/50/dc7663cb55b8ff520f0410af24d049db.png)
![[Diagram]](../../diagrams/39/16be1c1f721b3dca320c200a2c5a90f5.png)
![[Diagram]](../../diagrams/15/b2ee48c739569ce4b40d184272f56954.png)
![[Diagram]](../../diagrams/10/d2ba10f6705f3f691a9e72150a0a5f2b.png)
![[Diagram]](../../diagrams/33/84160806ebfdd44883bee32e8ed1efa4.png)
![[Diagram]](../../diagrams/7/4c4141299d5500604392346f112209d7.png)
![[Diagram]](../../diagrams/32/d61b09553a1319aab9084573e2decc1c.png)
![[Diagram]](../../diagrams/27/c1b0b44c04de268fc39a36b1ff870f9a.png)
![[Diagram]](../../diagrams/37/14e34826e0aea28f0d2d21b42bc14079.png)
![[Diagram]](../../diagrams/44/974fac5225c7e2dc47b456cf47912672.png)
![[Diagram]](../../diagrams/35/1211a5c984d4d29170bdefecb71a82a1.png)
![[Diagram]](../../diagrams/19/0382d604f12eac8f33b36619db942df9.png)
![[Diagram]](../../diagrams/43/4ecbf008b47f8f0c2cb1742fc643a21e.png)
![[Diagram]](../../diagrams/34/ef9eecad67a71788dfe8fb0c409ba489.png)
![[Diagram]](../../diagrams/1/cef17dc953a225642615c749f373e1ab.png)
![[Diagram]](../../diagrams/48/8a05025f7ceea1f794901142d59097b9.png)
![[Diagram]](../../diagrams/49/21d93c85809077f058c221860a40b7f7.png)
![[Diagram]](../../diagrams/12/94f073de01737ebceaa83fefaae0bacb.png)
![[Diagram]](../../diagrams/15/3bcc31edb0020dd20dc6790d42daa618.png)
![[Diagram]](../../diagrams/44/8ddad0aaf82a099307563e15836b79ca.png)
![[Diagram]](../../diagrams/52/446ae04e59fedb688362b8b9e60187cc.png)
![[Diagram]](../../diagrams/31/00710c8f81aaa6ed150f52498859b46c.png)
![[Diagram]](../../diagrams/29/f409ea806abf0460c732fff5aedbf8d0.png)
![[Diagram]](../../diagrams/4/cc13d531cfb8801b1ab91cf688e8818b.png)
![[Diagram]](../../diagrams/4/1d3ed0e12543a1a56f19bb11569342b3.png)
![[Diagram]](../../diagrams/4/1ac3524c29c8faca0b2044e551046065.png)
![[Diagram]](../../diagrams/34/5008318080f93c01bd2b7939a7ec01d3.png)
![[Diagram]](../../diagrams/10/92bebc125b5c776cc8716b64a501b064.png)
![[Diagram]](../../diagrams/2/217451a85b698c23f97e760aa056af9f.png)
![[Diagram]](../../diagrams/17/f36d6568af6384bac3f680c56e846871.png)
![[Diagram]](../../diagrams/40/a2dce83a3b7978140534e58721590ce9.png)
![[Diagram]](../../diagrams/45/3efcfcbcbd8cf190b93edb3e9c43ac10.png)
![[Diagram]](../../diagrams/20/8e20fd7c907fc727a11fe2d6603fc398.png)
![[Diagram]](../../diagrams/38/540da38aecd19de4c68f700cd2d96c3a.png)
![[Diagram]](../../diagrams/18/9228e4c5c797184d680bcb2a580274af.png)
![[Diagram]](../../diagrams/30/fcfa64209803aa6b1ad780fc46ac82c7.png)
![[Diagram]](../../diagrams/41/9f4ab305afbe8e2aa8e586e185f5220d.png)
![[Diagram]](../../diagrams/35/bac24c74a24ff4b0bda6460354e1cfbc.png)
![[Diagram]](../../diagrams/18/69865a0b6f4fb8c45f932922ccde80c5.png)
![[Diagram]](../../diagrams/22/7808f89d6132437a13f307f162af5445.png)
![[Diagram]](../../diagrams/0/e4d75c589e2167d0c960c9f58d54f720.png)
![[Diagram]](../../diagrams/28/655ddbb99f6fee2120f56a9bb8940170.png)
![[Diagram]](../../diagrams/9/925785bf7a855a32ccf1a133df591f8c.png)
![[Diagram]](../../diagrams/24/6a9bc66af4357bd627b78b0b0684d8ce.png)
![[Diagram]](../../diagrams/5/1062ae4fd20ebb45fc25af129e1bf93b.png)
![[Diagram]](../../diagrams/27/517c8ced11914fee0f8b3abd878028fe.png)
![[Diagram]](../../diagrams/0/52bf76a9a71165d0e8eac6e67077b161.png)
![[Diagram]](../../diagrams/48/fb7b89e15c2ef2dd251b5c84925af892.png)
![[Diagram]](../../diagrams/22/09629f973f73f8815ca12ac6bd187de8.png)
![[Diagram]](../../diagrams/32/b37f6b180c742769671f29e03713d7f9.png)
![[Diagram]](../../diagrams/32/71e7c48221679da23455d66327e0ce3b.png)
![[Diagram]](../../diagrams/28/d55a5b614807fbf5f0d0a7048757a385.png)
![[Diagram]](../../diagrams/12/907402c98283a7e0e33b00217e7a3f11.png)
![[Diagram]](../../diagrams/50/48cccc1fc86651990b050569b40837e0.png)
![[Diagram]](../../diagrams/5/e2ac1137436fd5ded27db371d9d11180.png)
![[Diagram]](../../diagrams/44/2d85128fdc464e555d33b0aa4a5643fa.png)
![[Diagram]](../../diagrams/0/cce5696ef7e5dbeec640e10a8fb995f7.png)
![[Diagram]](../../diagrams/20/0c10638fac8215fc447df1ce9041085b.png)
![[Diagram]](../../diagrams/15/01b6d5f983a52c454ea422f613ba6acb.png)
![[Diagram]](../../diagrams/23/b7661869958774d6f4b772273116cf44.png)
![[Diagram]](../../diagrams/39/3881ab9d26da84d29d774c01e530b7b4.png)
![[Diagram]](../../diagrams/5/2947070099710c492b500ad915a9a4fa.png)
![[Diagram]](../../diagrams/24/2f5a9c8fdc83f79702618e97fd3b92ef.png)
![[Diagram]](../../diagrams/48/39d1f8bf8c9a18d3fa6df0785f4e49b6.png)
![[Diagram]](../../diagrams/48/f7abaf654009c226026b816aeb2972d9.png)
![[Diagram]](../../diagrams/44/ce3557b5d8421e0ef5462627407e84ce.png)
![[Diagram]](../../diagrams/47/7035ecbd0615d86c7b61381eef30db26.png)
![[Diagram]](../../diagrams/34/bd997ead851674b8f04a7f7dece54d50.png)
![[Diagram]](../../diagrams/6/cbd83e471e3f8a8512d833b1fdf1783f.png)
![[Diagram]](../../diagrams/31/f9f73d97d3d0f994e73a44480c6e743c.png)
![[Diagram]](../../diagrams/27/f27a68e554bc411ec2f4aba9c504114a.png)
![[Diagram]](../../diagrams/28/760783991f00f4f03bcd6e7e3574a395.png)
![[Diagram]](../../diagrams/52/c45e42ea16863c487fa5b39efb20666f.png)
![[Diagram]](../../diagrams/45/48ed4ad704b02cba5d5cfb1b8c9a87f7.png)
![[Diagram]](../../diagrams/39/a6169d92682293998853e3c00f8fa893.png)
![[Diagram]](../../diagrams/22/740b28f8c9fea3f5bf31c64a52037c95.png)
![[Diagram]](../../diagrams/31/b16fc459f415436e64958845e25c89ab.png)
![[Diagram]](../../diagrams/11/7389fee83be9c0dc4a638c8c01f9c60c.png)
![[Diagram]](../../diagrams/12/ff8ca0fc5ea7460541e42063baa7865b.png)
![[Diagram]](../../diagrams/36/187e530e6a3488d5f67126db1063f98a.png)
![[Diagram]](../../diagrams/7/d09512756b7b5bd85353b909b334f8da.png)
![[Diagram]](../../diagrams/52/2ee5a55b2a9a86968dedc52a23093c3e.png)
![[Diagram]](../../diagrams/5/0a78eebff7bcb4341b300f7c83ce5484.png)
![[Diagram]](../../diagrams/41/d6a7ae06be2a5147f0230291e508833c.png)
![[Diagram]](../../diagrams/23/c2545fe2d99962d3c26e3a8d46e27057.png)
![[Diagram]](../../diagrams/9/a217f12a4890eecf5c8cf7aee720268e.png)
![[Diagram]](../../diagrams/8/06327e14c096bd600025cf00eab0786d.png)
![[Diagram]](../../diagrams/16/0e0532edcbdb282ecd2c6f85947c707c.png)
![[Diagram]](../../diagrams/33/42afe59d59565bf0678b5082d42d1259.png)
![[Diagram]](../../diagrams/29/8cdbd011082e9ae4ff358ad64f1a692e.png)
![[Diagram]](../../diagrams/32/0ec1008ebdb5c2407603fe363929326e.png)
![[Diagram]](../../diagrams/21/72fefa501fc2e38492b4f175f7e29bd4.png)
![[Diagram]](../../diagrams/19/c5923ace01806d16ad4fa679c72847b3.png)
![[Diagram]](../../diagrams/37/d2b51f25db3e92ba040a7440e77acb39.png)
![[Diagram]](../../diagrams/25/a2d825f7e87cd2e9c7dc80a33ee321c6.png)
![[Diagram]](../../diagrams/46/e0c0718a095f8fa36b81547cd8fcd5fd.png)
![[Diagram]](../../diagrams/30/54244b39b4b2749ae7c7ab6612914560.png)
![[Diagram]](../../diagrams/51/b89ae8e19943db9a4f99ad081daac1a1.png)
![[Diagram]](../../diagrams/45/1dd828318ffb94eae59f0084393b5fa3.png)
![[Diagram]](../../diagrams/48/c941c47c89774a20d86d570d9322fe1b.png)
![[Diagram]](../../diagrams/36/869287102be9134a4c283178981df177.png)
![[Diagram]](../../diagrams/41/37e2cd01be388a832f342e20c8e3cec7.png)
![[Diagram]](../../diagrams/40/162a29f7a96e72ccf5fb954398a3e658.png)
![[Diagram]](../../diagrams/1/825d804352cd34e58619de8bb2cdff96.png)
![[Diagram]](../../diagrams/34/ff7c97a944ce9049a16339af2168cee9.png)
![[Diagram]](../../diagrams/40/eb3b69b947b115ce172e73f194967d39.png)
![[Diagram]](../../diagrams/20/f97047e4af759019b677243e283667d5.png)
![[Diagram]](../../diagrams/17/6a55a38dcc8c079683a0f96271475275.png)
![[Diagram]](../../diagrams/24/28158666121035228fc0d03783ebfb3f.png)
![[Diagram]](../../diagrams/28/764fe5a1f706a2ebb0f572c6d112cc93.png)
![[Diagram]](../../diagrams/25/d58e2843beb3dd25aaf8e66bcf74fae6.png)
![[Diagram]](../../diagrams/2/1d46c4e46f5ef92125b3d54c2c318e0e.png)
![[Diagram]](../../diagrams/32/812e32bc780312b08ee06464832b9dfc.png)
![[Diagram]](../../diagrams/21/0f5ee1540de8ee88a5c2dcb0c20b11a6.png)
![[Diagram]](../../diagrams/39/e75fc3479fe0b3f98278cf9cdbde714d.png)

![[Diagram]](../../diagrams/42/9df4168d5f709e3ff31ea3cd5f3ef4a5.png)
![[Diagram]](../../diagrams/44/cfd28a3a91f2685b349ccf253bcd8eb8.png)
![[Diagram]](../../diagrams/3/3ff411839f182372c20ee23eeec4e89f.png)
![[Diagram]](../../diagrams/34/0cf9bddbff85504c87f418f90d6c2b0a.png)
![[Diagram]](../../diagrams/49/58a8686b977098a9fe708fae4d89a5c4.png)
![[Diagram]](../../diagrams/1/6215f9c3ae30a8a45d98d9dc089f5473.png)
![[Diagram]](../../diagrams/42/c261e55aa1c29217941aed91250dee55.png)
![[Diagram]](../../diagrams/37/64906e9495067d8818b19807a52e07cb.png)
![[Diagram]](../../diagrams/2/1582a8bb14ae9806090d808132414a45.png)
![[Diagram]](../../diagrams/0/623aa9cc78c9d564877a03caef5e0146.png)
![[Diagram]](../../diagrams/5/c659d72c5ae4e5e5695c7c2df6a596cb.png)
![[Diagram]](../../diagrams/24/15266d74d4627628ab91ca5c8e27e83f.png)
![[Diagram]](../../diagrams/1/a3a52c060c83adaed5441f23ba9a5fed.png)
![[Diagram]](../../diagrams/5/3b503351121a4c21b9105ea6e74be577.png)
![[Diagram]](../../diagrams/52/fbd02e3aaa48892d60ccca085541a7a7.png)
![[Diagram]](../../diagrams/13/eb493111461d209411a281637f51282d.png)
![[Diagram]](../../diagrams/1/754a6948bcaa5cc4972ad15368fadaa0.png)
![[Diagram]](../../diagrams/3/e6ef7e2ea4645e1bcbe1637fdf8da329.png)
![[Diagram]](../../diagrams/52/1cd4c39b4db2a9bcd56c7639fea2a8ab.png)


![[Diagram]](../../diagrams/40/2d936111de5fa132ef18368466d3365c.png)
![[Diagram]](../../diagrams/41/cfa42dca85eca5386d05f66e2f2354fb.png)
![[Diagram]](../../diagrams/19/a7aec28e1e573e4add2cf3f8eb418846.png)
![[Diagram]](../../diagrams/23/7230105f3b2cdc2d01683ca5e17bd902.png)
![[Diagram]](../../diagrams/43/5ed5dd9f95120434cb6f86f5e222472d.png)
![[Diagram]](../../diagrams/22/fceacec8773e6c31194c34d72f8e0a5b.png)
![[Diagram]](../../diagrams/22/b5a2546423a732d55f74d6970dc26513.png)
![[Diagram]](../../diagrams/41/6a4542cc10662a7fafdee2c4d4b7eecc.png)
![[Diagram]](../../diagrams/12/0dad0e36df6d68f7c265aea0d0f52f3f.png)
![[Diagram]](../../diagrams/1/d642877c5413b586249975b82fd92b73.png)
![[Diagram]](../../diagrams/44/43d278efeb07455545787604e2109c73.png)
![[Diagram]](../../diagrams/31/0555ed0d1ed7452035b0e5f26329e482.png)
![[Diagram]](../../diagrams/18/b907c7aa42ffcde1bf7c5005b0f27ea0.png)
![[Diagram]](../../diagrams/10/4089b740b062894f03fed760431176ec.png)
![[ext]](http://jhubert.club.fr/Go/Text/Science_et_vie_714_Mars1977.JPG) http://jhubert.club.fr/Go/Text/Science_et_vie_714_Mars1977.JPG
http://jhubert.club.fr/Go/Text/Science_et_vie_714_Mars1977.JPG
![[Diagram]](../../diagrams/3/d0ca8e6fe2555657706f8ccda58a2069.png)
![[Diagram]](../../diagrams/15/2da1289a8cdfb356f10051d1a03fb772.png)
![[Diagram]](../../diagrams/6/d1a520285d14700b60290c1e473b29b4.png)
![[Diagram]](../../diagrams/4/bd06c306b887c3d10ac500c6ce62a4db.png)
![[Diagram]](../../diagrams/32/03c833d9c83f5b4fdb558e1058572c31.png)
![[Diagram]](../../diagrams/24/91bd1445608717e49eaec1c031624700.png)
![[Diagram]](../../diagrams/9/edb69c752cd4d55685ac8606ff97390f.png)
![[Diagram]](../../diagrams/52/4fad4f28b6be8e7a223f8850e61209dc.png)
![[Diagram]](../../diagrams/25/ed8b9cfdf5fe40af6e7ed4ae00046c9b.png)
![[Diagram]](../../diagrams/2/9c032b50eeb94acac875e3e3aa1c6159.png)
![[Diagram]](../../diagrams/52/b31983e9cbd29f6c7bc59ccb90fae2f6.png)
![[Diagram]](../../diagrams/27/6f1b741361d7344d972fd9e34a3c2861.png)
![[Diagram]](../../diagrams/9/71489e08f5723997676ab00d80949177.png)

![[Diagram]](../../diagrams/11/d9a4d97679253cafa17f8bf4b690930e.png)
![[Diagram]](../../diagrams/42/4d7a590ec95fa554075983b8f6b06120.png)
![[Diagram]](../../diagrams/20/0495efc9c73936489ecf9c43506fad05.png)
![[Diagram]](../../diagrams/29/26362cc4b1e337f805859d8a3f710937.png)
![[Diagram]](../../diagrams/30/ff3dea5a97eed24f09cc86c0a0a29a5f.png)
 A picture of me in Banff National Park (Canada, 2000)
![[Diagram]](../../diagrams/6/6f289531c4e26f6893300487c28752cc.png)
![[Diagram]](../../diagrams/48/284d6207dc4259957e66273ce68e4a4c.png)
![[Diagram]](../../diagrams/17/bd7aa91bd397b88ad293ff10bc491f6e.png)
![[Diagram]](../../diagrams/2/00bbbece6ef445731c421519e56fa082.png)


![[Diagram]](../../diagrams/51/e520e99fda92fede334d900439f3d092.png)
![[Diagram]](../../diagrams/3/0e9f93f500ea6cf7983a7e4c53abcd1f.png)
![[Diagram]](../../diagrams/17/d6dfbdd9be65133f4ddd096f34e71da9.png)
![[Diagram]](../../diagrams/39/8669f545286df3589d9f8be9849c6fdd.png)
![[Diagram]](../../diagrams/16/3ffebc4dd96b4ad166368dc8026bf10e.png)
![[Diagram]](../../diagrams/1/9393f35b83e9e1c54b524e7d96e69f13.png)
![[Diagram]](../../diagrams/36/31b959a97ab5bb69e7a26c6121e159b1.png)
![[Diagram]](../../diagrams/52/cc419a5c0f13c333eb63fe9d9507eee7.png)
![[Diagram]](../../diagrams/46/d799a14eda03693290994fd827501008.png)
![[Diagram]](../../diagrams/2/8017e3b0cda5adccb431df322d46cc16.png)
![[Diagram]](../../diagrams/52/fab8c7d39bb1a82848c1071bf697a91e.png)
![[Diagram]](../../diagrams/0/1e032e9a72b3ea47a81bddd23269046b.png)
![[Diagram]](../../diagrams/44/d19d7c74c363ae83e7ea37b2ac8e159d.png)
![[Diagram]](../../diagrams/39/59552b79d5607983f3233d0b88b5a613.png)
![[Diagram]](../../diagrams/22/9d1d1e17fc46abd224533569a4b2d570.png)
![[Diagram]](../../diagrams/18/628d4b27043ab758d119a9921057c1c2.png)
![[Diagram]](../../diagrams/52/7bbe6e6d4d42bf309dbe229699d05f1f.png)
![[Diagram]](../../diagrams/15/4228a6867e5ad511476ee06ed6578a2c.png)
![[Diagram]](../../diagrams/52/e44c8b2c98dd5cb0794835469b0cf198.png)
![[Diagram]](../../diagrams/16/bb39efb38f3ce14f28d5d7bf1260b671.png)
![[Diagram]](../../diagrams/5/9682d71b723e8372128b360c84d4ba24.png)
![[Diagram]](../../diagrams/11/cb518b9f7ce88554c8a864bb0f4d6e5f.png)
![[Diagram]](../../diagrams/49/07d711b1d203562234161ae4950221d5.png)
![[Diagram]](../../diagrams/40/988b7b8fbbc52b52fc27225cc3dcfda8.png)
![[Diagram]](../../diagrams/7/5ce57597121991987204378ac0cb5a40.png)
![[Diagram]](../../diagrams/2/6b55b0604223c99cbfd1d55e83e3de8c.png)
![[Diagram]](../../diagrams/29/ba69f59420e1527fc17cab0c6256699a.png)
![[Diagram]](../../diagrams/6/bbcb2d1a1e7ef8adc68e9506e73884bd.png)
![[Diagram]](../../diagrams/8/2d538dd226f446a3d662d1ee28657672.png)
![[Diagram]](../../diagrams/49/51ea3370b5135349ed869b28091e487f.png)
![[Diagram]](../../diagrams/42/e272954788cae6956fe8b34947e59231.png)
![[Diagram]](../../diagrams/37/2128c22f7a5a8ef2f2bb60dbed609990.png)
![[Diagram]](../../diagrams/21/f036e01ed004643d1780be47520f915a.png)
![[Diagram]](../../diagrams/41/eca3521e6ca4be771e9ca3ac276b7b38.png)
![[Diagram]](../../diagrams/4/e5e6714a8d34d3adcfc64240a13e5c20.png)
![[Diagram]](../../diagrams/14/c25412d0f2ec8502885ad6eb44168180.png)
![[Diagram]](../../diagrams/15/c0e9c8a5b4fbc9457b8a1d8db78ac460.png)
![[Diagram]](../../diagrams/41/961a01a86eec6ef1dcf4959eaf715be3.png)
![[Diagram]](../../diagrams/29/398d7161eb7838ae6603163f70868168.png)
![[Diagram]](../../diagrams/20/96a1e30ce09f23769524eeb3a86dd473.png)
![[Diagram]](../../diagrams/34/44dbdcff03134ac1f212eaeed81d47bd.png)
![[Diagram]](../../diagrams/30/ecea5b3abad52a7ec3070bb24d24bc98.png)
![[Diagram]](../../diagrams/22/30947239d9d054b78532b5e80f422a0d.png)
![[Diagram]](../../diagrams/34/7872dfe8ac8bdd1e33c3b07569b6796d.png)
![[Diagram]](../../diagrams/7/aa2dde29b6e199ac9242d42a95fd00de.png)
![[Diagram]](../../diagrams/0/448b5274f6ca3b1580e5c7678888a3bf.png)
![[Diagram]](../../diagrams/37/23a17ed2b086f5a86d36d9d8eed4f37b.png)
![[Diagram]](../../diagrams/18/b4edd7bf9cfb62ce82ff56d56befb628.png)
![[Diagram]](../../diagrams/30/9c3c3bcb4e25bed1c0d2dde70f1761cf.png)
![[Diagram]](../../diagrams/21/72f57e1391d76ad7a7efb3946abcfe00.png)
![[Diagram]](../../diagrams/35/48f5d3850cee47aeec8da2bf6d51278c.png)
![[Diagram]](../../diagrams/38/3ae0902b70050605c664b23bb4b91204.png)
![[Diagram]](../../diagrams/45/0ac317a55c0a933d7f56c05822e9fd5a.png)
![[Diagram]](../../diagrams/40/78b8467d18a663cca5bfe587d502a14d.png)
![[Diagram]](../../diagrams/9/ce341d95f3a3bb6ec6d1c1ae61681599.png)
![[Diagram]](../../diagrams/1/6451e85b65b6deb4502cb412fa85f435.png)
![[Diagram]](../../diagrams/11/b1d9a01be3c946b01afdbfd4ca326268.png)
![[Diagram]](../../diagrams/18/41eee3cc2befe5bddbcb740de4195e56.png)
![[Diagram]](../../diagrams/36/874c4edad1d0b805da3b8b015526bbd6.png)
![[Diagram]](../../diagrams/16/d563d18e4deacae4849c035d586d57bc.png)
![[Diagram]](../../diagrams/30/5252673b93da9752979f7e72eba30a43.png)
![[Diagram]](../../diagrams/9/1a53c681d2248e157bef37dc41c20687.png)
![[Diagram]](../../diagrams/42/662fef34d3f5a2ac2477196985d0166e.png)
![[Diagram]](../../diagrams/20/8f1a33bc39b2841034cc972846d814ae.png)
![[Diagram]](../../diagrams/28/f317463b38b894c721f136770ed12591.png)
![[Diagram]](../../diagrams/18/6d543b2c69f294ad1ccde5ba0fc1d5a3.png)
![[Diagram]](../../diagrams/31/5583fbe2df00a9a4726e22cf71ad56fc.png)
![[Diagram]](../../diagrams/30/cfcfe5d6bc0a25c4a5aba23dac6782d1.png)
![[Diagram]](../../diagrams/11/98146a114e6c20b17a23d5c99b096d01.png)
![[Diagram]](../../diagrams/39/49d7d6fae618dab4403a4c3d2e19327f.png)
![[Diagram]](../../diagrams/2/de89178be8259d1d5d3546639a7961af.png)
![[Diagram]](../../diagrams/13/23da3106bb71821c6d872ca43723c2ac.png)
![[Diagram]](../../diagrams/19/7931f65b7ce1f75d830ee4152515316a.png)
![[Diagram]](../../diagrams/42/cf92fd564a204592958d733a60d42327.png)
![[Diagram]](../../diagrams/0/8e312dcf751d228e5a4c2cfbe2989cb5.png)
![[Diagram]](../../diagrams/13/7d78a059e82a2f9ac04dd9d49ef93001.png)
![[Diagram]](../../diagrams/8/0a353dea08d5b7825d0563eb10090e0c.png)
![[Diagram]](../../diagrams/3/f281b6f7370a41eeb460472245afc51f.png)
![[Diagram]](../../diagrams/12/cf74137c3d87e22d4b33cfc8ad113f31.png)
![[Diagram]](../../diagrams/19/0d37dec26703e166013339dff418ff8c.png)
![[Diagram]](../../diagrams/4/8cdb0d490eca186ae3f3e77c74179f02.png)
![[Diagram]](../../diagrams/36/9957be47427dbf743b170cdd329b6ae4.png)
![[Diagram]](../../diagrams/52/a086b2169610c8f5ff1aea808de1bfaf.png)
![[Diagram]](../../diagrams/49/845c7d01d2576f92f4dbc5e0fe295ea8.png)
![[Diagram]](../../diagrams/0/467a95ba617f122a802f5089bdb090d3.png)
![[Diagram]](../../diagrams/45/d85b98c73808b83624c35c145b2225ff.png)
![[Diagram]](../../diagrams/49/06e5ce0d37e4a3c30038ba6300aa8ee1.png)
![[Diagram]](../../diagrams/7/a1609a9b9c7b3579e3c595ec1b29fc6c.png)
![[Diagram]](../../diagrams/14/38d1bbfddb00a39efe33b97f40cc5d1a.png)
![[Diagram]](../../diagrams/48/46aa0f7b9700eed1071d0ad6bdfe1fcd.png)
![[Diagram]](../../diagrams/4/18b6c57db0c1a13c352e0a92873eb902.png)
![[Diagram]](../../diagrams/45/f52bdf36047c55eec35e9d4f509aa79a.png)
![[Diagram]](../../diagrams/41/56ef91c9a8759d77d9a5357cc8cb0cea.png)
![[Diagram]](../../diagrams/28/5e80db5199d7c81a15e7e112b5f22ff9.png)
![[Diagram]](../../diagrams/36/1bba0b23d30b36ba5e8bfac1952439d3.png)
![[Diagram]](../../diagrams/31/e96aa8e5105284a9508388fdbb17abb2.png)
![[Diagram]](../../diagrams/2/be6ef2cbf2c9190181c6f3347b5fbd3a.png)
![[Diagram]](../../diagrams/9/a9096af1cb02eebac76bd961576567c0.png)
![[Diagram]](../../diagrams/31/5c8ecb505bc43c767077332bd67bbbf3.png)
![[Diagram]](../../diagrams/39/cb21c252690458cadbdbec9b66bda0c1.png)
![[Diagram]](../../diagrams/30/8a8ad4af390a44dc6474ad409ac6511a.png)
![[Diagram]](../../diagrams/35/a856f09b2cfd66b22f3c2dbdb4e911ab.png)
![[Diagram]](../../diagrams/32/eeb4eb7a9b2c6cb64cc4199573ce901a.png)
![[Diagram]](../../diagrams/23/b8980de79e0f8860f9249446e6fe5214.png)
![[Diagram]](../../diagrams/22/bea2699ac3fd5e8d0a23e94a0a32a2ab.png)
![[Diagram]](../../diagrams/8/c84c7778ebfdd1f6db524f00e2668b42.png)
![[Diagram]](../../diagrams/32/a5e79856eec4d5e5a189b6b3f0c099c4.png)
![[Diagram]](../../diagrams/16/00c707bdd1f247c27beb4b9fae6e7502.png)
![[Diagram]](../../diagrams/33/55ec92ddead91aa3af0b26fdae5f40d3.png)
![[Diagram]](../../diagrams/15/aa7fc5267c55c2b42c108802bfa8a713.png)
![[Diagram]](../../diagrams/2/2520098922cd6cebdff316ab11833a08.png)
![[Diagram]](../../diagrams/47/0b379a6e88f2118b18447ce936d5978e.png)
![[Diagram]](../../diagrams/31/2c3a97a82145424c077ea6f856831f60.png)
![[Diagram]](../../diagrams/6/4d50a5b5b5c519f920d3fad0bdbdcab7.png)
![[Diagram]](../../diagrams/4/fd9002c8e6a2233d047d746dbef53d06.png)
![[Diagram]](../../diagrams/14/e52d78286ad6f2adcf4b55fd54da5896.png)
![[Diagram]](../../diagrams/32/32d401f3f8a77651b9f305d9f915aaf4.png)
![[Diagram]](../../diagrams/39/d126581ec4f31c2429d5a245e1412ebd.png)
![[Diagram]](../../diagrams/19/a0aba93819c416fb405fac15a5e96d8e.png)
![[Diagram]](../../diagrams/20/8a2dc2c9b729d0c6dcda92ecbc669979.png)
![[Diagram]](../../diagrams/20/afec86e2c5d2336323734f38db96ad48.png)
![[Diagram]](../../diagrams/8/5e367d03f613750ac2eba542a8ff5705.png)
![[Diagram]](../../diagrams/50/d06a4bffa284d81594b58dd31819e8e5.png)
![[Diagram]](../../diagrams/34/4249e36f540c88cf6d342fab17b3883b.png)
![[Diagram]](../../diagrams/18/b5fe97990c29ed6aba861bc69920f9c8.png)
![[Diagram]](../../diagrams/34/b211a9ff00486ddca58c9710ee9d3d7c.png)
![[Diagram]](../../diagrams/1/27029b9626bfdc6856f07c99c3edaa71.png)
![[Diagram]](../../diagrams/32/1ffa7114cc6328033f4637e6c5e7bf92.png)
![[Diagram]](../../diagrams/12/0863d02f2651d7174a558e98deabc676.png)
![[Diagram]](../../diagrams/27/d799b2f9711a1b605dbe527d88f46147.png)
![[Diagram]](../../diagrams/48/89ab5886c5531156c355603b32a938bf.png)
![[Diagram]](../../diagrams/5/c0665a9fe5805b66b4ae81312845f938.png)
![[Diagram]](../../diagrams/22/4ae978c34e91852d5c51a98b3f53188c.png)
![[Diagram]](../../diagrams/19/b881508a033c2f70e5ba7befe2baf475.png)
![[Diagram]](../../diagrams/50/1ddad2be22dc3d3675be8753347144bb.png)
![[Diagram]](../../diagrams/30/4fb957770f92034792ecacdc3e29bcca.png)
![[Diagram]](../../diagrams/1/6ec484c5f151fb1b09c2221a4b4b07d9.png)
![[Diagram]](../../diagrams/7/7e1afcbbe60d3f001cd4882b107ee65f.png)
![[Diagram]](../../diagrams/9/268b4d060e33d9784afc087ce1bdf9f5.png)
![[Diagram]](../../diagrams/19/06a434fc9605af0006aa0498285a73bb.png)
![[Diagram]](../../diagrams/52/c6b80fd7a496f9b5997f04517f8ea14b.png)
![[Diagram]](../../diagrams/42/d47443fb6782ca245959e148a0458b0a.png)
![[Diagram]](../../diagrams/35/a56010b3cedd505f777c138134e4f94d.png)
![[Diagram]](../../diagrams/36/8379507b3c4f4d5df57fe5b95141a598.png)
![[Diagram]](../../diagrams/29/032a784388241be1efdd63b47675e80b.png)
![[Diagram]](../../diagrams/38/52942ec34654f26b7b6f3d747e784f74.png)
![[Diagram]](../../diagrams/13/5cf2b10c4760da0a517908a3593091a7.png)
![[Diagram]](../../diagrams/15/c94ea1c6df1b99eb9735a547e0018197.png)
![[Diagram]](../../diagrams/3/92bd8cddc301d5cc028fdac880391e4f.png)
![[Diagram]](../../diagrams/4/8528ac2108157e0ba448375443a7bca1.png)
![[Diagram]](../../diagrams/38/d6240559efd3febcdb09ab79e0ce773a.png)
![[Diagram]](../../diagrams/0/9deb31828aeebc43739268a7f6a31bc7.png)
![[Diagram]](../../diagrams/41/28946e2fab71c1f0a4959615e2de0dd0.png)
![[Diagram]](../../diagrams/39/ed96345af1418978821819171757dd4c.png)
![[Diagram]](../../diagrams/36/93def6217f4401137d9cd78e8800eeee.png)
![[Diagram]](../../diagrams/12/ec6257a17bc9a0b6b7f80268f8fc5047.png)
![[Diagram]](../../diagrams/17/3b47231981e3925f2926b4f85429a23b.png)
![[Diagram]](../../diagrams/25/f38c2c6e28331139e378906954a1b0a3.png)
![[Diagram]](../../diagrams/48/c29f734d0f2fc1a9c52123c49b43b929.png)
![[Diagram]](../../diagrams/12/3fd8e04946b12576d49c11f0846c3c28.png)
![[Diagram]](../../diagrams/41/7ad1024fe839e3b709a051a5c74c8692.png)
![[Diagram]](../../diagrams/30/cb0da0344ac4291bb4ea2cd4f0e5e52b.png)
![[Diagram]](../../diagrams/18/b7c9d267142544c1071edb26817e0a96.png)
![[Diagram]](../../diagrams/51/fabe1ca2bf179b666aaaf4505051e268.png)
![[Diagram]](../../diagrams/25/fcba066804900ac0bde5ff1e7424dc39.png)
![[Diagram]](../../diagrams/1/2e57e14d019b477c0009624edbe68c24.png)
![[Diagram]](../../diagrams/47/268ef36695e6cb98f920d57d78ec066b.png)
![[Diagram]](../../diagrams/20/0d0f2b1cfe7d5aa79ee3bea41177c8a9.png)
![[Diagram]](../../diagrams/5/0836780519ccd9fb381742d0740d976f.png)
![[Diagram]](../../diagrams/34/4263be8abf4c62a19cd683a513340dc3.png)
![[Diagram]](../../diagrams/5/c82dd1cb27e8030d53a8c5e7ef33efcc.png)
![[Diagram]](../../diagrams/4/48a621692dced3e57c3437f4b6cc6e2c.png)
![[Diagram]](../../diagrams/29/5794ee237462b547048028111131f57d.png)
![[Diagram]](../../diagrams/33/0bd9ce8cdece8c52b23e82396ad40a5b.png)
![[Diagram]](../../diagrams/27/c23daabc6b70890e12b4e1b3bd543246.png)
![[Diagram]](../../diagrams/50/edd1919dd10770b82832d12f0597db92.png)
![[Diagram]](../../diagrams/24/7915bd0abf56e53ac5840d21e48e1a21.png)
![[Diagram]](../../diagrams/0/0bdd792f2a79ed9251e27f06b63f664e.png)
![[Diagram]](../../diagrams/47/2f4f4d81b40df9046d2631a20536ab56.png)
![[Diagram]](../../diagrams/50/88b27f418fcf4bf3a657afff46eb55be.png)
![[Diagram]](../../diagrams/21/f334a203cc1832eeeaf789fba2bac73f.png)
![[Diagram]](../../diagrams/25/5470d6acf47f2c7fe47aeec64a505419.png)
![[Diagram]](../../diagrams/0/93d66ce1aed9601b0e966fdb32899c94.png)
![[Diagram]](../../diagrams/45/4693a5362672bc761a4b85ac3846b3ce.png)
![[Diagram]](../../diagrams/22/75af97e689fe49c16135e6b81baa9bc0.png)
![[Diagram]](../../diagrams/29/251bdbeabf291f86a8706af7a3846977.png)
![[Diagram]](../../diagrams/52/e58c2e595b0d5e254544593052319870.png)
![[Diagram]](../../diagrams/9/2c642fa8f0bcf6660ee8191cd0244c73.png)
![[Diagram]](../../diagrams/32/b6da7a898d6e625fda3ec15b119495bb.png)
![[Diagram]](../../diagrams/10/08332ad59140caa7780acb9b25d026ca.png)
![[Diagram]](../../diagrams/14/ce67f393793427902ac895f19a09e73d.png)
![[Diagram]](../../diagrams/21/d088fee630ec2d4cccf3578a616da7ce.png)
![[Diagram]](../../diagrams/25/cb946f811f5c1402652e845d04feaf02.png)
![[Diagram]](../../diagrams/21/b9348be57ca5945e4bf0038be1302e4a.png)
![[Diagram]](../../diagrams/31/469d0a004dcb542b13996baae2a46bae.png)
![[Diagram]](../../diagrams/7/ffd2d8653d3d2a26c1a5c143c2ac1b80.png)
![[Diagram]](../../diagrams/43/237df85775e4af69fecf9ec9985a9df9.png)
![[Diagram]](../../diagrams/37/3f40e1ddac1cf89c248f5de134141b4f.png)
![[Diagram]](../../diagrams/16/2ae0343062fca6b56bb811a39fa48b4a.png)
![[Diagram]](../../diagrams/34/8a8cde362cc9e9792068c21f023c58c3.png)
![[Diagram]](../../diagrams/45/163c6dac0e9cde4685718c57df3975ad.png)
![[Diagram]](../../diagrams/45/7867c813e9c82912359280f44f8a7664.png)
![[Diagram]](../../diagrams/12/118ce6d2aed0a2543c79ee94bb927bff.png)
![[Diagram]](../../diagrams/1/698970b072b851485e205d11a544c265.png)
![[Diagram]](../../diagrams/26/1ae0400dd9cd2d7541a992e6fd07b5d1.png)
![[Diagram]](../../diagrams/52/a6532ee91af6d5f771c0701e763f239b.png)
![[Diagram]](../../diagrams/26/cabb3396de0ad307d137c112ff15a03c.png)
![[Diagram]](../../diagrams/10/fa9e0a6a53c29928cdc10763feb0b9bc.png)
![[Diagram]](../../diagrams/17/5a953372ffdd4a64d2183156627d15d7.png)
![[Diagram]](../../diagrams/13/8cf0443cc3b947cf9c27c6ba7a3d6c35.png)
![[Diagram]](../../diagrams/1/77b6ccf2a4061aa655b77a88c33ef6da.png)
![[Diagram]](../../diagrams/26/73ba579b8f5cf2ab837790e350b81d00.png)
![[Diagram]](../../diagrams/0/77f09d6cc58ddf0bbdf5083eca22e627.png)
![[Diagram]](../../diagrams/39/840a2046fd1d4bd77a8c40c42845a2eb.png)
![[Diagram]](../../diagrams/44/80702a0a9c8067a814dcaf01bb94ecc5.png)
![[Diagram]](../../diagrams/34/25e8a515be551f83489248dc73dcedce.png)
![[Diagram]](../../diagrams/19/784013377061a5a51dc842748a0367a6.png)
![[Diagram]](../../diagrams/47/0c00bb46d1de68939cfba9a359a3ea05.png)
![[Diagram]](../../diagrams/18/c0c8d6850fabe62c5a10503a0d8b3188.png)
![[Diagram]](../../diagrams/38/e4d9d43013f94d16b967c5b71e289b4e.png)
![[Diagram]](../../diagrams/2/e61517bbb48832b78902798a98dc00bb.png)
![[Diagram]](../../diagrams/3/e9aa5dd7973629806d49e0ecf9b95582.png)
![[Diagram]](../../diagrams/32/85ddcf64ca25d95bb2924dcd0e8e07f8.png)
![[Diagram]](../../diagrams/16/f82513563ca82e0ec02865acb0dea07f.png)
![[Diagram]](../../diagrams/16/df8316e12db3b2ae38a6f1f6db31a0ca.png)
![[Diagram]](../../diagrams/36/070107647a5c6983a83fe3a9fb07da3c.png)
![[Diagram]](../../diagrams/20/c09e091cd82c463d8441b3ce026125b7.png)
![[Diagram]](../../diagrams/5/b0724799f22fceabb1a438a5b0fe4429.png)
![[Diagram]](../../diagrams/43/1c95eb9944a923e02f2b374a01c9cf0f.png)
![[Diagram]](../../diagrams/13/592306e4956ef954d3c51c931abed22c.png)
![[Diagram]](../../diagrams/0/915b69c35bacbc38041e3824d10a6eda.png)
![[Diagram]](../../diagrams/2/fb0fd67f20141ddb01edaeb5c6d2b7e1.png)
![[Diagram]](../../diagrams/9/71f39c5c1b22648b9ea75bb584c39e2b.png)
![[Diagram]](../../diagrams/18/27194a0cf425d1dbe81b422d4143fca4.png)
![[Diagram]](../../diagrams/21/705536586cf5df1b817a28516b17ea51.png)
![[Diagram]](../../diagrams/26/67b0197caa60d7a4b3d90797becbd25c.png)
![[Diagram]](../../diagrams/31/08c23835bcaf07fc095c2f887ca55324.png)
![[Diagram]](../../diagrams/37/49e73e9031179c7e2320b5707741838d.png)
![[Diagram]](../../diagrams/22/482805a9bfc45ab044e9cc66dd7c0860.png)
![[Diagram]](../../diagrams/43/f8d74b2410094bb25df5fa02a8617a2e.png)
![[Diagram]](../../diagrams/8/58d546cd761df1f83c2facbc8605f480.png)
![[Diagram]](../../diagrams/30/3919274af7ef9ed23a87d3b37080357e.png)
![[Diagram]](../../diagrams/30/00339f8c0139ef3c374a346a6cd22f12.png)
![[Diagram]](../../diagrams/20/328010a111750d0e076a00aa39a8e001.png)
![[Diagram]](../../diagrams/38/3c04082fe0502662275e634260209130.png)
![[Diagram]](../../diagrams/39/ca4cb3d5631d835c8f163493e9b2ce48.png)
![[Diagram]](../../diagrams/35/b5396c8c74b8bfa09b2c35c207ede5da.png)
![[Diagram]](../../diagrams/33/3459882645c9587e814ecc855e142a3c.png)
![[Diagram]](../../diagrams/16/5b1679a5306a0e3ba6c61954a209fa87.png)
![[Diagram]](../../diagrams/52/ca5429d91ae37433df57934f3f8969b2.png)
![[Diagram]](../../diagrams/44/a2428ac92aeca219b1e9c20e6f4992eb.png)
![[Diagram]](../../diagrams/45/b9f96050be6a0e0d3c06582a8237ed1b.png)
![[Diagram]](../../diagrams/9/bbbdc98d1260804fe10049eb0cebffa7.png)
![[Diagram]](../../diagrams/16/f12325b8f89fa09d925d6dd57932a1f5.png)
![[Diagram]](../../diagrams/48/8fa651d9f20b02a89ba10fa9e50d6289.png)
![[Diagram]](../../diagrams/1/e694963874f909bbc4f1aa0199a9ddf8.png)
![[Diagram]](../../diagrams/28/bdae564018aa9c13280a0f12f7fbc211.png)
![[Diagram]](../../diagrams/11/c611817363e1d19980424e2e2e279c67.png)
![[Diagram]](../../diagrams/20/53097c5059a16bd398e41df6c4a21f03.png)
![[Diagram]](../../diagrams/48/3b41598769c41cbb14b835a60d2c0dbc.png)
![[Diagram]](../../diagrams/7/9d2a74dea69252efe4703f4082da5585.png)
![[Diagram]](../../diagrams/45/47a0dfcf57681b7a183d8a876a9a969c.png)
![[Diagram]](../../diagrams/34/d698815e19610e3112ec21166b30b2c5.png)
![[Diagram]](../../diagrams/14/cb00e1c3a0391a4d5fa5910ccaf9a7f0.png)
![[Diagram]](../../diagrams/38/651b92b84ea45763e937cf0d8cd231e8.png)
![[Diagram]](../../diagrams/16/23a30f314937f2bced2d5bab389076e8.png)
![[Diagram]](../../diagrams/26/aaf4cd96d60cf85fa56c9635aa9ead8f.png)
![[Diagram]](../../diagrams/20/8fc0c8d7d08df05e873738ee8962286e.png)
![[Diagram]](../../diagrams/39/a9fc37b32b7b99294dd9615438f81423.png)
![[Diagram]](../../diagrams/25/1d84c9aebcc189aa820a3ac923922d48.png)
![[Diagram]](../../diagrams/39/2eef99a0e2e9c58bfad2cbc8d7788ba4.png)
![[Diagram]](../../diagrams/6/f38adf0bbee53027218a5102d0b6aa2d.png)
![[Diagram]](../../diagrams/43/62f3014dda5801d453fd786025613e64.png)
![[Diagram]](../../diagrams/16/9d092b6272b587547f84132ee502e386.png)
![[Diagram]](../../diagrams/46/19a0470b4500e5849da9fa6542bd896f.png)
![[Diagram]](../../diagrams/51/c04079590840ccf88b00645428e99351.png)
![[Diagram]](../../diagrams/40/d4be99054f0271ce24dff1701521401d.png)
![[Diagram]](../../diagrams/36/004dbe306ef3d3ed267489c1a9d2e986.png)
![[Diagram]](../../diagrams/50/8bc149e21b163826e401780cff74810f.png)
![[Diagram]](../../diagrams/16/048f431084d1e17d26418651e5d33152.png)
![[Diagram]](../../diagrams/16/1625c0f27f06ca7e2f61997d8a2ee570.png)
![[Diagram]](../../diagrams/46/ca5543c684b2de22400220bf1680c551.png)
![[Diagram]](../../diagrams/27/0c31661e62e4dedd2580b030249d0a5e.png)
![[Diagram]](../../diagrams/5/f6d83450c5a6695d1bc565cf47de4472.png)
![[Diagram]](../../diagrams/10/f68f07db3feaf1bf5a1825e53b482a22.png)
![[Diagram]](../../diagrams/38/f6da283767f19c10fbe2f4d1466684e7.png)
![[Diagram]](../../diagrams/50/1729dbb0a24436d8839edd19b5ba8a68.png)
![[Diagram]](../../diagrams/34/d43d55bf7c8f4faf814d6e8b76d3681c.png)
![[Diagram]](../../diagrams/37/cb884090956dd0a1416afefabdab859d.png)
![[Diagram]](../../diagrams/43/31cc81d18a4a30e348e359d6dc3845ea.png)
![[Diagram]](../../diagrams/30/196adf2fe3d8e138fcda48b5b90ac560.png)
![[Diagram]](../../diagrams/13/b67d747eac8bafd039d1a63d71ac2f57.png)
![[Diagram]](../../diagrams/51/2554be0119064b4f2a3e53d5c23d33c2.png)
![[Diagram]](../../diagrams/1/8c9cdbb32c307ab0769793be9dd38f85.png)
![[Diagram]](../../diagrams/18/1e06d68acf3d97c7f283c9d90830268a.png)
![[Diagram]](../../diagrams/29/5ebdac6f2900ae1c07edf6cef183ac45.png)
![[Diagram]](../../diagrams/21/af51bc1f5c2e2ee0405c6f0da210ec17.png)
![[Diagram]](../../diagrams/30/c0890c64c9773f944a95de76e5feaece.png)
![[Diagram]](../../diagrams/1/1154d85a50b160bea914ad16bd963660.png)
![[Diagram]](../../diagrams/3/b2c1350eed487c459809503d2a86cdb2.png)
![[Diagram]](../../diagrams/0/84035634bc943784f66b3817a3593baa.png)
![[Diagram]](../../diagrams/29/9d469bcd515270c8cc9b572eed5adfd1.png)
![[Diagram]](../../diagrams/14/624f0112220ca4e450737021cf2c4603.png)
![[Diagram]](../../diagrams/46/02ba8582d05e94ec0eaeb8931a190d45.png)
![[Diagram]](../../diagrams/24/93c3d2b90b4a9522b16aa16b7b257e84.png)
![[Diagram]](../../diagrams/18/e2c937b40888492694e7291c9abdd8bc.png)
![[Diagram]](../../diagrams/13/134f08dbaee3fe3dbde99837142e98d8.png)
![[Diagram]](../../diagrams/19/2ae89a91bea763117e29791ac29466bd.png)
![[Diagram]](../../diagrams/31/056355d552204b6432cc4e05fd35d003.png)
![[Diagram]](../../diagrams/8/2e8fee90e866e94f38413c6ecc49bb11.png)
![[Diagram]](../../diagrams/4/af405e282b58cb882b88e2ab5fc19187.png)
![[Diagram]](../../diagrams/37/386afac745ada3c776f9d35d87870d70.png)
![[Diagram]](../../diagrams/19/9a90f1292098608ead8b72407d153967.png)
![[Diagram]](../../diagrams/8/9d5be60e297c1709dd2340836af8eb3e.png)
![[Diagram]](../../diagrams/11/afbf2cf4437265d09ea952a79f8e9507.png)
![[Diagram]](../../diagrams/20/cda4fc8f8c56fb34b39aa320ef929e20.png)
![[Diagram]](../../diagrams/24/a244bff450532757027f4159860fdeb6.png)
![[Diagram]](../../diagrams/47/f7f3c2b8ac9792aa4c7f633434645e89.png)
![[Diagram]](../../diagrams/4/677a036d3fec4787ed47542b915139eb.png)
![[Diagram]](../../diagrams/43/a68b9c7a28d40ea746f35713f8e9aee5.png)
![[Diagram]](../../diagrams/6/9947bf6056dcef4a7a6c301ea7a039d1.png)
![[Diagram]](../../diagrams/36/9baa019bf2cf3262f7cc1b3f48e06760.png)
![[Diagram]](../../diagrams/27/dbf5d599612bb97d077e92c065e058fb.png)
![[Diagram]](../../diagrams/7/99c09f16972257ccdfbe4ef252c3f235.png)
![[Diagram]](../../diagrams/43/9ce06dadedf1bdae3417ce59da81e981.png)
![[Diagram]](../../diagrams/52/1898835b835606115649c1c970edbef8.png)
![[Diagram]](../../diagrams/12/45773f1386757d7a268bdba88fdc3c92.png)
![[Diagram]](../../diagrams/46/432ce161c1d160313b9f8b01470116cb.png)
![[Diagram]](../../diagrams/1/4b1c618ced751aa15c42c87c02341ab0.png)
![[Diagram]](../../diagrams/25/961d52535e52a2556ddf9e2b97c1fd1a.png)
![[Diagram]](../../diagrams/52/b9d3f442b6dc22bbf48354e186e3603a.png)
![[Diagram]](../../diagrams/29/ed54d5d1d9ce7629ee43ac4a7fa1b7ce.png)
![[Diagram]](../../diagrams/40/cf570657fd33910efba8044bae5fad4a.png)
![[Diagram]](../../diagrams/29/9fdc9ebc01ba68d7830bcd5e1e24d7ad.png)
![[Diagram]](../../diagrams/4/63b9ae0c2a3b00e2ef8b7ae1ce1f60e5.png)
![[Diagram]](../../diagrams/44/c1c2f50b81c31bd79507824d8363e466.png)
![[Diagram]](../../diagrams/16/05196edd9d0af35a775f02c79b3a63f5.png)
![[Diagram]](../../diagrams/35/f9fdffe4b893d21424a76aad102bf59c.png)
![[Diagram]](../../diagrams/45/c376a33d940355e29694fb205133745a.png)
![[Diagram]](../../diagrams/50/2fd25a4f059e0e150db01a2d125e7773.png)
![[Diagram]](../../diagrams/15/302d85108283d7a73348d5b9eab69f69.png)
![[Diagram]](../../diagrams/39/c74801e7219863f6b801b4dc0815a634.png)
![[Diagram]](../../diagrams/37/58e528919df36bf05bdad8e04e70f4ee.png)
![[Diagram]](../../diagrams/14/1a8318ac0651c419557e145f42b54647.png)
![[Diagram]](../../diagrams/30/5cded690e4e4c718f3ee89f1d68d9a8c.png)
![[Diagram]](../../diagrams/40/ed5890c88bd2afafb6ef12afc08a5c56.png)
![[Diagram]](../../diagrams/37/761f768defc4ee21cc53a0be927c69af.png)
![[Diagram]](../../diagrams/10/c7b799ad8941e5a89b130273fda4dabb.png)
![[Diagram]](../../diagrams/40/678b9258872103ed669116a86cbd2e94.png)
![[Diagram]](../../diagrams/43/777f147b925a9472548b01408e0aa971.png)
![[Diagram]](../../diagrams/38/09291800c72dbaa4df54bcaf9810fed6.png)
![[Diagram]](../../diagrams/45/c17d4815612cc3d6cce8376aeab00263.png)
![[Diagram]](../../diagrams/6/caaef883f775b8cf4f554ec0bc0602b2.png)
![[Diagram]](../../diagrams/45/343b5c77a99b8c9022c0c35894c78c24.png)
![[Diagram]](../../diagrams/44/227a795c70f10d7cc14ca5ea21b4bee2.png)
![[Diagram]](../../diagrams/38/c1bd9c61924c2097eaef4d588fb500f6.png)
![[Diagram]](../../diagrams/21/0e00479edb95aa97dbe77c1b740e8790.png)
![[Diagram]](../../diagrams/0/00e50416f5ddf411737fc0f28a282eed.png)
![[Diagram]](../../diagrams/6/4c8d75ec0a8d3f083d1f7a1c68cd581e.png)
![[Diagram]](../../diagrams/5/95697ae73fda2444eb50ea258bce5ed1.png)
![[Diagram]](../../diagrams/45/91ab3a4b4b42fca9a898c4303384f870.png)
![[Diagram]](../../diagrams/9/d0c7d334c18f9a72279dca0705f0f3a1.png)
![[Diagram]](../../diagrams/2/89b391dc56627a4c709d2a64028efca0.png)
![[Diagram]](../../diagrams/8/a817e21daa00815578eec5b1f76ce417.png)
![[Diagram]](../../diagrams/1/99a8804cec8dfd229e7ecff94aa4ad02.png)
![[Diagram]](../../diagrams/49/147a40df3f1a903d0106b49152830eaf.png)
![[Diagram]](../../diagrams/37/c4ffa0b3a7924662f365e75d12dffe7c.png)
![[Diagram]](../../diagrams/28/e5c6b6294a19f33836ca53c6a2b89e81.png)
![[Diagram]](../../diagrams/28/6cb50cff8c69f3edeeeee05e6fe7ac1d.png)
![[Diagram]](../../diagrams/13/fb657b8d5ef9212b12090229091f480f.png)
![[Diagram]](../../diagrams/33/b3cd8595081aa2a216beaac57460e0ac.png)
![[Diagram]](../../diagrams/46/48d595554bc26476f504d41d3f63d91f.png)
![[Diagram]](../../diagrams/35/361c7ce96de93c0407c48ac95ed8ff12.png)
![[Diagram]](../../diagrams/22/ed5aa9cb97cbe26e8beedc5cecff8bd7.png)
![[Diagram]](../../diagrams/29/70eeb2f0bbe4f97b65f1d2fd3985a153.png)
![[Diagram]](../../diagrams/20/01201c15fd73f8f949905039ab70d4bb.png)
![[Diagram]](../../diagrams/40/e66cdd2a20ffd351c291693484e9fd45.png)
![[Diagram]](../../diagrams/26/230f1bc9de49c8eb49377a7accbd5b3c.png)
![[Diagram]](../../diagrams/34/5909008f87a517f565853074a5789060.png)
![[Diagram]](../../diagrams/15/19997edf7caf8e82164344413d326ae9.png)
![[Diagram]](../../diagrams/42/0da58ebd7bba94af421d477a611f8ebb.png)
![[Diagram]](../../diagrams/2/adb5bb6689f5835f0387e75ecf61b8c2.png)
![[Diagram]](../../diagrams/4/a839329d4a62051a1db50f46d3a4cf2b.png)
![[Diagram]](../../diagrams/21/43172391e074fe4ab553cf77a336ed7f.png)
![[Diagram]](../../diagrams/39/b39535f607478dd1448651765e6879ec.png)
![[Diagram]](../../diagrams/28/376c04acdd85c4cc785389df9a191c29.png)
![[Diagram]](../../diagrams/15/b207e93ced55027a417322baf233c51d.png)
![[Diagram]](../../diagrams/44/fab40951fde53f9e9bd2fa34a97c22af.png)
![[Diagram]](../../diagrams/27/eda9f85be34600944237acfc501183e4.png)
![[Diagram]](../../diagrams/5/d7cdb1fc050974eff120dfac961f1e26.png)
![[Diagram]](../../diagrams/4/b9829fcda1f0aa1c7c985356f7e9e74a.png)
![[Diagram]](../../diagrams/7/19ffd396e7d33acac0113de4e9a7e65c.png)
![[Diagram]](../../diagrams/35/b135df5cad34d542ea212e8082dc8b54.png)
![[Diagram]](../../diagrams/33/b116fd232e1694ed0dda81ea23706c6e.png)
![[Diagram]](../../diagrams/39/a5576bc651e7cae58766b4fd694dceab.png)
![[Diagram]](../../diagrams/20/3041c0e796c7b7688aada4bc6ae79158.png)
![[Diagram]](../../diagrams/42/ec63e34531af936d6d028a923f0a9922.png)
![[Diagram]](../../diagrams/7/bd0eb92960a9b63981c797210e4b7627.png)
![[Diagram]](../../diagrams/25/0954598a357414c9886e73cedd091d0d.png)
![[Diagram]](../../diagrams/43/b4311457fd8ae58d1140fa3f124fd6e6.png)
![[Diagram]](../../diagrams/21/de2119547498dd3c6bde72b1a74da314.png)
![[Diagram]](../../diagrams/15/4d802be881ca32d52cb5c9715b0b3140.png)
![[Diagram]](../../diagrams/33/3715806eb6ba30288e3330b47c0538b5.png)
![[Diagram]](../../diagrams/52/cdd0b83d7e1b5becb3716ba99bfb035e.png)
![[Diagram]](../../diagrams/35/d7a3fec5a6c7aaea7a74acd7c4f87908.png)
![[Diagram]](../../diagrams/18/84402ebabc3416ab4e932024aa9e2c0d.png)
![[Diagram]](../../diagrams/17/97860855b8dbbed5aadc849a7ce1cf27.png)
![[Diagram]](../../diagrams/12/e99b0234a7443f345dea2305572f1bbc.png)
![[Diagram]](../../diagrams/4/b1dbd37c9a28b84dd87ceff48341bbab.png)
![[Diagram]](../../diagrams/31/926978900c082d648736302339ba2585.png)
![[Diagram]](../../diagrams/13/b0d34f91c316ea07e84eda005a5d33b8.png)
![[Diagram]](../../diagrams/47/e7dd8a64942b2c985b9eababaae1e88a.png)
![[Diagram]](../../diagrams/29/009083f37454bc010ea0bc84312e2130.png)
![[Diagram]](../../diagrams/2/f42d05372b417c0f900fcd4b9828c8f4.png)
![[Diagram]](../../diagrams/38/d6fde6bbc0edf45e583e434bae7f1d61.png)
![[Diagram]](../../diagrams/38/3997d885bc53f4860201d24953e0357d.png)
![[Diagram]](../../diagrams/43/01e8deddb4e86bff7ef4ea350cb9ed0c.png)
![[Diagram]](../../diagrams/9/67f2ff19457949ea226613f5e9e03bb3.png)
![[Diagram]](../../diagrams/32/5bd5f553158ae58fcbbab9898e092cc9.png)
![[Diagram]](../../diagrams/46/be141e5cd73daefd9ad1e4d63d471cb3.png)
![[Diagram]](../../diagrams/16/046b6fc052558408f7792148fba00a67.png)
![[Diagram]](../../diagrams/44/e008e835f65bc48afb67934101a82969.png)
![[Diagram]](../../diagrams/18/347224bb5c704d146dfd10e82ad23533.png)
![[Diagram]](../../diagrams/32/88c739de701cc81dbb504ec851611c77.png)
![[Diagram]](../../diagrams/52/bdc84a0ba9bfcac1cc2f663456dd0efd.png)
![[Diagram]](../../diagrams/37/74d0e37d9ba3808ac94371403fe50afb.png)
![[Diagram]](../../diagrams/34/d0b9aaf3fd302e5c0b0fac281d23cc2c.png)
![[Diagram]](../../diagrams/48/c37087cc682f4d1c78b5b0ad792572e0.png)
![[Diagram]](../../diagrams/32/6d4b397eb073a71ac42952409e5f296b.png)
![[Diagram]](../../diagrams/10/ff20886a08def432dc2ac5f7a7e1c7c6.png)
![[Diagram]](../../diagrams/32/f1e5c4f20965aad5557e985143a92134.png)
![[Diagram]](../../diagrams/6/839a553ba7cbe487d0ca1e036041da7d.png)
![[Diagram]](../../diagrams/4/2c9cfbf95aa31b5ff88f7e17b18a61a8.png)
![[Diagram]](../../diagrams/36/5295155894c3e3f2bdd5e0598def39ad.png)
![[Diagram]](../../diagrams/25/26a37792e88f318c5a85d15f1a8cde8f.png)
![[Diagram]](../../diagrams/42/3b20826e467af570d8dc7f439423ed03.png)
![[Diagram]](../../diagrams/43/fd145d791e9ad19cf223e9de70dfb833.png)
![[Diagram]](../../diagrams/25/c7cf7da35a201d85f3602336d179864e.png)
![[Diagram]](../../diagrams/49/ede6bc91a4cb4b475812c8dd73069c9d.png)
![[Diagram]](../../diagrams/12/2ba70a9a658f366eda228affd23a3c12.png)
![[Diagram]](../../diagrams/43/7f601c4c9bfd6016f7d730e455b60dc8.png)
![[Diagram]](../../diagrams/26/72dfaed2ba354687e7f516b382e6e85a.png)
![[Diagram]](../../diagrams/4/906cafea93621e0524403f446a55e970.png)
![[Diagram]](../../diagrams/33/be002bf8fc1b3f2b67a870ebaf910db5.png)
![[Diagram]](../../diagrams/16/298fc6ca4324b0a1c06d2547265a3234.png)
![[Diagram]](../../diagrams/40/4ef4f93f5929616ae9d3c54be30a123c.png)
![[Diagram]](../../diagrams/5/081a7d96528b2d1d6c35512ad6e6b33a.png)
![[Diagram]](../../diagrams/20/403096f7faf13d03628a6929b6a7c8b8.png)
![[Diagram]](../../diagrams/12/07da7798f1af4c8ba5426d141c2bd82e.png)
![[Diagram]](../../diagrams/24/d181d9c0b758d963191f550b744440c2.png)
![[Diagram]](../../diagrams/26/dee3a7cafaf1ac078ca824eec456abd1.png)
![[Diagram]](../../diagrams/14/f75c50b6e651f8a63417b2629144b055.png)
![[Diagram]](../../diagrams/31/51ce8197da8e01ebd565ac7b04d9e2c4.png)
![[Diagram]](../../diagrams/4/4e661157206a5c8f27f33bda9ae2a6d8.png)
![[Diagram]](../../diagrams/6/0715ed8687ac02f900efcee1bafb4281.png)
![[Diagram]](../../diagrams/16/06e56fd2f7bb121082a10c9ffc7c3880.png)
![[Diagram]](../../diagrams/19/a36dc5aa4efda631d4431406b1e5fa0c.png)
![[Diagram]](../../diagrams/26/3a5c280c91a95417c966e9aa1621d5c4.png)
![[Diagram]](../../diagrams/51/ffa0565994d38f7313e6d8e32a061230.png)
![[Diagram]](../../diagrams/22/70b127cba5b76eb96bd2ba94ca53c443.png)
![[Diagram]](../../diagrams/13/7c56c74c286b9c2120cecfa43cc9c407.png)
![[Diagram]](../../diagrams/48/f243e12b907f0ff758fc804b199d1b0d.png)
![[Diagram]](../../diagrams/37/1bd662329dc81e5e001b23d40f07fde1.png)
![[Diagram]](../../diagrams/10/ebd9eb21110e8d4146aeb50861758efa.png)
![[Diagram]](../../diagrams/15/e715354447dc986a2ba15043efbbcad2.png)
![[Diagram]](../../diagrams/17/8e40dafebb1e06149f508ed6d7bb9fa9.png)
![[Diagram]](../../diagrams/42/e9571396d7858ad4b0e812a63c5aa028.png)
![[Diagram]](../../diagrams/42/f9f7198c96249bf283816245106819f1.png)
![[Diagram]](../../diagrams/25/dbbdcd3237716d029ae3696ec7f3a950.png)
![[Diagram]](../../diagrams/7/7e4c0e1d8124f1f157644be92e9dfd9a.png)
![[Diagram]](../../diagrams/28/95ffe715823a9cb29b9f0d6cb0d4b4ca.png)
![[Diagram]](../../diagrams/4/0464e79470df8b634f3b72fd6a1f6221.png)
![[Diagram]](../../diagrams/22/944d0882b7a4f654effa25c47460f1e7.png)
![[Diagram]](../../diagrams/29/c3e77bcbe0c34d096762cee5fc96a570.png)
![[Diagram]](../../diagrams/43/63cc21ad220e96fba8bbd9d9e6955481.png)
![[Diagram]](../../diagrams/9/7bb2be520fe839497bba61e59facc4d8.png)
![[Diagram]](../../diagrams/34/36e4648364c64e37a609aeaefc6687c7.png)
![[Diagram]](../../diagrams/16/47d2e1af83d275cc3da890ccca6940df.png)
![[Diagram]](../../diagrams/29/efca5b45c60172376958546283af9e0d.png)
![[Diagram]](../../diagrams/2/24a6f3d12362832cccfb0fb702e90f5f.png)
![[Diagram]](../../diagrams/15/7c16e1a677e525acb9df7e15ad0807a4.png)
![[Diagram]](../../diagrams/26/ab7c99438fee8f311cd725d14333530d.png)
![[Diagram]](../../diagrams/49/41d65c301ddf95c9b592610dd585021b.png)
![[Diagram]](../../diagrams/52/4d5d6c1c1c768a55c579a488255f4653.png)
![[Diagram]](../../diagrams/31/c1dc182a68aca3a3c3db5ad8c9576870.png)
![[Diagram]](../../diagrams/1/5c4e9807f244fc01813793debf553ee1.png)
![[Diagram]](../../diagrams/33/e01766e2bd6906594666826795391208.png)
![[Diagram]](../../diagrams/18/59341bce181c489f7a858686ede029fb.png)
![[Diagram]](../../diagrams/6/5b58761a1d574027af02be770b4f42dc.png)
![[Diagram]](../../diagrams/30/3814ccb0a5438361f05112ea98332fb6.png)
![[Diagram]](../../diagrams/50/1172ebf2c4b176192dfe35d41d37780a.png)
![[Diagram]](../../diagrams/52/95bf3e5cb7e8498e735096890c646aeb.png)
![[Diagram]](../../diagrams/33/236c8c7bb96b2676569c8b5195d79733.png)
![[Diagram]](../../diagrams/30/9ee662e887f64ef8bb336bdf16ed5165.png)
![[Diagram]](../../diagrams/25/76d60d43ab42f0da877a7857659f4045.png)
![[Diagram]](../../diagrams/8/918c7bf6a90bb61a1d5fb1c51c5ee171.png)
![[Diagram]](../../diagrams/16/95c4bfba5e8dc66a5fdcf7620c60e75c.png)
![[Diagram]](../../diagrams/40/980c00427df84e7541fb9fb2a26e644d.png)
![[Diagram]](../../diagrams/43/18f23ed5ef5bc67421c43078ea083687.png)
![[Diagram]](../../diagrams/25/418245f4beea24560d71b8659d61b834.png)
![[Diagram]](../../diagrams/15/dee100eb83ee93d378cada52ba38b5f4.png)
![[Diagram]](../../diagrams/38/8952837cb205229ab04b3c319754e0d3.png)
![[Diagram]](../../diagrams/39/ce2c9b62e34b3364899b49ce92d0b640.png)
![[Diagram]](../../diagrams/37/870ec36e608fcf552ea9a3c1bc94e1ff.png)
![[Diagram]](../../diagrams/9/28b2aaaa7cdfa381d7d23471ef426944.png)
![[Diagram]](../../diagrams/42/07dc7436e3e7160ede00eb784b90c4c6.png)
![[Diagram]](../../diagrams/39/29fd5a333ed220e59cc84122f34c120c.png)
![[Diagram]](../../diagrams/33/dcdae02784cc817cfd56981cbc14d46f.png)
![[Diagram]](../../diagrams/27/7f2ddf4ba7029ec4ebdbb5269cf7a762.png)
![[Diagram]](../../diagrams/33/efa745ba1d55c75766a2ca9ae62a53a6.png)
![[Diagram]](../../diagrams/44/c6a74e4e4ba110dc01acde5e65080409.png)
![[Diagram]](../../diagrams/24/7659c94f9851309a0b78c975425d8612.png)
![[Diagram]](../../diagrams/1/1ebb373c947348b8d3e76b8bea2f1ae5.png)
![[Diagram]](../../diagrams/50/5767cc078de002508f951127b80c436a.png)
![[Diagram]](../../diagrams/27/453b64586622d3278f3800856a8f4547.png)
![[Diagram]](../../diagrams/29/bcb086aea6a4356b454b1357f0999670.png)
![[Diagram]](../../diagrams/17/78614bbf385c656a4b6f142ec7c93894.png)
![[Diagram]](../../diagrams/6/256e4958f2ef58b9ab097bd7638ed50e.png)
![[Diagram]](../../diagrams/38/513a5205e34e1719dcea2b4c77a633be.png)
![[Diagram]](../../diagrams/6/0c0f6255c54bc9d5e3dea89068219479.png)
![[Diagram]](../../diagrams/10/94cf3b8c33e9e848a20e56cea7e27452.png)
![[Diagram]](../../diagrams/28/f8d645b387012ebe78f00407ea2528b3.png)
![[Diagram]](../../diagrams/39/c82ed2112ecd68b8b9588832f96df318.png)
![[Diagram]](../../diagrams/5/44dcbe2ce9f0668391569fbfe79e558b.png)
![[Diagram]](../../diagrams/35/4c7eb650dbd99fd7153c2665e6c1f087.png)
![[Diagram]](../../diagrams/7/90874afe0021cfd0769e1b258e19b9b4.png)
![[Diagram]](../../diagrams/24/8eca28e1fbcd3dbcdd611e969eb0977d.png)
![[Diagram]](../../diagrams/47/9f3e9cbca03f9fdc6a99b30864a5c30c.png)
![[Diagram]](../../diagrams/10/5cd690380b5ae6b87d9ee4edfcaa6a79.png)
![[Diagram]](../../diagrams/28/b8b004dfd9117a45845869d9ee558bc1.png)
![[Diagram]](../../diagrams/52/1bbaf44be6e51cd4e1ce083ce0fa47ce.png)
![[Diagram]](../../diagrams/26/e306a1b0ba5976c1cbaf8bfb5ad1f7b9.png)
![[Diagram]](../../diagrams/10/531fb3500d2a753c0986f4086f8e85ce.png)
![[Diagram]](../../diagrams/12/e358c826f69719494030e29fde2bcbc3.png)
![[Diagram]](../../diagrams/34/3967bdb0630ca3081884ad0645a04bdb.png)
![[Diagram]](../../diagrams/21/be9a939ac63392bafd50f3eb06ed0ce8.png)
![[Diagram]](../../diagrams/17/b2ffcdd06e16fd1160a639601da0b6c6.png)
![[Diagram]](../../diagrams/29/0e61f3499e9effc9da4e5d0c14e2c44d.png)
![[Diagram]](../../diagrams/36/24f077ec78b64dbf8fc6955f740034b8.png)
![[Diagram]](../../diagrams/31/3f4ce431cbf24a4ce7e254053b93ff23.png)
![[Diagram]](../../diagrams/43/575d87b621b377314532a79336d3370c.png)
![[Diagram]](../../diagrams/43/b9600b473c901401c765fd7ee575a44a.png)
![[Diagram]](../../diagrams/14/aefee1f66e21da1b19ba2636c466a11e.png)
![[Diagram]](../../diagrams/48/c507b36162dfc779929f2b169bc1d9ad.png)
![[Diagram]](../../diagrams/2/dd773f0e5fd28f191ff3de8832a5f01e.png)
![[Diagram]](../../diagrams/1/59a251a030fd0ae7841b1adce3c2e4da.png)
![[Diagram]](../../diagrams/44/45ebf33ee336c3b08645c5ed7f63dac8.png)
![[Diagram]](../../diagrams/13/559f20cb81a3cc90875b84ac5998d2b8.png)
![[Diagram]](../../diagrams/34/437b06dc1335beba619f434547eb3078.png)
![[Diagram]](../../diagrams/29/0c26d8b6b71d91cd2fa7d6255ff8179d.png)
![[Diagram]](../../diagrams/41/82b5c48ec4776ac94cfc195337f0bbb5.png)
![[Diagram]](../../diagrams/33/c47c42c441f5aba96cd9660316a2b86b.png)
![[Diagram]](../../diagrams/35/ceee5974620db2f20a6536dcef4c7bab.png)
![[Diagram]](../../diagrams/7/b58a791dc8d6756f3f37688e318c0463.png)
![[Diagram]](../../diagrams/36/2fcd6bf5af6106412c6b9574c194e4fe.png)
![[Diagram]](../../diagrams/40/a1de05e2d319b613a293c6383423a45f.png)
![[Diagram]](../../diagrams/17/042d95f4a20d16d8724271e1f4de9a9b.png)
![[Diagram]](../../diagrams/23/2bb411e75ce438f33613426d9a7cff0f.png)
![[Diagram]](../../diagrams/4/6c33e29cb584ce61f1378d615d22e84b.png)
![[Diagram]](../../diagrams/26/63fd1da5c1ac1faa7c5075f7d1d74f28.png)
![[Diagram]](../../diagrams/30/4f7bd0701bb4cb2067f86cd8918e242b.png)
![[Diagram]](../../diagrams/17/ce39195e47ccc338861a831abd273fa9.png)
![[Diagram]](../../diagrams/22/3726a3c2fadf289494d20af1d5ed54fc.png)
![[Diagram]](../../diagrams/20/41d76c5e61aeca5811b7ba9f974a6eb2.png)
![[Diagram]](../../diagrams/10/5f298f5cf5b83898106d297f44a1e40b.png)
![[Diagram]](../../diagrams/35/50a6802d1d1205e3fa946d0803f3c865.png)
![[Diagram]](../../diagrams/4/490a8cd7103b833188884db8c78f4c47.png)
![[Diagram]](../../diagrams/29/52062abd8fab800a5d4ef7f6d72c6c7b.png)
![[Diagram]](../../diagrams/32/86a442a712a8f809328ce0f9e00286f4.png)
![[Diagram]](../../diagrams/22/b034d3924ca6eb7bd8e96d24e9b82ebb.png)
![[Diagram]](../../diagrams/46/8bed633ba24d3364f23495dff2bf095d.png)
![[Diagram]](../../diagrams/0/596e0995a6f47c2fd4886e84564728f5.png)
![[Diagram]](../../diagrams/37/6a0716596f53b64ad60020bb241af199.png)
![[Diagram]](../../diagrams/36/df5687285f3b0809b3eacff5b6debaa2.png)
![[Diagram]](../../diagrams/14/bfc71c77a102a77033e1ee3c43ece774.png)
![[Diagram]](../../diagrams/36/e4d676bde1048bc01aeba16a00ab95c1.png)
![[Diagram]](../../diagrams/17/6b80a19882f047cb59d1150949b972da.png)
![[Diagram]](../../diagrams/21/ee798ab96c92b90d69e9b8a5e80e9624.png)
![[Diagram]](../../diagrams/33/3393507be6a92647b2d766dadcf4104f.png)
![[Diagram]](../../diagrams/48/01b5d2968a20579dde0a08674c678305.png)
![[Diagram]](../../diagrams/47/d10f69bc81669dce4105d5b1289970c4.png)
![[Diagram]](../../diagrams/39/39bed2f70423f035d5d357ccb10517bc.png)
![[Diagram]](../../diagrams/4/f7888e4e798501666825cfe8a38b7cf7.png)
![[Diagram]](../../diagrams/23/88f7dbd89275f1df9b7a0eeaf22ec00f.png)
![[Diagram]](../../diagrams/17/13b787acce5af09152f5e4527522ff1c.png)
![[Diagram]](../../diagrams/25/619a826320981277a61c4370cb4c6cdb.png)
![[Diagram]](../../diagrams/2/88aa23072813d2c7eb3ac2ab09916c2e.png)
![[Diagram]](../../diagrams/23/ef550f81415c2cccc4ce0dad325908c5.png)
![[Diagram]](../../diagrams/1/869a3ce550e985605b5abb5ed66378c1.png)
![[Diagram]](../../diagrams/44/5933fd96da55b2aab8614adfaf3c6880.png)
![[Diagram]](../../diagrams/33/72edbefea04cdb5aee71238a0df660fe.png)
![[Diagram]](../../diagrams/47/ff1e71917cf0997e6275a8fcfda30cb5.png)
![[Diagram]](../../diagrams/26/054d4088a20fc7393a06b3a06cc469df.png)
![[Diagram]](../../diagrams/14/655c70d50b909e8b6506de654924b052.png)
![[Diagram]](../../diagrams/21/fbd403ddef8b03012e0ce17ffe89944d.png)
![[Diagram]](../../diagrams/14/4d49b1b10c776fc1ef42e9e79b2ae8a1.png)
![[Diagram]](../../diagrams/20/3dc2327074ba86b19255f49d848cc03d.png)
![[Diagram]](../../diagrams/27/bb6443619736ac633e1636044f69fcf7.png)
![[Diagram]](../../diagrams/52/9fcb92aba77b4667f87e2de38a0c6a42.png)
![[Diagram]](../../diagrams/52/be9e0521b52b6714570622a55e6fd663.png)
![[Diagram]](../../diagrams/48/5a55b23ef1a10c1a4949ecbc50ce04c7.png)
![[Diagram]](../../diagrams/29/27e2270da1f275cae6ad8152a49cfd4c.png)
![[Diagram]](../../diagrams/42/181616788f79399c52b8c1da4323dfab.png)
![[Diagram]](../../diagrams/2/09e10764cceb9df15191e21e5af9989c.png)
![[Diagram]](../../diagrams/17/18684df602e9e246b0ef4de960f86b27.png)
![[Diagram]](../../diagrams/10/a38e938e6491694c7704c10512cc43b4.png)
![[Diagram]](../../diagrams/14/a93d037383156d36c14fdfa331ce9946.png)
![[Diagram]](../../diagrams/8/f78f8f950ac7f5f14f54da863b1be027.png)
![[Diagram]](../../diagrams/25/7d83a29d07dffa14069350bf74ee7f45.png)
![[Diagram]](../../diagrams/35/f42b2465962343b536fa07f1ea066cae.png)
![[Diagram]](../../diagrams/5/477f0dd7fb40eacf72b5efabac363ae2.png)
![[Diagram]](../../diagrams/37/ccda8e5a12e19b6a7a455dde3210b802.png)
![[Diagram]](../../diagrams/49/5c334378e54dabb52e16df8eb62ee331.png)
![[Diagram]](../../diagrams/13/559a8ea4ac439f0d59a0cb82d10ddda8.png)
![[Diagram]](../../diagrams/14/e06963eda7cc03fe51b47ff2eb98add5.png)
![[Diagram]](../../diagrams/28/be7eeb0feffd63c0ced13cce5bf326dd.png)
![[Diagram]](../../diagrams/33/9f4236ff2589beab3c73b0f37b096ca5.png)
![[Diagram]](../../diagrams/23/666d786673bfdf3e187f29edec5217c1.png)
![[Diagram]](../../diagrams/34/aa5628f7e877719c403397df74b5cd5a.png)
![[Diagram]](../../diagrams/38/f9b8d06d39c437a0d3a9e10e5fc0e24c.png)
![[Diagram]](../../diagrams/10/8182dc0d1d9a2bc936d30eb2c3548cd0.png)
![[Diagram]](../../diagrams/9/da85b9851484fe17733a3f5e29b91e4e.png)
![[Diagram]](../../diagrams/43/5d0bc35136f6a469c003ad316063e5e3.png)
![[Diagram]](../../diagrams/1/4f98ae36611885d74900ca712e53665d.png)
![[Diagram]](../../diagrams/8/abe14bffea43fd792db985ef601425a6.png)
![[Diagram]](../../diagrams/45/efa956c9dca0e91eac1f90473cd60e46.png)
![[Diagram]](../../diagrams/33/d54df4a6a6af522904ff7328f497cbd0.png)
![[Diagram]](../../diagrams/44/295b909b6091f6c12c53d20519dfd3f1.png)
![[Diagram]](../../diagrams/11/dcf3ccf619bc94474a2ad1d91c1c41f3.png)
![[Diagram]](../../diagrams/30/764bf3364e5d308f93d261e3c0b71560.png)
![[Diagram]](../../diagrams/19/d508222f42c26412eeaaed84ef8ad5e7.png)
![[Diagram]](../../diagrams/5/df1febbbd480b1e13400344255c436e0.png)
![[Diagram]](../../diagrams/17/96fb8b6d40b48e0ad69e4076b512ddbb.png)
![[Diagram]](../../diagrams/41/5083c0680f2d283da8708b5ff3b5dbfe.png)
![[Diagram]](../../diagrams/20/f08f4d357825cbed71e8c12bd5249024.png)
![[Diagram]](../../diagrams/10/cd52b803c776579b8d9359f98022c119.png)
![[Diagram]](../../diagrams/50/e99330475d35b0a4bb749b2171dfb01d.png)
![[Diagram]](../../diagrams/20/d89ca6dac38dbf31df583c30bd5a9446.png)
![[Diagram]](../../diagrams/43/111591d849188ece7af14d0a2ba43158.png)
![[Diagram]](../../diagrams/40/426b15cc169f2b089a574ba7bcd2cfa3.png)
![[Diagram]](../../diagrams/37/32ff011e6be16a405025c8ce988e17bd.png)
![[Diagram]](../../diagrams/27/1cc36a260347d14959b344fe5544e4e0.png)
![[Diagram]](../../diagrams/4/32e3f1e56278dfd5ee68079b63eaf260.png)
![[Diagram]](../../diagrams/5/d2b235a287c296382e40556ff6fe70be.png)
![[Diagram]](../../diagrams/3/9f7958100bb52c37ec6f8c9b2ed4e659.png)
![[Diagram]](../../diagrams/3/f7c0064593d739113e1f0f2d87f1aa34.png)
![[Diagram]](../../diagrams/0/b280032d404750dcc9d27f403e7bb050.png)
![[Diagram]](../../diagrams/22/ee8ca2528583c89b3f95cc02a8387daf.png)
![[Diagram]](../../diagrams/27/7815cd4b771627f08ee106ed1bb9e57b.png)
![[Diagram]](../../diagrams/9/899dbbcfa3af12bef98d9f1c26a11260.png)
![[Diagram]](../../diagrams/49/bf1a1a941460318729e97da2ca146b37.png)
![[Diagram]](../../diagrams/37/b36cf934fe10266d9bbda293717324d6.png)
![[Diagram]](../../diagrams/48/cf2a19340aad41ff1938dce884c18609.png)
![[Diagram]](../../diagrams/13/19e4c11328fa4d16e59482b5d78e726d.png)
![[Diagram]](../../diagrams/2/dd899d4d6367d3ed19bb10af6163b11f.png)
![[Diagram]](../../diagrams/19/80d844ed2f79a60587a40c872cd219a4.png)
![[Diagram]](../../diagrams/47/1f2e8162fdbda0e07a0b72155dcdfd3f.png)
![[Diagram]](../../diagrams/25/d45fba61d92b1907032ec4c8c5997f23.png)
![[Diagram]](../../diagrams/2/edeff880881329542cc464591bfd0f52.png)
![[Diagram]](../../diagrams/10/5421ded6c83a3a808a27d53fba8dca55.png)
![[Diagram]](../../diagrams/51/4a3209a5e139e38aa75b8c6b5ddf0292.png)
![[Diagram]](../../diagrams/50/a56d1e03a93bbc28bca44e4aa3fdd620.png)
![[Diagram]](../../diagrams/34/a8e90b7e7910fd7dcbf7942d904ee575.png)
![[Diagram]](../../diagrams/29/b92b4e3cb49fbd47133524a9d34dcf1a.png)
![[Diagram]](../../diagrams/26/56688a6e1767420102df374f47995be2.png)
![[Diagram]](../../diagrams/5/d82306c9927f02b40632a39d15f3f230.png)
![[Diagram]](../../diagrams/24/ee962e83fa45203d20bd0843d9ee5834.png)
![[Diagram]](../../diagrams/9/2bb35fffb73d3e8fe836a6d51498f9c3.png)
![[Diagram]](../../diagrams/23/6838432794c75b5279c5e35ced5f18bd.png)
![[Diagram]](../../diagrams/44/89c39b750f5813eb1e1fd520a6e4a3c2.png)
![[Diagram]](../../diagrams/25/f82922de0ca6470fc4a5917bd6b5d96a.png)
![[Diagram]](../../diagrams/10/6b5cab94cec1d5c8bc7a84a5d95cd786.png)
![[Diagram]](../../diagrams/4/452c0191f041773929ca79f6c5f6b34b.png)
![[Diagram]](../../diagrams/38/3a2acbc7060b77c541063e744d490685.png)
![[Diagram]](../../diagrams/35/6debe9378e50adce36d14f48bfa04ee5.png)
![[Diagram]](../../diagrams/5/80fefa025cbbe22960fa90130b4422d4.png)
![[Diagram]](../../diagrams/6/12cc46fc7f2dbb75ae91d11a8cffe602.png)
![[Diagram]](../../diagrams/8/8f5471cc8e50c2854b45bcf697447924.png)
![[Diagram]](../../diagrams/34/52c3cb6e9aaeec5f38919a2a352a4ff8.png)
![[Diagram]](../../diagrams/7/56f849a76643480c37d8a2d4ff43f0d4.png)
![[Diagram]](../../diagrams/36/003a349cbc39fa549c36526835b79a18.png)
![[Diagram]](../../diagrams/48/8eb81856448e0095b26d733c689ae9f5.png)
![[Diagram]](../../diagrams/47/08a6b11d1bf881b103d6be1daa073cbc.png)
![[Diagram]](../../diagrams/25/99e2754bb553c1d01b407416e2b1fe85.png)
![[Diagram]](../../diagrams/28/2fdb88a9b4703d7309c61bab0687c721.png)
![[Diagram]](../../diagrams/39/1db79f06b6b849758d0398bf5b5d2ea7.png)
![[Diagram]](../../diagrams/31/5b326e7d65b2fad076a4fb013e6ca88a.png)
![[Diagram]](../../diagrams/27/8cfbd87aa37fc5b11aa882c74f0667ff.png)
![[Diagram]](../../diagrams/11/328c9e7ac275f3eb396988ebf567981a.png)
![[Diagram]](../../diagrams/43/813c0d0e77a9ccda27449613492e9118.png)
![[Diagram]](../../diagrams/28/06987c48d9967255e7c9e2810f1d78d7.png)
![[Diagram]](../../diagrams/38/2d6f89036ed572885b197f77b7b6aefb.png)
![[Diagram]](../../diagrams/46/cd117646ba8c24eb90446715c1ae9c20.png)
![[Diagram]](../../diagrams/14/0a5ce468eb248802bbcadf11567d3f77.png)
![[Diagram]](../../diagrams/25/2b9372f31d7d497faa6e77beb6449464.png)
![[Diagram]](../../diagrams/10/7a5f50c6f97f3c0bb1ee6b7c9498e3b2.png)
![[Diagram]](../../diagrams/27/af4546589ca6d7fd210a55a4dacd4405.png)
![[Diagram]](../../diagrams/34/deb3e802a0c6cc17b602aada0df934cd.png)
![[Diagram]](../../diagrams/14/a31d71c971cc14755a7474ac69049f62.png)
![[Diagram]](../../diagrams/41/6f56c541f2a70eccf825f7bba6ac32b6.png)
![[Diagram]](../../diagrams/36/c03a20b4c238fe76d1b72186a2798256.png)
![[Diagram]](../../diagrams/48/21e814c44cf3445e382f3f50f8e640e2.png)
![[Diagram]](../../diagrams/34/4c2c7e285a5f51815149c0b5c2d2c57d.png)
![[Diagram]](../../diagrams/24/300974768ba40e3db682b951590d1583.png)
![[Diagram]](../../diagrams/26/4901a6e0163eb2b7206d5c93afd757fb.png)
![[Diagram]](../../diagrams/23/b8163d555636871590082e2350db6d5e.png)
![[Diagram]](../../diagrams/8/e0b58d87b201a6f813e4fb1f4080c500.png)
![[Diagram]](../../diagrams/11/bbc97b2ceda8ba09b6e066a469647512.png)
![[Diagram]](../../diagrams/40/d9d99d3d35618353efd6d856c9074905.png)
![[Diagram]](../../diagrams/24/e67435b1e8dd7448b1c6f506362457e1.png)
![[Diagram]](../../diagrams/35/f4f86f9443352755cbf74a1b0763475e.png)
![[Diagram]](../../diagrams/20/cd312962dfc174f6a3e2a576d8e8ae97.png)
![[Diagram]](../../diagrams/43/b14ddeea0011dc63d46f06211b0930a0.png)
![[Diagram]](../../diagrams/37/89bbdb47346255b74e5c57bc0a030e70.png)
![[Diagram]](../../diagrams/47/9fd963b3b9a511d02dc4d26b15b18679.png)
![[Diagram]](../../diagrams/38/73aadc9f5252e9b45f014b4a7b69111e.png)
![[Diagram]](../../diagrams/24/1d76dcc8762056ca0af9b2ea1f0d8c72.png)
![[Diagram]](../../diagrams/13/1a2c5a71da78d66861279a269f092ad6.png)
![[Diagram]](../../diagrams/48/b120e9bcf1bf599ead8f958fc3534a24.png)
![[Diagram]](../../diagrams/28/6b7b32c55d2be4739ffdc559fba2465e.png)
![[Diagram]](../../diagrams/0/6118ba232a9ee109ef2b3ab64859fc75.png)
![[Diagram]](../../diagrams/34/7653fb06d8281efb58e35af74ed6b633.png)
![[Diagram]](../../diagrams/40/381a4cd9acd7ddd4e0321078667ee002.png)
![[Diagram]](../../diagrams/16/b22bd42a8e1011d42e8ee0be12e94ae5.png)
![[Diagram]](../../diagrams/7/b0124a4aa804b2d06bbc50450f6887ab.png)
![[Diagram]](../../diagrams/40/2192a877c21bb4d20e824d7b9bbc6961.png)

![[Diagram]](../../diagrams/36/957b30a1403ce73ec4fe1c2e9f695516.png)
![[Diagram]](../../diagrams/11/36737be20a60e5417dc8c081f14c49e8.png)


![[Diagram]](../../diagrams/10/d5f8278704a8d7d7da05f882e39a03f5.png)
![[Diagram]](../../diagrams/19/c614db43e9293a68d80067841655dc71.png)
![[Diagram]](../../diagrams/23/4a0b944a8b6a92bb060cd9ac49a65464.png)
![[Diagram]](../../diagrams/39/93ed1fc32c45c877a173eea3289bd903.png)
![[Diagram]](../../diagrams/33/dfcbac4ee3cc6bd3b47471c236b2aa88.png)

![[Diagram]](../../diagrams/18/96c9397c4ec8cdace111f77ae8c58af6.png)
![[Diagram]](../../diagrams/17/4ce7138f53babe490f365367292d57b3.png)
![[Diagram]](../../diagrams/17/0f86ebf37f3527174267de336d3d10d3.png)


![[Diagram]](../../diagrams/29/e5694d348e56f4d09d0a61e1829c0c1c.png)
![[Diagram]](../../diagrams/52/5536033b880ce16c26bafb8463120aa6.png)
![[Diagram]](../../diagrams/3/b1711a5c2285fdd68e326b641e23f159.png)
![[Diagram]](../../diagrams/27/0500f61bd0795ed018fb226c60f5d52b.png)
![[Diagram]](../../diagrams/22/abfec9c1a38c0f7011775ccae754d5cd.png)
![[Diagram]](../../diagrams/42/73ea7216a4bb851e5d880fee85d1ce68.png)
![[Diagram]](../../diagrams/40/0e28a27270d2f6283223c70945a0efa1.png)
![[Diagram]](../../diagrams/42/e32e6f2bba7388436e0663a5207911d0.png)
![[Diagram]](../../diagrams/26/d10f53f035af32f4bfc3ab0ff3cc3df9.png)
![[Diagram]](../../diagrams/47/368da3af997401278718936c0970e199.png)
![[Diagram]](../../diagrams/30/73fd8c890c3338611daae89fb06cefba.png)
![[Diagram]](../../diagrams/33/8e838482e6d80a1cf18da5b5f6ed0514.png)
![[Diagram]](../../diagrams/33/a7d297f5a5c0dae711bc76e201eb7d31.png)
![[Diagram]](../../diagrams/15/3315edd79b6f27df85609d8c5b962631.png)
![[Diagram]](../../diagrams/32/0d6079a9c9f45c399931334e678d97a6.png)
![[Diagram]](../../diagrams/32/d2be34448b9c264672b00f234703e9a5.png)
![[Diagram]](../../diagrams/17/7ccf717ce79d164390b99765d3dc52af.png)
![[Diagram]](../../diagrams/34/c7a10558dbf5eec3ad735f1c86b68aae.png)
![[Diagram]](../../diagrams/24/58c7358fb9afb401b702b8bd1e9f4f2b.png)
![[Diagram]](../../diagrams/4/7a1855153d8fd181e2d4de76a926ee54.png)
![[Diagram]](../../diagrams/33/ede0cd12794e9c25cb1bdeb630713fb7.png)
![[Diagram]](../../diagrams/40/dfc691effa902d1c2ef45fccfeccc73e.png)
![[Diagram]](../../diagrams/47/e1767d0f33c88c0123cb0cb063f68380.png)
![[Diagram]](../../diagrams/13/bab6e5202f69e9fcbe0f443eacfe7aa0.png)
![[Diagram]](../../diagrams/13/ae2d81c3a3f58ddb3a996762c185689c.png)
![[Diagram]](../../diagrams/30/dc451741414fc585988afcf263477a27.png)
![[Diagram]](../../diagrams/45/8f3a520eafdf0037cab713588d5aa924.png)
![[Diagram]](../../diagrams/15/22d83c1be94778f4b24a63969e17b217.png)
![[Diagram]](../../diagrams/37/2f78f8d8cfe963793aee5380afb0efed.png)
![[Diagram]](../../diagrams/23/515be485578f21bb2e3cfb9673e3b73a.png)
![[Diagram]](../../diagrams/45/66638e619ba3f432fc269d78664e0ee1.png)
![[Diagram]](../../diagrams/6/04fe8ba6c96ec35d2c9dec38c2cc558d.png)
![[Diagram]](../../diagrams/31/3bf70da6e044f2431db819bd30fa0b14.png)
![[Diagram]](../../diagrams/38/f47432d870d2c01221d54c1b04c9de45.png)
![[Diagram]](../../diagrams/42/ffdfcc47b8a50e15975ee7806a6188a1.png)
![[Diagram]](../../diagrams/0/b779880548de12e705a06b5391198191.png)
![[Diagram]](../../diagrams/44/d57f042f70a8e105d222cca4b991550d.png)
![[Diagram]](../../diagrams/21/57f874ebd6370c77ed0e0315cfdc55d3.png)
![[Diagram]](../../diagrams/45/d9936bfa47eb117a82ea5dbbbb9b6ad3.png)
![[Diagram]](../../diagrams/26/f2e127c551a4b48d9fc3c8cd8d1fe44f.png)
![[Diagram]](../../diagrams/35/05431a05f518f0d395639bef24c6e3f3.png)
![[Diagram]](../../diagrams/45/07e61c195001dc3c719b8d33c3464d8c.png)
![[Diagram]](../../diagrams/43/48f5aea76a5b84f005c5606dcd1fdbcc.png)
![[Diagram]](../../diagrams/48/0dfae6f41ebebe11adf5f5c777dc29ac.png)
![[Diagram]](../../diagrams/46/f9b3708058470829516570cdad3dddca.png)
![[Diagram]](../../diagrams/52/14a54e47d24c93985f065876aad1b600.png)
![[Diagram]](../../diagrams/51/4a7fc9cc496049da94809d0a6a386d79.png)
![[Diagram]](../../diagrams/14/af1299e94f5ee25a269f58d914baa682.png)
![[Diagram]](../../diagrams/24/e211e15ad6ab119f04d67680c8c7d624.png)
![[Diagram]](../../diagrams/14/2e66d6d014a90fb26e6f98104eb50330.png)
![[Diagram]](../../diagrams/34/f2c59c447098bdcbcf0a5213de393cd2.png)
![[Diagram]](../../diagrams/44/c4873961c77926583f34f731686c4a2a.png)
![[Diagram]](../../diagrams/40/501126163ecc3ac1eee642cebd398798.png)
![[Diagram]](../../diagrams/41/bf173f5118d597f59a79ee0b859ac4ee.png)
![[Diagram]](../../diagrams/31/8c46335867c80ba572c1bf092ccf1103.png)
![[Diagram]](../../diagrams/29/b709ce1d29699b2cac186fc831cf9ccd.png)
![[Diagram]](../../diagrams/1/87706e2fb3d402bb37776560b6dc4016.png)
![[Diagram]](../../diagrams/9/890ee8ac8a2bace79cf4edd501ee4889.png)
![[Diagram]](../../diagrams/47/722c5578a2533c34834e470c7005e2be.png)
![[Diagram]](../../diagrams/42/d2612fe7d8cf82b1030fbf59ba0fcb35.png)
![[Diagram]](../../diagrams/6/1dcd331cb55a4b20404244eb71e2c619.png)
![[Diagram]](../../diagrams/36/14fccc449616ec6830877fc484fa7004.png)
![[Diagram]](../../diagrams/23/0f2a466726158702d410c9ea06570fe2.png)
![[Diagram]](../../diagrams/30/c6fcff0207f73acec327cf4118f0c675.png)
![[Diagram]](../../diagrams/51/916d89545a22242a62653016f364c476.png)
![[Diagram]](../../diagrams/15/75ca274485dffa8fe27c47b6a24b7027.png)
![[Diagram]](../../diagrams/5/6f985c7ad28080a7da05efbd5f6f4006.png)
![[Diagram]](../../diagrams/41/feaf8cb4d8dfb95403df786bcc237756.png)
![[Diagram]](../../diagrams/13/26c0e1519cf88664abba68bbf97fbddf.png)
![[Diagram]](../../diagrams/34/f2c6653a5cd0bcf6efee41527b77f745.png)
![[Diagram]](../../diagrams/38/4344643c36997fa60f1df268f9a1a390.png)
![[Diagram]](../../diagrams/23/5e17a37fc7d6818a41b2eac85953a681.png)
![[Diagram]](../../diagrams/36/3007acc4425f169fa448fb01301fcc90.png)
![[Diagram]](../../diagrams/46/a63e7c89a0427ca11c230200eb5ab9a1.png)
![[Diagram]](../../diagrams/7/1d8050e43f125db10172b2fdc34fadf7.png)
![[Diagram]](../../diagrams/37/a21ef341dbf82e2631409a711f82084a.png)
![[Diagram]](../../diagrams/50/e74ad84a49d272a5e82d96448d3596d7.png)
![[Diagram]](../../diagrams/5/33a70057ab528f71564733836594a97b.png)
![[Diagram]](../../diagrams/9/2260f57f0ebec0cb8573ee07e45ea8af.png)
![[Diagram]](../../diagrams/9/46d6da8b568f0cc15d5771af968afa4d.png)
![[Diagram]](../../diagrams/51/750a94b333b5ae2adeb5bb0309edfec9.png)
![[Diagram]](../../diagrams/50/f92a74f03817f5d6730842cb2843791b.png)
![[Diagram]](../../diagrams/41/a88089101d7a5a23aa303c938f899499.png)
![[Diagram]](../../diagrams/40/66250ffd8a22e256c29f2ba771c9f4f0.png)
![[Diagram]](../../diagrams/18/e2b9734859328c729f46042c95d467a7.png)
![[Diagram]](../../diagrams/0/71eb02170adcf66123d2eef22173a541.png)
![[Diagram]](../../diagrams/13/73ebb1f0d4366ea3d89186b1ecc20a86.png)
![[Diagram]](../../diagrams/37/34c391dafb5f9d25fef9e9ae02da3a7c.png)
![[Diagram]](../../diagrams/45/d6494a8bdce6b6e3cc36ef8d0d384564.png)
![[Diagram]](../../diagrams/32/8c9aeb996fbed69844d3b634e5a5dc68.png)
![[Diagram]](../../diagrams/0/87e75b5120f7b6999684227277bc2902.png)
![[Diagram]](../../diagrams/1/968e40138a8d494491ec06950d126070.png)
![[Diagram]](../../diagrams/12/b67c8a3303bc52e6f8c5b77fd3d38cb1.png)
![[Diagram]](../../diagrams/5/d7f4d8200510970bfe28c7a67392f5a6.png)
![[Diagram]](../../diagrams/23/b4682fcd9e3d4a3ac041d41bee519209.png)
![[Diagram]](../../diagrams/15/d6488a1ace20fb080d8c69830354fbb3.png)
![[Diagram]](../../diagrams/11/b096227c3c6cbfa577a0e772b41451b1.png)
![[Diagram]](../../diagrams/39/6a3eb6eb1a41301c4c596903a9cdbe9b.png)
![[Diagram]](../../diagrams/24/bab433bfb4e9478b40127ee33c4a9bd4.png)
![[Diagram]](../../diagrams/21/7f1e84d4e195a2ff1258b00a0381055e.png)
![[Diagram]](../../diagrams/23/9a0d4545fa639973e53b1307b2134109.png)
![[Diagram]](../../diagrams/0/93e2a4869405aaa6289babf8204ae91a.png)
![[Diagram]](../../diagrams/26/99c57dabf522d6d8260abb7de0b1bc9c.png)
![[Diagram]](../../diagrams/40/27ff85bd6274d85d8bda3388e4679332.png)
![[Diagram]](../../diagrams/36/088202d77eab452b0c362e8d132aa63a.png)
![[Diagram]](../../diagrams/28/75e1e337bc3b446b7a9f0b6fa6b52108.png)
![[Diagram]](../../diagrams/42/d7365a397c1cfa177f3ca986d3d91c90.png)
![[Diagram]](../../diagrams/28/d4ab34ebc24149e482164f3ade5e5544.png)
![[Diagram]](../../diagrams/28/142960b793967e04bde37464012db5bf.png)
![[Diagram]](../../diagrams/18/a1f70b920b9b359755f1241da2e7bacc.png)
![[Diagram]](../../diagrams/36/a4447bd861f34f28b07dcb8a11369b67.png)
![[Diagram]](../../diagrams/34/847ea7a16aef801d907ca5b609f8297f.png)


![[Diagram]](../../diagrams/45/012711c338f941e0399bc8484858063f.png)


 -
- 

![[Diagram]](../../diagrams/16/8fa155bc27ec56ae2079809077ef9a4b.png)

![[Diagram]](../../diagrams/49/3dc5b411c7cfbff94e47f206c243707d.png)
![[Diagram]](../../diagrams/12/df00dfb92a8764df8385c0c137eba2da.png)
![[Diagram]](../../diagrams/29/4a8156508cc3d8c98ca7d09a0cb07606.png)

 .
Javaness during his trip in Japan.
.
Javaness during his trip in Japan.
![[Diagram]](../../diagrams/44/0304c1d2aa55f587ba052704c402800f.png)
![[ext]](http://en.wikipedia.org/upload/c/cb/Macosissue.jpg) http://en.wikipedia.org/upload/c/cb/Macosissue.jpg
http://en.wikipedia.org/upload/c/cb/Macosissue.jpg![[Diagram]](../../diagrams/6/348d43d7be6e154367e3a76aaea6313e.png)
![[Diagram]](../../diagrams/47/829e60608baff0ff73d69ff1fc12968b.png)
![[Diagram]](../../diagrams/14/626a820ac799b577e2eae89e0bfd973d.png)
![[Diagram]](../../diagrams/34/e82a310c00f6d83e0b75bebda6586e30.png)
![[Diagram]](../../diagrams/40/b36d2d8d0e65e59b5a173f335198d1fa.png)
![[Diagram]](../../diagrams/11/62bdd3ce04425f516ef1fa295ceb6ee0.png)
![[Diagram]](../../diagrams/15/f2139021085288eddadeb77b12052668.png)
![[Diagram]](../../diagrams/47/d965445ac0da6e9405adddd66cb96b7e.png)
![[Diagram]](../../diagrams/13/e8f3567cd6666a156ff0ecdd0109f491.png)
![[Diagram]](../../diagrams/20/9c8c9e4081e77d440a679ac370ba33b3.png)


![[ext]](http://xs18.xs.to/pics/05096/kgs.png) http://xs18.xs.to/pics/05096/kgs.png
http://xs18.xs.to/pics/05096/kgs.png


![[Diagram]](../../diagrams/35/0cb460829424cbc3400b9be195e0552b.png)
![[ext]](http://cf.geocities.com/ilanpi/kgs.jpg) http://cf.geocities.com/ilanpi/kgs.jpg
http://cf.geocities.com/ilanpi/kgs.jpg![[Diagram]](../../diagrams/39/33c30fc3998f6d4320ed2895164684ac.png)
![[ext]](http://codejanitor.us/robots.png) http://codejanitor.us/robots.png
http://codejanitor.us/robots.png![[Diagram]](../../diagrams/0/46ed3aeee5c6b3161ff82248b504ff6d.png)
![[Diagram]](../../diagrams/51/f228127ebcdf82fe9649d8437ed7cd1b.png)
![[Diagram]](../../diagrams/30/ce7a8f66b720b111cb6b569b8f355f1c.png)

![[Diagram]](../../diagrams/21/9b849796e998c70031a35dc9619817af.png)
![[Diagram]](../../diagrams/29/a627ea8c359f40af6e5baa496a7d8446.png)
![[Diagram]](../../diagrams/24/0dff2a4a3096176c9404dd4f0c1a6509.png)
![[Diagram]](../../diagrams/13/76b9e9fafb8eedb1c9d09ad00846017e.png)
![[Diagram]](../../diagrams/31/b642cde639b55fdd1a7dc7888112e994.png)
![[Diagram]](../../diagrams/23/1097290ec5c061d6bb9c515c9d26404e.png)
![[Diagram]](../../diagrams/43/1eb0e027721c0f2e53705b65319f05eb.png)
![[Diagram]](../../diagrams/18/c38317cb00f109adb42dfcf52094e545.png)
![[Diagram]](../../diagrams/15/9ae5fa33538ace2e1c67b3bdd60bf35f.png)
![[Diagram]](../../diagrams/36/70e4bb0ae57f2e853e0db9defe07e844.png)
![[Diagram]](../../diagrams/37/3b02d7f2c130eb391c835cf33d3d3b53.png)
![[Diagram]](../../diagrams/47/01c5862e98740229465f68569f20b749.png)
![[Diagram]](../../diagrams/26/d7fd22a9e0c0cccfe3676fdc1e70afef.png)
![[Diagram]](../../diagrams/48/90591fa9b058d138f65223a78a64cf3e.png)
![[Diagram]](../../diagrams/16/54feb2ce3c05dc1fce223016804cdfed.png)
![[Diagram]](../../diagrams/41/7caeed42b9d9fe986a576f8292bd80c5.png)
![[Diagram]](../../diagrams/49/8c35db15ef2baf18313ffb53ea9a6e1c.png)
![[Diagram]](../../diagrams/0/8e512b85d0871387db381bf04a2d2d1f.png)
![[Diagram]](../../diagrams/4/8646ca30bbf775f1ee8544d5f291eba3.png)
![[Diagram]](../../diagrams/15/3b9088cc30a3443f3277c8930e796e96.png)
![[Diagram]](../../diagrams/15/ac35194eaf30e08c07083556ad32911f.png)
![[Diagram]](../../diagrams/28/f7f73150614dc2424b68d48d66ce1fe8.png)
![[Diagram]](../../diagrams/34/6d9f7c2efb36cfce25b175262dfc3e77.png)
![[Diagram]](../../diagrams/37/0728f8f35a31c66ebf2aa05107f06492.png)
![[Diagram]](../../diagrams/39/895dc67f32c6152255e67ece01630498.png)
![[Diagram]](../../diagrams/10/3d794ca5e182e5faadefdfe12d1fe1c9.png)
![[Diagram]](../../diagrams/30/0e774711cb20b52e0f0997a41201e6eb.png)
![[Diagram]](../../diagrams/39/36059ea3d77ed49fe669be2aa78b0546.png)
![[Diagram]](../../diagrams/31/e5eefe2b20dcf621bc588e033afb4f70.png)
![[Diagram]](../../diagrams/50/655865308d348e89e7e7084f4a398507.png)
![[Diagram]](../../diagrams/2/e147bbcef2562a7762eee0ce3a67f0e0.png)
![[Diagram]](../../diagrams/50/234780d0bea7dfbd8e3480f7286b0eba.png)
![[Diagram]](../../diagrams/40/3617dc5c84fd4ecc75f2c3e9738bf558.png)
![[Diagram]](../../diagrams/46/94a0f1b0d4a34291d65823d94d791086.png)
![[Diagram]](../../diagrams/16/c1246e3e3811e7786809a69d292e0cfb.png)
![[Diagram]](../../diagrams/16/e9a47dd44892860a0b13f513693445a8.png)
![[Diagram]](../../diagrams/32/72f2ccb2fecfb5d45323f281e80a6974.png)
![[Diagram]](../../diagrams/17/87682a4850848c07746aff2a48a14a2b.png)
![[Diagram]](../../diagrams/39/bcf8f78d8e95cc06bb9a75c5219e997c.png)
![[Diagram]](../../diagrams/46/d1f3506e5e4262932fa3b09474184116.png)
![[Diagram]](../../diagrams/18/43a50a7156e957644ee9a7a948cbd430.png)
![[Diagram]](../../diagrams/15/5d854311daccb5a8bdfdea4666626f66.png)
![[Diagram]](../../diagrams/37/d9e50734267e86f484aa8bfa6385f765.png)
![[Diagram]](../../diagrams/15/8727fd6c4f4fb35fded920776fc2b67b.png)
![[Diagram]](../../diagrams/3/cac87016cd192bc463d6810a484bba73.png)
![[Diagram]](../../diagrams/7/ec3222aafcca55f448cb872d4c28f494.png)
![[Diagram]](../../diagrams/40/4d48d350c5b842d0ad60c651d311e67a.png)
![[Diagram]](../../diagrams/44/98be64ffee4470c87ae64a8fda3d7fda.png)
![[Diagram]](../../diagrams/31/bceea6bd42f1c7b67d3c6fde90c6f230.png)
![[Diagram]](../../diagrams/32/b1f0b218f7cbf893855e7d082b7799ae.png)
![[Diagram]](../../diagrams/33/091426ca4b3476cff88c06740297b9dd.png)
![[Diagram]](../../diagrams/41/61885f594e8eb19d59c1fc5edea14565.png)
![[Diagram]](../../diagrams/50/6007b6a7050fe49bf402c57631cd3dbf.png)
![[Diagram]](../../diagrams/4/ac68c34e50a2f29d7eea8bbb6662c9fb.png)
![[Diagram]](../../diagrams/42/c0a58c9a38dfb2e38afd9fa49ae31375.png)
![[Diagram]](../../diagrams/7/e06ec229b9bcea5164073a381f8e7ccf.png)
![[Diagram]](../../diagrams/28/f972d2bb25df23805f6081bc06850bc5.png)
![[Diagram]](../../diagrams/3/74c20058ee6a02e29ecbd943d4d6699a.png)
![[Diagram]](../../diagrams/8/058c96b3fb914966551b0884ee6404b4.png)
![[Diagram]](../../diagrams/6/2a6e11a2ecee9cff23af6b314771447b.png)
![[Diagram]](../../diagrams/42/7a2107b31e3ff1b3b298f9ddffd55363.png)
![[Diagram]](../../diagrams/28/c5570af2ce76038d934904326faaa646.png)
![[Diagram]](../../diagrams/24/0aeac430fa059a0c1d41475d644c60f5.png)
![[Diagram]](../../diagrams/11/4d99fc9e7c8f22af87477cc0b8a51ca1.png)
![[Diagram]](../../diagrams/37/cae7422763cf2e2a4e76b535c5ff5df6.png)
![[Diagram]](../../diagrams/7/70f03ba172e5894271e6b6034610bc8a.png)
![[Diagram]](../../diagrams/37/e3205d2d8da17314a0c21cb4eb8b4dff.png)
![[Diagram]](../../diagrams/49/0783d1b4711e504536565305ef7af204.png)
![[Diagram]](../../diagrams/52/2fe19686435fb51c0a1b79790651129a.png)
![[Diagram]](../../diagrams/51/41862158df60e271c56d37ce2ce706b2.png)
![[Diagram]](../../diagrams/25/f7d63c5c978cc0c763d20a1a293681b7.png)
![[Diagram]](../../diagrams/8/4f2f95e49c20bc7e57b7df70e5ca9737.png)
![[Diagram]](../../diagrams/41/b68ccccd4efff8ab7b7c178d329b4e40.png)
![[Diagram]](../../diagrams/42/965afb92f8f48612dfcb75784242af44.png)
![[Diagram]](../../diagrams/16/8eae3f8f0503a4d4b5649c4881275f44.png)
![[Diagram]](../../diagrams/3/0a993667d65168a01f9ecb3f6fa12fc2.png)
![[Diagram]](../../diagrams/10/29f0c50e3af649ef0c6d8c37044fd122.png)
![[Diagram]](../../diagrams/5/039c2e541e96618e771d14d59e1d7201.png)
![[Diagram]](../../diagrams/17/a4e11574f33459264021307585cf15e3.png)
![[Diagram]](../../diagrams/1/d93a4200aef80ba9eebe93ff5c4ef3af.png)
![[Diagram]](../../diagrams/47/4f618fe5f98fe51fcce95ba84b56c932.png)
![[Diagram]](../../diagrams/24/04b5308d921eebe48a6f679f6dc16056.png)
![[Diagram]](../../diagrams/22/0ecebc07b61f7362ea13215ee0e01f6f.png)
![[Diagram]](../../diagrams/36/eb038e752899cf548880e7a97e4f9103.png)

![[Diagram]](../../diagrams/45/fafe35317e78d0864432482a9d9a569e.png)
![[Diagram]](../../diagrams/6/f9eb194b6297c29bf7259749ebd0ceb9.png)
![[Diagram]](../../diagrams/15/54555cf32f476a4798c36fb77358d043.png)
![[Diagram]](../../diagrams/47/7592e150dac08d60fe50e50c5526e796.png)
![[Diagram]](../../diagrams/28/5db08ceadf1a44d0d5b8e93922aa6d55.png)
![[Diagram]](../../diagrams/6/4944ddd9193a0a6c96133a1d69e5842b.png)
![[Diagram]](../../diagrams/27/408632a696b7fd716dc85a5768276b43.png)
![[Diagram]](../../diagrams/48/01b19d1cd618db6af279c5a82db11de5.png)
![[Diagram]](../../diagrams/30/a0393c3d907631f40b5a20f62098b7f0.png)
![[Diagram]](../../diagrams/16/f2699089bf15304ca2fb8608233a22e4.png)
![[Diagram]](../../diagrams/0/2c177523ed684edd3ee6cf75badc0b43.png)
![[Diagram]](../../diagrams/41/655f85088ffeb2ec554bf765cc5f1c96.png)
![[Diagram]](../../diagrams/50/3462d955e359d48b87feba7b0758316e.png)
![[Diagram]](../../diagrams/6/3a2fda32b165ec73941df26c2b36b1d7.png)
![[Diagram]](../../diagrams/35/fdd86b9750a59ca1beeec05b8d7d472d.png)
![[Diagram]](../../diagrams/41/c79cc71af7a76171084fb1615a8b6c2d.png)
![[Diagram]](../../diagrams/45/ebe664312cbc16e2bfdaf1755c503f48.png)
![[Diagram]](../../diagrams/3/b61d244b2b22d10fa4dd4ed7b3b37b94.png)
![[Diagram]](../../diagrams/4/2fbe6ecbe0ae48614d1cf645ceb58d81.png)
![[Diagram]](../../diagrams/20/e9b6725baa89bb6ede6e391a418d7c78.png)
![[Diagram]](../../diagrams/50/bfb6cb195dd02b2d499a4ddc7a19071f.png)
![[Diagram]](../../diagrams/7/a4da31ac4b6947950947ea1a50320ea6.png)
![[Diagram]](../../diagrams/31/21f53ea693ab8f42f6639c6869963056.png)
![[Diagram]](../../diagrams/38/e074c3e5f35a1dd93a7face65ee82d9e.png)
![[Diagram]](../../diagrams/33/9de639e816656065a29ad15127f6e1cc.png)
![[Diagram]](../../diagrams/47/5290ea1c19f4e5864bc8a4c01f87d069.png)
![[Diagram]](../../diagrams/37/b14a64265ca23f5fe2eb14e45fdf4476.png)
![[Diagram]](../../diagrams/32/4cfc9d4bef35bb1ebc209b3c6cfb7408.png)
![[Diagram]](../../diagrams/2/aab35f77162d3b069ef82d2b5ec93e43.png)
![[Diagram]](../../diagrams/52/6bba0a95b2b5237e5949f08e3317f141.png)
![[Diagram]](../../diagrams/18/9d8d1e483f06d2656025874ce93297b6.png)
![[Diagram]](../../diagrams/41/65b40ce4c63f17c729eb8b07b5484e58.png)
![[Diagram]](../../diagrams/16/873638cc64cb3549b9578c2aecd23743.png)
![[Diagram]](../../diagrams/8/9eee5c2b6e8483e52d886028709775a9.png)
![[Diagram]](../../diagrams/5/b444f00e240c5807d7a3959956730703.png)
![[Diagram]](../../diagrams/13/90d5b45124f98ef4b63147abc01dc2ec.png)
![[Diagram]](../../diagrams/10/49d76167614737f2f170be6581fc9b27.png)
![[Diagram]](../../diagrams/45/c87a0f756fd7d41a2fb51cea5e0215ba.png)
![[Diagram]](../../diagrams/50/86e56ee9c39c4f6e5e09538ea5deeb6c.png)
![[Diagram]](../../diagrams/26/bb9f51f478beaef6b1f03887c30b16cd.png)
![[Diagram]](../../diagrams/38/90222a267103aed5189a76860875a24f.png)
![[Diagram]](../../diagrams/3/061b00670fb67b2c3c010f56f7335da2.png)
![[Diagram]](../../diagrams/49/9778bc99049d6998b8c66a67de06387c.png)
![[Diagram]](../../diagrams/50/e294beb6fcd8fbdf8931eb11c035674f.png)
![[Diagram]](../../diagrams/3/e6210456d9da66e3ac541f5e4a393eb6.png)
![[Diagram]](../../diagrams/38/0c440007ea345c3e64110a0140eea102.png)
![[Diagram]](../../diagrams/21/44720045e971851bdf269646a934e3f5.png)
![[Diagram]](../../diagrams/19/b60f4937d872e4e337e7c155123c34f1.png)
![[Diagram]](../../diagrams/6/fe3d93def1a99ef4b8e1c42a5bdc8ce4.png)
![[Diagram]](../../diagrams/29/442f1881c911c1d14d2a0e46807f5d17.png)
![[Diagram]](../../diagrams/14/71a0e848b3c4024ac481f53f568594d7.png)
![[Diagram]](../../diagrams/46/cf8ec052226eac36870651158ce6d008.png)
![[Diagram]](../../diagrams/52/e8ca57c14e885d13749a7749ed976a1e.png)
![[Diagram]](../../diagrams/18/4f6c32ba4a1a8c2b91537276bbbd4fb1.png)
![[Diagram]](../../diagrams/51/1c62e531eb91361aabe823e352237606.png)
![[Diagram]](../../diagrams/41/e23eee5dc0b00f3c3f86d2ec473bb162.png)
![[Diagram]](../../diagrams/45/5a250cd4b9160e9e8b206439b537c04a.png)
![[Diagram]](../../diagrams/49/39484a6198209facf3875a43bae27fa0.png)
![[Diagram]](../../diagrams/22/2d916564b8c76bdb29d0b2d9fc53d485.png)

![[Diagram]](../../diagrams/40/c4dbc34e1bc3cd4ca6f1b951beb86845.png)
![[Diagram]](../../diagrams/7/5dcea6f62da97d57af5d202ae91a01c6.png)
![[Diagram]](../../diagrams/45/bf2ead1f11e2e40682dc370f7586f4c8.png)
![[Diagram]](../../diagrams/3/c77b45f23e9ebe268a8a83e874e85d32.png)
![[Diagram]](../../diagrams/45/087ea7aa84b27b4ee51504c49e14e237.png)
![[Diagram]](../../diagrams/42/66aa3000f6acb7403cff1d9a217e9078.png)
![[Diagram]](../../diagrams/10/7ecede38ca2f591aa141417f8dc74f52.png)
![[Diagram]](../../diagrams/13/b17a78768d9a06043ae10bd711699817.png)
![[Diagram]](../../diagrams/28/0ee474794effbeaab0cc5e85cb7f5bdc.png)
![[Diagram]](../../diagrams/48/626c5db7dccd8ca733a39fc28efaa185.png)
![[Diagram]](../../diagrams/29/83d911682ab52eb6c41d3f0d1e98ffb5.png)
![[Diagram]](../../diagrams/48/e7049b17d8ace9d01be5dd55ab4ee783.png)
![[Diagram]](../../diagrams/36/d2a25a2eff0a579d3bad72247e6b0950.png)

![[Diagram]](../../diagrams/7/84e4da6f56079a6564977c0e089ea01c.png)
![[Diagram]](../../diagrams/37/abeb0516cdd6fdaefa05b57b623d61e0.png)
![[Diagram]](../../diagrams/1/ae3b191aad3a5c2633d867fba5474b1e.png)
![[Diagram]](../../diagrams/34/50b78aa21610cf5c2a358252722643e1.png)
![[Diagram]](../../diagrams/21/0dadfb34acd7822a15a1c0fcdd9123f2.png)
![[Diagram]](../../diagrams/11/1691d3fecd66af8f5c4f4f8716c27911.png)

![[ext]](http://limkimkeong.tripod.com/20040301a.jpg) http://limkimkeong.tripod.com/20040301a.jpg
http://limkimkeong.tripod.com/20040301a.jpg![[Diagram]](../../diagrams/19/7ec0ca991266c19b63924aa40f77be96.png)
![[Diagram]](../../diagrams/4/2c10f49a3d1463d1e00a1473cb635033.png)
![[Diagram]](../../diagrams/14/30909528c886e3a28c4e0e4bbb38446f.png)
![[Diagram]](../../diagrams/47/e533fc2e4684bae0b540457a3c02bc69.png)
![[Diagram]](../../diagrams/0/0da7e41a625bc0012a219efcc8022cef.png)
![[Diagram]](../../diagrams/44/ca66937e60794e06c66d092c654942ca.png)
![[Diagram]](../../diagrams/10/ac31b15e52df4b0585e34e5f9b15cec2.png)
![[Diagram]](../../diagrams/9/0927b4d0dc7a9fd1280c88b92c89b94a.png)


![[Diagram]](../../diagrams/34/9dc6d2cfe8c91800912b42465fe829f0.png)
![[Diagram]](../../diagrams/41/cfa6c479c3bbf36e67232206da10ee1b.png)
![[Diagram]](../../diagrams/25/7ddd6af8314a64f911400efb680b3a1c.png)
![[Diagram]](../../diagrams/28/46ffc6c9b669d677a9954895d6659165.png)
![[Diagram]](../../diagrams/47/ae28fd79563bcd6ba1d2de7a32b8b0c9.png)
![[Diagram]](../../diagrams/33/0861b7cb118ce497e2f236eeb2799fde.png)
![[Diagram]](../../diagrams/50/35af7a06cd6c1a90ba639290bdbb3fed.png)
![[Diagram]](../../diagrams/10/a55857187c3a6179ce02b704242906b6.png)
![[Diagram]](../../diagrams/40/5c9eb83ee0a1ba5cc97febfd9bd2ec3c.png)
![[Diagram]](../../diagrams/48/e6b13846d00a56290ed219a92d2ed91b.png)
![[Diagram]](../../diagrams/9/9bc50e1dde0ff8974fc70d57ec3e1bc2.png)
![[Diagram]](../../diagrams/34/304fdd103feefeecb15b9cb9fe938c79.png)
![[Diagram]](../../diagrams/22/d981023c58c3c4d576c29e981afc63c1.png)
![[Diagram]](../../diagrams/38/320bbd5735a048e72a9180315a30673b.png)
![[Diagram]](../../diagrams/42/b8c8b4485f199695b9e4904ba2d13fc5.png)
![[Diagram]](../../diagrams/23/01c71b1ce8336b8dd24509763488f14b.png)
![[Diagram]](../../diagrams/22/9dd8879feee82660aa485d6448dfcd8d.png)
![[Diagram]](../../diagrams/19/fec4b9121c3213f56f76fc834e076440.png)
![[Diagram]](../../diagrams/9/62b8b676ddadd01bd7823b593f085ba0.png)
![[Diagram]](../../diagrams/51/0a9eb823ae4a6b508a9bd3e639174e80.png)
![[Diagram]](../../diagrams/30/dbd934c4ddc16c8334f6e7c5c1b59f94.png)
![[Diagram]](../../diagrams/21/41461cfbf3fbc5dc9b85b693e0777446.png)
![[Diagram]](../../diagrams/4/1f786f28d5929359aa2eaed8a4b3f47b.png)
![[Diagram]](../../diagrams/28/500f360e0f32b5c6f2af6569b3aa1b52.png)
![[Diagram]](../../diagrams/43/f2654e715077865100c6e2d084e147ea.png)
![[Diagram]](../../diagrams/22/5ee4efc9045edb076082ceaf6576f9be.png)
![[Diagram]](../../diagrams/33/18b09887b765ee1c09823f1a5b5f1aa1.png)
![[Diagram]](../../diagrams/32/b50c312c0b1d22744ef12e57c782df42.png)
![[Diagram]](../../diagrams/1/f1ad9a6e1d034bb1b6059a2edec8ef0e.png)
![[Diagram]](../../diagrams/5/a6e47541c2fb01fa133b3d66d63a684e.png)
![[Diagram]](../../diagrams/51/b7dbf6abfde1d450aba78632bd64b49d.png)
![[Diagram]](../../diagrams/38/a7f04f808c355342ebe1488d9f134513.png)
![[Diagram]](../../diagrams/16/a9abaf843d056d68406871e918872fc2.png)
![[Diagram]](../../diagrams/46/f1d73bd297c58358907b888a32715ddc.png)
![[Diagram]](../../diagrams/25/23456e98d9bf59ab8195e19fc5521940.png)
![[Diagram]](../../diagrams/23/dd95c843bb31f20869c0e4e93db6e3e1.png)

![[Diagram]](../../diagrams/44/d2c50e99724ff1d089637e579066057d.png)


![[Diagram]](../../diagrams/34/80c36061c40992b929f2121c3d0aea9a.png)
![[Diagram]](../../diagrams/29/9c4dfce3e91795d0a11dd1519a6ffd53.png)
![[Diagram]](../../diagrams/19/aa56e7fdd2c312371a6a2eef5772622d.png)
![[Diagram]](../../diagrams/11/0f1bd6fb9776495cdc4dbc1d7df21fc6.png)
![[Diagram]](../../diagrams/45/79044f208cd93df5b2af75beed1623ee.png)
![[Diagram]](../../diagrams/28/d0ec1bce199170b0a21d8295905db3a9.png)
![[Diagram]](../../diagrams/6/7a31f2a6285ce5b866a398d68e55efd5.png)
![[Diagram]](../../diagrams/42/290be3e1a84f12261209b22d4d4bfba6.png)
![[Diagram]](../../diagrams/13/652421ee3d4c3b2c209c2cfa276cf158.png)
![[Diagram]](../../diagrams/29/1f792b8d3433e30465d5602420ad8dc4.png)
![[Diagram]](../../diagrams/30/47259e06fa4be3b47788318349afe4a5.png)
![[Diagram]](../../diagrams/19/8ed49bb5f8ce098ff24b40c34d5575d7.png)
![[Diagram]](../../diagrams/6/9e79e24e09165577f3aec61f60a9412c.png)
![[Diagram]](../../diagrams/25/bd4f66b72ba58ce170b7d9252cf2dab7.png)
![[Diagram]](../../diagrams/16/7e4c71c29b6290a7347951a68fb3bc0b.png)
![[Diagram]](../../diagrams/6/c94b69c0742d71d11d6d343d92c22e93.png)
![[Diagram]](../../diagrams/26/96e1a3368b11a1ff7dbdfd76f5b3e5d0.png)
![[Diagram]](../../diagrams/15/ecb4da6fcf2fde168e1dbf85cb5afeac.png)
![[Diagram]](../../diagrams/35/6d0a1462b6a8f498106fc73ee441fa54.png)
![[Diagram]](../../diagrams/4/2d78c8f0832c82e2cc6a14e637d74d15.png)
![[Diagram]](../../diagrams/10/7e346693f424a8b1339f9f3bcc98fd4c.png)
![[Diagram]](../../diagrams/7/b632a4760c486a4dbc063a0cc8777169.png)
![[Diagram]](../../diagrams/27/9bc717587f7aaa06abacaae07a4b4742.png)
![[Diagram]](../../diagrams/26/9df8f3607bc39baf633a922792546fe2.png)
![[Diagram]](../../diagrams/1/5c43ec9e097cd71890d1ec76544895a5.png)
![[Diagram]](../../diagrams/11/c5919e37bafa3a3f00cfd163d2526433.png)
![[Diagram]](../../diagrams/38/53abecdf683c9e1a575d678dcc064588.png)
![[Diagram]](../../diagrams/52/6db7b3b16a74cdf937e283cd3c0e8d06.png)
![[Diagram]](../../diagrams/47/b82282952629bf23456aeb2109cfe75f.png)
![[Diagram]](../../diagrams/49/2ca6e281ec84d41fa11ffc2d3b641c5d.png)
![[Diagram]](../../diagrams/6/3fce3b30e0bd76cbdbd8ddd4a7b6b8c2.png)
![[Diagram]](../../diagrams/41/8f82a1658c260c65ecce4c4e733b7dc5.png)
![[Diagram]](../../diagrams/43/fc9e93b9b8890e607d819d167cdf21af.png)
![[Diagram]](../../diagrams/50/e0fb166716fbbdb2b53df94002f97bc4.png)
![[Diagram]](../../diagrams/49/365f0d5316d523b71fd31691f2c9d9cb.png)
![[Diagram]](../../diagrams/30/b02ddd0670c3517be390e0de17395858.png)
![[Diagram]](../../diagrams/6/ba3f891520d7caa0b094a1d90a528f33.png)
![[Diagram]](../../diagrams/32/e0e033816c7eca47356ce63ed150db10.png)
![[Diagram]](../../diagrams/28/5a3408c225cf5ee71409dbeffa3b960d.png)
![[Diagram]](../../diagrams/46/0e2a9ac196f112bc508e4ed17a32cbae.png)
![[Diagram]](../../diagrams/31/69a503b3abd1757eb1426b8dc085599e.png)
![[Diagram]](../../diagrams/11/6b1d7dbabf7f5fd59e868b70c14dae2d.png)
![[Diagram]](../../diagrams/5/10d2a80b109873f1cd1574c53aa17334.png)
![[Diagram]](../../diagrams/17/48354c564886fdeaed95a4b59efeac8a.png)
![[Diagram]](../../diagrams/20/0dec23ff6dae1718f1b6fc432ba6c332.png)
![[Diagram]](../../diagrams/23/30d5c87743ae8a640333aaedd0664e94.png)
![[Diagram]](../../diagrams/0/9b338b76fab4e62c7c12b2fa9e7d9236.png)
![[Diagram]](../../diagrams/49/778d792006d491342002a901006c9d94.png)
![[Diagram]](../../diagrams/0/f3a670307fa69a5ef1120bd53073cb79.png)
![[Diagram]](../../diagrams/18/2cb73c7bdc3d51e5deea85f1108b8ecd.png)
![[Diagram]](../../diagrams/31/97d958c607a5fe55883502ae95d28d7f.png)
![[Diagram]](../../diagrams/42/8685b51414627da6db991c181dd09936.png)
![[Diagram]](../../diagrams/42/e1f5e020306838778823e7f479f3f2e7.png)
![[Diagram]](../../diagrams/1/77ea92faa7cc469a620ff3459abc455e.png)
![[Diagram]](../../diagrams/4/d3482c48408ccc610159537c170d8d6c.png)
![[Diagram]](../../diagrams/11/84c4a0aa71ab96d3f5bd7f3d53a45980.png)
![[Diagram]](../../diagrams/51/2f98786106c97d41412b79b5d06c6e5f.png)
![[Diagram]](../../diagrams/8/5c2365580539dc23c835fe942cee4709.png)
![[Diagram]](../../diagrams/3/1d6cb026c6a8d250a5d86441139849ab.png)
![[Diagram]](../../diagrams/7/94d81ca9b37b34507394336e571322e6.png)
![[Diagram]](../../diagrams/30/0d8f9b571a5ea20056d308c4f766b402.png)
![[Diagram]](../../diagrams/11/5c1adb3eea6e92c015b3227317eb3a48.png)
![[Diagram]](../../diagrams/15/621a7fbbae8a86b6115fb5b3837cab47.png)
![[Diagram]](../../diagrams/2/35952d60af0e34c091de6b4102804f60.png)
![[Diagram]](../../diagrams/40/2d6b690bf5d8bdf7be5ed4f7c0444d21.png)
![[Diagram]](../../diagrams/35/08d887aa46fc749afb3057c783bb634f.png)
![[Diagram]](../../diagrams/8/e71fd877a7e8fa64f28cc226fbc44aa7.png)
![[Diagram]](../../diagrams/8/b5679644551e8c448ecb46b56c78750d.png)
![[Diagram]](../../diagrams/11/64a1224eb93ef111a05f6a98570ed926.png)
![[Diagram]](../../diagrams/22/241e9c042a1e7efded8c4d21756a0e8f.png)
![[Diagram]](../../diagrams/20/529efc660399c835ad9d73d058a9b164.png)
![[Diagram]](../../diagrams/14/eee29acc686c1a18ab5fd8faeb334b50.png)
![[Diagram]](../../diagrams/31/b9fb152a454a3a5af16cea892912659e.png)
![[Diagram]](../../diagrams/6/29cce1745f6228285d8a5dd3c2b23fb3.png)
![[Diagram]](../../diagrams/2/f81ad0acae47b5fd7fe1d89c56f131b1.png)
![[Diagram]](../../diagrams/0/dbf2c53999152aec276b63dc8075cc20.png)
![[Diagram]](../../diagrams/11/69299aa1352d73114ba0ebf8c7c71c19.png)
![[Diagram]](../../diagrams/24/80656c5810dd344f55905e091e7d7958.png)
![[Diagram]](../../diagrams/50/ff1c3d6dd6954953a2a9a600836bb59f.png)
![[Diagram]](../../diagrams/22/f3a67b0e7efbb3220fc997153b37ac48.png)
![[Diagram]](../../diagrams/38/ba490e39a2cb0290085f75de4103fdcd.png)
![[Diagram]](../../diagrams/27/3bed89040ad6532f1e17b8810b1e48da.png)
![[Diagram]](../../diagrams/22/5757afa97cb50f181433d00e22491689.png)
![[Diagram]](../../diagrams/20/18c3915c4f497f04372653432480d6b7.png)
![[Diagram]](../../diagrams/43/58158eded6260c37387540048abfb7e7.png)
![[Diagram]](../../diagrams/22/c8cc1359231ab53c8ef9587e70a0e748.png)
![[Diagram]](../../diagrams/33/b0cbcc1223fa06c0aed36c3272212b3b.png)
![[Diagram]](../../diagrams/50/e302b2f592d3b111a27a394b32e8d2a5.png)
![[Diagram]](../../diagrams/41/d60995c680af26b89b3fcd1d7c304b1c.png)
![[Diagram]](../../diagrams/31/1176f249876df98d191de7f153c0aad3.png)
![[Diagram]](../../diagrams/49/205b389a95d82c684cae48deeaa6efbe.png)
![[Diagram]](../../diagrams/41/d7a96682815e8cc8b0091565b07b96af.png)
![[Diagram]](../../diagrams/9/9e935fcb71bed95ad13634fc1e62ae23.png)
![[Diagram]](../../diagrams/17/5755e6fed14ee9538f15c11a48ceec10.png)
![[Diagram]](../../diagrams/32/bdbf8a6aef5e64ff48918b95f77a96ac.png)
![[Diagram]](../../diagrams/21/ec4ecc1a7167545a9bab25c41573bed9.png)
![[Diagram]](../../diagrams/31/1c4ed0e85876578b7ca951816acfd89b.png)
![[Diagram]](../../diagrams/3/25e8a4a8bdcc0ff079faf316dcd5c6fd.png)
![[Diagram]](../../diagrams/34/fd7b77675b6ef533637789143053c4b0.png)
![[Diagram]](../../diagrams/24/a9171dcaea5d7a5ebdfb8e0a59e072e1.png)
![[Diagram]](../../diagrams/12/96be23375461b628c6d9de81183101df.png)
![[Diagram]](../../diagrams/5/31ffb4a95fe9532cd1b30990d45065a6.png)
![[Diagram]](../../diagrams/31/3d935c955146ad32c1c284a58b3ae907.png)
![[Diagram]](../../diagrams/25/a0138d46de10585bc776b28dd713bd7d.png)
![[Diagram]](../../diagrams/38/01e132c57ccc2bf67aaef990ceecf87d.png)
![[Diagram]](../../diagrams/26/0fe8b6b23854f430c2be5295c35468cf.png)
![[Diagram]](../../diagrams/26/b6425f3040e6e09e7fa628f8ac59ff0b.png)
![[Diagram]](../../diagrams/0/58f409ca898e8b42bc77d054983be567.png)
![[Diagram]](../../diagrams/18/e0ea34c29f36529eca2431cf36d4de3c.png)
![[Diagram]](../../diagrams/20/1fd75331c43646338c5aee0767935689.png)
![[Diagram]](../../diagrams/14/3f802276b49bac637cec56fa6f578fe6.png)
![[Diagram]](../../diagrams/19/9ede7e9b8d075cad788f531e1fe5d13f.png)
![[Diagram]](../../diagrams/39/301e5d0818c3cfefa6b56bce00127eb3.png)
![[Diagram]](../../diagrams/35/13add39cc69de2fbf19c0c648040c69a.png)


![[Diagram]](../../diagrams/43/9d0a456a5f867589af674be0478a9f9a.png)
![[Diagram]](../../diagrams/13/0dbf13d4106fccb4d153a351bec241b1.png)
![[Diagram]](../../diagrams/20/251b9bb5f0f02e63e4d31bcd9ba590cc.png)
![[Diagram]](../../diagrams/2/50ea6263cc5a0eb07385fb5e12e9ee7b.png)
![[Diagram]](../../diagrams/36/f9034a98bf1c288e0f89c82e71b07ac0.png)
![[Diagram]](../../diagrams/36/d5191ec5903c89b9b7764ee826ff529e.png)
![[Diagram]](../../diagrams/43/614972fdb658449843ad286578db401d.png)
![[Diagram]](../../diagrams/50/f7e2dcf6fd4c681b644ce5055afeaa70.png)
![[Diagram]](../../diagrams/51/9427898a9a4ff6a88a4d7e7ff69ecd90.png)
![[Diagram]](../../diagrams/25/208c14f8f238f85f537ea9ddcafda062.png)

![[Diagram]](../../diagrams/15/2bef41fa4ef012f79926492aceb8c99f.png)
![[Diagram]](../../diagrams/41/1c142a904d612441a8fe5904c7f2b05d.png)
![[Diagram]](../../diagrams/5/5f49c30c0aae460ec501cbf8b783b00a.png)
![[Diagram]](../../diagrams/22/6a4a68cef5e9744eeaae2316cb39d25a.png)
![[Diagram]](../../diagrams/10/a25d55b9e39795fe847239e92752416f.png)
![[Diagram]](../../diagrams/19/e2b2c2950b32fab246d168fa9873469d.png)
![[Diagram]](../../diagrams/1/a33d73590e4ce4e70d3fb39409a22b92.png)
![[Diagram]](../../diagrams/26/79b72bc1caf43956bf8395810c759444.png)
![[Diagram]](../../diagrams/4/fec72dc10892e946f377fd6d22818912.png)
![[Diagram]](../../diagrams/5/1e5df1b0b9a23e6784b4044e0964c338.png)

![[Diagram]](../../diagrams/9/570714cd49f57975f484bdc5350ea3c8.png)
![[Diagram]](../../diagrams/43/3a203974ea7748823ce8cafc58fb57f6.png)
![[Diagram]](../../diagrams/49/f048462a5b6ac20430a15a6ef914bc59.png)
![[Diagram]](../../diagrams/13/8e4122c501605e55615fe67567fb907e.png)
![[Diagram]](../../diagrams/35/6550284bc8a3704b8622e27c66a899e1.png)
![[Diagram]](../../diagrams/36/33ccb49cfdb3a82b751f90dc25f45636.png)
![[Diagram]](../../diagrams/23/e873349b9921c5bb55887ad195a67aba.png)
![[Diagram]](../../diagrams/0/e7d5edb92283b367198c17540210ea82.png)
![[Diagram]](../../diagrams/28/42e51e25eb8599e732ef83160fb0f60b.png)
![[Diagram]](../../diagrams/36/112cf08f8b816f8cf0c6925a6d9e5b2d.png)
![[Diagram]](../../diagrams/51/75048d23a15d7c1a11c91b12f39651ea.png)
![[Diagram]](../../diagrams/22/a8bd076138480abacf4373fc0df26136.png)
![[Diagram]](../../diagrams/12/67d60ddf5434f16087b5524345d25202.png)
![[Diagram]](../../diagrams/50/559226febd7b1bd6a462b6d633038778.png)
![[Diagram]](../../diagrams/11/a00b6ddad3d5eeec9be100c7c1832c8e.png)
![[Diagram]](../../diagrams/44/e1816535e9b8c40670b55f7761497448.png)
![[ext]](http://elektron.its.tudelft.nl/~kkha05/goban_legs.jpg) http://elektron.its.tudelft.nl/~kkha05/goban_legs.jpg
http://elektron.its.tudelft.nl/~kkha05/goban_legs.jpg![[Diagram]](../../diagrams/49/59f204bf68b6241b9136d662abcad3f7.png)
![[Diagram]](../../diagrams/34/01a4e9d9c23a8fbcd093872b1b2e66cb.png)
![[Diagram]](../../diagrams/26/2bb72830450cd1647b6c7dc88ec08dd5.png)
![[Diagram]](../../diagrams/2/903214a3cbe4585bcc72cfd29a7aecf7.png)
![[Diagram]](../../diagrams/38/5a5e0b669b63585b7a8ee92da30c8891.png)
![[Diagram]](../../diagrams/16/a6ffa571b7d3eede4921e75bdf05e580.png)
 Made of grenen in dutch, what's the name in English? The legs are separated and can be folded. It was a birthday present for my sister and her boyfriend :)
![[Diagram]](../../diagrams/20/df7b53e333c94905dd91f50d2faa312f.png)
![[Diagram]](../../diagrams/43/51005c48743fa3ecd62310e12ab6c29a.png)
![[Diagram]](../../diagrams/26/5ff43e4e2fc1e72d794ba8e103c5ccae.png)
![[Diagram]](../../diagrams/24/02083b776e33e1d0d39255ab292dbd0c.png)
![[Diagram]](../../diagrams/41/686ef18851e53138b91f715154ed3f98.png)
![[Diagram]](../../diagrams/33/902d0308f18c19c53fbee3147950ebd8.png)
![[Diagram]](../../diagrams/50/5cfea0d435f3ee1c1d54e65fe4fe534a.png)
![[Diagram]](../../diagrams/42/0cbda7d98bba495a035c371efe26aaa5.png)
![[Diagram]](../../diagrams/4/691ae1b5b25a514e2d7bbf8477ffdb95.png)
![[Diagram]](../../diagrams/50/5f87e41e9a65c8ce43a85a2796400ded.png)
![[Diagram]](../../diagrams/18/4346fd98677b1313f658596068f1b8d0.png)
![[Diagram]](../../diagrams/28/c0f6ebf92c8ceed1e18b9622add910d9.png)
![[Diagram]](../../diagrams/1/44b8b8828e0313ec6a570ad6bbdc1bf4.png)
![[Diagram]](../../diagrams/18/7b3e46bc2bc86f9ecdfd7ce43a92bfe7.png)
![[Diagram]](../../diagrams/50/11e08839fda0741195c49d743fb7758b.png)
![[Diagram]](../../diagrams/28/3a07d02c5dcbd5b9910e443b996db8d3.png)
![[Diagram]](../../diagrams/36/03cc82fb37bf2b04fe965451774e80c1.png)
![[Diagram]](../../diagrams/28/c7f1e2bff1be519cc9146ed59aecd346.png)
![[Diagram]](../../diagrams/1/54863e5a80724bc1f6c27e62da25fa8d.png)
![[Diagram]](../../diagrams/37/e5857bd7d7b57d091d4598319fd07ece.png)
![[Diagram]](../../diagrams/14/96b509763cf1799ef1865d31857f879a.png)
![[Diagram]](../../diagrams/37/449a8cbb21195efd20e41d7f97ab0ec7.png)
![[Diagram]](../../diagrams/17/73a1ffefe2fedc8d818181c50f81efde.png)


![[Diagram]](../../diagrams/36/c80f565c0986674739a921b7cda48ff1.png)
![[Diagram]](../../diagrams/47/709c0f088bc25a190711f2d6abeec570.png)
![[Diagram]](../../diagrams/43/219bbb2ee197456e0db1be6d85249860.png)
![[Diagram]](../../diagrams/7/1d3ea122acde8ec35308ce5ab837996a.png)
![[Diagram]](../../diagrams/22/d3e84e39e9bdf5b43ee6f8882c7d7990.png)
![[Diagram]](../../diagrams/15/7fb336cf443e9dfff352df6955e0e2b2.png)
![[Diagram]](../../diagrams/14/4fdd0dbdef2b8e4903d90f421cc7028e.png)
![[Diagram]](../../diagrams/50/796445f2dd4dac3080bc30d832af9b4b.png)
![[Diagram]](../../diagrams/30/2116a3d568b3d978a96752054dfde74e.png)
![[Diagram]](../../diagrams/49/948b7279bb655ec574af6ccf51efce53.png)
![[Diagram]](../../diagrams/47/575f44eeaf53f05fd273899cef0f9f26.png)
![[Diagram]](../../diagrams/18/9d164ff66dd4446d74ffcd3bd105cd07.png)
![[Diagram]](../../diagrams/3/193b3484fbf956ab1a792d31410fe868.png)
![[Diagram]](../../diagrams/18/d3c33d35e939b807ec80808b27922765.png)
![[Diagram]](../../diagrams/31/76f44c860a25c46d24908d3f9012e129.png)
![[Diagram]](../../diagrams/11/82a1abf87f24f7492f15fdfbd1384ce3.png)
![[Diagram]](../../diagrams/41/77a00c7bcb95a18771502b40225ef506.png)
![[Diagram]](../../diagrams/49/bd7e9f9c448387cbb3c5fe3a3fb5b5f2.png)
![[Diagram]](../../diagrams/46/80db446edeb4faa36165e79bdf82a456.png)
![[Diagram]](../../diagrams/27/d96b06ecbd787c1cfe64b9aea2968dff.png)
![[Diagram]](../../diagrams/17/9c68b7c2528e6add75371fdcdef9e333.png)
![[Diagram]](../../diagrams/44/da967dc97646e1a98bc175ef9efa001a.png)
![[Diagram]](../../diagrams/30/3d395d2843cdd0ac8cb0553f379caca6.png)
![[Diagram]](../../diagrams/46/3d4a4e0e03daa63ebfc60ac7a84c85a7.png)
![[Diagram]](../../diagrams/46/fedbaf87757edc77e9bd877d98be0497.png)
![[Diagram]](../../diagrams/23/9146f8142807ae903a6ab336aad22b75.png)
![[Diagram]](../../diagrams/51/6a0272df65f6576db5830f4552f02cf4.png)
![[Diagram]](../../diagrams/32/0660c4e10e96482128176d9396bc3d0c.png)
![[Diagram]](../../diagrams/6/d82d74cc02849f587c7dd92ba4ed8242.png)
![[Diagram]](../../diagrams/47/4e84bc898bdab0f624a2324e4c1fb0a5.png)
![[Diagram]](../../diagrams/17/8d24c8013dfb995598b6f9f8215c9a9d.png)
![[Diagram]](../../diagrams/36/6ac09f07c9241f70bbcee1b90579875e.png)
![[Diagram]](../../diagrams/29/a554fd69adccaba14b26498d83041a94.png)
![[Diagram]](../../diagrams/37/1c2aaf396ffa943cd08c7a3a06601b71.png)
![[Diagram]](../../diagrams/1/7380a7ce92cf209de8f56f2bca15c4ce.png)
![[Diagram]](../../diagrams/31/e8053c0ec145557a2ccbeff29cbf5724.png)
![[Diagram]](../../diagrams/42/349e3c415c59d75634c7d1f10adc18d6.png)
 Kuroki Goishi Ten (黒木碁石店) has been a pioneer in the sale of high-quality Go equipment via the internet directly from Japan. Kuroki is a manufacturer and the prices are substantially lower than what one would expect from other retail channels.

![[Diagram]](../../diagrams/50/cbfc680421d04d60170a08a2c475d298.png)
![[Diagram]](../../diagrams/26/3236bd8260291b73441015fc9f7970ae.png)
![[Diagram]](../../diagrams/42/d92dd85dcb595e3d44828b1c602f0026.png)
![[Diagram]](../../diagrams/16/4c9798bab56a3451a69d25b306c378c3.png)
![[Diagram]](../../diagrams/8/7536301778f00766d8cf9632cb765aa3.png)
![[Diagram]](../../diagrams/1/1c37ceb6a1a827b8bc04dd44f99eba72.png)
![[Diagram]](../../diagrams/24/dacde4185092d5d50189aead4c96a4a8.png)
![[Diagram]](../../diagrams/52/44bad6878aa320d6a69e166da0c29315.png)
![[Diagram]](../../diagrams/3/e6c173b982553e2a65c1fa49747f284b.png)
![[Diagram]](../../diagrams/50/fc4b741396c53f4f57d4fcba24276fce.png)
![[Diagram]](../../diagrams/41/d14884ed04420ddd1e7262f5aa6080b4.png)
![[Diagram]](../../diagrams/47/b75b266c624637361414a95f8d10f797.png)
![[Diagram]](../../diagrams/46/31d927607b5bfad414c6334316fcfe65.png)
![[Diagram]](../../diagrams/26/08bd511a5afcf9a61350e2a3a15154f3.png)
![[Diagram]](../../diagrams/1/83bcb17e3f861035831e00ced3161f47.png)
![[Diagram]](../../diagrams/16/2aa6b19aee2e578e6ab7810ddce631a0.png)
![[Diagram]](../../diagrams/50/bf829a763eb3ebcef3ead640513a9228.png)
![[Diagram]](../../diagrams/22/321a1b85e531481a9af86d0c2297e408.png)
![[Diagram]](../../diagrams/32/a1a7689025ba169a4d7f5b15ab3ebed7.png)
![[Diagram]](../../diagrams/23/935a0053973bc27c64b6add1522bc7b5.png)
![[Diagram]](../../diagrams/18/18f032d568052766446107ec35556f12.png)
![[Diagram]](../../diagrams/12/f7f1f5861f866caf311f8b15367faa7e.png)
![[Diagram]](../../diagrams/7/44146f752ea2afbfa083f1e215622ccb.png)
![[Diagram]](../../diagrams/0/95d54d7133c51cd5152a0eee1e625a20.png)
![[Diagram]](../../diagrams/12/b0bd5838c6e5306827c9b43f13046cd4.png)
![[Diagram]](../../diagrams/17/fcf925e72bee1c89098494bc88b9a8ac.png)
![[Diagram]](../../diagrams/47/a71cb852f10c5cc93ba8a9735e70b1f4.png)
![[Diagram]](../../diagrams/20/4e0b473b193883917980a1066ef654c5.png)
![[Diagram]](../../diagrams/14/1edb38261d8cd114266217aa3e9301b0.png)
![[Diagram]](../../diagrams/51/f88238022fdd86f061d51a526ae74a7f.png)
![[Diagram]](../../diagrams/15/9db3d9bf5e430887bfe7999617726803.png)
![[Diagram]](../../diagrams/50/23019c77ca81d4800ccad0694edc7886.png)
![[Diagram]](../../diagrams/32/0b80b01001174fc397e2550736e7d820.png)
![[Diagram]](../../diagrams/13/789ae13c7aade5e8fc39afbe5f244778.png)
![[Diagram]](../../diagrams/31/7e535ce726dc00d948af59b91cac0053.png)
![[Diagram]](../../diagrams/36/17cb9a97a446e0f263b75f8c6e024892.png)
![[Diagram]](../../diagrams/28/fa539b0ef89362e5a0dcf17a20370e37.png)
![[Diagram]](../../diagrams/19/93cbde7b998932685f5f48fb1bf46b6e.png)
![[Diagram]](../../diagrams/5/97932fc5c00dd79bdff57a34f75a3050.png)
![[Diagram]](../../diagrams/3/8352ceec62a524dfb7084d85185257df.png)
![[Diagram]](../../diagrams/39/fbe4fd942a641c06cfc5dc8930e489c9.png)
![[Diagram]](../../diagrams/35/2ce3060f2e2c247c94aa4d5dc2b758f4.png)
![[Diagram]](../../diagrams/7/973872c5bcd6e9c78fdabb44651c9376.png)
![[Diagram]](../../diagrams/24/6b5749cef6daffd67d4ab51f1adb9d16.png)
![[Diagram]](../../diagrams/1/29d5f2a72ebef8335d5cb3bd78ef3a97.png)
![[Diagram]](../../diagrams/26/ff8993325592ba37292c93bf5d45df19.png)
![[Diagram]](../../diagrams/13/c8ee7e8688d70390d741f4e39ea56889.png)
![[Diagram]](../../diagrams/33/59391daec8138911e46051c77a3559fe.png)
![[Diagram]](../../diagrams/39/7a987d75a7efb8b216358fbde0dde29d.png)
![[Diagram]](../../diagrams/13/306b3b5e835814a772626d2568cdd3f1.png)
![[Diagram]](../../diagrams/25/aef69f8514d9ee3627a1fec4b69f951e.png)
![[Diagram]](../../diagrams/37/1809e27a0caceee7ae1175e9352a8928.png)
![[Diagram]](../../diagrams/40/05015c2f75f2d7b10abf71b5a6ab478e.png)
![[Diagram]](../../diagrams/26/b80fed951e8176751d56b7a7fbc82161.png)
![[Diagram]](../../diagrams/0/99d79c1fb7e2d4a3783c31951f12bb4d.png)
![[Diagram]](../../diagrams/24/2ca44a8dac8b599a42eb5ffc27c2c22d.png)
![[Diagram]](../../diagrams/14/ead6edca5c615bfb915f5922eaedd21f.png)
![[Diagram]](../../diagrams/50/b5550e732ca8bd68762fd5768d8a7ba3.png)
![[Diagram]](../../diagrams/42/b1a31c2486584e6b3371723b30a34634.png)
![[Diagram]](../../diagrams/13/b8c055c477329127a56f3640406fa42a.png)
![[Diagram]](../../diagrams/32/82a9bb6408faa59a5d56877a9004f205.png)
![[Diagram]](../../diagrams/46/f5ed77637fa19b648287a668f2675a36.png)
![[Diagram]](../../diagrams/52/02518e8fe39192a501d0902ae85c6a35.png)
![[Diagram]](../../diagrams/41/41e106265eac22daa013683faf63ba79.png)
![[Diagram]](../../diagrams/37/fc4fe5c28514b122d728f43ec2670cfd.png)
![[Diagram]](../../diagrams/7/76e62e9e2e0e3d5be9616821716291cd.png)
![[Diagram]](../../diagrams/38/35849c877507bc21765fc529820ff304.png)
![[Diagram]](../../diagrams/37/ec0c77d3457256fd651e0e04d4715627.png)
![[Diagram]](../../diagrams/30/72387f590467d77c39c57f6f13823155.png)
![[Diagram]](../../diagrams/4/ddb3334555ef06ab3d46c8ecf509ffc4.png)
![[Diagram]](../../diagrams/8/7ef8c8b658b1a5816e012510c3936b8f.png)
![[Diagram]](../../diagrams/24/12b2a824d217533ee032bcfa7f0e5aba.png)
![[Diagram]](../../diagrams/11/03109045714715cac03797a5903f970b.png)
![[Diagram]](../../diagrams/13/d66a1caaaace5a529d69a896f0cef8da.png)
![[Diagram]](../../diagrams/41/dd06b5b3737b0a04a6dff2742b06da3f.png)
![[Diagram]](../../diagrams/31/0bb6fa6724e1a1d7477264d8bc0961b2.png)
![[Diagram]](../../diagrams/23/fece6eddd6475ba2404d91cce3a589cc.png)
![[Diagram]](../../diagrams/23/1e209666714f2fe6942cd576b221b049.png)
![[Diagram]](../../diagrams/14/e181d728f37b064e427f0180a0e50dc5.png)
![[Diagram]](../../diagrams/2/98ede389d8dd479e24814b303639b85e.png)
![[Diagram]](../../diagrams/38/d59349ab69376b693af25b0ec88c7444.png)
![[Diagram]](../../diagrams/31/739a9d6e3e13446791d65d6120ab8108.png)
![[Diagram]](../../diagrams/21/f6b26ad52e5c5cddeff0f637edce1967.png)
![[Diagram]](../../diagrams/15/3fec46c3541692191a5b340760bf0c93.png)
![[Diagram]](../../diagrams/27/aaf116bd7da609946588c6e58c6f8946.png)
![[Diagram]](../../diagrams/47/a15630fb543a8f73e52b258ab2e31127.png)
![[Diagram]](../../diagrams/22/0b02fcf165191bd2b8b3c728e9a8602e.png)
![[Diagram]](../../diagrams/14/61877cb1c1b0c4b40572cda8a9f2b554.png)
![[Diagram]](../../diagrams/13/a69cb9b5220dc449c65dc36eabf793bf.png)
![[Diagram]](../../diagrams/44/c3f87cfbba97a12307840421f62286e1.png)
![[Diagram]](../../diagrams/24/00cd54af961141e3456738f3be8369fd.png)
![[Diagram]](../../diagrams/6/00358067a22f5390d19204cb3d7f687f.png)
![[Diagram]](../../diagrams/21/dfbb078ffc1132111b3a0eec4f49f77c.png)
![[Diagram]](../../diagrams/42/2653b7ce60219150165ef96817c0932d.png)
![[Diagram]](../../diagrams/50/d86de2014ada32382b45d64eb4b331ff.png)
![[Diagram]](../../diagrams/29/76492d8aea7db49a145752d0c1c8b004.png)
![[Diagram]](../../diagrams/26/23af49f805bfafc8d39f5f354b7808b2.png)
![[Diagram]](../../diagrams/42/273bce1140b7382ac7e3e0e02e503031.png)
![[Diagram]](../../diagrams/21/87935b147f216bf35766e3a86f120abf.png)
![[Diagram]](../../diagrams/21/964933232346afe5ea8e89f9a37aca0f.png)
![[Diagram]](../../diagrams/14/9f2843ba13449e417a4611ebfd00b28f.png)
![[Diagram]](../../diagrams/11/a711b2fd1418f3d1824650b70fe1eb10.png)
![[Diagram]](../../diagrams/46/4b473adf0d16c45931cddde7057e55ad.png)
![[Diagram]](../../diagrams/46/3d8079e38abdfdca73a2904151b62b24.png)
![[Diagram]](../../diagrams/23/8c266886802d16ed517e08341b7e3811.png)
![[Diagram]](../../diagrams/24/0eadde0826b9a805630f1fbaa1358043.png)
![[Diagram]](../../diagrams/23/2aa898aacb6406b4823bccbfa0819aa8.png)
![[Diagram]](../../diagrams/44/50fc8b4faac447da1f4c4b18b0d287bb.png)
![[Diagram]](../../diagrams/6/58bc0a79e65f19d872f6908de7dd380c.png)
![[Diagram]](../../diagrams/40/581a6a0286bf1a78ac01b93071db98c0.png)
![[Diagram]](../../diagrams/50/8a5e6aed2b698c30504d927527f60aff.png)
![[Diagram]](../../diagrams/33/939dbd5b6b6da52b1f8b7f3279a5aca0.png)
![[Diagram]](../../diagrams/48/409ed9f030a6604fd7ed3923bcb34b6b.png)
![[Diagram]](../../diagrams/28/7ec365f514ace6ffbfc6111a2bc97ef0.png)
![[Diagram]](../../diagrams/29/7c4ba4702866df0e5a0b30ca0c115f3e.png)
![[Diagram]](../../diagrams/19/05104dfa337b14466c3e76c902fb446b.png)
![[Diagram]](../../diagrams/23/b442da034969c84c2510640a74179592.png)
![[Diagram]](../../diagrams/42/271ff964f3c6de5ab489e314a53103e9.png)
![[Diagram]](../../diagrams/24/e8002ba44a1bfab0eba43fb6150552b9.png)
![[Diagram]](../../diagrams/49/3b9fb51eb97e28c93aae67dd53689c9d.png)
![[Diagram]](../../diagrams/30/3cf3b5da3141a4d6c9a6f27c4cf46107.png)
![[Diagram]](../../diagrams/38/3572c6792f6986686446307867163ae1.png)
![[Diagram]](../../diagrams/39/c68cc128a0886fb847d9f901037b960d.png)
![[Diagram]](../../diagrams/32/d150e1b8f12cb501950ac21d22058206.png)
![[Diagram]](../../diagrams/17/768fe9d56e94425a6205bea3380a98b3.png)
![[Diagram]](../../diagrams/23/831bdacb7955331e16e1369606499706.png)
![[Diagram]](../../diagrams/27/1a8f644bf253615c9fa87a0d5387a38d.png)
![[Diagram]](../../diagrams/37/667129426f56dfd2f84383c99beb0154.png)
![[Diagram]](../../diagrams/24/71c9971ad3b94116f4f9b8079e0a59f9.png)
![[Diagram]](../../diagrams/23/11c6f1fa3526150d1f22156454120b36.png)
![[Diagram]](../../diagrams/43/5e62de82f079646738345a1b4487b1c3.png)
![[Diagram]](../../diagrams/38/ddd7445d81ad1b216174c23854f562a9.png)
![[Diagram]](../../diagrams/18/37b97a25b858109ca452d90df919f567.png)
![[Diagram]](../../diagrams/29/de493aaedc4f4a5a9572fea9559dbe92.png)
![[Diagram]](../../diagrams/40/3e42942fa1a5784d77fdccf28841031a.png)
![[Diagram]](../../diagrams/36/e745b5e88a3d9e4843985f104f3bbfcc.png)
![[Diagram]](../../diagrams/32/e86db9764fed52893ddd7b3cda2dc0e1.png)
![[Diagram]](../../diagrams/5/8ca233997d60e9768b49f53b24ea6eb8.png)
![[Diagram]](../../diagrams/0/7085eea8b6e5a3d1866881915d335fd8.png)
![[Diagram]](../../diagrams/2/a9570762fc72bfa89fff2f072acd21d5.png)
![[Diagram]](../../diagrams/5/b92a5394ce9831572bed30f9373301ae.png)
![[Diagram]](../../diagrams/27/853e19827e341631042d5214b52af291.png)
![[Diagram]](../../diagrams/36/032ebd7b8d3549d6417374cf8475f374.png)
![[Diagram]](../../diagrams/37/b0da12ee772012015506c61991ba94b4.png)
![[Diagram]](../../diagrams/3/1552c3865589263e32e047ebbc4d0e34.png)
![[Diagram]](../../diagrams/44/cf8d3780daf763f1d944b0114b6e88cf.png)
![[Diagram]](../../diagrams/3/ce5711af059a9d5c02d5ab42d71635fb.png)
![[Diagram]](../../diagrams/9/b49a06bb70e1ce71c5ddf09dc648ae35.png)
![[Diagram]](../../diagrams/12/7dd92bda15b4ebe5698490572e85cce1.png)
![[Diagram]](../../diagrams/52/ccaf9c88e5c359197a0979e73a1f6a5f.png)
![[Diagram]](../../diagrams/50/ff74167d5c32faeb950494e2bd66c7a8.png)
![[Diagram]](../../diagrams/46/de9a10cd9f549bf024c6b0732c82fd18.png)
![[Diagram]](../../diagrams/33/b4b4e56a719f9f4fbeadb937f5475457.png)
![[Diagram]](../../diagrams/13/d466fd6162d69152017a7c6b09cdc09c.png)
![[Diagram]](../../diagrams/15/dbb4babbbbc6d402e8d00e5b685fe0c7.png)
![[Diagram]](../../diagrams/44/a88a4153acd6b43844123d0e28186470.png)
![[Diagram]](../../diagrams/7/0421e7fab7e23596e27816e198eecbd0.png)
![[Diagram]](../../diagrams/16/374f4f5897a18885c15426468030f9e6.png)
![[Diagram]](../../diagrams/8/084c616e23398005c7d33fdf092b466c.png)
![[Diagram]](../../diagrams/41/78933a4f348b5c6cf882991fd83415b2.png)
![[Diagram]](../../diagrams/27/bc787e0a08c8141db40ceedb50bf4947.png)
![[Diagram]](../../diagrams/8/bd4de5ac18a760702cd69e31e6d5d246.png)
![[Diagram]](../../diagrams/22/59eeb6d73f9151894bc106f4ddba48fd.png)
![[Diagram]](../../diagrams/38/03d979ed4405faad4e322316e94d3aaf.png)
![[Diagram]](../../diagrams/13/4228caaed06bdfb414f6b2ec2575be7a.png)
![[Diagram]](../../diagrams/7/0576c713b674f06bad0de2f1825b39a5.png)
![[Diagram]](../../diagrams/0/2904c4ca1a725d01be3b14ef37c5c1c6.png)
![[Diagram]](../../diagrams/36/ec28af1a8e15ffda867c1340d34a43ba.png)
![[Diagram]](../../diagrams/50/66d1f60e87a3231e02cd4d29ecf04f46.png)
![[Diagram]](../../diagrams/43/ecb289bb4b12390232127658848be80f.png)
![[Diagram]](../../diagrams/34/477c85e094ae539a3a61b510c2b9772e.png)
![[Diagram]](../../diagrams/3/af714ed046b6f2d13d111f73d0ae6b56.png)
![[Diagram]](../../diagrams/45/888617c30ba1b433f1497a1dfab632a6.png)
![[Diagram]](../../diagrams/0/5aaef112920b04a7808751c61ad481b7.png)
![[Diagram]](../../diagrams/21/68bdde4cf06cfc41ba9e6cea7d11c0d2.png)
![[Diagram]](../../diagrams/20/df90effb25d5452b06c5b4ac644186f8.png)
![[Diagram]](../../diagrams/52/9c33f99e8339e6ebcb6dfa6a32f528a1.png)
![[Diagram]](../../diagrams/27/ea5e13e91da1e9818b6ca3ba90672a2c.png)
![[Diagram]](../../diagrams/5/5799ab4c004a82a0f858a2d8f7d8c314.png)
![[Diagram]](../../diagrams/15/f6c8f75e6e824229841da006180f3761.png)
![[Diagram]](../../diagrams/52/9037c0ef81d36101e7361fa08c7e659f.png)
![[Diagram]](../../diagrams/44/227ee1c1dd697fbca05417cdc5ec40fe.png)
![[Diagram]](../../diagrams/9/8c682358ef8d3b88e7efa92069c0a03e.png)
![[Diagram]](../../diagrams/33/50779383e57f98e1366f40f11ea8b8c9.png)
![[Diagram]](../../diagrams/16/1b691c3879cd8f45fded4036da8a0405.png)
![[Diagram]](../../diagrams/51/cb778fff07533e82a35ba6b6e7f57515.png)
![[Diagram]](../../diagrams/4/74c94141fe96fb36179ec49c46e26c40.png)
![[Diagram]](../../diagrams/31/d3a9d3479f99e6162f3f42537880b455.png)
![[Diagram]](../../diagrams/39/78395c5982c35172b25dae14d3e35958.png)
![[Diagram]](../../diagrams/24/7c8c25ff0facca030704f1d53b80cd93.png)
![[Diagram]](../../diagrams/51/e468d21f0b225c17f5da6db35e8b5466.png)
![[Diagram]](../../diagrams/29/eb968b99e8ee6b35489f3c884f8f4ecc.png)
![[Diagram]](../../diagrams/49/272c25d13bfebf303cd53581a60009f0.png)
![[Diagram]](../../diagrams/27/3d7aa631f016151ca905accbe0b717b8.png)
![[Diagram]](../../diagrams/51/765e216ad17fd2fa439563658c2661e1.png)
![[Diagram]](../../diagrams/14/bc03091c5828a607c0fa6008acfbe8e9.png)
![[Diagram]](../../diagrams/35/0bd2b604f3879f38587b9b277ac34973.png)
![[Diagram]](../../diagrams/50/782ae0bfbecc66c8da54fcad1a85001d.png)
![[Diagram]](../../diagrams/0/43c1be6146f738fca59d0e1bcdbc4bce.png)
![[Diagram]](../../diagrams/20/3dec816613be83440518b18794d5b359.png)
![[Diagram]](../../diagrams/23/945feb31a42ef8dd2d7e250ca962c31f.png)
![[Diagram]](../../diagrams/4/a5a8095545c7fac62e34d720b1a776d6.png)
![[Diagram]](../../diagrams/34/16ecac98744cd24e78245d3dd31c04d9.png)
![[Diagram]](../../diagrams/8/f3e1ff5dee1102232eebd827e15294c6.png)
![[Diagram]](../../diagrams/22/12dfc3c7c0fd1948547446996fda15f8.png)
![[Diagram]](../../diagrams/32/46e838d3bcd063a5dbe928e7e1ad15e6.png)
![[Diagram]](../../diagrams/31/a4d2c68e31e99f3c31598fdaee1dfd93.png)
![[Diagram]](../../diagrams/10/a9235ced9bdcf1fc449612f1c4f10c8c.png)
![[Diagram]](../../diagrams/33/ff836ee6c4751814d28c7f2e9944603e.png)
![[Diagram]](../../diagrams/28/ca5e79f2a25869dcbd2e9c6e1e709a3a.png)
![[Diagram]](../../diagrams/1/e52cadeb6c80cdaedfb2c4a569580b2a.png)
![[Diagram]](../../diagrams/34/0d6306126ce1056f52aca9c5dbb2b5f3.png)
![[Diagram]](../../diagrams/32/d64565b42a6cb4664a0c6b3c42d7e3c2.png)
![[Diagram]](../../diagrams/18/70efb9f512b4a06c97488d1a813c624f.png)
![[Diagram]](../../diagrams/45/0fd0b32af1e96550a46a4b5825b89ac9.png)
![[Diagram]](../../diagrams/33/3b4639b2665fe253178e3875428e45a7.png)
![[Diagram]](../../diagrams/28/415dc43a0120760f1df25c76d5fbebcc.png)
![[Diagram]](../../diagrams/27/d87f14d5a61f777fc324cad4fd129082.png)
![[Diagram]](../../diagrams/33/6aa743aea299dab73117040df60303a0.png)
![[Diagram]](../../diagrams/2/8f6b6589230654429408981842f828cd.png)
![[Diagram]](../../diagrams/38/8baf3770dab844c904a69eae32df31db.png)
![[Diagram]](../../diagrams/0/d3db52dac3a7b7439e97a274b0e0c488.png)
![[Diagram]](../../diagrams/18/fc5e1f82e651322dc63e1bcb251f52af.png)
![[Diagram]](../../diagrams/1/de09432262b31478fc1f49a1450cf107.png)
![[Diagram]](../../diagrams/49/3c2e6ac61a6a3fedbf8ee522aee42be7.png)
![[Diagram]](../../diagrams/37/c7dff0030a81dba4b0e72f4d1850ed38.png)
![[Diagram]](../../diagrams/31/07e0f17b4278a3f3d27f4010edd721dc.png)
![[Diagram]](../../diagrams/44/a5022f99b18b424ff4f3754ae3e83f67.png)
![[Diagram]](../../diagrams/20/fbeb55d27d93bfa248fe4adacdc39d30.png)
![[Diagram]](../../diagrams/21/a9f3bf5b45b7114954648c1a328045d8.png)
![[Diagram]](../../diagrams/23/ebed69df79868e119970f352fa9f2b8f.png)
![[Diagram]](../../diagrams/32/096afa462717ad804ecbc02855560b21.png)
![[Diagram]](../../diagrams/10/3e556a398c30ed25c293e237e2ef507c.png)
![[Diagram]](../../diagrams/38/cb128d9678327ddc390faf9cdcc6312f.png)
![[Diagram]](../../diagrams/4/f1745e72c4191085d830e26047630baa.png)
![[Diagram]](../../diagrams/7/7f25c1683aa74ffe73029344d75741ae.png)
![[Diagram]](../../diagrams/42/b9f42e52d9816132e01119a6127eaced.png)
![[Diagram]](../../diagrams/7/2979fecbe66641f97e4afed53b000e3d.png)
![[Diagram]](../../diagrams/7/41090ae7544789759494c81e295d5890.png)
![[Diagram]](../../diagrams/44/43163909827fe00613c1846c7613cc64.png)
![[Diagram]](../../diagrams/38/f2f53e2e1ba88fc15fa267c363577826.png)
![[Diagram]](../../diagrams/36/5572c46022255a04942af71aab61fc99.png)
![[Diagram]](../../diagrams/33/e03aabf13d7c9627b94175251ddeeb74.png)
![[Diagram]](../../diagrams/1/22a290154a0dd4bb938448c3ab4ab278.png)
![[Diagram]](../../diagrams/32/4acee47365fbcfccc79583159fd22ce9.png)
![[Diagram]](../../diagrams/16/6ae7833184fc17f83a0ad1cdcc7945e6.png)
![[Diagram]](../../diagrams/29/5912a6617e6fa202ea9b3c1e648d9dd2.png)
![[Diagram]](../../diagrams/39/08d0dd662a8c78df746cd70debd4792b.png)
![[Diagram]](../../diagrams/5/9a741fbd3c0871a4a51a30c41d8dcebb.png)
![[Diagram]](../../diagrams/24/994a398321323553c0ebb36b92f3ddd5.png)
![[Diagram]](../../diagrams/50/f5e30218aae11af7e082cb34f62c10c1.png)
![[Diagram]](../../diagrams/39/2c6a24e724a674da5cbe6a16796cce34.png)
![[Diagram]](../../diagrams/37/c11076f01a0a395630270b45624d10b6.png)
![[Diagram]](../../diagrams/26/55ffef02c47f67b3ad74dc7d602a3d7e.png)
![[Diagram]](../../diagrams/42/6614674dfc1990c1ae013c5e99d8d2d9.png)
![[Diagram]](../../diagrams/47/8befa75050a22c1f2433a77956768b5f.png)
![[Diagram]](../../diagrams/31/56418f64db6df3ede3965ef7c3108b84.png)
![[Diagram]](../../diagrams/1/be6a2af14b64c472ef8d2cce10c950f3.png)
![[Diagram]](../../diagrams/6/da49eabedc0af87744bd131181b1db7d.png)
![[Diagram]](../../diagrams/11/7c54f444557488a19b2a802304c40045.png)
![[Diagram]](../../diagrams/52/7623e28210f54d9f64129fe986137c6a.png)
![[Diagram]](../../diagrams/3/3c3ee7191fb09610780ffb717e6ca877.png)
![[Diagram]](../../diagrams/37/21c1533a658559d6ad6b60ea2d9aa772.png)
![[Diagram]](../../diagrams/41/2936df63d439003c7ee739e842c27454.png)
![[Diagram]](../../diagrams/47/4227b863bf6e11511a9536d6cd92e102.png)
![[Diagram]](../../diagrams/28/2a3d680ac3fa5452cf9cb97b66b5fd7a.png)
![[Diagram]](../../diagrams/38/108c794e9474f8fc081485391dfd201b.png)
![[Diagram]](../../diagrams/16/fd019d3032be64f1ba34802b28a8f318.png)
![[Diagram]](../../diagrams/39/b73e0d0538fa84be428dd49938b03498.png)
![[Diagram]](../../diagrams/42/2d69a1bf2d3fd392ad43c94ad76f7f00.png)
![[Diagram]](../../diagrams/33/9783517ff6b2e152c0142028cc38c668.png)
![[Diagram]](../../diagrams/3/38ba91724535d73900d70589bc161461.png)
![[Diagram]](../../diagrams/10/a6920a1be4238a1961ab42f6e40b4e2d.png)
![[Diagram]](../../diagrams/52/3c49377fa0e3e77f0558ada287055220.png)
![[Diagram]](../../diagrams/34/a75ae7f782cb3f916e458cad379efe6e.png)
![[Diagram]](../../diagrams/17/12ed17086f7649e130990db2e47f45c0.png)
![[Diagram]](../../diagrams/51/673553920e39df9b22ed41c2bc128d07.png)
![[Diagram]](../../diagrams/30/67075a9aa2b992b92cad45fa3b00e8c2.png)
![[Diagram]](../../diagrams/13/d5d2c5f129056efd265785951362aa32.png)
![[Diagram]](../../diagrams/21/eff0a18c5b89206620338c93c54141ed.png)
![[Diagram]](../../diagrams/10/bf06aec042329f1c3e9602e673a3b7f5.png)
![[Diagram]](../../diagrams/51/4d1bb55567ca25eb3c1ba7f8f87b874b.png)
![[Diagram]](../../diagrams/4/e6bf239de12d35d95fa58699f093d650.png)
![[Diagram]](../../diagrams/48/0d7f84e5c1c570d595d46f6af8ab0383.png)
![[Diagram]](../../diagrams/27/9fd9e226b08b9796d8abe50733eb737b.png)
![[Diagram]](../../diagrams/47/106cb7d2de640ab51257e4de9b132f1f.png)
![[Diagram]](../../diagrams/29/3783509efe507c490e06fbcaa33309c3.png)
![[Diagram]](../../diagrams/48/882c1507b8e1cc82b5200d8d7024044e.png)
![[Diagram]](../../diagrams/3/144dc90892d45ebb35497ba58d64a9d2.png)
![[Diagram]](../../diagrams/16/0590147438e7fe339106a3b164effa04.png)
![[Diagram]](../../diagrams/16/64ffc5482250bb56f99e9a0b41cf0481.png)
![[Diagram]](../../diagrams/26/5631ea989b627533ccfbd5265adab900.png)
![[Diagram]](../../diagrams/11/b93142c34f067d68dd2c46a918b241e9.png)
![[Diagram]](../../diagrams/22/ab66bd91466fe2d7760ad93bcdae76ed.png)
![[Diagram]](../../diagrams/30/9e1352b76f983a683bda02a97a618d99.png)
![[Diagram]](../../diagrams/9/7381629a3805d333fd0e074d43f4760e.png)
![[Diagram]](../../diagrams/21/e9d58b7b23727a8ff784ed105c76a8ad.png)
![[Diagram]](../../diagrams/0/9e1f2ad7988b7917e79b04b663d5e2da.png)
![[Diagram]](../../diagrams/12/912082201ab9522e9a276cee262a4887.png)
![[Diagram]](../../diagrams/0/469a55b13578a1dce2384e8a4fb4c163.png)
![[Diagram]](../../diagrams/38/a6c373b3e42ea4df048011e6d05290ca.png)
![[Diagram]](../../diagrams/2/480daa6ab9a3b1f091f3aa05dc026ad3.png)
![[Diagram]](../../diagrams/42/feec0f9b1baf9f4879c0a2bed544247c.png)
![[Diagram]](../../diagrams/8/3e850effdcbaf6d21e9751dcb200700b.png)
![[Diagram]](../../diagrams/4/3196ee5bf72d40201da58abc1e8cb989.png)
![[Diagram]](../../diagrams/3/9906b51e985b035aab48bfe145356578.png)
![[Diagram]](../../diagrams/15/2dc8a6d2697e188d2a530a375b328335.png)
![[Diagram]](../../diagrams/29/246ac8a4cd0a938d6943fd2f509534ae.png)
![[Diagram]](../../diagrams/50/4e85f250f0518f8512dab10546102d08.png)
![[Diagram]](../../diagrams/28/eb25ec2395909a610e0704b6038c4d48.png)
![[Diagram]](../../diagrams/24/828c3a5593cea254f76411c6e8304898.png)
![[Diagram]](../../diagrams/10/eb18495e1b7f2e36ce722152b5a4f6e8.png)
![[Diagram]](../../diagrams/25/8b23b1fb7f1bf8a07c8078eb5f698869.png)
![[Diagram]](../../diagrams/26/a5c2b306f348efc6d0ddaf0e82955f5c.png)
![[Diagram]](../../diagrams/3/3a12182a4f881da9ae03f3dfce721aa0.png)
![[Diagram]](../../diagrams/50/22564ee114e0244fe1b217054e389864.png)
![[Diagram]](../../diagrams/44/85d4f09c7fb702f23f902730a771a7be.png)
![[Diagram]](../../diagrams/11/3f2f1ddf8bc446932c670e868d9cfa2a.png)
![[Diagram]](../../diagrams/15/8f896ed90af9f869c4b05f388a435b20.png)
![[Diagram]](../../diagrams/13/564c6bbe64859ef481e41c8551677f6b.png)
![[Diagram]](../../diagrams/21/34feaae91ef0e177cab778e1dd085c5b.png)
![[Diagram]](../../diagrams/27/dd3485e9d77ffbf234d285f2ffc71729.png)
![[Diagram]](../../diagrams/4/8703aa5be15698e470f3ab3570bb1d06.png)
![[Diagram]](../../diagrams/0/df5dba22db833c4378f937d7421253e3.png)
![[Diagram]](../../diagrams/16/63d013e084983dfc06ca4ad398fd1ff1.png)
![[Diagram]](../../diagrams/42/dcf50f14f62d509005bd0dc070760904.png)
![[Diagram]](../../diagrams/45/082185e72797ad08684b81d8b7201402.png)
![[Diagram]](../../diagrams/31/b14eb4d3eb078d3192dcf21c7851e4df.png)
![[Diagram]](../../diagrams/1/46e19e49238ad79b5ecb2299de4c24b8.png)
![[Diagram]](../../diagrams/4/f50a9c64f721515feab25648aee0964a.png)
![[Diagram]](../../diagrams/32/75f895425f521c0eb431900d8e106573.png)
![[Diagram]](../../diagrams/41/5dde6940fb5454da4510da0d64cef1f6.png)
![[Diagram]](../../diagrams/48/f6683a2818ff056fba68c132a458ea8a.png)
![[Diagram]](../../diagrams/31/d1a9a17672a446d0433d90b410cff993.png)
![[Diagram]](../../diagrams/21/7f05974efb245ef96cd7ccf4b425b3f6.png)
![[Diagram]](../../diagrams/31/a025a4f7d8bdc540c3efc6d8deb865a0.png)
![[Diagram]](../../diagrams/9/b6801bc170a91c08bd63e947a11ef3f1.png)
![[Diagram]](../../diagrams/4/a2fe700f88ce9b34d9c396ebd56c90d9.png)
![[Diagram]](../../diagrams/23/cbb605e939256879634d0ebf4f9d32f6.png)
![[Diagram]](../../diagrams/31/8b3b64ba8703062fa3863b601b3291db.png)
![[Diagram]](../../diagrams/32/ecc674723399dcb5df9e256598fc7ed2.png)
![[Diagram]](../../diagrams/17/5b5b30f19e61462b286f108d41733781.png)
![[Diagram]](../../diagrams/5/53f3d46bfe5fa5733e9d1690c68e7c90.png)
![[Diagram]](../../diagrams/38/4b407f8fd5609fcff15d751dc3cbcf6a.png)
![[Diagram]](../../diagrams/38/851a652455614885bc8ede94816891ad.png)
![[Diagram]](../../diagrams/10/8c8a3ca140d48c389bfae1f0013222d8.png)
![[Diagram]](../../diagrams/41/bf3c542c8eb7ef5bf2788402bc0996bc.png)
![[Diagram]](../../diagrams/45/4ef24d474cb8a63725878c5ff3bc11c2.png)
![[Diagram]](../../diagrams/34/5f3924eeb558fef7a7b3bb8e571e4129.png)
![[Diagram]](../../diagrams/21/e388f7f7c383aa9811176f143cc40d2c.png)
![[Diagram]](../../diagrams/45/eca154bfa0254c64aa3ea05326b55c51.png)
![[Diagram]](../../diagrams/11/6081f2be0b91ca0881ed62a9e1484a25.png)
![[Diagram]](../../diagrams/9/319df829181d64b5453bda021eca196d.png)
![[Diagram]](../../diagrams/5/5e2f7f4fb1dfb2d17d5c7dd173f8a1d0.png)
![[Diagram]](../../diagrams/21/b1dc04188716221e9f971ac4f96cd5cd.png)
![[Diagram]](../../diagrams/12/d3a26f8d7075057fbae1872e0ef7fc0a.png)
![[Diagram]](../../diagrams/17/5d791a754ec42af6d6fd494a2ea58a66.png)
![[Diagram]](../../diagrams/8/e4f450b2c94ffa3e1e0e6a4dee3a77ee.png)
![[Diagram]](../../diagrams/20/514e47675263ee2d1829a43036c11548.png)
![[Diagram]](../../diagrams/47/494c2de2393f18048788891f2f44bfe0.png)
![[Diagram]](../../diagrams/7/742f5ae06032b9446194976427ec49b9.png)
![[Diagram]](../../diagrams/32/e855bebc4d2e6c9faa6c7344b8c16a67.png)
![[Diagram]](../../diagrams/18/a3adb463ebea362a319afc8b4f3eca40.png)
![[Diagram]](../../diagrams/52/ade7b2fb83c730c96177b7cb5ba981e6.png)
![[Diagram]](../../diagrams/16/b584b17641d0a51818c844465370c786.png)
![[Diagram]](../../diagrams/45/3633e306866b7caf5a22055925984498.png)
![[Diagram]](../../diagrams/17/9d7400e61b586d0d5e54277bcf4ab0e7.png)
![[Diagram]](../../diagrams/27/417f16a93c57720231c81bfa83fcee01.png)
![[Diagram]](../../diagrams/11/ad8a1f81358aa8126140cc0408714160.png)
![[Diagram]](../../diagrams/38/61d1e7a2c823252b5646adb0da2966b4.png)
![[Diagram]](../../diagrams/24/ee8d087163fa1a0c2d3f132c93d416b3.png)
![[Diagram]](../../diagrams/12/0573489df65aedb0c3659e174021904c.png)
![[Diagram]](../../diagrams/43/f79de7502803e391137e74cbb82bbdf1.png)
![[Diagram]](../../diagrams/30/087dea7e02b27627c3f7206df954df96.png)
![[Diagram]](../../diagrams/3/49cc95d580563e722bcc92e29df665e1.png)
![[Diagram]](../../diagrams/36/b68873f99dbd708a1e130ea63f73f971.png)
![[Diagram]](../../diagrams/2/701a88440085de5c10c844c8a90ab652.png)
![[Diagram]](../../diagrams/52/302e24a0667fb33237103468220c88de.png)
![[Diagram]](../../diagrams/23/01f1ee4f743c10a400bcbde1ea81e3d9.png)
![[Diagram]](../../diagrams/52/7643cd990a84aec27c62b48890c7ec74.png)
![[Diagram]](../../diagrams/36/3787d92d2c283ea38431493ea8dc1ec1.png)
![[Diagram]](../../diagrams/20/ede92c2947394ba92d583681cc636fba.png)
![[Diagram]](../../diagrams/26/66b18e6fb034a49a9ddeff126efa2bc5.png)
![[Diagram]](../../diagrams/50/03b0de409b5ca450cb796e9037a41152.png)
![[Diagram]](../../diagrams/1/5fdbfeffe374c5ea0ce28abfedf1dced.png)
![[Diagram]](../../diagrams/37/c5be6c1ecc9b46eb1105bab934261c7b.png)
![[Diagram]](../../diagrams/35/faeac47f2efcaa16b3aacd1c4efef7fe.png)
![[Diagram]](../../diagrams/17/70eb81ad31425288b5ed4bce45c8285d.png)
![[Diagram]](../../diagrams/48/47c857a1a0474dbaa8824ae6b34d90fe.png)
![[Diagram]](../../diagrams/42/60b17b7e38af67f960b02007307973a8.png)
![[Diagram]](../../diagrams/44/4b765e42b3fca051161ac2cc2b992d63.png)
![[Diagram]](../../diagrams/14/5d0f60c2cbfea4b733db7787835ad31c.png)
![[Diagram]](../../diagrams/51/492e71ac509986ede395c73fffa98627.png)
![[Diagram]](../../diagrams/26/dd654833f56b4e06872e580f1389220f.png)
![[Diagram]](../../diagrams/37/3a37505ddd30b8a36b144e0623fbfa78.png)
![[Diagram]](../../diagrams/34/2ac672daaa556eb00d3778d7c43f4962.png)
![[Diagram]](../../diagrams/37/6d91c3e65b854e1a2d338fc31aee5bb9.png)
![[Diagram]](../../diagrams/16/625fbb887f855248dbd6ea00c8c0d2c7.png)
![[Diagram]](../../diagrams/47/6b35a7451fd27be06ae1e125c0ae7887.png)
![[Diagram]](../../diagrams/51/b68ff50fbc907359548c45c011e1e1e8.png)
![[Diagram]](../../diagrams/33/b95e0699247bbee08695c073048d19dd.png)
![[Diagram]](../../diagrams/23/67dfe996b84984d56f8f411dcc519819.png)
![[Diagram]](../../diagrams/26/6021f38f5adcf3c4604b3fd5ea350add.png)
![[Diagram]](../../diagrams/19/9dd29fe1bc01ad75087a8ba0a5cc155b.png)
![[Diagram]](../../diagrams/38/c30cc6752533ea2cd04c23ca246e4339.png)
![[Diagram]](../../diagrams/26/6c72f5d38d88dcecc09d6132da46d2cf.png)
![[Diagram]](../../diagrams/34/d73cf77bff08a26908470941e5f67064.png)
![[Diagram]](../../diagrams/24/920bf4f7e01369fb629f45a102e1893d.png)
![[Diagram]](../../diagrams/37/e6abbbfed9097dfb7b8835ecbf2ef173.png)
![[Diagram]](../../diagrams/8/2c216a938d1ee94e80118cc1f8387263.png)
![[Diagram]](../../diagrams/3/45f449ff5589f3acb6ced747bcf76ab2.png)
![[Diagram]](../../diagrams/43/deab7dabf43e2b5953145c7d54ef6b51.png)
![[Diagram]](../../diagrams/31/2c1a873567ac4de007460977f5d050f4.png)
![[Diagram]](../../diagrams/32/c6e0c250e4bca67d08e7ec89496617b6.png)
![[Diagram]](../../diagrams/10/81c456b5e828939eb88d87b11db83fa4.png)
![[Diagram]](../../diagrams/10/3ca2fb0085b5517ae0949d2b1a875b0b.png)
![[Diagram]](../../diagrams/11/5a86d516e99b1e17c07c8fa3450f0553.png)
![[Diagram]](../../diagrams/16/9e691ae958534165a43e56941255c679.png)
![[Diagram]](../../diagrams/28/5d633a4e26985fc42a98e5b37225f2fc.png)
![[Diagram]](../../diagrams/12/bfaa25f176ba82e3758496222d8ffcda.png)
![[Diagram]](../../diagrams/32/7570bc7883429826a185237793d4104d.png)
![[Diagram]](../../diagrams/37/213839e115767e85bad55f575fcb1e87.png)
![[Diagram]](../../diagrams/49/6a914e46b21bd820d95f87720d34379d.png)
![[Diagram]](../../diagrams/6/40b0499add659967ff4add8f6492ecb0.png)
![[Diagram]](../../diagrams/5/2348b77e7ac99a17d41745f7cc6717f4.png)
![[Diagram]](../../diagrams/21/6ce31ef5b6915bf9233d87ce4983ec49.png)
![[Diagram]](../../diagrams/47/4ddcebec331c1eb57af704ff827bb5a0.png)
![[Diagram]](../../diagrams/45/49b8f5daa38a637dd30c36bc416f1263.png)
![[Diagram]](../../diagrams/38/5c1a9f01e8f5f373de22299812b904a6.png)
![[Diagram]](../../diagrams/24/fe95244470dcfb4a7c8048d5f9a052d4.png)
![[Diagram]](../../diagrams/35/efa6b053392046dffaf01b14ce60b82b.png)
![[Diagram]](../../diagrams/41/4d49067c2ba73b0b3783a772a3c083c7.png)
![[Diagram]](../../diagrams/25/58959f4fa62bb4c8d1127ff9765213ce.png)
![[Diagram]](../../diagrams/10/4559595b3dc52c1fb9f34e6751359e59.png)
![[Diagram]](../../diagrams/44/57834dd0de87012fcbd6ecc1f77862ef.png)
![[Diagram]](../../diagrams/33/853cf25b2af7fcae09b8bebab383d3b1.png)
![[Diagram]](../../diagrams/37/449e5bb691897e728b136207a77faea0.png)
![[Diagram]](../../diagrams/50/0fc87fee6e0188b5994e8919ca43eced.png)
![[Diagram]](../../diagrams/10/1fccf72ca78cc1e02cc8a18b22ed3674.png)
![[Diagram]](../../diagrams/23/c5301238d7340155d126f7e69c2b432f.png)
![[Diagram]](../../diagrams/19/23b3d07628b5e699b4aa8b97b5f70f6f.png)
![[Diagram]](../../diagrams/41/86f7804279fb3b23f42a91a57a617db6.png)
![[Diagram]](../../diagrams/32/c988eda503124f018bc546fbb6acafa0.png)
![[Diagram]](../../diagrams/42/c8a4405eda71020250dff8828aec7c07.png)
![[Diagram]](../../diagrams/47/188013ebe9122f01c00cd284d3316cf6.png)
![[Diagram]](../../diagrams/42/bcfdc3c512a337fb6586d29cf5b4a738.png)
![[Diagram]](../../diagrams/15/ee89fd699d7d3c95b962ad2203c7c104.png)
![[Diagram]](../../diagrams/26/b82198d3954862d62bf70ccccc56105a.png)
![[Diagram]](../../diagrams/3/474c121ba42ed09ea8961756f8acd0b2.png)
![[Diagram]](../../diagrams/20/00a0a4732c7923a8d6e1c396877435db.png)
![[Diagram]](../../diagrams/19/aa880268943b1871b3926be7c0249172.png)
![[Diagram]](../../diagrams/32/b0ab6a757d2457fc863aaf388c80f58f.png)
![[Diagram]](../../diagrams/32/ab1c229f65e7a5fcb3aa4a62d31c0586.png)
![[Diagram]](../../diagrams/0/cff860a9f591cec073516407d2c3e36d.png)
![[Diagram]](../../diagrams/5/fbe7330d66fb091ddbe32369a3526a71.png)
![[Diagram]](../../diagrams/16/78ff8ce49617b0613f2f87fa812a496f.png)
![[Diagram]](../../diagrams/25/62f44ea1ff0c71d5fe19f1fdde28ee1a.png)
![[Diagram]](../../diagrams/47/8e26d64e0c10c617977bb0866f44168d.png)
![[Diagram]](../../diagrams/36/42a74d417c524208d6aab632a7f28aa0.png)
![[Diagram]](../../diagrams/13/a3ec67346e8fd2d4c980c8cca7d1d8e5.png)
![[Diagram]](../../diagrams/40/e0effce463df556a956b285541e623b7.png)
![[Diagram]](../../diagrams/28/6441701cf0135a43b4f4de3f8180db1c.png)
![[Diagram]](../../diagrams/29/d318742b345d858ca188fdb71140bb56.png)
![[Diagram]](../../diagrams/2/d1eccb2636dd1ebbacc26169285dd986.png)
![[Diagram]](../../diagrams/1/5041ccf2c99fb5ac9637d013447120ab.png)
![[Diagram]](../../diagrams/22/526ce877ae42226fce3e5774d79c45c7.png)
![[Diagram]](../../diagrams/45/ed6a0394be3f27cfd658559754edb6f3.png)
![[Diagram]](../../diagrams/45/0499d8b597e8a4f6d1511cad60149dbd.png)
![[Diagram]](../../diagrams/24/4ae230bffb4afe7f554e4c6f42490c0b.png)
![[Diagram]](../../diagrams/14/dec6b736b3938e291928d610203e96af.png)
![[Diagram]](../../diagrams/47/b5eff99157a1a5a8c9b588eedd4a3d81.png)
![[Diagram]](../../diagrams/2/5bb08d1bcb857b1ab7bd66b9655327ef.png)
![[Diagram]](../../diagrams/46/dcf74bb460d8bf040a7abddd6ec510ba.png)
![[Diagram]](../../diagrams/2/1b8c5211e3c956fe75b86446d739f56d.png)
![[Diagram]](../../diagrams/18/568a405913015cd40c8b6e835b0e5ac4.png)
![[Diagram]](../../diagrams/28/6782b345729c142db92e965ca708c9a8.png)
![[Diagram]](../../diagrams/50/9e7f056d10718b299740497f96ca8d22.png)
![[Diagram]](../../diagrams/34/f3a069f8961d61aff3cc761b6c3c25e8.png)
![[Diagram]](../../diagrams/32/b0fcd2530a782669d88209d4a1b6637a.png)
![[Diagram]](../../diagrams/36/5bdc0754ddf28753fce16726581a9780.png)
![[Diagram]](../../diagrams/10/c32339e976e113021ae6472824fde582.png)
![[Diagram]](../../diagrams/46/f18109efd565c7624391629144d4b6d4.png)
![[Diagram]](../../diagrams/11/7edf33d7fbbc53a09b8e7cfbee56bfba.png)
![[Diagram]](../../diagrams/40/8224f959119761dc22582a672834f5c6.png)
![[Diagram]](../../diagrams/37/f94ad2a88a5d7bc18928cd34484c731b.png)
![[Diagram]](../../diagrams/14/c792f50d05b78d6ee3243c3a2e6893e1.png)
![[Diagram]](../../diagrams/43/7c65b8dfd51937bf78b7f5641e9d9195.png)
![[Diagram]](../../diagrams/1/09eafb3c4cfee22366e87e88c9459c5f.png)
![[Diagram]](../../diagrams/19/73c50fdbf4f7c5b9b77080b570b9e4a8.png)
![[Diagram]](../../diagrams/4/068b1308f70310364f2734ac55372f87.png)
![[Diagram]](../../diagrams/6/30d2d1a71345f2d58ec24c8dcf26b61e.png)
![[Diagram]](../../diagrams/39/bedbe0190de71112659c6f0f6f011bb0.png)
![[Diagram]](../../diagrams/29/96520db7e79fb2093904fc74432f24fd.png)
![[Diagram]](../../diagrams/48/f7ebfcc1c765e209eb57402239af348f.png)
![[Diagram]](../../diagrams/21/57e0f77fc71126a0b7120290a52b72da.png)
![[Diagram]](../../diagrams/13/638dc4dc5e27f295540b124465fdbd48.png)
![[Diagram]](../../diagrams/18/1b19ccdac9d09f31b55fd31d2c4f5b97.png)
![[Diagram]](../../diagrams/42/db0767d2b533964f6a7cf3f6ef590c4c.png)
![[Diagram]](../../diagrams/19/d0f69500ae117c41f48a70e1afc5dd58.png)
![[Diagram]](../../diagrams/8/086ef77d248ba5e131694659d0a3e94c.png)
![[Diagram]](../../diagrams/10/19bfa0c79ccb9581f3e0f566ac6d5c29.png)
![[Diagram]](../../diagrams/3/475828e37121801cf02920a9fa9180ee.png)
![[Diagram]](../../diagrams/47/0d427de0887c793aec0f57a18f8ccf9a.png)
![[Diagram]](../../diagrams/31/2f49548723a45c4d56e0b713b49a7da2.png)
![[Diagram]](../../diagrams/2/b603a84a6840f68d8ed7f66d847f509c.png)
![[Diagram]](../../diagrams/21/571025af2980fe899083f77710162cc9.png)
![[Diagram]](../../diagrams/8/f3672268c4238d8ad48f2bf3a860e3d5.png)
![[Diagram]](../../diagrams/44/1450d94e73c0612f586d82819bf99d62.png)
![[Diagram]](../../diagrams/28/7e3628c087c3f5741f217b62c7efdc10.png)
![[Diagram]](../../diagrams/49/a827a8e5f95255855cf9423629e65176.png)
![[Diagram]](../../diagrams/52/294baeebef79758e675aa2aa30bb67c3.png)
![[Diagram]](../../diagrams/20/e932f7821e4a845e436362bcc097406d.png)
![[Diagram]](../../diagrams/35/aab2c992534adcbbc44de2011b1c99e1.png)
![[Diagram]](../../diagrams/6/0b7f3a03d23d5b57422861abf71320bb.png)
![[Diagram]](../../diagrams/45/72e80f04d18e7fa25926d243c2d3071f.png)
![[Diagram]](../../diagrams/24/fae2f4fbaa085899e84a34951441088e.png)
![[Diagram]](../../diagrams/45/0d40cadf9eb5f16250ab418d94632c58.png)
![[Diagram]](../../diagrams/7/0658bf2a5d29bb55bece81cd55898863.png)
![[Diagram]](../../diagrams/45/fcd8acdfadb831a5ca0e636cf423548f.png)
![[Diagram]](../../diagrams/52/fa1147fbfc94132d9a720d7e739fd4da.png)
![[Diagram]](../../diagrams/46/b1090e98411336408a58f9544b0a7456.png)
![[Diagram]](../../diagrams/50/db2a1a054ea1c9bc9b0452b571b3a2b6.png)
![[Diagram]](../../diagrams/8/ab75905e0aaf660a1c310efe62ac81a0.png)
![[Diagram]](../../diagrams/47/9c448c9f4bfe089c728046036e58af5a.png)
![[Diagram]](../../diagrams/1/94e4d2c74cd15bde961c1ad8c99f1422.png)
![[Diagram]](../../diagrams/1/fb1d0dcc1b8344c849c0705e23b90fce.png)
![[Diagram]](../../diagrams/12/578dba5476784cd0aa2e110360b84435.png)
![[Diagram]](../../diagrams/43/adf5cbd040c90d8f98886e4efd7f661d.png)
![[Diagram]](../../diagrams/45/372e05a123d8f13d28b694fef4273d20.png)
![[Diagram]](../../diagrams/20/f1895d605ab1b74aaa4e9aabbccff027.png)
![[Diagram]](../../diagrams/20/e5e2aeee205ed245235658e582196e76.png)
![[Diagram]](../../diagrams/34/4ee09f60e77d83ee0f1d2b238446bca5.png)
![[Diagram]](../../diagrams/15/6917d6a8aee94fc37339141b5b1a23f6.png)
![[Diagram]](../../diagrams/40/0e815e756401f390255301f13a3083d7.png)
![[Diagram]](../../diagrams/39/6a291c112f5604a9f9cb0d147bd6e925.png)
![[Diagram]](../../diagrams/32/ce10e4c037c2090cb360d4092f7e46d3.png)
![[Diagram]](../../diagrams/46/3cf0846b05d7b43bc4d99cdf4032e2d1.png)
![[Diagram]](../../diagrams/3/23ef747b08120961531c70c0d63e9616.png)
![[Diagram]](../../diagrams/50/a8ddf2303f7fb01d8dfe22c0d8dea6a6.png)
![[Diagram]](../../diagrams/46/0001e77d57bae91357575cd2793bbd21.png)
![[Diagram]](../../diagrams/33/7a6103cae3b92ccca3ad569f886e8d34.png)
![[Diagram]](../../diagrams/40/99cbedaff52c480c566b016d431af408.png)
![[Diagram]](../../diagrams/47/3b58d9ce115d10c8d57713627df1809c.png)
![[Diagram]](../../diagrams/8/626fcf11d0b329b455877f6c2752dc40.png)
![[Diagram]](../../diagrams/17/4447085a448b5a2d1c881993d78a408e.png)
![[Diagram]](../../diagrams/43/d37e15ef4c031bf9fc944d339b0dcd7c.png)
![[Diagram]](../../diagrams/20/2ba7e092abf8824bc6b430a9537e6f79.png)
![[Diagram]](../../diagrams/47/b12370b98642b56646a43329b7e5bff3.png)
![[Diagram]](../../diagrams/47/8affb48360d1c5d796074921b715bebf.png)
![[Diagram]](../../diagrams/38/bcf29e5b4e82fbb824bfed18d17ba980.png)
![[Diagram]](../../diagrams/31/4c91ece1e8cfc4a882dcfac8df3b0516.png)
![[Diagram]](../../diagrams/0/3aa8c32bfddc312a776516437dabe48b.png)
![[Diagram]](../../diagrams/37/57a397244e17b8ac45afc17097b08e40.png)
![[Diagram]](../../diagrams/15/966c643f9c841ba7806f266f86a964f5.png)
![[Diagram]](../../diagrams/20/57116d04e3ee520f55224a863a5a500c.png)
![[Diagram]](../../diagrams/42/de6ee11af21bdb19c4d2730c276e7f45.png)
![[Diagram]](../../diagrams/29/fce05746b183b7c4c698b67e7f86f98c.png)
![[Diagram]](../../diagrams/22/5732eaad2b5dd8593e516f85e12cb16d.png)
![[Diagram]](../../diagrams/3/a5296e1cde3e8d44713eb9722b2e4416.png)
![[Diagram]](../../diagrams/6/274076c245dc8a1188c479c31093aa50.png)
![[Diagram]](../../diagrams/13/f7091a19c879c571022f31a004875b73.png)
![[Diagram]](../../diagrams/48/39fa9ed15172d5a7e570b05cbe03b63a.png)
![[Diagram]](../../diagrams/37/653bbffbaeaf6381bfb7ca8445af8b0c.png)
![[Diagram]](../../diagrams/18/21bc8b451dea31e629b04052420428bb.png)
![[Diagram]](../../diagrams/48/9934e91487f9a155792c258213917171.png)
![[Diagram]](../../diagrams/8/02a266bad44aa72dbcc404fed760ce93.png)
![[Diagram]](../../diagrams/34/e153ac7cd8755a1e09ee7d2a074d0f91.png)
![[Diagram]](../../diagrams/17/774dd3759a82a2931333b84d422d9495.png)
![[Diagram]](../../diagrams/34/57f337327a1ef81cb6cb373eb4eae8b0.png)
![[Diagram]](../../diagrams/49/85bb7d91e41b99e5829ef45236a50680.png)
![[Diagram]](../../diagrams/12/83a55864e128389364d9d5828bed6054.png)
![[Diagram]](../../diagrams/6/7f5b1f3e5bf5d6a6a857872a69ac5240.png)
![[Diagram]](../../diagrams/40/bc17bc751f967a0774719ecc5e20bc6e.png)
![[Diagram]](../../diagrams/40/125cf628571994112618858d8000fcb8.png)
![[Diagram]](../../diagrams/6/a3080c0a8eb822a426d2a72703f9268b.png)
![[Diagram]](../../diagrams/39/4188e1804e1834b29f247d0bd16d590e.png)
![[Diagram]](../../diagrams/13/46be6ed2e9eb696db780101a8839d5d3.png)
![[Diagram]](../../diagrams/0/cd39d4c8ed85c92eb0fb0e83fb985874.png)
![[Diagram]](../../diagrams/8/099a47191878214a1d729f530365e69f.png)
![[Diagram]](../../diagrams/26/d00d6ce5d996ab013c254f6e1cf47979.png)
![[Diagram]](../../diagrams/12/582a47460f9934539e7e16c60199dd56.png)
![[Diagram]](../../diagrams/31/04439c71d93065e0cef4dcfdcc327d2d.png)
![[Diagram]](../../diagrams/49/b66e9eb48f26aba6e2313d172d07385d.png)
![[Diagram]](../../diagrams/0/b919b4bdf8a21ae6f333a3f7d6f6fa94.png)
![[Diagram]](../../diagrams/7/cec28dabebd29813bae5defd2d33c397.png)
![[Diagram]](../../diagrams/28/ac23d7d238467b7a238bf9c55e73fe8d.png)
![[Diagram]](../../diagrams/39/c84e50aa8406664aa4561a25375f1b5b.png)
![[Diagram]](../../diagrams/52/5fd17e860f5383ef7506b3c256b87a0e.png)
![[Diagram]](../../diagrams/26/2cf9bd2c367755f04314b102d3366b7c.png)
![[Diagram]](../../diagrams/24/4cb7c7fc64d796860e2b1da12fb2e081.png)
![[Diagram]](../../diagrams/49/9d47dc5268db47e962a1eeae58b17163.png)
![[Diagram]](../../diagrams/25/95ec0070f492b89e229befad58bea7b4.png)
![[Diagram]](../../diagrams/51/6e5cedb81bb0cac896ec554ce2986c43.png)
![[Diagram]](../../diagrams/1/558eff7c332c50104883f051f6baa310.png)
![[Diagram]](../../diagrams/39/ef5170ff9e58a36ef1f34ddc9014ade5.png)
![[Diagram]](../../diagrams/9/3712dc28f4b14780723bf765748b15ae.png)
![[Diagram]](../../diagrams/1/73601726574c23eb4ae3a612b4e5b9f5.png)
![[Diagram]](../../diagrams/51/b70d74d40613586169ef83f3a1a24816.png)
![[Diagram]](../../diagrams/34/f3d79601eb751390505eb9a0be27aacf.png)
![[Diagram]](../../diagrams/9/4bd1f65ad9ceca07d4dc8cc4575dc5e6.png)
![[Diagram]](../../diagrams/39/e471ad9f5b852d08c33bf6108e3aace0.png)
![[Diagram]](../../diagrams/38/12cd10df3f9f80196c7530129739c5f3.png)
![[Diagram]](../../diagrams/35/d049ee6bf7f3214fcf5dd4bf3630a7ca.png)
![[Diagram]](../../diagrams/44/1ddba64bbd3794c491901e37440d199d.png)
![[Diagram]](../../diagrams/48/83f9392220c7a3f13d7f6e5155197897.png)
![[Diagram]](../../diagrams/21/24c22ec7ab1ea7040c6869df5f1f45dc.png)
![[Diagram]](../../diagrams/24/4bb2781fada475d8d6ee272205407a2e.png)
![[Diagram]](../../diagrams/42/7d0602e5022ceb0d32ec10e7332abf55.png)
![[Diagram]](../../diagrams/52/b66cd224552be063c64bafb200f034bc.png)
![[Diagram]](../../diagrams/48/cc6557f81766c3648eb8986c4e8f170f.png)
![[Diagram]](../../diagrams/44/0cbda9925291a1ee42ee34f8235c5fbd.png)
![[Diagram]](../../diagrams/40/3aeac44460879564c0684b6526c555c6.png)
![[Diagram]](../../diagrams/22/4f2d9baedf60326f1de5516222dbca95.png)
![[Diagram]](../../diagrams/50/59f9cf4a0a3335705883e931fd613812.png)
![[Diagram]](../../diagrams/31/8a7189c1c46be638e732bae23afb6869.png)
![[Diagram]](../../diagrams/14/d3fe799100c8fcffdb10f5d2b00136c5.png)
![[Diagram]](../../diagrams/23/8988f87fe2eb2fd0a1c1437638c5d969.png)
![[Diagram]](../../diagrams/24/bb11b62533d30105bf7cb4d64455fbe0.png)
![[Diagram]](../../diagrams/45/743a9533f62ea61e69c7b2486c436519.png)
![[Diagram]](../../diagrams/8/465e55b107b01d329cc3a2d0b2b674f6.png)
![[Diagram]](../../diagrams/9/595de57c57b88745e0e909cd016931e5.png)
![[Diagram]](../../diagrams/27/4e684c6039a036dd905cbf8e611c76d3.png)
![[Diagram]](../../diagrams/30/3d2eea967fe85146690994c54d9c8bcf.png)
![[Diagram]](../../diagrams/11/fe908c199c5680887dd232563002a5e2.png)
![[Diagram]](../../diagrams/15/c23ab850d5b26690322b439ec06cd484.png)
![[Diagram]](../../diagrams/27/a79f8b54ccc41fe7d129deacd68ac184.png)
![[Diagram]](../../diagrams/32/e489a580880a6feed1e3eb0cabc33095.png)
![[Diagram]](../../diagrams/13/e87bfce83f9e7bcbaa00573d8f5f24da.png)
![[Diagram]](../../diagrams/29/f559f135e2ccb645d191293af6e8e556.png)
![[Diagram]](../../diagrams/18/7c9e31d3aaeb05704bf2c5aa74511e44.png)
![[Diagram]](../../diagrams/21/faf0e0ade3aceabd123f6e470fd16d09.png)
![[Diagram]](../../diagrams/16/f4ae9585ea38ef651d52889dd2b7acd1.png)
![[Diagram]](../../diagrams/48/e9173bd8a4ce6e698d3bb56df433d129.png)
![[Diagram]](../../diagrams/49/6dd2b0572a8bdab90b8c73dc9430ff6b.png)
![[Diagram]](../../diagrams/3/43fe59bcdd9bcedc6df061c070f8493d.png)
![[Diagram]](../../diagrams/34/1c42b707559793af22ae872c1b4463a3.png)
![[Diagram]](../../diagrams/11/553f0b9a323306d0a2dbf3fb3f276093.png)
![[Diagram]](../../diagrams/20/8fa1171244848ef16da22c511891815f.png)
![[Diagram]](../../diagrams/30/ae42a6ca8c038f45dc8229b24ed24d26.png)
![[Diagram]](../../diagrams/3/f7a074a67914d4fc1e385aed3f652f55.png)
![[Diagram]](../../diagrams/42/ab4c0a91211cb273146ce93b7622a747.png)
![[Diagram]](../../diagrams/10/71acc3c9b458ee65e8692ef7ce6699c2.png)
![[Diagram]](../../diagrams/29/6560d15b51ed85347d95713c01104c20.png)
![[Diagram]](../../diagrams/23/d28eb7c4d9a6c21924612d281fabd760.png)
![[Diagram]](../../diagrams/27/2361fde0c55f0c21337749bc961a3a9c.png)
![[Diagram]](../../diagrams/2/5276b625fd0021c5b4d88f94102727d7.png)
![[Diagram]](../../diagrams/7/cdd00e6d72cc13ddbc0e46ddb0187c3c.png)
![[Diagram]](../../diagrams/19/e25e01a73f33697e4f6e67fd3824d95f.png)
![[Diagram]](../../diagrams/27/cba1199be85b88e899a302bde190128f.png)
![[Diagram]](../../diagrams/26/63b44d5f87f36caf4bc0232e3c97ee4e.png)
![[Diagram]](../../diagrams/46/0f4b0450e3129f2034e8b45eb90b327c.png)
![[Diagram]](../../diagrams/7/65f48f662fac9c756eae7797510cc1dc.png)
![[Diagram]](../../diagrams/19/9b46daf794a857912836883c477592cc.png)
![[Diagram]](../../diagrams/45/8f576cc2bc35b5ac3c6fcd7cd3775f64.png)
![[Diagram]](../../diagrams/22/e865b98ee433e894ae2ee589e37f3033.png)
![[Diagram]](../../diagrams/11/f3e7aea61b1e44187656e514ba018a90.png)
![[Diagram]](../../diagrams/46/041dd451910cb312981dce6b8e3de8d3.png)
![[Diagram]](../../diagrams/36/c6f11f06b976f46b2c7fc13fa2cf618e.png)
![[Diagram]](../../diagrams/2/7622ad8ffd2d8226047faa3ef65ae181.png)
![[Diagram]](../../diagrams/30/f938f5cd542cfcc05d4cd21dd23de39f.png)
![[Diagram]](../../diagrams/48/f5c1e63cbbf6b1a689207cfe82ddd967.png)
![[Diagram]](../../diagrams/45/82552686d98ae8c50d53ce75cd458649.png)
![[Diagram]](../../diagrams/6/e6b1ed5f0badeccfcec18d3feedbea25.png)
![[Diagram]](../../diagrams/19/37bf24cb33552f3100f811ece7332843.png)
![[Diagram]](../../diagrams/4/0cef5f47e8ef541de07c25a75c596779.png)
![[Diagram]](../../diagrams/33/ce89cb4ca145d1ccabe8b49fe639c7a4.png)
![[Diagram]](../../diagrams/6/43ba24938ff0428cb66d50e53f508345.png)
![[Diagram]](../../diagrams/12/2d2d1af983ad5d2057c770f932ac5f5c.png)
![[Diagram]](../../diagrams/40/895bc8ff68daaa1528aaefe311df52c1.png)
![[Diagram]](../../diagrams/24/88418a89f2f92dff3865e8d146b3bb7d.png)
![[Diagram]](../../diagrams/39/802cbd7a7972fcfd6331c27d36d5a9fb.png)
![[Diagram]](../../diagrams/42/cfecf70693ece1bab148e09c46ce1645.png)
![[Diagram]](../../diagrams/1/2f97ed577dd0471b7e02fcaeb63307c3.png)
![[Diagram]](../../diagrams/12/cbbc3724e5e3065a62731204ed58fab7.png)
![[Diagram]](../../diagrams/14/a2a5c3c6763c96e7399a0699400133d4.png)
![[Diagram]](../../diagrams/3/7e57be556858e3086e4cb9a9fad20855.png)
![[Diagram]](../../diagrams/14/244fba24f3cc8a187648ac0c6b0bd38a.png)
![[Diagram]](../../diagrams/38/be13a338f0929b498e007ba2059ba2b2.png)
![[Diagram]](../../diagrams/18/a323f57b0e9a82559bf2b457a5a74f68.png)
![[Diagram]](../../diagrams/27/cea3331b099e357dff5ec2439c44e4a4.png)
![[Diagram]](../../diagrams/18/2c2c588dcbd3669a01a880ebf3d03c46.png)
![[Diagram]](../../diagrams/2/f36b8e1c623f88a4ed99e02c5ec277ae.png)
![[Diagram]](../../diagrams/36/522f3859aa99427c9bcea4f1cd83ca9c.png)
![[Diagram]](../../diagrams/7/63d5f01b7c4145d4c62dc1221633c614.png)
![[Diagram]](../../diagrams/26/df0ac9d18f0ac30e7ebe6c3b688a03d3.png)
![[Diagram]](../../diagrams/6/38685b41089f2058c14addd62fa342e7.png)
![[Diagram]](../../diagrams/7/ba53fad26462ba3cf26830028121ec7e.png)
![[Diagram]](../../diagrams/35/18cd550557883dd01f2d884868615be3.png)
![[Diagram]](../../diagrams/42/09442f911f6a650b05aaf1605e28311e.png)
![[Diagram]](../../diagrams/50/1267fe1cfc2b8e602cf112194f5bcc06.png)
![[Diagram]](../../diagrams/8/84fe30c44293764d7a629d528c77e5ad.png)
![[Diagram]](../../diagrams/42/b7690303d81ca891eeff8de06c11c3d7.png)
![[Diagram]](../../diagrams/48/7009276482c2d9983096ac006314fd2a.png)
![[Diagram]](../../diagrams/39/42d03e769a6a7031c0824a05d2c41e8e.png)
![[Diagram]](../../diagrams/45/24838d465b0ba0c6e5ed8f35ab308aa3.png)
![[Diagram]](../../diagrams/4/8e0966c10a287c58b86398da23ca9882.png)
![[Diagram]](../../diagrams/45/b9b6e2d399217a4997507710c92bad6f.png)
![[Diagram]](../../diagrams/15/4338316df17bd20c45d2003f72f0a558.png)
![[Diagram]](../../diagrams/12/249ea0283c93af9c1824c732a80664db.png)
![[Diagram]](../../diagrams/51/bfcd4f2b32dab9ad591456d73379291a.png)
![[Diagram]](../../diagrams/41/db34da75a967d87f82c9d2068bae72b0.png)
![[Diagram]](../../diagrams/4/04c7249db12aa069bd8ae9dc3b6c9958.png)
![[Diagram]](../../diagrams/8/2d668be78b68ff3b50a66ea48d1d53fe.png)
![[Diagram]](../../diagrams/35/51446c310405c9c85d56c93d7868a52c.png)
![[Diagram]](../../diagrams/9/d941afcb7e7e68cacec839cae3093940.png)
![[Diagram]](../../diagrams/6/754874abfc070bfa5b68e3992e568a37.png)
![[Diagram]](../../diagrams/14/93cff8989635bda8cff4e18d711a72d1.png)
![[Diagram]](../../diagrams/38/506e554999d1eb2636fb77cd184a0a9e.png)
![[Diagram]](../../diagrams/39/fe479c3f6d0282d41212ef513cc434d5.png)
![[Diagram]](../../diagrams/19/f695db957a73d4cb04bcaf90c83037b8.png)
![[Diagram]](../../diagrams/24/deeeafe9f8daa4d9a2ecff23144cf8d9.png)
![[Diagram]](../../diagrams/34/787609e35c289375ec6dedeb8be2ba6d.png)
![[Diagram]](../../diagrams/9/212008ec2fdf61c5830680f17e4796fe.png)
![[Diagram]](../../diagrams/22/9102507dffc4abe372e570f1d41e8ad2.png)
![[Diagram]](../../diagrams/24/34468fd527c3fe34f188599b297f42a7.png)
![[Diagram]](../../diagrams/50/821e5a9fac7774998afac9fafd36e3af.png)
![[Diagram]](../../diagrams/45/606e310a6daa8697763203e2b65a2e42.png)
![[Diagram]](../../diagrams/10/44f6dff707c4675a14c03394cd15c487.png)
![[Diagram]](../../diagrams/23/765979109161e0716cab4d3ed8504ed1.png)
![[Diagram]](../../diagrams/43/37e442444e2aefc9f22d3e24bf67244e.png)
![[Diagram]](../../diagrams/35/8e460bc56377612fa816adf58758d173.png)
![[Diagram]](../../diagrams/23/f814465489610c304da7f44196dfccdf.png)
![[Diagram]](../../diagrams/47/f80d085f9c5270b018ea4889f786ae20.png)
![[Diagram]](../../diagrams/5/0b14d50ae9431a55730a73d72d9ca9d4.png)
![[Diagram]](../../diagrams/46/da593d9f175762e5782674ecf2a09814.png)
![[Diagram]](../../diagrams/32/fed34d9a6ac9d79d896918f0f008a543.png)
![[Diagram]](../../diagrams/51/95d52797e87b6064faadcd1f8b790e7f.png)
![[Diagram]](../../diagrams/31/8a545e6dfedd27a00dcd605f3a692d77.png)
![[Diagram]](../../diagrams/20/964746f6aff328c92a662fd64db1d165.png)
![[Diagram]](../../diagrams/9/391d4e558b1f01739e1890c3bafc0d38.png)
![[Diagram]](../../diagrams/37/4400b62ef12a0d0c8aa39f6120665ccc.png)
![[Diagram]](../../diagrams/18/06f18178a0fb6b84068ab59ce79c686c.png)
![[Diagram]](../../diagrams/23/1dcf9cbe8ccb121f6de227fa1d98a124.png)
![[Diagram]](../../diagrams/22/9d3d2f49dfecab663edcf4dbbf3009cb.png)
![[Diagram]](../../diagrams/37/ec68648b5e254f06d111ba52c0d60e01.png)
![[Diagram]](../../diagrams/1/0b413dedc80d4c7d2708baa772641bc0.png)
![[Diagram]](../../diagrams/18/41778b4d413b65fc04628c830b45bb63.png)
![[Diagram]](../../diagrams/51/3adb01b17bb9075548820ae8c08158a6.png)
![[Diagram]](../../diagrams/27/d96afca795e51d46e67d8744556246bf.png)
![[Diagram]](../../diagrams/36/f4010d50ab68b673acab923395ccdaf6.png)
![[Diagram]](../../diagrams/28/7e208662878eda4622607d091de469b9.png)
![[Diagram]](../../diagrams/36/c676819169cde5fadc72c3bcac46f568.png)
![[Diagram]](../../diagrams/8/8c005cf862ad429609b78cf16d1df449.png)
![[Diagram]](../../diagrams/22/0cc88f14da8586511f1d0921bfa201b4.png)
![[Diagram]](../../diagrams/40/22628df9b6c47cb87df204009bd98974.png)
![[Diagram]](../../diagrams/26/0ebc4f34dd6b74d8bb5524c04aee4086.png)
![[Diagram]](../../diagrams/23/0b92c01c74ed05146d09cc9fb8693bb1.png)
![[Diagram]](../../diagrams/36/5a8c97309fbde270cac9e4080e25c473.png)
![[Diagram]](../../diagrams/9/cfe2e2d464397ca6db9b2622d1b2e373.png)
![[Diagram]](../../diagrams/6/ae7e1876065fe3bc28c48c90b80df4bc.png)
![[Diagram]](../../diagrams/41/840a32349bc84544ac492a742306d5bd.png)
![[Diagram]](../../diagrams/48/f4904bf96f0579589ccf2fa7bdeeb4fc.png)
![[Diagram]](../../diagrams/29/8640856a99b01478fd2a99359eda2d8c.png)
![[Diagram]](../../diagrams/12/2108614fe38fb324c4468bc5e11d867a.png)
![[Diagram]](../../diagrams/27/5bc5c439918372fb96066e82fe7fc231.png)
![[Diagram]](../../diagrams/3/a9584a8f1ef5ff2e07044f2436191f6f.png)
![[Diagram]](../../diagrams/39/99b15d388ead22d978a97e467e88c133.png)
![[Diagram]](../../diagrams/3/38c800a4e184d28cccc2b0eaa4f75252.png)
![[Diagram]](../../diagrams/47/242818d62af9952081fa08680a236fea.png)
![[Diagram]](../../diagrams/17/6a5af27ec6e1ef9036fac3bc28c96e9b.png)
![[Diagram]](../../diagrams/46/cf135c19cf8b205b605669864e1fe609.png)
![[Diagram]](../../diagrams/21/b1609f2ce44694112a7630e0af5a6e28.png)
![[Diagram]](../../diagrams/26/8a17ad8001423555a3ed7147fa51dc9c.png)
![[Diagram]](../../diagrams/52/57b8d7908b54fe21108dd2c0aac76b71.png)
![[Diagram]](../../diagrams/26/2ab252e743ee71134b780e4211c06085.png)
![[Diagram]](../../diagrams/42/da5a8d07af7e85d51dfb7529203da5d0.png)
![[Diagram]](../../diagrams/39/cf406df3b3826a9a2c7f4bab13a206c9.png)
![[Diagram]](../../diagrams/16/e63d988e5101f27cbea704d30222f1e0.png)
![[Diagram]](../../diagrams/28/89eb6d05ff524bda2b25772ff34dd5cf.png)
![[Diagram]](../../diagrams/19/8bc61cce60b871f966e3e251e9139d78.png)
![[Diagram]](../../diagrams/46/cc75326bbd5c83d64f8f217d990e0ef2.png)
![[Diagram]](../../diagrams/25/1c20fb74d3ccb01cad6f1672396e5393.png)
![[Diagram]](../../diagrams/8/497ad722c3ba8d8511164b4657b08380.png)
![[Diagram]](../../diagrams/5/caec36b4334d70080b2a482bf80eeb24.png)
![[Diagram]](../../diagrams/52/b4f9bee83694fcee798d66debe59bfe6.png)
![[Diagram]](../../diagrams/45/135021c8df95463b4a2a7cfae103a8fd.png)
![[Diagram]](../../diagrams/13/04bb6cb4b1f08048a0c13de6ee8f1653.png)
![[Diagram]](../../diagrams/11/a457604a34235f5eb5c1de59fdfbff30.png)
![[Diagram]](../../diagrams/0/b428aed4c89d0a68cf4f4aeb1396c87d.png)
![[Diagram]](../../diagrams/25/e859b173b19d0f2770d24986c92f3a3d.png)
![[Diagram]](../../diagrams/16/e24f508398daab23810d7890f1301e44.png)
![[Diagram]](../../diagrams/21/07620d62eb03be7efbeec55002c4ce56.png)
![[Diagram]](../../diagrams/18/93fb51c8dff658237839c420f9ffd5eb.png)
![[Diagram]](../../diagrams/34/e6d20aa10621bfce55491d09a4ccfb66.png)
![[Diagram]](../../diagrams/28/ebbf57c20e273cbc5a34ad942f707bee.png)
![[Diagram]](../../diagrams/14/3d5163de441ef58bb9fed47e3b45b6a2.png)
![[Diagram]](../../diagrams/46/ce5a045620488040813dd94821dd8396.png)
![[Diagram]](../../diagrams/16/130ab46a3a7714e550a19d9a90c08a82.png)
![[Diagram]](../../diagrams/36/aaa7b7e6c7e79b8b122b6fef710baf8e.png)
![[Diagram]](../../diagrams/4/e531ec7c86d8a7c45f04bf41d10e4d15.png)
![[Diagram]](../../diagrams/51/8dc97246de2a5fc2737a8998d58da2c6.png)
![[Diagram]](../../diagrams/28/8787fdf2ec07b530e55d8cec24036f0d.png)

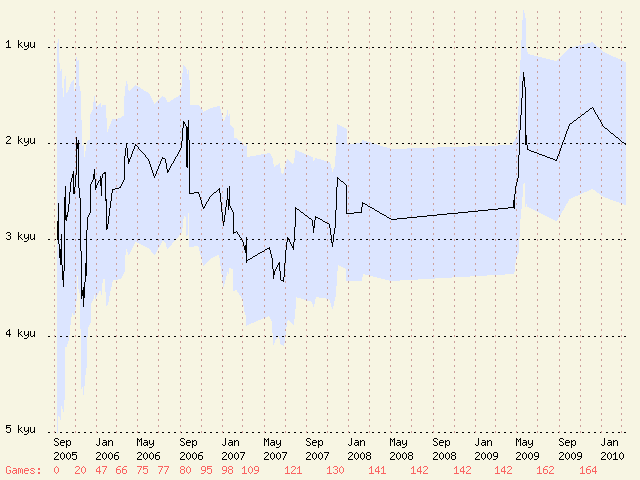
![[ext]](http://gokgs.com/servlet/graph/lefuet-en_US.png) http://gokgs.com/servlet/graph/lefuet-en_US.png
http://gokgs.com/servlet/graph/lefuet-en_US.png![[Diagram]](../../diagrams/10/3d546b877defd9cf077bff347374304e.png)
![[Diagram]](../../diagrams/20/3945d5ee04fbeca2c6b2bef77986beb0.png)
![[Diagram]](../../diagrams/40/3f08f9e119a4c40a3b3bf2537953886a.png)
![[Diagram]](../../diagrams/42/a1a6e3beb654f4212e3de8dadfa05545.png)
![[Diagram]](../../diagrams/4/6e7a4f70b1dbd43064e9c23123f7cb95.png)
![[Diagram]](../../diagrams/43/0214e7eb2801eecef11b873831274739.png)
![[Diagram]](../../diagrams/50/98cab4788dcde4ec3f087f293918fabb.png)
![[Diagram]](../../diagrams/16/5db8eaaadc01737771b8a380ba15e4c5.png)
![[Diagram]](../../diagrams/35/c95d5aabf596c3260848290426b41ed1.png)
![[Diagram]](../../diagrams/51/717db931d5fba4069ce29bbaacb1633f.png)
![[Diagram]](../../diagrams/45/81cf000b9e07338c4d1278bbce857ab6.png)
![[Diagram]](../../diagrams/48/40c4f6ae2d9085adc1f83507afa2e9e7.png)
![[Diagram]](../../diagrams/49/9de655e5625868f41b8ed7f345dcc1aa.png)
![[Diagram]](../../diagrams/11/edc3b6f5b7ca1d830f4757c35010e400.png)
![[Diagram]](../../diagrams/33/9b261bef8c2e343bd0c5a3189fb4ba16.png)
![[Diagram]](../../diagrams/34/f658015a559cd137f0e31b4df4d7c13a.png)
![[Diagram]](../../diagrams/19/6aa0b9d288c418de59da2af7d7e3b714.png)
![[Diagram]](../../diagrams/51/a02fdd0655dad2fcd2e233f00a4881b0.png)
![[Diagram]](../../diagrams/36/4d9cf931b351b8e31cee7af7c714368c.png)
![[Diagram]](../../diagrams/44/6a3668079bd2d4e74236665f651578ee.png)
![[Diagram]](../../diagrams/35/5969b8adcf92028a9f68d8cf54c32e79.png)

![[Diagram]](../../diagrams/26/24ce59a7dd802310836a9d9d19175502.png)
![[Diagram]](../../diagrams/49/a4fdd339ad5094c0fa514ee733777cf6.png)
![[Diagram]](../../diagrams/41/b8591534209700cf714bbd6ba81b409a.png)
![[Diagram]](../../diagrams/29/2391eaac40c592f594c2c888cf673789.png)
![[Diagram]](../../diagrams/7/6e14007c5cf153178624064c3cfc9490.png)
![[Diagram]](../../diagrams/5/6b465dd401ccaffeb84299dc60a2913d.png)
![[Diagram]](../../diagrams/47/7c32692dddfb0290c11f38994fec4b6d.png)
![[Diagram]](../../diagrams/27/5f68ce23044b796cb980762188a78f2b.png)
![[Diagram]](../../diagrams/29/71b2caaec8ad8964fe72968bb423fb61.png)
![[Diagram]](../../diagrams/12/d235e46278ff05879c306f0f73d1f4b0.png)
![[Diagram]](../../diagrams/48/d63f8809dca02870bb0264ca6363d31d.png)

![[Diagram]](../../diagrams/2/c0c4b131daf7009a97c9affb8c8abd9b.png)
![[Diagram]](../../diagrams/11/cb4f41464e3421c6810862080d7e3503.png)
![[Diagram]](../../diagrams/9/6e34c4287c2b11ac8ffe7ad13cdd7d6c.png)
![[Diagram]](../../diagrams/44/016f23cffeb80c04939e053cb8856819.png)
![[Diagram]](../../diagrams/47/5853b107c0f443cd223f7e3604623dd3.png)
![[Diagram]](../../diagrams/23/f39bfd9910f6a9c66fa2931c6e15d357.png)
![[Diagram]](../../diagrams/50/4ff19e36b04e6a32472ba8ab26be8092.png)
![[Diagram]](../../diagrams/43/2c8ebc81c3d870be7cfb07589e2ae985.png)
![[Diagram]](../../diagrams/13/d9d76c54f46de1e537fec44d5675722f.png)
![[Diagram]](../../diagrams/44/e3d783f48fab95d350c94e99df7a8254.png)
![[Diagram]](../../diagrams/6/d6f376f783dc1bd8230472addf9798b4.png)
![[Diagram]](../../diagrams/50/ef8058bfda597708a8ae58364108c240.png)
![[Diagram]](../../diagrams/28/b08a772a296449a0c614bd8050d55f35.png)
![[Diagram]](../../diagrams/32/52c9468634de4f4be94bfa59d156a61c.png)
![[Diagram]](../../diagrams/30/a9373fd34303058ea157a902b0688f15.png)
![[Diagram]](../../diagrams/44/576473938fa17432e86de42f9ec7de85.png)
![[Diagram]](../../diagrams/42/03a0ae8cd5c658a9bd69efdf5eb8bb5f.png)
![[Diagram]](../../diagrams/15/dfab47b3a4c349cb7220ac7dc52e142e.png)
![[Diagram]](../../diagrams/12/4f9d76179caf35933ba9a19cf154ce47.png)
![[Diagram]](../../diagrams/6/6a5f1e08a5200fbf6a92f66c93983a06.png)
![[Diagram]](../../diagrams/48/e0f2c07cf332a8975e0e018c784dd501.png)
![[Diagram]](../../diagrams/27/9c6139213a32bebed589b2681778eeea.png)

![[ext]](http://www.bresler.org/Go/Photos/YiChang-hoTesuji.jpg) http://www.bresler.org/Go/Photos/YiChang-hoTesuji.jpg
http://www.bresler.org/Go/Photos/YiChang-hoTesuji.jpg![[Diagram]](../../diagrams/30/9903494e0be2cedda6a578142a63c8fd.png)
![[Diagram]](../../diagrams/1/dc8b5d2bc870bed94c4d12fb0f9dca01.png)
![[Diagram]](../../diagrams/50/fe0176efc7b7668043208e70532516d5.png)
![[Diagram]](../../diagrams/8/052b07c60c7cc8bb8f2f1e1bc7b5e810.png)
![[Diagram]](../../diagrams/8/5a6565291207a76f70c3213ac5ab16fb.png)
![[Diagram]](../../diagrams/50/e36e58bcf35eb79fa50e40c5150c6655.png)
![[Diagram]](../../diagrams/26/439edbdb187e7cd733a98aac5217c97c.png)
![[Diagram]](../../diagrams/39/36a346fe4b1075d6d7036205ffd174bd.png)
![[Diagram]](../../diagrams/49/8661722fd365836718c71a1a3a9e4bc6.png)
![[Diagram]](../../diagrams/7/fb6cd305e05952f6a43873714fdff380.png)
![[Diagram]](../../diagrams/52/cd092e2e56e0611a0a964be56bd1d336.png)

![[ext]](http://www.bresler.org/Go/Photos/YiChang-hoLifeAndDeath.jpg) http://www.bresler.org/Go/Photos/YiChang-hoLifeAndDeath.jpg
http://www.bresler.org/Go/Photos/YiChang-hoLifeAndDeath.jpg![[Diagram]](../../diagrams/50/3d6bcd21c6c885affed65c1dc53efb28.png)
![[Diagram]](../../diagrams/22/bc338b17f535fdcb6c2a77a6598aecc0.png)
![[Diagram]](../../diagrams/41/6bf02b586c7e0254bc007a1143fb16cc.png)
![[Diagram]](../../diagrams/17/6f148a581ba0c42523f4ba9975fbdd49.png)
![[Diagram]](../../diagrams/23/bb3b77fdc31783e0e55293985379b669.png)
![[Diagram]](../../diagrams/25/9a2fa8d3409c5521ea5a1514d8cdf665.png)
![[Diagram]](../../diagrams/49/c3ad990010f0f4587fe1d9ab2306fe5d.png)


![[Diagram]](../../diagrams/26/d8453523e0f79f6891e9c378124c9a0b.png)
![[Diagram]](../../diagrams/31/2f4d5d1c6dbcf07f99006493c041a41e.png)
![[Diagram]](../../diagrams/30/8ea192014f715d29e5a9014e8eeafc01.png)
![[Diagram]](../../diagrams/2/9d47ec3159a4fda5b7ce35450810dd90.png)
![[Diagram]](../../diagrams/9/7c20429232ba29cee92f8b5c6273da99.png)
![[Diagram]](../../diagrams/40/27e039dd70aa0fb35d43fcc020735f3e.png)
![[Diagram]](../../diagrams/52/e30222706a8832b9fdfc6e197a6f7777.png)

![[Diagram]](../../diagrams/52/c72c513247d87adb8caf4d451f3c334d.png)
![[Diagram]](../../diagrams/21/5f87295dadb515e070eaf985cdf5dfc8.png)
![[Diagram]](../../diagrams/5/5bfc434096e3320264b0b343c2d12474.png)
![[Diagram]](../../diagrams/12/ef19ddc8ba99d06dd53ed65929447cf6.png)
![[Diagram]](../../diagrams/28/8ee50c07a7e3efd3d8c6a7a162893b0d.png)
![[Diagram]](../../diagrams/45/2953ad107138833475ed3d84f26dbf77.png)
![[Diagram]](../../diagrams/35/d7074acf451a417777f04e511d9a2a25.png)
![[Diagram]](../../diagrams/44/e983cc8bb121f945c6bd35f9294370af.png)
![[Diagram]](../../diagrams/32/54eba394f78c58a9ec80f34c7cad01f8.png)
![[Diagram]](../../diagrams/40/ab0774d6a63ba9217bdadc7711d3a098.png)
![[Diagram]](../../diagrams/27/556a443432d1f08216e285baa2dea76b.png)
![[Diagram]](../../diagrams/25/3fd3a02a4edf93423f1e0b3180388fe3.png)
![[Diagram]](../../diagrams/42/1dfe5bbb83372713d829e2f87e6019fb.png)
![[Diagram]](../../diagrams/36/8e33850ff41a89fef84b90950b5c1852.png)
![[Diagram]](../../diagrams/51/85e37ca04df1c6f981cefbbd42e5f5e5.png)
![[Diagram]](../../diagrams/8/36f1c8261d52cc725cd9bb9ed9cf67aa.png)
![[Diagram]](../../diagrams/51/1fbd1c2031b453dd560532401623f98b.png)
![[Diagram]](../../diagrams/38/bfce080440227a24dbe30f9fa243ccb9.png)
![[Diagram]](../../diagrams/46/d5d94166ff7065f25ac64c9cef37f857.png)
![[Diagram]](../../diagrams/12/9af6fc61ac4d305daf3fead15a0cca52.png)
![[Diagram]](../../diagrams/15/c538ef981d925e5a80d373e33e3c82b6.png)
![[Diagram]](../../diagrams/17/6e8237c11c9f224b9b18b6b7f92046bc.png)
![[Diagram]](../../diagrams/40/57246f73a625ef2f2a38d167d5e4b2fe.png)
![[Diagram]](../../diagrams/8/cc4eaa5e9ed9caae168d3e8cfc7d01fb.png)
![[Diagram]](../../diagrams/29/ad8e3b49663472fc693c940901579fa3.png)
![[Diagram]](../../diagrams/45/26e70d499df9a40c8312d84d32f7540a.png)
![[Diagram]](../../diagrams/24/e79dc63fddfbbeba8be95ba93831bace.png)
![[Diagram]](../../diagrams/0/ad72a55aea4c8993344b30b0e6e69c57.png)
![[Diagram]](../../diagrams/49/629aab1c34bed43716d44e19a2cbc298.png)
![[Diagram]](../../diagrams/28/dbbf09bacda59529593e47af4de76641.png)
![[Diagram]](../../diagrams/29/0c922ef29aae90710b08e831488edf3e.png)
![[Diagram]](../../diagrams/35/31ef2b569835015711be3d26bb7bed26.png)
![[Diagram]](../../diagrams/36/6144eb0d9410c5544b46ce4402ca0722.png)
![[Diagram]](../../diagrams/44/e118d04a91a0d2c4f81a4e7ac63c90c5.png)
![[Diagram]](../../diagrams/1/7523855f96ed999e8a548920582b8cf0.png)
![[Diagram]](../../diagrams/11/5d0868e540e1cc04b0137ea5ad1be298.png)
![[Diagram]](../../diagrams/50/fa9620d02ba90dc67e1b557002e42fab.png)
![[Diagram]](../../diagrams/29/a9c51018383b907741a377664cac6641.png)
![[Diagram]](../../diagrams/46/314b78037d53306f59c8db1debfc946a.png)
![[Diagram]](../../diagrams/49/f41c0b707e62d85b5511c0fd12a7946c.png)
![[Diagram]](../../diagrams/36/bb0eb1a9032772d9de12ddf992e322ee.png)
![[Diagram]](../../diagrams/5/8c517028925368c563311c1d3656459f.png)
![[Diagram]](../../diagrams/38/cd21a23ca2223f01e76545e832e9a4f8.png)
![[Diagram]](../../diagrams/48/d15c7f7eefbbdc685d2d38e6abf91671.png)
![[Diagram]](../../diagrams/38/4abc283758dadf658e6d96b8b4ab0588.png)
![[Diagram]](../../diagrams/48/7b39de0d9af4ff8eb1f0aa898620eca4.png)
![[Diagram]](../../diagrams/35/be5ec6a17f38f2d85d7ec5b4e412dd7c.png)
![[Diagram]](../../diagrams/45/03e01cc2438d48957c6d3bc13085ab85.png)
![[Diagram]](../../diagrams/8/4fb69ede7454a87907a6f51aa84580e8.png)
![[Diagram]](../../diagrams/11/4f8603b2c43179eb4253585cb60326c1.png)
![[Diagram]](../../diagrams/33/609eaa7cc6e71ae6b9c9e581b13905ae.png)


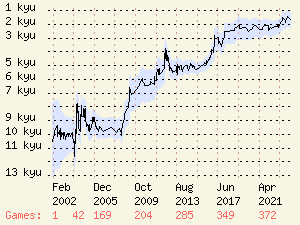

![[Diagram]](../../diagrams/34/85857ebdddf33a714ebd77f8c7060455.png)
![[Diagram]](../../diagrams/2/a56ae463784ed61dc68aff96890a39ca.png)

![[Diagram]](../../diagrams/32/98a30b3fc68907000d6c0b93e0120a01.png)


![[Diagram]](../../diagrams/12/73222dceee8225c35e1e77c72cc3e2fb.png)
![[Diagram]](../../diagrams/16/e28bea6d81e8fa39f394e7e92c1a8df0.png)

![[Diagram]](../../diagrams/40/23b6180c8cf97b134787f249405b1c05.png)
![[Diagram]](../../diagrams/43/90402f9be54a06a39380ed4ae51d7bf7.png)
![[Diagram]](../../diagrams/22/9e8c7ad38c4d34b2c95f727b472c3d37.png)
![[Diagram]](../../diagrams/41/ae2103dac3f9e438b70d0cb004298307.png)
![[Diagram]](../../diagrams/47/92f1faea74a17908262a05d180a0a016.png)
![[Diagram]](../../diagrams/39/a1c6a4736db31ec94b66aa068ffaa974.png)
![[Diagram]](../../diagrams/47/50b400506b01a34174efdffa5a1c8cea.png)
![[Diagram]](../../diagrams/2/8ca545457c5585e27a1b98f3ef713748.png)
![[Diagram]](../../diagrams/24/9c5177546e1cf01b6a9a76c4c50c5b02.png)
![[Diagram]](../../diagrams/32/3f95542097013836be368c014d17e0ae.png)
![[Diagram]](../../diagrams/51/4ebb036318cb573454b6858dfd37edac.png)
![[Diagram]](../../diagrams/28/e7d38f3937ffc7f724ce0b079e18374e.png)
![[Diagram]](../../diagrams/49/e7b3b743630f41ea9755bb600eaa7195.png)
![[Diagram]](../../diagrams/16/b49a8988606133142c584f00203f2b27.png)
![[Diagram]](../../diagrams/48/2b742de7b7e8019c5967a618a77fec81.png)
![[Diagram]](../../diagrams/14/f547993d7f13cc55ee325cce8d6f926c.png)
![[Diagram]](../../diagrams/34/b490f6272391aa5e94bdebf2c139b378.png)
![[Diagram]](../../diagrams/13/80f6d6d798fef59232ce4d8ff4f017ce.png)
![[Diagram]](../../diagrams/17/a9ecbcd224b72fb3617cb140f616bee8.png)
![[Diagram]](../../diagrams/44/f8a7f3f6917227d0328e13df79fc7ab9.png)
![[Diagram]](../../diagrams/6/30f682e2576cf0e97f2304e85e3789dc.png)
![[Diagram]](../../diagrams/39/7f00a9fc609b7c60456307066568c1b8.png)
![[Diagram]](../../diagrams/49/537fb7ae4e233af8815349b3e7ee8914.png)
![[Diagram]](../../diagrams/13/4080ee711521ad05ee3802fc3c900928.png)
![[Diagram]](../../diagrams/28/d515bc90d8199eeb9a275a563d154370.png)
![[Diagram]](../../diagrams/24/01f83521a4bfe1b07b1fa5ab09f243ac.png)
![[Diagram]](../../diagrams/15/2ec2cfea12110e1469867689e2ce75bc.png)
![[Diagram]](../../diagrams/13/b4bed1e691860a8bdbf51cef0fe97a5a.png)
![[Diagram]](../../diagrams/21/a6771e24d664cf920020031198f4c807.png)
![[Diagram]](../../diagrams/9/1ca8770b2ab767b6f7c80b699bf14be5.png)
![[Diagram]](../../diagrams/45/d0766394a836d7eea0222a8358f8ff24.png)
![[Diagram]](../../diagrams/9/addc1dd0ddb9567b2bc164629793b1de.png)
![[Diagram]](../../diagrams/39/1347658533590a7192c060e007612b9d.png)
![[Diagram]](../../diagrams/49/ff71e4a8c9ad61273196508eb30cfbc1.png)
![[Diagram]](../../diagrams/42/056376857be0aa915f6f1d3af2238872.png)
![[Diagram]](../../diagrams/15/32b245994f7a90da3174d273199deab8.png)
![[Diagram]](../../diagrams/49/996b4f7b6e4e884afe5951acf0359f48.png)
![[Diagram]](../../diagrams/48/b5956a45490fced5b1291da89accaf6d.png)
![[Diagram]](../../diagrams/9/215704ad620bdbc8dd96006fc385ca4b.png)
![[Diagram]](../../diagrams/45/1d6e48624d9d884c4d9f64b884e94966.png)
![[Diagram]](../../diagrams/16/2b6b46ae64dc6f3b7c38d0f6627e28f0.png)
![[Diagram]](../../diagrams/30/963ed138386e1ec333c127fb69145928.png)
![[Diagram]](../../diagrams/5/2415f453f6effcb552c4e82f7704c1e5.png)
![[Diagram]](../../diagrams/12/98bfba965a116cae2e1639c6900e24e9.png)
![[Diagram]](../../diagrams/5/9d8e95a767638b24f67583d70ce39d70.png)
![[Diagram]](../../diagrams/33/5111f27b0fafa3cd13f1fa110be82439.png)
![[Diagram]](../../diagrams/38/ef7fdf8f8c15e95e2977f14d2422e8a3.png)
![[Diagram]](../../diagrams/48/33a620a200e8c87bc38a1654a3258dd4.png)
![[Diagram]](../../diagrams/20/8e5ae7feeceec533eae01234f361e2ac.png)
![[Diagram]](../../diagrams/11/bd4d8233549de83ede927bdcdcda3a3f.png)
![[Diagram]](../../diagrams/6/3a00aad0ec44fd29c91ad3b483839dd1.png)
![[Diagram]](../../diagrams/4/0a08c92d9e6ea8d7d8bb193fb30afae9.png)
![[Diagram]](../../diagrams/28/e567dd568af2c915aec93937e0108d12.png)
![[Diagram]](../../diagrams/48/c415a9475c94a32ac2abf0d693d687ee.png)
![[Diagram]](../../diagrams/29/35dde194d20cce0207de2277283b07f4.png)
![[Diagram]](../../diagrams/7/7b5737fa50a72e0d6bef3afabbd62531.png)
![[Diagram]](../../diagrams/4/7be02735fc7c71a140702263410ed8d6.png)
![[Diagram]](../../diagrams/25/765cb35167d91274da6351acfae882aa.png)
![[Diagram]](../../diagrams/43/0ea02475b93e4368cdf4f8e1fcd3bb05.png)
![[Diagram]](../../diagrams/18/bbac426a16b94a5ec712c755373309d1.png)
![[Diagram]](../../diagrams/18/a42309164c3c6beb9d03b1ded84b38af.png)
![[Diagram]](../../diagrams/27/60a59d43c09ba98c0f13d1ebe25ce7e3.png)
![[Diagram]](../../diagrams/9/b650c5372f8d5d28ed781fd391c81449.png)
![[Diagram]](../../diagrams/3/b06e007df2009d4e724a1b391b6d544c.png)
![[Diagram]](../../diagrams/16/7472d60d91cbd81584455bb6c33adf14.png)
![[Diagram]](../../diagrams/0/b6508a3ee872a69ddba948ab19139413.png)
![[Diagram]](../../diagrams/13/edc2c813c337b941e200a4d3b0d370b2.png)
![[Diagram]](../../diagrams/3/585dafb5d2527b7ea0b2e1a94a54809c.png)
![[Diagram]](../../diagrams/44/8bcb411dee1dd1eef25b515e55ad0371.png)
![[Diagram]](../../diagrams/49/d04803846dc421d9a71a09aedc4d0549.png)
![[Diagram]](../../diagrams/10/59d3b5350813d7e62a20cb3ba869e3b2.png)
![[Diagram]](../../diagrams/45/290b9901405262eda0f5a16b623ecfee.png)
![[Diagram]](../../diagrams/35/0cdf7408895bb6589d7b1dc3bf38d9e9.png)
![[Diagram]](../../diagrams/41/7dd01c456d843b3a98243a5ebb129e04.png)
![[Diagram]](../../diagrams/25/aa7c22aad24125278013408e861d2ef8.png)
![[Diagram]](../../diagrams/19/0983a8a41fef02c2f2b4e6ca73b89a2b.png)
![[Diagram]](../../diagrams/52/082c1bd04702596861edb6929c453e93.png)
![[Diagram]](../../diagrams/37/f970492334738ee6cc8a5c163c0b572f.png)
![[Diagram]](../../diagrams/29/64ccb5453ad5e60a2f77e828d8cdc30f.png)
![[Diagram]](../../diagrams/29/80f60ff77460de58fad6e0d39a8cf6b4.png)
![[Diagram]](../../diagrams/43/ade8068ab293e984de32cc016428cf85.png)
![[Diagram]](../../diagrams/35/53f4069abf44943ebe1bfb7811116f04.png)
![[Diagram]](../../diagrams/29/5061ea242b171428c8d2621c261115b9.png)
![[Diagram]](../../diagrams/22/164653cba57ab4a156567c67781995c8.png)
![[Diagram]](../../diagrams/3/c88662d404a29b13c32f3e4016c6a0ad.png)
![[Diagram]](../../diagrams/45/dc9c3fc252a2e59db47601dfe52419fc.png)
![[Diagram]](../../diagrams/45/16820a770d89f74b1ec0f9b0fab36a2b.png)
![[Diagram]](../../diagrams/50/78a69234acce5e2883fec0d897c73198.png)
![[Diagram]](../../diagrams/52/9ceae4b1cf8a6b59b5840f691fde639f.png)
![[Diagram]](../../diagrams/23/2c8e85502f87191b8b696ec05222c286.png)
![[Diagram]](../../diagrams/33/8d9d4313d9e51ad0974895b4b092b564.png)
![[Diagram]](../../diagrams/39/5cf0452c0b260259ed7c8b849df75ec0.png)
![[Diagram]](../../diagrams/3/b1bc8c8663ccbe5e027c0292c85ddadc.png)
![[Diagram]](../../diagrams/46/0e36ffbb50b3043cc7c884b8c844bbef.png)
![[Diagram]](../../diagrams/47/3ff57335de0e111bec4f9677cef15164.png)
![[Diagram]](../../diagrams/10/3b91f9437db51ecf56819a04cde00bcd.png)
![[Diagram]](../../diagrams/41/f6a1c8070f15df4e338ff60cd1073cb2.png)
![[Diagram]](../../diagrams/10/4f2a096b46e4011eabc849859d28c9d6.png)
![[Diagram]](../../diagrams/17/d477119da9e39898c09505cfa299a126.png)
![[Diagram]](../../diagrams/35/44c14e3c617908b16ad0dd0568ed4b3c.png)
![[Diagram]](../../diagrams/5/2f0ad3a0ad087da9078cf519697530d1.png)
![[Diagram]](../../diagrams/18/351b34687cb2338a26493d6712d9ff41.png)
![[Diagram]](../../diagrams/40/79183f8cf2e5179e60478e83ca641d7a.png)
![[Diagram]](../../diagrams/17/0edc4c37195a04861402cb85e9986c92.png)
![[Diagram]](../../diagrams/1/8acf6f50af253d7eee7f92a7f9ea7e3f.png)
![[Diagram]](../../diagrams/23/d1ccc9aa19948057a56e75ea5e71d3d1.png)
![[Diagram]](../../diagrams/9/eda7241d55e25ab59fce15b99b25643c.png)
![[Diagram]](../../diagrams/49/5c1df3ba0a2ab07acc35fab4165c26f9.png)
![[Diagram]](../../diagrams/43/e020152d5291eacdaa458b49c48c7e7b.png)
![[Diagram]](../../diagrams/20/b7f900fcf4d4da3263c4bf7802280301.png)
![[Diagram]](../../diagrams/17/91d2d35a16272808ad814bb3e8706a10.png)
![[Diagram]](../../diagrams/39/face19b96af1401b4a33dc34c1c7b517.png)
![[Diagram]](../../diagrams/32/b9815716687117b3d23d65d6e8ea1617.png)
![[Diagram]](../../diagrams/22/70c30a4118f88d780d8af3b85f175f27.png)
![[Diagram]](../../diagrams/37/ae5f69f15f68638ee1ec1e517ace1ef9.png)
![[Diagram]](../../diagrams/47/912ee909ad5985754e0c2663657e0d31.png)
![[Diagram]](../../diagrams/47/92c49d85f9bae562756cf4376ff1ac77.png)
![[Diagram]](../../diagrams/52/9b5b1523664db49b03bf45d769587fc1.png)
![[Diagram]](../../diagrams/3/18127ed294eaa28c5265e547b2adeec8.png)
![[Diagram]](../../diagrams/37/f5e5b4611ad6d13a719ed908ecfb7a63.png)
![[Diagram]](../../diagrams/38/380c5618111614f79327712ab22fad3d.png)
![[Diagram]](../../diagrams/30/5b0786aca2d922ef2e2b0b6db41dbabc.png)
![[Diagram]](../../diagrams/49/978f13b9d101d37011c59ca307908114.png)
![[Diagram]](../../diagrams/13/f648e915f0c71a92b208261218e196cd.png)
![[Diagram]](../../diagrams/9/57e7177649d64fa87ddb3f2da3f866b1.png)
![[Diagram]](../../diagrams/5/c9873aa084bbe26c25589c4f583fa039.png)
![[Diagram]](../../diagrams/20/5be03d6f14a690694fe95b67a94acb29.png)
![[Diagram]](../../diagrams/9/44e309b0e85e5a3aa3ad185ca941ed44.png)
![[Diagram]](../../diagrams/29/9229284b79fbf0a139a4e26921d74707.png)
![[Diagram]](../../diagrams/5/ea8861db3adf259bc50d01aff95aee7d.png)
![[Diagram]](../../diagrams/52/d0341611d2c2b94eca5ba3da3981a296.png)
![[Diagram]](../../diagrams/22/e34ee8e28e82d612b82d36e0bfb24dec.png)
![[Diagram]](../../diagrams/0/bcdf26bc6ffd4c3dc20b581c47538220.png)
![[Diagram]](../../diagrams/12/4531f4273f2abf5dbd41a8f54caaf372.png)
![[Diagram]](../../diagrams/3/3a7d7706b81ef5f442c5d7f17d26ce0a.png)
![[Diagram]](../../diagrams/35/70a9a10e9ccfb4d9a0a5da2f03d4d968.png)
![[Diagram]](../../diagrams/34/0a33a42b3e70a0f94a3ea1a5d33138d7.png)
![[Diagram]](../../diagrams/2/e7f8732473d58751be3d9799108fddce.png)
![[Diagram]](../../diagrams/52/7c001c98459048ca7282cd76a617895c.png)
![[Diagram]](../../diagrams/36/3dd408af5fd5ea2c9439b87f08106993.png)
![[Diagram]](../../diagrams/51/47c726c9211ad391994d2d85389ef100.png)
![[Diagram]](../../diagrams/39/c31ad3a06b9e0a502c1622bbc0f70255.png)
![[Diagram]](../../diagrams/43/c7d1df66b8ba827089d3e68ab6433ad0.png)
![[Diagram]](../../diagrams/18/de2ea6fbe693ccb4079a19d74b475c11.png)
![[Diagram]](../../diagrams/2/c72c86955082e10f19d1b58fec10356f.png)
![[Diagram]](../../diagrams/35/fdb0a53470174ce3856ef7dc528a8481.png)
![[Diagram]](../../diagrams/24/50eed4bf518e1c61fdae176f63ed3f07.png)
![[Diagram]](../../diagrams/45/1e70db3698d417cb5f0fbc29c42c6dbc.png)
![[Diagram]](../../diagrams/10/0bcb21cd7485dcb0f8d0d29ff91d83da.png)
![[Diagram]](../../diagrams/2/dfabba5deca8387f6cfc5c4535438fe5.png)
![[Diagram]](../../diagrams/49/0524559e69eea97c564786757eda0c4a.png)
![[Diagram]](../../diagrams/14/05f6931a5c2fa7a7f5b65f60e493d79e.png)
![[Diagram]](../../diagrams/25/8e32c1a6ad578d0f8c48f667b63ad5ab.png)
![[Diagram]](../../diagrams/14/143103e68ba59bfdf87da64fffff679d.png)
![[Diagram]](../../diagrams/32/0781a89091061364ea836e831f7f2b81.png)
![[Diagram]](../../diagrams/35/665920519141e6b51ca430321efb3d03.png)
![[Diagram]](../../diagrams/34/bb9fdab6849dea946895efe1fb77a0e5.png)
![[Diagram]](../../diagrams/40/655d89aa7f54aa24b806f58ccfc84c5c.png)
![[Diagram]](../../diagrams/19/f188b4fcd2cab56fd35fad7ec7f4683b.png)
![[Diagram]](../../diagrams/25/5c417230551dff394a0a700690d64a4a.png)
![[Diagram]](../../diagrams/47/2474c5ba576f0750870a5b48d3078687.png)
![[Diagram]](../../diagrams/11/32b077a714621991de19d63af8ddcd12.png)
![[Diagram]](../../diagrams/26/37768b1fbca7468d06303328a29a4cf8.png)
![[Diagram]](../../diagrams/18/9bd2878020e0f51c06bcd4dd805a72b7.png)
![[Diagram]](../../diagrams/20/c62ee14e275ba38058e8aedb4eea2757.png)
![[Diagram]](../../diagrams/30/36ff8e37af3a8491b9f8224862ce23a1.png)
![[Diagram]](../../diagrams/25/7ed6ea1f4e16d5f456af341e3825bab8.png)
![[Diagram]](../../diagrams/40/491eef961ff1a410e1ee216015433bf3.png)
![[Diagram]](../../diagrams/1/5cedbc2f10d929147a31ca1a027586f9.png)
![[Diagram]](../../diagrams/24/a7290827099d20b8bb79e26be594933a.png)
![[Diagram]](../../diagrams/47/8ec14462d932af6368ce5ba6b86b7a4e.png)
![[Diagram]](../../diagrams/37/4c2be8e1ac6b49a75e4a5c232db40766.png)
![[Diagram]](../../diagrams/40/07b3444c761d8f099975583ced6818f7.png)
![[Diagram]](../../diagrams/25/12ed87cc3f585accee1a689582f5aa75.png)
![[Diagram]](../../diagrams/4/2003527f6e3f3c08569a0f36e72336dd.png)
![[Diagram]](../../diagrams/35/a3f08dd7b898f897ede2fc57b45b474d.png)
![[Diagram]](../../diagrams/44/bfe4f32453902358be3247a1e017301e.png)
![[Diagram]](../../diagrams/40/25846a7164bb5a23aa167fd4a1649cae.png)
![[Diagram]](../../diagrams/42/50f628e2130002945b20074c256d0440.png)
![[Diagram]](../../diagrams/29/8e834e050ea27375f74d52a9be10bba9.png)
![[Diagram]](../../diagrams/48/b9c7b52aeb247c0dc082903afa9c336f.png)
![[Diagram]](../../diagrams/47/2c036fde56fee6203697f1547b7b81a8.png)
![[Diagram]](../../diagrams/43/5e8455d4b762e3ad7cb94db4f7298df8.png)
![[Diagram]](../../diagrams/19/6d69a7a85f88b0e0d819482964bb1ff3.png)
![[Diagram]](../../diagrams/36/8a4f05456e27b4db372b06e13ebfa444.png)
![[Diagram]](../../diagrams/22/5409f4bea2ca126e6c77c003bd6c7ece.png)
![[Diagram]](../../diagrams/42/58f2a8b53e590f0ab09e178b4c40fa05.png)
![[Diagram]](../../diagrams/8/373d56ca92b2d62993dd66aff2631108.png)
![[Diagram]](../../diagrams/9/853664920f8ab4731ef3a11de744ac58.png)
![[Diagram]](../../diagrams/2/2948a3a4d9ce21252781d62a8adb86fd.png)
![[Diagram]](../../diagrams/13/f1c5b9d2a9d62e619f28bbaca16f691d.png)
![[Diagram]](../../diagrams/8/2ef0c26b6f7d65ca7d2d208b0b4f5230.png)
![[Diagram]](../../diagrams/36/713ac211df29bbe7d8438ea507bb81a8.png)

![[Diagram]](../../diagrams/13/6a5eef78a3322bce8be50f63a9dc4b1b.png)
![[Diagram]](../../diagrams/50/efe3e71847551cd78e0d098da279c165.png)
![[Diagram]](../../diagrams/35/ef93d5346b36ee19e82b7957eb16ee90.png)
![[Diagram]](../../diagrams/1/b7c70f35fcfffe78ac074d4fa87576b9.png)
![[Diagram]](../../diagrams/29/4383151a225a08c00993d18a431f0e12.png)
![[Diagram]](../../diagrams/43/ad44205698b2a1bcd8cb259bb700c31c.png)
![[Diagram]](../../diagrams/2/dc3424c3467c7f1b71448fa770821395.png)
![[Diagram]](../../diagrams/40/c25350032a909ab2bc4bbed6c37e39a5.png)
![[Diagram]](../../diagrams/50/64f7638af947064fec54ab2e8ab4fbe1.png)
![[Diagram]](../../diagrams/23/fcf5a46b6c605f0b5aa9635749d77194.png)
![[Diagram]](../../diagrams/25/4af72860764cd6ea643a1e39b9b34ffb.png)
![[Diagram]](../../diagrams/25/4b07abc44953357c6b274b52ee79cb11.png)
![[Diagram]](../../diagrams/51/3f7c5652b7f8a6f736faa73282f8f0eb.png)
![[Diagram]](../../diagrams/35/8e2782a16072ad0e4d7f37fd633711fb.png)
![[Diagram]](../../diagrams/33/f522fdedef289fc4ab736c6faf15a526.png)
![[Diagram]](../../diagrams/20/50ea05528d2d37efffd9414571056d99.png)
![[Diagram]](../../diagrams/1/b13bb6afb78a97a86550321861dfdf5d.png)
![[Diagram]](../../diagrams/50/8f190b8ed31e0b9d89750becf29122b9.png)
![[Diagram]](../../diagrams/22/2a08048117256b4dba04f5d3569c7919.png)
![[Diagram]](../../diagrams/27/f03a5d2b49cad7a23c840455544c1a8b.png)
![[Diagram]](../../diagrams/52/08e2b06b7ae3d819e6e2121959687fbf.png)
![[Diagram]](../../diagrams/43/f59d32580eb9cd0a350338367afbbdb0.png)
![[Diagram]](../../diagrams/28/f368e067d279c02e32b3bb99263ba199.png)
![[Diagram]](../../diagrams/49/b5c48f0b8693d05b9fdc05633dacb9ab.png)
![[Diagram]](../../diagrams/10/3f67ebb9164878a1ed252fbb456d11e0.png)
![[Diagram]](../../diagrams/52/03e54f5c7b05c85bc7d1a9eb2261ef05.png)
![[Diagram]](../../diagrams/16/587a9b48a5ec74c80f305b3f457f92cd.png)
![[Diagram]](../../diagrams/6/cf6e8728d1ec81391ae615f0d4b9c655.png)


![[Diagram]](../../diagrams/15/95e8c990aa7b03163bfc588e52c5c440.png)
![[Diagram]](../../diagrams/4/718207f87ae5fc5d4cb08e99ebac0c6e.png)
![[Diagram]](../../diagrams/52/00ff51b50531cc4e766ec8dbcaa9097f.png)
![[Diagram]](../../diagrams/12/1673853cb1eae73f3015a4d712d6c8f0.png)
![[Diagram]](../../diagrams/18/f2355482de12104f4daacc745815b359.png)
![[Diagram]](../../diagrams/36/c8de5efa80ebaf69fcdf195781cdfccf.png)
![[Diagram]](../../diagrams/17/67632731c770f926e8eea4a63c42eaca.png)
![[Diagram]](../../diagrams/16/70bff9a098c38ad8196313c28f9ab243.png)
![[Diagram]](../../diagrams/14/70ad35a3ea8d1cabe5d6695a36e4fda6.png)
![[Diagram]](../../diagrams/14/ef038a3a92119b071df0c090bfd293ba.png)
![[ext]](http://go.yenching.edu.hk/go_web.files/jphis/muramasa200.jpg) http://go.yenching.edu.hk/go_web.files/jphis/muramasa200.jpg
http://go.yenching.edu.hk/go_web.files/jphis/muramasa200.jpg![[Diagram]](../../diagrams/37/7b9f3b8b9cb07615437de5cb6c98ebfd.png)
![[Diagram]](../../diagrams/4/6a051133a465791346c7f29b78bcf957.png)
![[Diagram]](../../diagrams/34/40256d5b5498d4892249b0ee869808c1.png)
![[Diagram]](../../diagrams/28/b7fdc44b93df336174d18ce52e1e05db.png)
![[Diagram]](../../diagrams/1/15c73eaa5658231b8fdef9ae5c8ccba2.png)
![[Diagram]](../../diagrams/22/72d6c02715bccad9aeea5412025c668e.png)
![[Diagram]](../../diagrams/45/62f6053575cd9b846875f45af61d7ab7.png)
![[Diagram]](../../diagrams/46/25d6dd15729ff0dd687733395f3d3e07.png)
![[Diagram]](../../diagrams/37/6d4845f3928817b6f509201b6af7dc4f.png)
![[Diagram]](../../diagrams/33/755caac993b1cc5120e966ff1a2dae54.png)
![[Diagram]](../../diagrams/8/78b24baa5be2140194deb7e9e8bb5310.png)
![[Diagram]](../../diagrams/15/8394c552c649f41f5e3c6159a1756390.png)
![[Diagram]](../../diagrams/40/77fdf26c3d14d9232849ef0d5dfa92a6.png)
![[Diagram]](../../diagrams/6/4c5b6acb346b8080cb3518b4b2f4571e.png)
![[Diagram]](../../diagrams/51/9b5b52c274ef1046628813624f89b19c.png)
![[Diagram]](../../diagrams/50/98cec7520dca83f20a6d844866552b83.png)
![[Diagram]](../../diagrams/28/7367e2accda6bb748d3ce0e8397edcb3.png)
![[Diagram]](../../diagrams/10/dc63702e7e8b1b32efa1f976ed819a05.png)
![[Diagram]](../../diagrams/35/7713be11efe4ed61ee715e6a58f153a8.png)
![[Diagram]](../../diagrams/6/e5315a1d359c0b9b8d70a2d7ca57dac2.png)
![[Diagram]](../../diagrams/28/0cc64accd933d1eba0b4b20c2fe94731.png)
![[Diagram]](../../diagrams/44/63bc37f01a644411242d671b0250396e.png)
![[Diagram]](../../diagrams/2/678a5e87e75730dde748a96c0a02fdbe.png)
![[Diagram]](../../diagrams/13/49bacb10b16fcee23341b452b694f1ea.png)
![[Diagram]](../../diagrams/15/9ad33854d195957856b7afa32f1b76b2.png)
![[Diagram]](../../diagrams/21/d22552460bbf3cef44e304188f182159.png)
![[Diagram]](../../diagrams/15/0e73f121837d850c7cf81d4c4e4d18bd.png)
![[Diagram]](../../diagrams/16/aee12fb0dccd68de74c7b1d89b304dc1.png)
![[Diagram]](../../diagrams/46/e76c10651584f5c27694c5b32aa48d05.png)
![[Diagram]](../../diagrams/41/eca1eae022ac623d285d511d9f77bde9.png)
![[Diagram]](../../diagrams/19/5e2234c7572e3015d97938a70ecea2df.png)
![[Diagram]](../../diagrams/49/169c8a0c1151e7350866f6f638ff50a2.png)
![[Diagram]](../../diagrams/42/4faccf18bb572f318556083dfce3003f.png)
![[Diagram]](../../diagrams/8/425b809d13cce7dfa52d039534544580.png)
![[Diagram]](../../diagrams/31/01f6a13825fb8f86094237d53693713e.png)
![[Diagram]](../../diagrams/5/63fe5f23e03f003c7c0121eea57a7e28.png)
![[Diagram]](../../diagrams/50/2d2e0e35f05121e63fc7bd8eeaf39fc7.png)
![[Diagram]](../../diagrams/6/f04e984c19197019d1b8a9f7af52645d.png)
![[Diagram]](../../diagrams/29/fd35ab5c1a76527f2d1f92db5c65af6a.png)
![[Diagram]](../../diagrams/24/a1c42e9d3556449a0920c95df107c967.png)
![[Diagram]](../../diagrams/34/962eed7ca04bcee33429439906e0b94b.png)
![[Diagram]](../../diagrams/11/7e1e93fd4fee64e6bb5859142f03b544.png)
![[Diagram]](../../diagrams/6/2ae642b0c86b5841d072445edb2151ef.png)
![[Diagram]](../../diagrams/41/7da95273794204fa953c7a855e4e09b4.png)
![[Diagram]](../../diagrams/17/2324d814f4d4f17d21acff874433e7db.png)
![[Diagram]](../../diagrams/0/40986866090c4fbe9cf335a6710a216b.png)
![[Diagram]](../../diagrams/21/4d0ba20307c832b49da48da09f9113f1.png)
![[Diagram]](../../diagrams/2/d920056a6ea955f53e233d2a996ff182.png)
![[Diagram]](../../diagrams/42/a43103975fe0f776cff769b46a80be16.png)
![[Diagram]](../../diagrams/35/89e51a0f5e06045601d4916782c2e923.png)
![[Diagram]](../../diagrams/44/3bef1d19a1938eb6ed675a5c6399111a.png)
![[Diagram]](../../diagrams/43/d19d69e73b171972af3741f0252a03cf.png)
![[Diagram]](../../diagrams/19/968bcd5d1d26887f5ae6a6e373e08355.png)
![[Diagram]](../../diagrams/30/f67188b25930a4cd98b16e4d10fab3af.png)
![[Diagram]](../../diagrams/2/82caa0336f995968c69abeb9cc9224f2.png)
![[Diagram]](../../diagrams/52/703bbad82bb2251df78544dd56129dc4.png)
![[Diagram]](../../diagrams/52/4e005a3acbbefa15905b1993158d6705.png)
![[Diagram]](../../diagrams/6/706592ca7662b9f3c7d32cf9a8d12497.png)
![[Diagram]](../../diagrams/35/1688b3d191cc5b55aa9beb5f61c1f7a6.png)
![[Diagram]](../../diagrams/43/27f0cfede3961e43c8db2e0db8824092.png)
![[Diagram]](../../diagrams/13/26048be5bb4e13dc5e78b51737077341.png)
![[Diagram]](../../diagrams/35/754247f77ef144c8c80e292f1f73ccd6.png)
![[Diagram]](../../diagrams/37/80f879873c2323614fd9c92e54ff4adc.png)
![[Diagram]](../../diagrams/18/d6b561734b5fc91889540c071b117dfa.png)
![[Diagram]](../../diagrams/21/278bf5fe101b56e823dee36d9ece5475.png)
![[Diagram]](../../diagrams/11/629f0afeb0cfcad14463ece17d1e7460.png)
![[Diagram]](../../diagrams/7/aac6812a51de17cf2e78187af209276b.png)
![[Diagram]](../../diagrams/26/fce464c304034a3f93e247d6a39a50ff.png)
![[Diagram]](../../diagrams/21/ab2c93211ea72f4302010ef01242cd62.png)
![[Diagram]](../../diagrams/0/ed155486289d2fe14afbd92ae552a9fb.png)
![[Diagram]](../../diagrams/17/fe97cfa35eac540dde21230c2073acdc.png)
![[Diagram]](../../diagrams/25/eafcbee082d2d83d5fd965fc4281c013.png)
![[Diagram]](../../diagrams/31/80332c237e4cb0bfd69afd8a34e6c7b7.png)
![[Diagram]](../../diagrams/18/da3490385c0d1cafc7050d1b2d6c790c.png)
![[Diagram]](../../diagrams/30/a5625391ffdde2c851ac3961e57add55.png)
![[Diagram]](../../diagrams/6/9331ef99e6cbe6fd99b9dfb653a6eb53.png)
![[Diagram]](../../diagrams/22/ae20bad54a18fced0f632e3ed9aed19f.png)
![[Diagram]](../../diagrams/39/677d0c8df90eb1bd1ab7366033a9d508.png)
![[Diagram]](../../diagrams/16/7ce2662d5a0dd91a7ec1ef90d198b8e9.png)
![[Diagram]](../../diagrams/30/96e7a148d55cea0bf2104fa96d4330ce.png)
![[Diagram]](../../diagrams/52/63ac946908b3f4c5f4d60512570b4b62.png)
![[Diagram]](../../diagrams/1/4586fc5c89cd10473d366a93706be27a.png)
![[Diagram]](../../diagrams/4/5d731f3789ba44b77df64e1a6216b8d2.png)
![[Diagram]](../../diagrams/51/acf4bbdc0febbecf252c9cbb154df851.png)
![[Diagram]](../../diagrams/49/1bd859a92ee88de5dff47ea04e7cdda7.png)
![[Diagram]](../../diagrams/35/5b825a042e9593e828f62a54f34bcc79.png)
![[Diagram]](../../diagrams/21/e178d6d2dc53b037f972645011bc40c2.png)
![[Diagram]](../../diagrams/13/96a6f4cc9de9fe0c506fe382ff00f184.png)
![[Diagram]](../../diagrams/17/d463f8dc5a146d07d76de56b36f64996.png)


![[Diagram]](../../diagrams/10/9ce2e35bf11dee84011222c674863edc.png)
![[Diagram]](../../diagrams/37/899636609b8c9a446c6349b4b5820b23.png)
![[Diagram]](../../diagrams/34/4425b5b049f1cf5e95018f884b203cd5.png)
![[Diagram]](../../diagrams/2/1ffd0b26b69e719031fb8c5753d06f11.png)
![[Diagram]](../../diagrams/24/a5dcd4efea37fe47755388ee72417195.png)
![[Diagram]](../../diagrams/43/34fb277405252449c141036b13811394.png)
![[Diagram]](../../diagrams/31/d02f749ee95d4cb9c003a20bc1562aba.png)
![[Diagram]](../../diagrams/24/cf291cc22fbb47821828b2ed94c798f7.png)
![[Diagram]](../../diagrams/2/1bc8d2c717f354481b8f8181a999b1cb.png)
![[Diagram]](../../diagrams/35/706c2893a85fb76797ce79c470804fe9.png)
![[Diagram]](../../diagrams/30/b05f913f0376dc5950f633ed70b05bb2.png)
![[Diagram]](../../diagrams/44/e922a6321d3f3c37755e789ffd5239ce.png)


 Hi Visitor.
 ![[Diagram]](../../diagrams/38/d2b2f2bf210fa1e373c98f1a26838775.png)
![[Diagram]](../../diagrams/35/62c622332e2ab0c4e05a55e12e2410c6.png)
![[Diagram]](../../diagrams/15/4a97e5ab91e0d5d740db2b5028f09fc9.png)
![[Diagram]](../../diagrams/14/641601b39ceef8a2dad5ad85b804930a.png)
![[Diagram]](../../diagrams/43/7bc0e0c7e972aac54ee8fabed0bca461.png)
![[Diagram]](../../diagrams/37/5fbf0806bb0031c02c5458b499b3c5b2.png)
![[Diagram]](../../diagrams/24/590a7374f070ae1584a35081201f9598.png)
![[Diagram]](../../diagrams/39/b17d469f1f15a6a796cb71d3bd745953.png)
![[Diagram]](../../diagrams/20/1b2d41a4e86f8cea451dbc44b4dc4f68.png)
![[Diagram]](../../diagrams/34/507b277b206971d8ce92722a51fb008f.png)
![[Diagram]](../../diagrams/15/a60580c92feef538be993cc4246a7dcc.png)
![[Diagram]](../../diagrams/30/c788d3301a6690dab5a8ecb045d97d52.png)
![[Diagram]](../../diagrams/11/2a65944f6af15df24504117d742e9154.png)
![[Diagram]](../../diagrams/52/0503c38354d91b7a4afa6debe06ae2e6.png)
![[Diagram]](../../diagrams/19/7ba99a8586cc3807495802502793a8f2.png)
![[Diagram]](../../diagrams/26/c98bf017bfeaed22af7ac97b5f289eb0.png)
![[Diagram]](../../diagrams/22/f80c91490b0b6143106a22f5cd764907.png)

![[Diagram]](../../diagrams/7/4cc4280617b878315808599c178a820a.png)
![[Diagram]](../../diagrams/41/f033fedfba643f9ca014c8913f8d4780.png)
![[Diagram]](../../diagrams/6/227300b56fa34f679c41688a3a644150.png)
![[Diagram]](../../diagrams/47/e59aacc152fe666bc1a86b8888a7bfad.png)
![[Diagram]](../../diagrams/46/c9803f8131fba50eb6f7fe8fda5685b3.png)
![[Diagram]](../../diagrams/3/11a767ee5832942c9fc4d573680a45e1.png)
![[Diagram]](../../diagrams/17/6bfec894debf75e1a01a4a8f76d3520c.png)
![[Diagram]](../../diagrams/47/a13c7429dff517335e745de032fafcc7.png)
![[Diagram]](../../diagrams/40/44d5cbc6fbdc452f311a97d81ce60b49.png)
![[Diagram]](../../diagrams/28/06d34aa3c71cb9eb63ae29d2efce1b51.png)
![[Diagram]](../../diagrams/30/2a23862fffef530ac83c476f28581d50.png)
![[Diagram]](../../diagrams/0/3946aad91faeb5add8000f17854ce2b0.png)
![[Diagram]](../../diagrams/47/d09ac4aa172c71b930a3495ad1b340dd.png)
![[Diagram]](../../diagrams/35/ad9f46018b301b5755bc462d0853a478.png)
![[Diagram]](../../diagrams/12/f7e54296a3a65ce0c3fc80c84c8166a2.png)
![[Diagram]](../../diagrams/29/03593d246ddd00c1be6675e783cdab90.png)
![[Diagram]](../../diagrams/13/adfe44f7ccaf38fe3b0ad8c7274ee3d2.png)
![[Diagram]](../../diagrams/47/caacbd4f7a697eafde644d7040bb31a9.png)
![[Diagram]](../../diagrams/22/ad364282b4e819b528c490bb989d9c29.png)
![[Diagram]](../../diagrams/44/402e2be57ccac25247217338c6779ce9.png)
![[Diagram]](../../diagrams/46/80d372c88c11d078b1167f5dc4bf7eb4.png)
![[Diagram]](../../diagrams/38/0133dc6e4d35c814a8991a557c50b945.png)
![[Diagram]](../../diagrams/46/b2ec7223f0df507c9e4b66122da3267f.png)
![[Diagram]](../../diagrams/48/ffca5cc0d3b929b8ac26ce20b9011d29.png)
![[Diagram]](../../diagrams/33/c62d4f953ad6f47cbbef59f3818c2fae.png)
![[Diagram]](../../diagrams/34/6c3bdd20047dd0c66b521db7bb636966.png)
![[Diagram]](../../diagrams/29/fb493e54a4f0088963a8c21e0ea11b01.png)
![[Diagram]](../../diagrams/22/5aceac63c13232962664b68a9266f05f.png)
![[Diagram]](../../diagrams/5/37201cda3b54d9e9285fb182f42e8b7d.png)
![[Diagram]](../../diagrams/25/b062601ecf7cec102c97ef85f19d9104.png)
![[Diagram]](../../diagrams/32/a6e3f597c6ecfcd9b9182167d504d75e.png)
![[Diagram]](../../diagrams/45/1c552c77f585d1b15708492530e27e7e.png)
![[Diagram]](../../diagrams/28/c705b18485d8671ccf53075e5e6edb04.png)
![[Diagram]](../../diagrams/51/bea68f49e08132903fcaee1b9c6c7a19.png)
![[Diagram]](../../diagrams/40/c5e59e6cf0d26e557c010f6f39b8489c.png)
![[Diagram]](../../diagrams/2/5ef1129a824672175a811255ac73ec4f.png)
![[Diagram]](../../diagrams/4/6d4d25b362d0eab23efadb879d73c52f.png)
![[Diagram]](../../diagrams/6/0f8884e87a31a29629791c56ce91a0cf.png)
![[Diagram]](../../diagrams/21/f6721934730573a0350d5491a1ed9434.png)
![[Diagram]](../../diagrams/20/b062b8341558e810cd0f18e0ea285abf.png)
![[Diagram]](../../diagrams/37/d41438441e924cfd5050b36a9aebb6f9.png)
![[Diagram]](../../diagrams/46/8aa0c13207937e3a54b7ff0ce0a79ecf.png)
![[Diagram]](../../diagrams/14/c07e4b2b35b0bbc87f1c02785d71e46a.png)
![[Diagram]](../../diagrams/43/1cd03573ed179d6a61ffeb80d0fc31de.png)
![[Diagram]](../../diagrams/20/c7fd062b2dbf15bdcd4cb8275b948b54.png)
![[Diagram]](../../diagrams/42/abf333054253150af2d32cd14f72dabe.png)
![[Diagram]](../../diagrams/47/6ce99f00e116ee2558d28630c213bba9.png)
![[Diagram]](../../diagrams/18/b08cdc5c9bb790d6f2926a1ecced954c.png)
![[Diagram]](../../diagrams/19/252f3eb5a2a14fb56fa93fa8b274a1b0.png)
![[Diagram]](../../diagrams/8/80a1cf8a0470cd630e8d1a062cfb52c5.png)
![[Diagram]](../../diagrams/52/82654a485aef88e5f03815bac16f573c.png)


![[Diagram]](../../diagrams/19/399dcb3d370f9e6d19f0a698044c036c.png)
![[Diagram]](../../diagrams/20/1c227120720e19d10bdb83ec06d6d93d.png)
![[Diagram]](../../diagrams/31/d7b7c7452df53d19338f837b2d61f151.png)
![[Diagram]](../../diagrams/4/ce33b13a8c3412ab827c03156c195ef2.png)
![[Diagram]](../../diagrams/24/8105592b16f6025e8bfe83835f99f12e.png)

![[Diagram]](../../diagrams/10/1d09aba8f61ac2f5a3f2542ff4b604b5.png)
![[Diagram]](../../diagrams/33/c71e75b50c20b4a7d9cfc533a8699a9d.png)
![[Diagram]](../../diagrams/35/dc31d37834a057c78b274860c8a51daf.png)
![[Diagram]](../../diagrams/0/d247a0bb3b39afd5647ca6d241fba278.png)
![[Diagram]](../../diagrams/17/a95d383aec7b6004f45ee97f784658fb.png)
![[Diagram]](../../diagrams/41/84a2bfe9c23e92026cb87de760781ebc.png)
![[Diagram]](../../diagrams/30/ca5b11159ff41906891aac02cced0968.png)
![[Diagram]](../../diagrams/20/0abb1245617fcc78de591886e5f85c27.png)
![[Diagram]](../../diagrams/24/d6eda8bdb50e2aa0e3ef5316c44dc0d1.png)
![[Diagram]](../../diagrams/32/dccccb4024e0e05f83d8f50ff5775b89.png)
![[Diagram]](../../diagrams/25/be85572602955246e36c0fb3cce2b25b.png)

![[Diagram]](../../diagrams/48/4f906187e796d0256486f84ece58f727.png)
![[Diagram]](../../diagrams/4/f87625032e6988afd206977f01814f03.png)
![[Diagram]](../../diagrams/38/b2014ade2896e977e729d39b68aa6388.png)
![[Diagram]](../../diagrams/10/7ea0767e5329b18cf3cb2f505e2b7435.png)
![[Diagram]](../../diagrams/31/72f58c8125fec73c6fd158259c3c57df.png)
![[Diagram]](../../diagrams/48/ae6aae44824cc7de8d4a7597d2452fa2.png)
![[Diagram]](../../diagrams/4/920129b5a9904dc1b23f81d2e79d60be.png)
![[Diagram]](../../diagrams/27/7e759a22e7d40caddd3b06f172139664.png)
![[Diagram]](../../diagrams/24/fde51f53bdde50f277a97f3e89603f37.png)
![[Diagram]](../../diagrams/34/c8f17c90cd899ba78225ad4c9da3e4d9.png)
![[Diagram]](../../diagrams/33/63fd62a0171e3f81a6909587a05f99ec.png)
![[Diagram]](../../diagrams/37/d45efc9591d6752b1b1e8d4d409b94cc.png)
![[Diagram]](../../diagrams/2/6f854d161a4d8337239144f327c31f5d.png)
![[Diagram]](../../diagrams/0/ab2f0e7c1f85182fae20a1058a07323d.png)
![[Diagram]](../../diagrams/43/ea7a6a0d74f9e95ee9a549114ba741c9.png)
![[Diagram]](../../diagrams/38/31c1b1495866748959711d450cadefae.png)
![[Diagram]](../../diagrams/13/09506024297e8628496ab12ad3a78789.png)
![[Diagram]](../../diagrams/34/74f8f16e34da75981dd1e4bdaf9d7745.png)
![[Diagram]](../../diagrams/23/2ea982ad00e28b674025e1c60e56bf5c.png)
![[Diagram]](../../diagrams/51/e80d92c9fd08a49c5d4a27e23816b382.png)
![[Diagram]](../../diagrams/20/e6839af57394bb979a520521ea027fcc.png)
![[Diagram]](../../diagrams/41/3b92fb9b55f819071f644c6673411fa8.png)
![[Diagram]](../../diagrams/18/00dca93eb9880bbf020bd748108eb8f3.png)
![[Diagram]](../../diagrams/6/4521f48e537fcb39c958c395fbfdf93c.png)
![[Diagram]](../../diagrams/27/6cc79b21e268784c13e8d8a4dce80ed1.png)
![[Diagram]](../../diagrams/27/95ddad12564ab1423c4c1e12395209d6.png)
![[Diagram]](../../diagrams/5/0d37f206d7604be848ccd6efd6c016c6.png)
![[Diagram]](../../diagrams/21/3ee10a1339928d9a62a7935cf531440f.png)
![[Diagram]](../../diagrams/40/f8c377a4a5ba2c0aa30007cdf63ab394.png)
![[Diagram]](../../diagrams/2/1cc0fd236e206f145ab0b0d9759a9248.png)
![[Diagram]](../../diagrams/6/c0d3a51eb5d2b5a3ba4b9c7ce4578300.png)
![[Diagram]](../../diagrams/16/81ba5e9e65c5cd88d04bbc2292f55c0f.png)
![[Diagram]](../../diagrams/9/821826bfb4ab8e58a0ec4d2ea5a248a3.png)
![[Diagram]](../../diagrams/43/9e6c1afef39acb2acdfc946d37eb1393.png)
![[Diagram]](../../diagrams/51/fd9a7543568a90fc3d20a9609f629e06.png)

![[Diagram]](../../diagrams/39/8e9442de34a9801a5f10bd4cc7e3297c.png)

![[Diagram]](../../diagrams/43/5e0fc85a49b0ea509b8e09f161dc0e56.png)
![[Diagram]](../../diagrams/29/59903f7f8d2c6036647e7bbb20a4492e.png)
![[Diagram]](../../diagrams/20/65c6c208d1c2bf430f9e23255626ce32.png)
![[Diagram]](../../diagrams/45/8e577e3760b4f104177e7978ece9b05a.png)
![[Diagram]](../../diagrams/0/9df945ca334d230462e6288f15d2e86f.png)
![[Diagram]](../../diagrams/28/930ba6f5e644f14f4d2edf352e7d2158.png)
![[Diagram]](../../diagrams/2/e00b45853824c7849475f9faa9649f36.png)
![[Diagram]](../../diagrams/11/3f2c4f98669aaea30a6a2f220b884ea7.png)
![[lst]](../../images/latestpost.gif)
![[Diagram]](../../diagrams/11/07564d2480ffb95c4eb74086a69e507a.png)
![[Diagram]](../../diagrams/12/cf8b499df6197aef0b2236bde3aa44bd.png)
![[Diagram]](../../diagrams/10/1cb971b253d9037d2fcd84b79df790d3.png)
![[Diagram]](../../diagrams/6/4834146983e15df777b620ce515c69d2.png)
![[Diagram]](../../diagrams/7/c51e4d8c91ee6cc4db5c2fa63e0c9afb.png)
![[Diagram]](../../diagrams/20/ac893cf29ea76087c1554b3aceebefac.png)
![[Diagram]](../../diagrams/8/1e0a2b888292adbe00141a0c801fa585.png)
![[Diagram]](../../diagrams/34/528ad625bd857889ef00e2c38ee86412.png)
![[Diagram]](../../diagrams/6/5ec1221af173761c60010eda1c9203fe.png)
![[Diagram]](../../diagrams/26/4110bb10c405919c2f626bb5ee8f9bca.png)
![[Diagram]](../../diagrams/16/5d8da7e3eaa87bdd27e8828d21f7f72e.png)
![[Diagram]](../../diagrams/5/d74465b4cd097614f97f97376a15a81a.png)
![[Diagram]](../../diagrams/38/469e7882c9cb166aed2f4d5710785fbc.png)
![[Diagram]](../../diagrams/40/b548c2b9a733a66de6624055c19dad0f.png)
![[Diagram]](../../diagrams/7/f69aa2a9fca56d0e8a51301ca16a9a7e.png)
![[Diagram]](../../diagrams/12/3b57cebe43134d70d873fe0b3c36d70b.png)
![[Diagram]](../../diagrams/2/c31c7ec63508c4416502582d8f2d8f3b.png)
![[Diagram]](../../diagrams/11/8cd437bb9dc987d5ef98475f12bff1c8.png)
![[Diagram]](../../diagrams/11/205d7df6e78da2501dedf02893256b5b.png)
![[Diagram]](../../diagrams/47/2a073c263c0450919d957336ad748e6a.png)
![[Diagram]](../../diagrams/52/0282f29842ac9c8f4f062080fc231dcb.png)
![[Diagram]](../../diagrams/34/a7aaefa8ba7b23525694f9dbee117dc0.png)
![[Diagram]](../../diagrams/41/1f4c8bb8b7fb04b242a25f90e1f7260f.png)
![[Diagram]](../../diagrams/47/099933dde88327906c56010817be24f4.png)
![[Diagram]](../../diagrams/47/3ed624cc28bd413bde479faaf861c094.png)
![[Diagram]](../../diagrams/50/4c857ef8b857d7d0ee8418dad40d18df.png)
![[Diagram]](../../diagrams/46/e2ffd1a09792d24e8c7665e735948abe.png)
![[Diagram]](../../diagrams/46/5c1cc146ee6337b929a9d5e547e5350f.png)
![[Diagram]](../../diagrams/18/733b294fbb5cd55aa46f5db49d053b51.png)
![[Diagram]](../../diagrams/30/e766f9e473eb4206a31c518cafb9c1b8.png)
![[Diagram]](../../diagrams/39/f59d64ec8d41adabb050df7ef448ebc5.png)
![[Diagram]](../../diagrams/40/55e7eb7032abda1d05f8a18d9b69ad8d.png)
![[Diagram]](../../diagrams/36/3ee33c89b1c0051c5e7904b7bc54d00c.png)
![[Diagram]](../../diagrams/50/eabc9537c2ad77784e22ac509979c869.png)
![[Diagram]](../../diagrams/3/a76d7d25ea377b75256256721fa58055.png)

![[Diagram]](../../diagrams/17/a05aea1aa2a7e10a310f3b7d85f07aec.png)
![[Diagram]](../../diagrams/45/b963616e829065f8b0624d7c381af17f.png)
![[Diagram]](../../diagrams/5/eb99416206c0bae3b29e785806ecf95c.png)
![[Diagram]](../../diagrams/0/b175bf5e96650176d0efc4c2812161cd.png)
![[Diagram]](../../diagrams/0/b87deffb30e7a6bd546de18ab92d2a51.png)
![[Diagram]](../../diagrams/47/467229a98306359bafa5f04295fafb6d.png)
![[Diagram]](../../diagrams/27/a22bce30740816b51ffbff6fd659943e.png)
![[Diagram]](../../diagrams/2/1a01e35d6c5b917547a4faf0f3d14200.png)
![[Diagram]](../../diagrams/14/c2321483c49030b601bcf80eb69cf523.png)
![[Diagram]](../../diagrams/2/e6508b01bd948097341bce697e338cca.png)
![[Diagram]](../../diagrams/36/328f4233b771f4e01a63bae094b29a3d.png)
![[Diagram]](../../diagrams/35/8fc0e11fa75572bdbe12f4c314625746.png)
![[Diagram]](../../diagrams/49/a3860bc58fbb4514102b184fddd3f32c.png)
![[Diagram]](../../diagrams/38/93e32fb755f79e2422f90ac49d1323d1.png)
![[Diagram]](../../diagrams/7/3834e9eee2bc8ec7473cee3802e8f7c6.png)
![[Diagram]](../../diagrams/27/625533796345d441c71f211aaf44ccc6.png)
![[Diagram]](../../diagrams/39/d18b296bcd98c28724e616af7349c3bb.png)
![[Diagram]](../../diagrams/19/5888c134fd3345825ae9ff866717b6a2.png)
![[Diagram]](../../diagrams/42/c892aaba52844c870d2ff4940395d55b.png)
![[Diagram]](../../diagrams/13/0191d612cf395f369b27b0ba2c66b150.png)
![[Diagram]](../../diagrams/8/3b856df96cd8e4498d5b3935223c343d.png)
![[Diagram]](../../diagrams/47/c9cd0f8a0468a4427804f89289396833.png)
![[Diagram]](../../diagrams/27/c7822742613cd4d3278cf53007d96f4f.png)
![[Diagram]](../../diagrams/49/917fe99594a054212c7f2e3ca443c7d3.png)
![[Diagram]](../../diagrams/14/93c271bbf823a58c70679092cde973a7.png)
![[Diagram]](../../diagrams/8/b5b5da774d28605a8291aa24d8125cb4.png)
![[Diagram]](../../diagrams/34/b7106685be24761e72a6f8e226b7b0e7.png)
![[Diagram]](../../diagrams/21/978082b9a0a960e15fac8f8f23353665.png)
![[Diagram]](../../diagrams/17/88b47bb60330444f82d97dc66297a19f.png)
![[Diagram]](../../diagrams/9/64fa6675b63c321395fd27fcd1a1c05f.png)
![[Diagram]](../../diagrams/10/890d17f395c9917c685bbacc8e9fe380.png)
![[Diagram]](../../diagrams/39/98d7beba9c3f9f7c75c926e1151f3d5d.png)
![[Diagram]](../../diagrams/0/07d0becb95cf36671b675a33a5e6e5cd.png)
![[Diagram]](../../diagrams/3/3323869bb44863da0e48edab140e220e.png)
![[Diagram]](../../diagrams/38/ce9b8242f89489e580f842e6e9f43043.png)
![[Diagram]](../../diagrams/17/9a03c84d2cee7faeb985f3c8eb8b8912.png)
![[Diagram]](../../diagrams/24/e0c42dbabededcda1476d090a2a47b6e.png)
![[Diagram]](../../diagrams/34/890eea1a1f496a91f09d65263e681ef2.png)
![[Diagram]](../../diagrams/51/23036a060984545812edbb5502eda903.png)
![[Diagram]](../../diagrams/52/6591296ee05f7febbdf3d27f5dd09093.png)
![[Diagram]](../../diagrams/48/e112f9ccfbb967b0238af901b216fb2c.png)
![[Diagram]](../../diagrams/39/f64e879de209f85dde1c8294e468aa63.png)
![[Diagram]](../../diagrams/12/4bb81469483f1a1c6493574a2507db10.png)
![[Diagram]](../../diagrams/37/e660abbb16d4a39b09f16e172b1af6ab.png)
![[Diagram]](../../diagrams/45/96fad052dca8f8276452f31655c8ee71.png)
![[Diagram]](../../diagrams/29/34242846e0f1a08dd99b831eca782808.png)
![[Diagram]](../../diagrams/5/d70e4b18e31b3ff503bac0796778c727.png)
![[Diagram]](../../diagrams/42/7fed0fc2c4a513d22120784d66d22ca9.png)
![[Diagram]](../../diagrams/9/877029e5204f4b702e5c82f63bc1a4cc.png)
![[Diagram]](../../diagrams/49/dc65f709fb12b218471767dc679ae683.png)
![[Diagram]](../../diagrams/45/c28fedb14d4fdd311bdcac5b3eb6f17a.png)
![[Diagram]](../../diagrams/13/76556094b3417a78603adcf8c56be6ea.png)
![[Diagram]](../../diagrams/14/14b1a0825cffaba56f950bb1b158b957.png)
![[Diagram]](../../diagrams/30/96297b5830849986e80389691f9c54f5.png)
![[Diagram]](../../diagrams/46/d8ab716280ea5f29fa83ad2d2487a65b.png)
![[Diagram]](../../diagrams/18/1bd1af4af6e9ba8bfb2782e048f11337.png)
![[Diagram]](../../diagrams/1/2b5b59394efd444f450d923814f387a9.png)
![[Diagram]](../../diagrams/24/74076a162c7d5a82ab54334b569979d2.png)
![[Diagram]](../../diagrams/29/de3c3e0dab7ffeaee67d93a772d34f9d.png)
![[Diagram]](../../diagrams/31/525c93148d0310cc3ffb93f92f66e5d1.png)
![[Diagram]](../../diagrams/42/7b8f2b618c9b4e4b8bce6030359f0c49.png)
![[Diagram]](../../diagrams/42/6be45d9d266402fdf2ba8e889c87eff0.png)
![[Diagram]](../../diagrams/17/a38fa794d8a9d1f6900b7fee15a783b4.png)
![[Diagram]](../../diagrams/9/99e85364e4bbda5312a652c0d2ddd5f4.png)
![[Diagram]](../../diagrams/11/1df67392be3a2010392eb986611049ff.png)
![[Diagram]](../../diagrams/27/3f164b3d63d5e0351710f20f84690f98.png)
![[Diagram]](../../diagrams/50/9a2996bceb00713e07bc0f3bea28beb8.png)
![[Diagram]](../../diagrams/34/122f6a9fb7c31bf6293727fa44e9a83c.png)
![[Diagram]](../../diagrams/25/0e3b30f6c1a4402cef5ba6e1942b9e2c.png)
![[Diagram]](../../diagrams/45/b9b89e53c940952d9ce8047f28aee6a3.png)
![[Diagram]](../../diagrams/11/7788ac885661814b36d8e02704bc81dd.png)
![[Diagram]](../../diagrams/3/fcff3429c92fa37dd66ccabdbfbcfc2e.png)
![[Diagram]](../../diagrams/35/04354c6c23569c536f14fd6236407bb3.png)
![[Diagram]](../../diagrams/33/46bd3cddf24a8a9056e91fdfaf9e2c3a.png)
![[Diagram]](../../diagrams/15/6549c4d59188a68cb1001ac7f2842ddd.png)
![[Diagram]](../../diagrams/9/7ed1fac382b9486f6b95eacb4c500d99.png)
![[Diagram]](../../diagrams/18/9c945c69c1c8e919530adf0239dfa885.png)
![[Diagram]](../../diagrams/29/599a0d26088b7ca2e2c44c65f15ccdf2.png)
![[Diagram]](../../diagrams/8/5836924d187f7ccdedc9cf6a33552e34.png)
![[Diagram]](../../diagrams/44/37d9ec74557db09eb1ab99b79b4f71c4.png)
![[Diagram]](../../diagrams/26/901a272f2e7f6dd4d74efbd6dad03050.png)
![[Diagram]](../../diagrams/3/cb8d79d805204842aef51a2cf5ad796b.png)
![[Diagram]](../../diagrams/23/fda5c509130a7a5850cb344d4172f96d.png)
![[Diagram]](../../diagrams/5/4ae49fbfae3db5d4b77b79990e677f04.png)
![[Diagram]](../../diagrams/21/7f872d18cdb60351c069ed0f7298012e.png)
![[Diagram]](../../diagrams/14/6860a8dca74ceb8b78f5af2c1df07684.png)
![[Diagram]](../../diagrams/37/43a3e3f01f086917c0095d96df93b848.png)
![[Diagram]](../../diagrams/20/cb35c0e1b1d7124c8e0453b94eb47a09.png)
![[Diagram]](../../diagrams/8/4fdf38231eb6ee2b0822cc0dc013a674.png)
![[Diagram]](../../diagrams/19/ae6e627dd71b1a95760019a78f412dd1.png)
![[Diagram]](../../diagrams/32/44b74c096cfa7ce62690c2dc3da21751.png)
![[Diagram]](../../diagrams/33/b68c8d102c81ffbf70c1504b5624b1d8.png)
![[Diagram]](../../diagrams/5/5de1a8076422378f3d97a8d8860ac6aa.png)
![[Diagram]](../../diagrams/39/9bc698425461cf6ec203fe6e7a490238.png)
![[Diagram]](../../diagrams/30/b32095f9763013cb74c69076c5a3de10.png)
![[Diagram]](../../diagrams/30/02e5a48dbe7997a5389777a6da78e03a.png)
![[Diagram]](../../diagrams/42/21c24bbc2d54df5d28c5a26c061e0b17.png)
![[Diagram]](../../diagrams/41/51139a239d61e5e81d50d28dff2ea0f2.png)
![[Diagram]](../../diagrams/45/03da6c922422a8d68f81617df7ceae47.png)
![[Diagram]](../../diagrams/34/10811d011a4eb52afc19b931eb555a36.png)
![[Diagram]](../../diagrams/14/0f599cc3f928e5d2a464134ebf86d56a.png)
![[Diagram]](../../diagrams/27/ac82ce66776e88fe74289dc8d6b1d9e8.png)
![[Diagram]](../../diagrams/2/ffe7f0e9f39a6e51878f950f7e7ffc9b.png)
![[Diagram]](../../diagrams/22/f0467b69faeb3eb310ded48649948c78.png)
![[Diagram]](../../diagrams/31/8f6e8662f4f104c9252ea65d9b029935.png)
![[Diagram]](../../diagrams/41/a5876b7a671ec6840135ce49e125df01.png)
![[Diagram]](../../diagrams/39/a21e0bf3c2613203f9f8469461a878d9.png)
![[Diagram]](../../diagrams/9/184b48adb6f79b559e10881e8f2748c2.png)
![[Diagram]](../../diagrams/51/d3661f69c3f5138f31166010dcff348e.png)
![[Diagram]](../../diagrams/18/69f0ae4ddaa4a70d5caa1990fe125bad.png)
![[Diagram]](../../diagrams/42/a9a1fbb318b028ae181de6665ecb0a39.png)
![[Diagram]](../../diagrams/36/4c3f9b2d6aa8a24fb5476f5a223e186a.png)
![[Diagram]](../../diagrams/0/e983e489bb0113b5e745141ce488e22c.png)
![[Diagram]](../../diagrams/38/473af922d506e0cd08874b4836c00507.png)
![[Diagram]](../../diagrams/39/a8488d0e78c6929c6709c24f9161524f.png)
![[Diagram]](../../diagrams/17/39c60f149edb2d4fd9c9b109be5cfef9.png)
![[Diagram]](../../diagrams/21/2a141e88be6abea3ff2fde72882f39d7.png)
![[Diagram]](../../diagrams/0/63d28144adb9301e3a41615bff9365b6.png)
![[Diagram]](../../diagrams/2/f7c3751cfe209b99f5468a8fa0767c4c.png)
![[Diagram]](../../diagrams/21/15c01be0961e967f7af525a07b7f696d.png)
![[Diagram]](../../diagrams/27/f62ff4c2481eae77797e81e91a216cbc.png)
![[Diagram]](../../diagrams/23/1c3436e9f8786f1d0555cfe2269a1f30.png)
![[Diagram]](../../diagrams/4/71883e5cbde46881e64c7b7a2696071e.png)
![[Diagram]](../../diagrams/44/82c13659d89968b64aea08afda82cb7a.png)
![[Diagram]](../../diagrams/16/313d4a78ebadbd8e5025143dbb5ca1d9.png)
![[Diagram]](../../diagrams/47/0d75d634c581fbadfea3ec6c27e5396e.png)
![[Diagram]](../../diagrams/14/d43eacf3cb439681a5dacca315194b12.png)
![[Diagram]](../../diagrams/47/b97678213f69c98f072f05a1cb2fb495.png)
![[Diagram]](../../diagrams/11/f5439cb91dc01f772323151c0443dba2.png)
![[Diagram]](../../diagrams/20/26d56eb9b3f503ea09db2808c12d9ddf.png)
![[Diagram]](../../diagrams/16/c35e2a6cd6ae73023e8a6b6920946760.png)
![[Diagram]](../../diagrams/11/a6e5ba1668a914ef60833ef5e793587e.png)
![[Diagram]](../../diagrams/45/7201cdf60e2b0574aadf51c389e53c71.png)
![[Diagram]](../../diagrams/35/95f141e2160bda7591057a857f3003d2.png)
![[Diagram]](../../diagrams/28/a60cc6b1a889a2f59baaa26fc2981511.png)
![[Diagram]](../../diagrams/6/dba6fff809a20255820212d3624c08a6.png)
![[Diagram]](../../diagrams/30/4f5e6f67b124c2b28b0a5899b08a2fca.png)
![[Diagram]](../../diagrams/33/c4d88af45ec7b66176de70d219214cff.png)
![[Diagram]](../../diagrams/49/703b5613b43589f999fe56944f11a180.png)
![[Diagram]](../../diagrams/23/5c0569442db91597c13758a7887a3bb0.png)
![[Diagram]](../../diagrams/35/f4aba938cdbe93771e89d68888c57ff8.png)
![[Diagram]](../../diagrams/33/b9c2b4a4403316fb02053601c7e9a359.png)
![[Diagram]](../../diagrams/11/963c7d3445b9886baaa723e8d2b4f760.png)
![[Diagram]](../../diagrams/38/b9ffd0d51513c936e440de690fd71871.png)
![[Diagram]](../../diagrams/19/1db5709e82fdef3e87a2c7d9cb65f89f.png)
![[Diagram]](../../diagrams/44/0f8f447978cceca1a0af63fed57a0840.png)
![[Diagram]](../../diagrams/4/7a0896db866f4c6332a2b8bcaf123cce.png)
![[Diagram]](../../diagrams/38/832f91df1cf88a458f963c9beaefcd6c.png)
![[Diagram]](../../diagrams/25/79cd7d04cd9b295971656309d7d251ed.png)
![[Diagram]](../../diagrams/14/8f1a71cccf04f0ee4e978c27d642aa3e.png)
![[Diagram]](../../diagrams/44/96026ae9cbe317a5b74fbde9016f956d.png)
![[Diagram]](../../diagrams/46/b56eba965035c0345b34d4987d7814f6.png)
![[Diagram]](../../diagrams/41/e4be18646b9a466bec5eb22ff4957e37.png)
![[Diagram]](../../diagrams/29/5856189708fe693551e125e681a682d5.png)
![[Diagram]](../../diagrams/47/997f3613360ece5d851e86552d80fa44.png)
![[Diagram]](../../diagrams/37/3b4d657334c8f5fab58bdc58ffe3b2c9.png)
![[Diagram]](../../diagrams/23/5821b2dbdcf315b6bb6b4fcd9d84acd1.png)
![[Diagram]](../../diagrams/3/c345f847fe2ac3bc42bc68b95f352a7d.png)
![[Diagram]](../../diagrams/26/5559d9f820a0833467190c69a244d5f6.png)
![[Diagram]](../../diagrams/39/9d85611a7d51d642afeb6fa02d2c3400.png)
![[Diagram]](../../diagrams/28/68092f0b9bd8350102f5b2007f411e26.png)
![[Diagram]](../../diagrams/23/aa448d06aa11d717eba2c1c7023c8927.png)
![[Diagram]](../../diagrams/5/6d8f840016dfc49dc75b8fd45df2570a.png)
![[Diagram]](../../diagrams/39/5c18f61116d7030747951ef07ab1f2e1.png)
![[Diagram]](../../diagrams/31/cd204414e532727c091bb053a8d7d199.png)
![[Diagram]](../../diagrams/2/3ea3cfa68adedeb45bd0005f126c3041.png)
![[Diagram]](../../diagrams/2/2ef6b223394a2872e925bdde49bc3841.png)
![[Diagram]](../../diagrams/48/acd8e1f4552456c082531d7a69130a8f.png)
![[Diagram]](../../diagrams/13/121dc20ff346e95c57ac98150fd647b6.png)
![[Diagram]](../../diagrams/31/56ce7fad6f11665313d85c491220d759.png)
![[Diagram]](../../diagrams/39/e0caabd98adb40713a1f668cdb67a89f.png)
![[Diagram]](../../diagrams/16/97db7c581fe3b60d6095656ae05a24ae.png)
![[Diagram]](../../diagrams/6/6841454344353b7dfd27cb751be88fd8.png)
![[Diagram]](../../diagrams/17/55dfac94883fe481401070468b8e32cb.png)
![[Diagram]](../../diagrams/31/7fa3665e387ba109a0f441eab3726543.png)
![[Diagram]](../../diagrams/34/1b3c40e3995d3ed8166871411c8610a8.png)
![[Diagram]](../../diagrams/46/aaf96a31f338401046b375c3deeea05a.png)
![[Diagram]](../../diagrams/22/deb044dce0e91410c92f627b03ba3953.png)
![[Diagram]](../../diagrams/33/443547e812c6fe498250ddd1c67351b2.png)


![[Diagram]](../../diagrams/30/af6b0ab7932cde6f676e84453f57d9c9.png)
![[Diagram]](../../diagrams/25/786c6ac9285a9549ecd1dbbcb160029e.png)
![[Diagram]](../../diagrams/13/382cb55c66fe03007d766491a99175d9.png)
![[Diagram]](../../diagrams/4/a709ee36af63da63efbbff37c015df9e.png)
![[Diagram]](../../diagrams/12/61fa849f350f746023c1d5dae5d506ce.png)
![[Diagram]](../../diagrams/28/c237f02703fa161eda9ade88280a6def.png)
![[Diagram]](../../diagrams/5/a1c2f21631fcdfd103853af4a14d94da.png)
![[Diagram]](../../diagrams/42/04ff031b9d1def4da2fadee0514fde14.png)
![[Diagram]](../../diagrams/31/32cce6629dc3f852ec32645201a96203.png)
![[Diagram]](../../diagrams/1/cd1c1c666b5585316a0b8d0f11713f57.png)
![[Diagram]](../../diagrams/26/5894ce174f8a52967a5afc1ef9a9b0a1.png)
![[Diagram]](../../diagrams/43/d0c6ae792ac147b94a9b18704b701211.png)
![[Diagram]](../../diagrams/13/2fcc645ac2d33c46d2f93d40a8bb7665.png)
![[Diagram]](../../diagrams/7/3a3f25a7ea5ec2be0b8e728c908e9a31.png)
![[Diagram]](../../diagrams/29/50e575f36bfa147b5f13dacf696e26bf.png)
![[Diagram]](../../diagrams/41/5a4ed20ebc26d1553991695c52058caa.png)
![[Diagram]](../../diagrams/2/01afa0ceaae3844b45df2ef1a05a187b.png)
![[Diagram]](../../diagrams/26/e16c1c29e81a581cd075b40ac9dbb216.png)
![[Diagram]](../../diagrams/6/16063f2bd7a7c1d56a9476fa7e44d18b.png)
![[Diagram]](../../diagrams/15/208dec073e34f305369069f573d7992e.png)
![[Diagram]](../../diagrams/18/10453048779356952e18ce5a8a9f3e3e.png)
![[Diagram]](../../diagrams/23/04a13072eb31700b6a1f2df25d3fb5ad.png)
![[Diagram]](../../diagrams/8/aea5e78040e1bb9126e4291988b7937a.png)
![[Diagram]](../../diagrams/16/dc7ff8fc15a4e14b3c7d23db881a5a31.png)
![[Diagram]](../../diagrams/14/7c06cea25d6399c9ccf9ad50560e8fd0.png)
![[Diagram]](../../diagrams/33/eceeaa6a83be70892c94e40d582d2e23.png)
![[Diagram]](../../diagrams/15/9e497a72b43aae4fd0917317abf12d69.png)
![[Diagram]](../../diagrams/48/8fa54778092a50719f70f8bdf3c27497.png)
![[Diagram]](../../diagrams/3/731fb560799c1c592b33d30753687770.png)
![[Diagram]](../../diagrams/0/53e623977cbfcf9a19f174ef60cf15e0.png)
![[Diagram]](../../diagrams/35/b0730cbedd156c4139744955a15f475f.png)
![[Diagram]](../../diagrams/20/e0df4315ddcb9ec1202676f4c860dafa.png)
![[Diagram]](../../diagrams/48/f8903fe613cd886b79fbc8bde3e17206.png)
![[Diagram]](../../diagrams/42/418ff037d9911c659f7a7bc7fc38a214.png)
![[Diagram]](../../diagrams/35/6335592082e9c005e2e73e36549ee1a5.png)
![[Diagram]](../../diagrams/18/2103a148da5f22a6065621320a33739c.png)
![[Diagram]](../../diagrams/52/9133b806f98c496789329b1c7cdaa8fa.png)
![[Diagram]](../../diagrams/13/59815845e2f6ef874df1fde3cb148f5f.png)
![[Diagram]](../../diagrams/29/af2e29026b927fab595865ac43bc2f7a.png)
![[Diagram]](../../diagrams/28/e31ae9602e0c286303978cddf610db5e.png)
![[Diagram]](../../diagrams/5/af58d8851570beff81c3063e5035d2ef.png)
![[Diagram]](../../diagrams/6/a1db0e03550fa7574c3e7e0489ec5828.png)
![[Diagram]](../../diagrams/41/3e9161c807b2af4e32cd376940659967.png)
![[Diagram]](../../diagrams/0/cc941f666b99d7c3e8b5e93ba6a7ea1e.png)
![[Diagram]](../../diagrams/50/adef5cc30d66b306c800bfe2e362fd22.png)
![[Diagram]](../../diagrams/45/611ab19d5881793b6c1bf1b23dae52df.png)
![[Diagram]](../../diagrams/50/092c6b162dd0dde131c7dd0ded4bd0bd.png)
![[Diagram]](../../diagrams/40/ea7c4c399683da9b0e8cf14174758cc6.png)
![[Diagram]](../../diagrams/4/4410725b897f90f8a13fa30d3862f457.png)
![[Diagram]](../../diagrams/10/3eb4f61d3ba9893a8a3542afdfa979b2.png)
![[Diagram]](../../diagrams/32/35f89e0d1091dcd94084146a709a61ec.png)
![[Diagram]](../../diagrams/0/18b834e62c3c9e6c1513993b071547e5.png)
![[Diagram]](../../diagrams/15/749f820618d18beaa49f528348cb83ee.png)
![[Diagram]](../../diagrams/9/bbac077425e36ef6e093f7fe2f738686.png)
![[Diagram]](../../diagrams/31/cb753a7a8b18e3fa8de754b06f63ece5.png)
![[Diagram]](../../diagrams/48/70904132e678e232b222c9d9053b44b5.png)
![[Diagram]](../../diagrams/26/40f26c220583234f6d202a913aeea0bb.png)
![[Diagram]](../../diagrams/5/77fa87c5a298daa2fe72ac98b77277fb.png)
![[Diagram]](../../diagrams/6/fe8a6656cb5062d0e61f062d3739ca09.png)
![[Diagram]](../../diagrams/48/4c0e7b8c1cb6324c0b199ceddb5b295c.png)
![[Diagram]](../../diagrams/25/e5a697e76b5fe00a0d144e03b96a8b71.png)
![[Diagram]](../../diagrams/44/33238475d1a4daa8e55158f9fc4fcd57.png)
![[Diagram]](../../diagrams/51/8358a8b7805e11569ad35f5346ccfbf9.png)
![[Diagram]](../../diagrams/20/6a07ef474e0ac18861d6539065485a9e.png)
![[Diagram]](../../diagrams/16/8bfc262aa51b3981432f105475b7af49.png)
![[Diagram]](../../diagrams/27/7d83b377041e2b6f519e1ffd7834aa75.png)
![[Diagram]](../../diagrams/22/8621d741964ccfc8ac10ccf9d2ce98d8.png)
![[Diagram]](../../diagrams/50/200ed1ca208b84aad909c631b25fd3ba.png)
![[Diagram]](../../diagrams/52/154dcb046da968d8750378ca8c802cdf.png)
![[Diagram]](../../diagrams/37/d914708c816a0ff782777ae404eeac85.png)
![[Diagram]](../../diagrams/1/358cb6c00d5411f2facd2b3f31244637.png)
![[Diagram]](../../diagrams/28/fb4b0508044c0534a55489df5ec9a42d.png)
![[Diagram]](../../diagrams/28/3e715995e9ea99bbdb133fc88eef96a5.png)
![[Diagram]](../../diagrams/10/b3e3fe39df93a000b0ebfe608cbade38.png)
![[Diagram]](../../diagrams/19/49bf5afea55a41c23f2a5f7bfafacca5.png)
![[Diagram]](../../diagrams/38/565c5871406b8679016a2a36c6b92ab7.png)
![[Diagram]](../../diagrams/47/bfb934cf6752443140214c00c4f595cd.png)
![[Diagram]](../../diagrams/1/a75141ea1bc09a6d807c4214fe8a66a4.png)
![[Diagram]](../../diagrams/32/5941ccea4f8dc86d441bb61bc08cca31.png)
![[Diagram]](../../diagrams/50/3cde2e18cc736fdd09b968f8d7aa0c6a.png)
![[Diagram]](../../diagrams/0/08f6c05a90bea9d55d0ddf43ed917ebf.png)
![[Diagram]](../../diagrams/4/b1109648a554b5b14374102e45bface5.png)
![[Diagram]](../../diagrams/39/43cad5238d4b04b8c00420ef50e86f91.png)
![[Diagram]](../../diagrams/27/fecffc9f6813fd4dfc398d35713a3153.png)
![[Diagram]](../../diagrams/32/d41fa717b6bb7bae06ba9a6b8d7deee8.png)
![[Diagram]](../../diagrams/27/5deabec2d1a964862a78ea101208044f.png)
![[Diagram]](../../diagrams/31/47eed93a432b8903dae84c57f6b442ab.png)
![[Diagram]](../../diagrams/47/227f6b56bdda786346d31360e1c6c4a4.png)
![[Diagram]](../../diagrams/14/cc0bfd4891a2a14decfc0600da1edbfd.png)
![[Diagram]](../../diagrams/23/c465b03240e4185d7a13b97d74bbac19.png)
![[Diagram]](../../diagrams/22/8a6233c25cbf26744f3fc07d9012e25c.png)
![[Diagram]](../../diagrams/40/1773d73cd5d1d1443ad87ea060b4d13f.png)
![[Diagram]](../../diagrams/30/da57d1e90222f4c8682af90a53df2e16.png)
![[Diagram]](../../diagrams/17/d42ea3c0f2c5b743a41a32997cffe1f7.png)
![[Diagram]](../../diagrams/23/b0aa736fd925a179d1dfffb7b3b3a4fd.png)
![[Diagram]](../../diagrams/17/22c994b5a7d920e932ba583620b8fc04.png)
![[Diagram]](../../diagrams/47/5cdfd0c570d90a595a306171e6a0595c.png)
![[Diagram]](../../diagrams/13/caf1cb5f899c0640a1f368a2e94b9ff3.png)
![[Diagram]](../../diagrams/20/9ea46093a9b03ef1da7edc6978359695.png)
![[Diagram]](../../diagrams/48/ec0c7a62196d403808912dcac7ee6100.png)
![[Diagram]](../../diagrams/37/521e957628969835c3b24803125968cb.png)
![[Diagram]](../../diagrams/4/05364a93ca37784686dc6c7c5294d86d.png)
![[Diagram]](../../diagrams/30/ed91a55b105107a2b3b54ec35256852b.png)
![[Diagram]](../../diagrams/5/640459b52282b30c69e246f4d0e11468.png)
![[Diagram]](../../diagrams/12/d63a19898577621636791e5b972d8f80.png)
![[Diagram]](../../diagrams/42/b22f1bffed8efbe2b3f3270ffcd28508.png)
![[Diagram]](../../diagrams/1/8f022bf0b8436480cb4ba1cb08beac65.png)
![[Diagram]](../../diagrams/25/cf1c4826139ab0141808f8e1a7fde576.png)
![[Diagram]](../../diagrams/0/5b40a4d729dea48ba3570f309915c128.png)
![[Diagram]](../../diagrams/9/2b11fd8ae3384b2e6f79115b24a734fb.png)
![[Diagram]](../../diagrams/2/464485152ccf03ae076698d2bc093735.png)
![[Diagram]](../../diagrams/35/b058b702044c29faa1b0f4bd74c69711.png)
![[Diagram]](../../diagrams/30/cff147d579b18f3c1cfccaf5e224a4d0.png)
![[Diagram]](../../diagrams/24/d19fb887b0877ae67ab5d119187a335a.png)
![[Diagram]](../../diagrams/49/651caf4edefbb73a9703d03167ea80b8.png)
![[Diagram]](../../diagrams/33/c5da17f527cbba2961608b0a09f29388.png)
![[Diagram]](../../diagrams/50/ee0b0b4ddf1cb96c19e95c28c2027ea5.png)
![[Diagram]](../../diagrams/8/e357c383c45a4324c638473bfe3f0288.png)
![[Diagram]](../../diagrams/25/74c857b1378b2b27dbb90e7aff29e028.png)
![[Diagram]](../../diagrams/33/2d871d48e1677c11305e2294fd63dfb1.png)
![[Diagram]](../../diagrams/23/bd75c63e2f7e3d7810e3bbe1063afece.png)
![[Diagram]](../../diagrams/0/de98a1af97233dd6a4fc3b8ea2a54f70.png)
![[Diagram]](../../diagrams/51/76ef3a4bf166d535e41b9551a525ee91.png)
![[Diagram]](../../diagrams/35/1e1e6713971a63bfe01e6360ed56611d.png)
![[Diagram]](../../diagrams/18/b93a2e42f95f66e4cfeb4d7ccaf32fd8.png)
![[Diagram]](../../diagrams/14/a324f5dddcf355e2f660d29fae7cf136.png)
![[Diagram]](../../diagrams/45/f738ebf2bcd39d0947821b32ca493467.png)
![[Diagram]](../../diagrams/51/624cadd1102b3c59235416a365ebf3e6.png)
![[Diagram]](../../diagrams/2/d7d7e04c7f6301e3e6e806dface5a2e5.png)
![[Diagram]](../../diagrams/36/79d8055fc7da9da83eb15628ce8cf583.png)
![[Diagram]](../../diagrams/29/fa8cc90a390cc7164fecf206037fcd2a.png)
![[Diagram]](../../diagrams/46/60eec34e22c824a0404ce132234ea53a.png)
![[Diagram]](../../diagrams/23/502d4b17d5b708642beec0cb382d6d5a.png)
![[Diagram]](../../diagrams/38/e84370143c5479a0d254ae023a0cc9d0.png)
![[Diagram]](../../diagrams/44/00e8ed71a67dd9751badf61f41c499f3.png)
![[Diagram]](../../diagrams/15/70b66da4beb6bf689876c5b4d1361d94.png)
![[Diagram]](../../diagrams/39/23f380d3368674d460b7a7a8f1ad323b.png)
![[Diagram]](../../diagrams/0/a1fc1724001eed3b52f12c8c9a5d2323.png)


![[ext]](http://www.fmtusa.com/Milo234/go/061229.gif) http://www.fmtusa.com/Milo234/go/061229.gif
http://www.fmtusa.com/Milo234/go/061229.gif![[ext]](http://www.fmtusa.com/Milo234/go/106230.jpg) http://www.fmtusa.com/Milo234/go/106230.jpg
http://www.fmtusa.com/Milo234/go/106230.jpg![[ext]](http://www.fmtusa.com/Milo234/go/061231.jpg) http://www.fmtusa.com/Milo234/go/061231.jpg
http://www.fmtusa.com/Milo234/go/061231.jpg![[ext]](http://www.fmtusa.com/Milo234/go/070101.jpg) http://www.fmtusa.com/Milo234/go/070101.jpg
http://www.fmtusa.com/Milo234/go/070101.jpg![[ext]](http://www.fmtusa.com/Milo234/go/070102.jpg) http://www.fmtusa.com/Milo234/go/070102.jpg
http://www.fmtusa.com/Milo234/go/070102.jpg![[ext]](http://www.fmtusa.com/Milo234/go/070103.jpg) http://www.fmtusa.com/Milo234/go/070103.jpg
http://www.fmtusa.com/Milo234/go/070103.jpg![[ext]](http://www.fmtusa.com/Milo234/go/010407.jpg) http://www.fmtusa.com/Milo234/go/010407.jpg
http://www.fmtusa.com/Milo234/go/010407.jpg![[ext]](http://www.fmtusa.com/Milo234/go/010507.jpg) http://www.fmtusa.com/Milo234/go/010507.jpg
http://www.fmtusa.com/Milo234/go/010507.jpg![[ext]](http://www.fmtusa.com/Milo234/go/010607.gif) http://www.fmtusa.com/Milo234/go/010607.gif
http://www.fmtusa.com/Milo234/go/010607.gif![[ext]](http://www.fmtusa.com/Milo234/go/010707.jpg) http://www.fmtusa.com/Milo234/go/010707.jpg
http://www.fmtusa.com/Milo234/go/010707.jpg![[ext]](http://www.fmtusa.com/Milo234/go/010807.jpg) http://www.fmtusa.com/Milo234/go/010807.jpg
http://www.fmtusa.com/Milo234/go/010807.jpg![[ext]](http://www.fmtusa.com/Milo234/go/010907.jpg) http://www.fmtusa.com/Milo234/go/010907.jpg
http://www.fmtusa.com/Milo234/go/010907.jpg![[ext]](http://www.fmtusa.com/Milo234/go/011107.jpg) http://www.fmtusa.com/Milo234/go/011107.jpg
http://www.fmtusa.com/Milo234/go/011107.jpg![[Diagram]](../../diagrams/9/26f51ad645023441aaf79b2cb27433f3.png)
![[Diagram]](../../diagrams/34/10ef841f72d98877235ef1c4f46e8c0e.png)
![[Diagram]](../../diagrams/35/2051c5d2d4d9b38b6e2de554e1677ec3.png)
![[Diagram]](../../diagrams/3/4c4f54ef52cb8fec8a815f5f333de888.png)
![[Diagram]](../../diagrams/27/d7c67d2d40e143033985d0e1723ada57.png)
![[Diagram]](../../diagrams/3/32707c7913e02924b18fe6612f7d2cec.png)
![[Diagram]](../../diagrams/34/ffc0685024bf9028087b9bcd19c49914.png)
![[Diagram]](../../diagrams/47/fc353b8c5b254065c6003a3bf74fcdc1.png)
![[Diagram]](../../diagrams/9/d39635a2cf16cba29441e87707e1b4b8.png)
![[Diagram]](../../diagrams/16/9e73dc996dd2a0d34108a04627d78d74.png)
![[Diagram]](../../diagrams/3/6ace7c249e00cfd6bdff94f74f1a323d.png)
![[Diagram]](../../diagrams/12/8b2c91e06b21da0be433dc2161a4b799.png)
![[Diagram]](../../diagrams/35/6b8a349d3afa5804a446c03c69dae242.png)
![[Diagram]](../../diagrams/17/d1c2b241b5252b3badb0d4adbe17bf3f.png)
![[Diagram]](../../diagrams/3/2327b8b70b8c87fafd19bf4fc77c19e2.png)
![[Diagram]](../../diagrams/17/c0f62ef462fab77fc9307292f92fecf1.png)
![[Diagram]](../../diagrams/44/1d6724627bfc4ed34a3988e794328961.png)
![[Diagram]](../../diagrams/28/106cc28b02cced569e2c32aad11cfec7.png)
![[Diagram]](../../diagrams/21/ef013da360a8a3400c9772b0eefe4833.png)
![[Diagram]](../../diagrams/21/3061f2b1e5493ae1c2162d5ad6d31142.png)
![[Diagram]](../../diagrams/14/f73480d379004dbc11117156d6722bed.png)
![[Diagram]](../../diagrams/4/e6a93b2b69ff4d15946a6590f066a704.png)
![[Diagram]](../../diagrams/2/65db05c1d436cb6c5d5129a6259fc956.png)
![[Diagram]](../../diagrams/8/a80bef63dcf86cf1e009993097fa2181.png)
![[Diagram]](../../diagrams/35/0f6be2e01f23dca1fa9b1639b6c5af72.png)
![[Diagram]](../../diagrams/21/d593dda69e52647e0312807e49415961.png)
![[Diagram]](../../diagrams/1/42f5fffd83aab502014206623dad7272.png)
![[Diagram]](../../diagrams/52/b169eb367899a2f5aa648ac7217ae139.png)
![[Diagram]](../../diagrams/28/4ea375f29ef78cd2681de260bfc6df22.png)
![[Diagram]](../../diagrams/36/5c6cf54fd9f7abb2dec02358f22bb7a2.png)
![[Diagram]](../../diagrams/8/b848f07dcbda12e7a3bdead9743aa63e.png)
![[Diagram]](../../diagrams/10/bded09ae30b5b881837c87d641a311f7.png)
![[Diagram]](../../diagrams/44/13c17392d5057db4290e3b34b6c2124a.png)
![[Diagram]](../../diagrams/31/89fc3ef1f83a9aebe4fa92f95bb47a76.png)
![[Diagram]](../../diagrams/26/908bab2d73ea12a3a898e583d7f432af.png)
![[Diagram]](../../diagrams/20/71b25d0dd31bbf4dbe861635b5ba90c5.png)
![[Diagram]](../../diagrams/10/5596c9e0bd20f3319ee0afcbb9f55e4b.png)
![[Diagram]](../../diagrams/17/8f6fd58ea760c7cbe27e9ab92c4fa6fe.png)
![[Diagram]](../../diagrams/16/16b20048d54854812d25b98dc5afae69.png)
![[Diagram]](../../diagrams/16/7cd7900e6098d79bc7060eb65a427eb0.png)
![[Diagram]](../../diagrams/13/d81a3742b25372c24e6edfea3ba81d66.png)
![[Diagram]](../../diagrams/12/df62eafa154c4704b501b53eac1f0bb5.png)
![[Diagram]](../../diagrams/19/0523f4576b07df221dfd8b3ef8452f3b.png)
![[Diagram]](../../diagrams/17/3fb68c003ef514029b2b6f4a4897fe5f.png)
![[Diagram]](../../diagrams/24/233e0a447b0167a4a89361474b7fa4a8.png)
![[Diagram]](../../diagrams/43/ba0e98411016e280e1f509d4243ae419.png)
![[Diagram]](../../diagrams/42/e5967018f184a6d43cfa5c19eaeaf7d6.png)
![[Diagram]](../../diagrams/5/af48d1c546b67006d5dea9f71dbcf640.png)
![[Diagram]](../../diagrams/10/1b90ad8b6ebd224e2bb83947f461bcfd.png)
![[Diagram]](../../diagrams/31/f65c9d3d7ae9d56afc7abee8f7d3a376.png)
![[Diagram]](../../diagrams/47/ecaa27e3f07ddde8b32a6893217501de.png)
![[Diagram]](../../diagrams/7/490d2bbe83e20c1f3f70557b1909ca8c.png)
![[Diagram]](../../diagrams/37/3193b62516a21d618a64871a83180d5c.png)
![[Diagram]](../../diagrams/3/d31fa6af426ab056f7dbcf59e82630cb.png)
![[Diagram]](../../diagrams/25/8403fa8fb72c74860798068650eeed9c.png)
![[Diagram]](../../diagrams/49/f240d1f10202736fa794d1d28d4591fa.png)
![[Diagram]](../../diagrams/1/9d452a3974e0f002c2f28a5635128db9.png)
![[Diagram]](../../diagrams/13/d7c042b677f8d6cceb5bb24eea2c89d0.png)
![[Diagram]](../../diagrams/28/4a4bdbb069c24c4bfc0cf3310079b094.png)
![[Diagram]](../../diagrams/15/1749622581b2c106407fdab4cc8fa36d.png)
![[Diagram]](../../diagrams/32/7867d55e336c4be2d1a3d9f6c2f2db96.png)
![[Diagram]](../../diagrams/5/cd824b13062dd7353ca44f6fd4a4b5fc.png)
![[Diagram]](../../diagrams/18/52f56ee4dd10705d1fe1b81ab5d35d27.png)
![[Diagram]](../../diagrams/17/74b28c3f3658ec0ea3e9fcaf10eaecd4.png)
![[Diagram]](../../diagrams/16/b969dd6ef28af5a986310787b8df06c6.png)
![[Diagram]](../../diagrams/39/ebf4463c4eb88b5b985ce9829fb2bea9.png)
![[Diagram]](../../diagrams/8/57733c85243146285457bc14a2fa05a4.png)
![[Diagram]](../../diagrams/48/3b7e503cc19fb72ac809b69df7bad356.png)
![[Diagram]](../../diagrams/48/f10432551b0fc85ed4fcbdf3e93a76ac.png)
![[Diagram]](../../diagrams/25/43b60f049e8dc8ec052fcaf2a1f7c216.png)
![[Diagram]](../../diagrams/37/a24a379ef6282b87a27da8f7315b3482.png)
![[Diagram]](../../diagrams/46/dda86544db9e121ea991b781fea621e2.png)
![[Diagram]](../../diagrams/14/029d576c054cce9b3787b87356822bda.png)
![[Diagram]](../../diagrams/44/67e98ff9677b8bc7ddc5b357f5ab519f.png)
![[Diagram]](../../diagrams/21/6bcfbb45e77c840aa9db8ec08f5edf5f.png)
![[Diagram]](../../diagrams/7/e8a3c7e3a7dee017191df37cd0b2a843.png)
![[Diagram]](../../diagrams/48/33af07b6c186605243f1b387fd86cac8.png)
![[Diagram]](../../diagrams/14/033dbc47256fa48682d7a2a9f30bced5.png)
![[Diagram]](../../diagrams/17/62d4911ccd3fdae7dab8f1dd9728e678.png)
![[Diagram]](../../diagrams/41/8605858c71a1afae93d25cb2012c89dd.png)
![[Diagram]](../../diagrams/27/dbaac69f026e707ad387526da2cc9436.png)
![[Diagram]](../../diagrams/51/6909597216b87cb5afe3e32eb3761d3e.png)
![[Diagram]](../../diagrams/23/b553e106c6c8121626c75439e8d31131.png)
![[Diagram]](../../diagrams/29/7448fa18a5e9e40a64233db98ae4f50c.png)
![[Diagram]](../../diagrams/20/f891cd5be561614b5363565856cd2025.png)
![[Diagram]](../../diagrams/20/9e3b5f5e50153f0d18200199b880cf79.png)
![[Diagram]](../../diagrams/39/04affbd425fbcebfee52187741d77bc2.png)
![[Diagram]](../../diagrams/42/12ee9ff72b532a5aeec477bda1ceaa80.png)
![[Diagram]](../../diagrams/0/81d507e057bab4cdb0bb022c569f98cc.png)
![[Diagram]](../../diagrams/15/8b77c1ad26460438209c3ef0c705714f.png)
![[Diagram]](../../diagrams/38/50bda2890462deba425ed04c1c72c09b.png)
![[Diagram]](../../diagrams/49/8c0ed6888299621f3bfe63dfde21afdd.png)
![[Diagram]](../../diagrams/26/e43672e6575824ffba99a6a73e959682.png)
![[Diagram]](../../diagrams/49/c1374970bc37ab8ecc16405940ce6091.png)
![[Diagram]](../../diagrams/27/553b9b4b0e40dff5b47832e5fa5a99eb.png)
![[Diagram]](../../diagrams/24/cf7020196065936c9f6f56c0bfb51961.png)

![[Diagram]](../../diagrams/48/861d5b6e4547ac1d15ee9530546e0381.png)
![[Diagram]](../../diagrams/17/e3f545c1983f5b0741e66240981b8a46.png)
![[Diagram]](../../diagrams/4/23439221fe6ab1658bccb3ff7e9a0e0b.png)
![[Diagram]](../../diagrams/22/2e2c5d57d8d09e5f1183d0d5296c5ffe.png)
![[Diagram]](../../diagrams/11/57bdb0fe934ee505cba7196599eb5457.png)
![[Diagram]](../../diagrams/10/ee148478499e876a9a8f5630df9b307b.png)
![[Diagram]](../../diagrams/29/b5c7871bf506cbd440d2f1ba18b83165.png)
![[Diagram]](../../diagrams/22/352e51486d216d519e496ac965b242df.png)
![[Diagram]](../../diagrams/27/410ad1df7ece0a2d4bbbe7114b726de0.png)
![[Diagram]](../../diagrams/37/03ed06532001f57b2a7cdf8b4c1901ee.png)
![[Diagram]](../../diagrams/42/36d159621c69f95a7f9d80e073795b96.png)
![[Diagram]](../../diagrams/31/24ef695df8589a23fa2aa4b237ebced4.png)
![[Diagram]](../../diagrams/17/c8ebfe321b68a261ba4ee4a23d682230.png)
![[Diagram]](../../diagrams/13/414e736bff2a726776f5eb41d41b3dd3.png)
![[Diagram]](../../diagrams/20/b622a978758fb66b617872305e459138.png)
![[Diagram]](../../diagrams/39/c84c0760aae15f37b41c54a86a1b7783.png)
![[Diagram]](../../diagrams/38/6f4b542a2dd54fb180566854b9fe5cb4.png)
![[Diagram]](../../diagrams/46/8acfb14fdc21abda33a850ff3147e28a.png)
![[Diagram]](../../diagrams/39/6d8074911776c075046781dd38376138.png)
![[Diagram]](../../diagrams/17/7a7542b8c9f10ac0607bf7c318e3c4b6.png)
![[Diagram]](../../diagrams/42/0470a4f01e68f0aa2a71a7cf5add4549.png)
![[Diagram]](../../diagrams/5/74508feb793260d84402609abfa48584.png)
![[Diagram]](../../diagrams/33/f340c44c7ab8e2a732a27e526e07b121.png)
![[Diagram]](../../diagrams/46/f33bf6262f3f0cb79ce0bdb6ee1c664f.png)
![[Diagram]](../../diagrams/43/08d8280fa68c1acbe5e696ef9260934a.png)
![[Diagram]](../../diagrams/27/848581eac639b4b3cf11b600fe6bea92.png)
![[Diagram]](../../diagrams/45/146b75ee92f1e1737da4e9e21679d9b6.png)
![[Diagram]](../../diagrams/32/402e7bc0e3f96513f0004ea4a068af85.png)
![[Diagram]](../../diagrams/25/2ae019fa9527dd88063c0ff28101d979.png)
![[Diagram]](../../diagrams/3/09835d2193cbef7798a88f47680ad22b.png)
![[Diagram]](../../diagrams/16/50f2214e368ad3316480f6667fdb7118.png)
![[Diagram]](../../diagrams/52/e002b9e3baae7482702e0340ed50ee61.png)
![[Diagram]](../../diagrams/14/d3f69b620a410230ea3eb3e46c07ba90.png)
![[Diagram]](../../diagrams/13/9fd617fb53225e0d360352b5a18b72ae.png)
![[Diagram]](../../diagrams/34/efdc298f5660b2a6373cfc1515894b78.png)
![[Diagram]](../../diagrams/37/5d4866151b5885d8c10a40c592e7439a.png)
![[Diagram]](../../diagrams/29/3b08b26f111550fd73f886f50eda9c5d.png)
![[Diagram]](../../diagrams/48/83f3b1cd12f2cfb59263f5aa1974e039.png)
![[Diagram]](../../diagrams/10/b84193755ad3128a3271b10cbdf78ef8.png)
![[Diagram]](../../diagrams/19/8b90b319c82b1ad0498e773bc2ff069f.png)
![[Diagram]](../../diagrams/27/35c6ff860f3f79926e7cd3319c9c15be.png)
![[Diagram]](../../diagrams/30/f0583d1599e8d7b992716a9fa04c8ac4.png)
![[Diagram]](../../diagrams/34/0dc57f4152fd674181a92ea419ac7429.png)
![[Diagram]](../../diagrams/30/6b1b2ca0e154e8752be3dd249051f328.png)
![[Diagram]](../../diagrams/5/40cfc292cbe8efc6d7462a6aa8ee3f3e.png)
![[Diagram]](../../diagrams/0/12d23d5605785a852454a4c0b34cfd04.png)
![[Diagram]](../../diagrams/17/373fa883f24986e959c255b01dce99f4.png)
![[Diagram]](../../diagrams/46/73c8cdec5f83b086dff6e78c7a4e5661.png)
![[Diagram]](../../diagrams/31/cc767441368262846b4791ddc788cec8.png)
![[Diagram]](../../diagrams/18/38dbe5bbba032aed02e7f394eb589ece.png)
![[Diagram]](../../diagrams/34/0f288436130804e9d21bdac20e56d834.png)
![[Diagram]](../../diagrams/11/d8a730d0440689a01d0262248e5bd859.png)
![[Diagram]](../../diagrams/45/c05bb16a29a5c3dc6d5a468443329bf9.png)
![[Diagram]](../../diagrams/7/32ce4ff1f397ef6ab990875c4c575a12.png)
![[Diagram]](../../diagrams/46/a569d6eb9310d4357dc59e39bf0c1c56.png)
![[Diagram]](../../diagrams/10/732a6ef20603b2826304a0aab08ae1fa.png)
![[Diagram]](../../diagrams/0/00adb5b3a6468b00f90236a5e9f6588f.png)
![[Diagram]](../../diagrams/32/129f4d2e9ca569798f5108df37880a73.png)
![[Diagram]](../../diagrams/16/cea8d6b9df883ef12073dac90d20f49f.png)
![[Diagram]](../../diagrams/9/c8b4ec425546a8ea6018077c10b01821.png)
![[Diagram]](../../diagrams/19/8bcb59a546d714fb39879d2d12e71aff.png)
![[Diagram]](../../diagrams/12/d115b343b0c95bb4612cb69efe70b0d1.png)
![[Diagram]](../../diagrams/27/532c3f453d7f31a0e4f986794c2e7354.png)
![[Diagram]](../../diagrams/38/5d2a671b16daf28ab2dd236200a9c03e.png)
![[Diagram]](../../diagrams/17/e1747ce20a978002c9ea1b6cb8cc0e8b.png)
![[Diagram]](../../diagrams/18/e832efe288bf7ac65b5f2b96e330e1df.png)
![[Diagram]](../../diagrams/51/3d33ebd6399e21112f8beb16b58b0b17.png)
![[Diagram]](../../diagrams/36/d91ec0b3a815bff705288ffca2af7710.png)
![[Diagram]](../../diagrams/50/074139d3972c69c1e3a892397ca2b626.png)
![[Diagram]](../../diagrams/44/6dd94af5f5a45532ca6e97fb845a25e0.png)
![[Diagram]](../../diagrams/27/6bc26fd0f0a3168a508133af13a523e9.png)
![[Diagram]](../../diagrams/2/7c1d193623b0e1474155a6361bd0ec42.png)
![[Diagram]](../../diagrams/51/1e6b713133cd52ae2b768cfa696db768.png)
![[Diagram]](../../diagrams/29/62e55aea4c96d850ab729451aa142af8.png)
![[Diagram]](../../diagrams/15/e78080cb7058137a51f203c9d799ecd9.png)
![[Diagram]](../../diagrams/37/127d938185b39043fd204727d786dff9.png)
![[Diagram]](../../diagrams/18/94dea24546f1dd27403f1f0ba4dadfa0.png)
![[Diagram]](../../diagrams/24/b68b6c7571a276a966b554c3ac4d4d5c.png)
![[Diagram]](../../diagrams/18/ca63019ad73a5a4f0fae3fb5ba418ca6.png)
![[Diagram]](../../diagrams/20/3ac5b87479e813e2b32a46c30c427e4e.png)
![[Diagram]](../../diagrams/9/b9cfc976813a1de4640b172d29772abf.png)
![[Diagram]](../../diagrams/3/87c0dccb9901d6f949378f38349de2d0.png)
![[Diagram]](../../diagrams/24/152f22b43b82cd35ea7fdb1fc60b892a.png)
![[Diagram]](../../diagrams/47/9244059ed514cf2327153efc6f3e40f8.png)
![[Diagram]](../../diagrams/20/7df01ba416e046b265cd055ded379751.png)
![[Diagram]](../../diagrams/23/9e14541553e529f4c0e277d16204031b.png)
![[Diagram]](../../diagrams/36/3ba49ac1f56352818b8421e03a3a86a2.png)
![[Diagram]](../../diagrams/15/3f8b979b0a464e4836929cfca3f8a798.png)
![[Diagram]](../../diagrams/2/341354103bfecbe3351030a7ac8b65fb.png)
![[Diagram]](../../diagrams/7/ecd392beae6411a47b77297fd0437984.png)
![[Diagram]](../../diagrams/36/7e6a9849fa9dc3b1ecc07e9ab285ec3d.png)
![[Diagram]](../../diagrams/8/27824e93a6b8a35176d70f3c701ff828.png)
![[Diagram]](../../diagrams/2/e76e9b5857388be380517995b6eeffbd.png)
![[Diagram]](../../diagrams/52/e4913ebe2c2a7719aa50e456daa4427b.png)
![[Diagram]](../../diagrams/43/fecb847e7fa3ab36840500e28132b74c.png)
![[Diagram]](../../diagrams/47/36974c48a8310070f6bdd9247b0472a7.png)
![[Diagram]](../../diagrams/40/0d2f4ab56e1d6a3783f4ae306e5f63db.png)
![[Diagram]](../../diagrams/10/cf096de65b2b172f55f37d57198c4125.png)
![[Diagram]](../../diagrams/26/a32c87264375127147223d3ee6f207f8.png)
![[Diagram]](../../diagrams/50/1695fed43cb026fea260f229d9e9637c.png)
![[Diagram]](../../diagrams/10/8c1813ae0a3d03fb8dc9ea3338ef7c07.png)
![[Diagram]](../../diagrams/30/c5a8d901f4bf782c63194c4aea9d4263.png)
![[Diagram]](../../diagrams/41/6993a885c829637427f088424148da98.png)
![[Diagram]](../../diagrams/8/d64804bb13bc2193febf37dbfac65987.png)
![[Diagram]](../../diagrams/43/4ca429c952ad1a9b51a7aafbf37511ec.png)
![[Diagram]](../../diagrams/4/26828c7e3f8a60cce3d3a542b5f2cf81.png)
![[Diagram]](../../diagrams/52/c261b3c1f8b963ef6e1c9a30afbe1d7a.png)
![[Diagram]](../../diagrams/38/66ac468fddac19ed9219e9b84ba89a22.png)
![[Diagram]](../../diagrams/32/758e2848ece4311f6b80e43ffaa4715d.png)
![[Diagram]](../../diagrams/35/f3fd638eb5265a70a9bba5c5373840a8.png)
![[Diagram]](../../diagrams/33/f23478627dd9c0fd2bdb25a1c0ce12f3.png)
![[Diagram]](../../diagrams/49/3888968291cf64621d8edc7aaf2b577d.png)
![[Diagram]](../../diagrams/26/848b4c3f3982c12626c5e9538fd4c1dd.png)
![[Diagram]](../../diagrams/10/7032b90f2bb42dc8f25bfafb8f038459.png)
![[Diagram]](../../diagrams/39/3ee12df8e91ccc1a3cab8de478f7698c.png)
![[Diagram]](../../diagrams/24/f1cb4604c2347ae502f229ac6f40a747.png)
![[Diagram]](../../diagrams/16/26d79aea71f2b51c045fc034a0b9558f.png)
![[Diagram]](../../diagrams/36/c536bf4fd1a8a3861ff065de8295f3f2.png)
![[Diagram]](../../diagrams/13/e37c04b5aa0d4c665315e236f73e93a1.png)
![[Diagram]](../../diagrams/30/a669c7375154c065fa6b05e7f9ac661e.png)
![[Diagram]](../../diagrams/40/af86941705166792be6ac3be7cf93b98.png)
![[Diagram]](../../diagrams/50/367a8bad451c28621a9e580df15eff1e.png)
![[Diagram]](../../diagrams/26/9a940933950a254d766068310b7b71c2.png)
![[Diagram]](../../diagrams/28/034f058269b83e18fd20284d47b52859.png)
![[Diagram]](../../diagrams/5/4ab54fb796f2bb42c2ca9aaf3300f12b.png)
![[Diagram]](../../diagrams/9/283271aecd67ba6c561edc6e3bcc3b01.png)
![[Diagram]](../../diagrams/4/4ffc81a8310cd8d3e72be054208d765d.png)
![[Diagram]](../../diagrams/2/8831b5968a01f9a084717bafe0268c7b.png)
![[Diagram]](../../diagrams/17/3ac110c348fd16efa07ea27aef0faf1e.png)
![[Diagram]](../../diagrams/18/2eef66552e25bc2d5f7daca8d9206352.png)
![[Diagram]](../../diagrams/12/8f2f379628938362865e16038de711a7.png)
![[Diagram]](../../diagrams/19/4539d2386e7e7fa26629720cc1766b70.png)
![[Diagram]](../../diagrams/46/947e5a9c7b2e23859398e590b14bb286.png)
![[Diagram]](../../diagrams/32/2af51c98187a1093b520b79330725ab3.png)
![[Diagram]](../../diagrams/2/59606f933aaf03ecd6137bce00bc51dc.png)
![[Diagram]](../../diagrams/3/d5a1a9dc893dbcffd013d3a25833eacb.png)
![[Diagram]](../../diagrams/21/150e60cd8c7a5f319aef2dbf57c46100.png)
![[Diagram]](../../diagrams/23/a692ddf1979b8d7053c20933b2825352.png)
![[Diagram]](../../diagrams/39/b7156c4a7dc44b51b8fdcb66fb5bda1a.png)
![[Diagram]](../../diagrams/40/c515469a6874dc00887b644392b0b039.png)
![[Diagram]](../../diagrams/41/06717d09c5d48cc0af9e7ea84daa7f53.png)
![[Diagram]](../../diagrams/30/692fbc9f4325a1f0e4b01b3366a0c956.png)
![[Diagram]](../../diagrams/34/23967530d373bbc552697a95adc09ce2.png)
![[Diagram]](../../diagrams/44/14e40d1f35309b70bca991d6f6a49724.png)
![[Diagram]](../../diagrams/47/3bb5024ce95bcb5410dc6f61db4c575c.png)
![[Diagram]](../../diagrams/47/65734bbf2dab10d0537a26cfa28de65f.png)
![[Diagram]](../../diagrams/7/117ec71e6a71f6afc93c2daa76482454.png)
![[Diagram]](../../diagrams/31/8c9b026f2bcaf6bd9ccc6bb4c8609387.png)
![[Diagram]](../../diagrams/50/de41a5238ccc11526fa0171399c51816.png)
![[Diagram]](../../diagrams/3/5daead9d1de3a74313ea19b79f4d50ae.png)
![[Diagram]](../../diagrams/4/60c3f470d47d2aa3b5fbb8189544a3f1.png)
![[Diagram]](../../diagrams/27/46c62e35136b85c6c5f4a6822c324eb0.png)
![[Diagram]](../../diagrams/5/bc8de4725122cd207f67f57d4d9ced89.png)
![[Diagram]](../../diagrams/5/992eeb20dbca2c66e3bad77eae8acc98.png)
![[Diagram]](../../diagrams/23/2d1360ac748fb979bfa5e10302380878.png)
![[Diagram]](../../diagrams/50/225802ebeec2b83ab01ec5455553a0e4.png)
![[Diagram]](../../diagrams/6/9e0273b14de369e2f524b0e3a7872217.png)
![[Diagram]](../../diagrams/9/ca082e7e89f17f3d103965a99a7704b4.png)
![[Diagram]](../../diagrams/13/be406ae430d2e612f53e28d1df7022b8.png)
![[Diagram]](../../diagrams/24/d0fde94799e9b167857516f97cd4fa17.png)
![[Diagram]](../../diagrams/0/8ebc0bfe193c125177745b5ffd41504f.png)
![[Diagram]](../../diagrams/45/431fc7faf37acd9132ba3ef788af8bcf.png)
![[Diagram]](../../diagrams/4/d0f22466950e636112c32a027408a04a.png)
![[Diagram]](../../diagrams/41/d9461a8dfb8701523801bdcec684f6e5.png)
![[Diagram]](../../diagrams/12/dff449b8423cd235b7936aa553277b87.png)
![[Diagram]](../../diagrams/35/b800d9919d814120e4a9541864bd9056.png)
![[Diagram]](../../diagrams/33/fc4ede2ff5c3ae1f882704367744c9d1.png)
![[Diagram]](../../diagrams/43/4de341b82a1f0b76d92014e76ee19e7e.png)
![[Diagram]](../../diagrams/2/48ffbf167375f4ed442f9a1df6958c39.png)
![[Diagram]](../../diagrams/27/ee5207c39eff83f48431ff88b49576c7.png)
![[Diagram]](../../diagrams/20/eef34a23810edfd6395d9a5e15d93021.png)
![[Diagram]](../../diagrams/19/320e71c076ac86898ac1d9c2d0539d17.png)
![[Diagram]](../../diagrams/34/4e3ad3908e66f0d05016096d8a0b5515.png)
![[Diagram]](../../diagrams/15/288a2ddcfe89d42021d1d20af49611f7.png)
![[Diagram]](../../diagrams/34/7a0035bad1e82cf61c5d972d6de7dbb3.png)
![[Diagram]](../../diagrams/1/877d2ecc6ecb436f68d857b935375610.png)
![[Diagram]](../../diagrams/18/12669e6d6a9fb43acd7651c4c2f78030.png)
![[Diagram]](../../diagrams/6/27fe02b40804c73c12bea9772b72ad62.png)
![[Diagram]](../../diagrams/34/a6f1f56817a9fa1110d2f5d860bbe858.png)
![[Diagram]](../../diagrams/19/47db7ba894b861a43979028074ee071d.png)
 )
)
![[Diagram]](../../diagrams/16/502e9294c386d75e2116b93dffcd8a8b.png)
![[Diagram]](../../diagrams/3/a129e98fbded58f64a16e0613bc9bf63.png)
![[Diagram]](../../diagrams/35/4584af66fb2c67aec5f8e8a9c9215794.png)
![[Diagram]](../../diagrams/26/28b894516dd213ab6d20607e26d203d8.png)
![[Diagram]](../../diagrams/50/67dfee4d59354f39f632eaaf95fedf45.png)
![[Diagram]](../../diagrams/40/c44ba28fd1987c9b953815779a9b1f2f.png)
![[Diagram]](../../diagrams/8/90891fe0414ee53aa6ff597ada19547a.png)
![[Diagram]](../../diagrams/5/c21fe97b698d4797e0c380a9381dd091.png)
![[Diagram]](../../diagrams/13/c9a11fb5740a478c01b88c821ad88c67.png)
![[Diagram]](../../diagrams/20/fc9c9e41ff58e9bad9ee6a7e55e6c498.png)
![[Diagram]](../../diagrams/31/10384b70c085e0e835ba2a5295e592e6.png)

![[Diagram]](../../diagrams/26/82c23ec5d7d8c9ab5daa3bbcc992b730.png)
![[Diagram]](../../diagrams/5/60c8dd89b6fe0a7cf3c70a5ef9b351b9.png)
![[Diagram]](../../diagrams/50/4102898f0c20c09c0d1e48925afac82a.png)
![[Diagram]](../../diagrams/6/607eac9ac8dc2b34d7ea6131335fa8ea.png)
![[Diagram]](../../diagrams/19/914db92dabbababa147bdcb8544103e9.png)
![[Diagram]](../../diagrams/44/4c307989bb8a05b843d10bb5766c53a5.png)
![[Diagram]](../../diagrams/41/997fe1ee38489e09f7e3dd41b9d5f1d1.png)
![[Diagram]](../../diagrams/8/a8ea5177603a54121195c78428825c3a.png)
![[Diagram]](../../diagrams/19/6cc764d5038c4401218b56a9533b04b5.png)
![[Diagram]](../../diagrams/16/6e41b66a22e46770f0f2bfb47a87a783.png)
![[Diagram]](../../diagrams/52/63f02f18e78ebd046ddc59f458e2f4d6.png)
![[Diagram]](../../diagrams/40/de415f8b06f3bd1f0b231122bef2c9ed.png)
![[Diagram]](../../diagrams/48/d5395711fd01bf38132985496f920471.png)
![[Diagram]](../../diagrams/2/aef1fd28c40a890c82ac818cb2c4f501.png)
![[Diagram]](../../diagrams/10/66d138f3969eb801699d347a5db3dc23.png)
![[Diagram]](../../diagrams/28/e1971b4ffff5cfd11ba072d5fdcb50b3.png)
![[Diagram]](../../diagrams/31/06c6e652f576e9931c461ddb98cbaf93.png)
![[Diagram]](../../diagrams/31/5db88ea29030eea8a8d21d13b9a7b144.png)

![[Diagram]](../../diagrams/42/eca8ded7de17de71c69abdf09fe86957.png)
![[Diagram]](../../diagrams/21/ff845274af961b8dfe60eb91869b94ec.png)
![[Diagram]](../../diagrams/25/d4f37f68698263c2b9a732f36571329f.png)
![[Diagram]](../../diagrams/7/6f7b34c331049f824cf122b43d10098c.png)
![[Diagram]](../../diagrams/11/82a50ea2d355a1d5e388e8ae3bc7a963.png)
![[Diagram]](../../diagrams/44/4a556c4b79b7fe45e4ff7ef67f399e38.png)
![[Diagram]](../../diagrams/4/5044de61b99b07fc2e7ee31032ef4699.png)
![[Diagram]](../../diagrams/21/7bdf6bd487ad5722d49b2ee61d95f1d2.png)
![[Diagram]](../../diagrams/22/600c1af63fc72813204a24805b439810.png)
![[Diagram]](../../diagrams/13/c21d82c07129629383e3759fe9850b05.png)
![[Diagram]](../../diagrams/18/81acf0895f2bd55d336b505e91f61b5a.png)
![[Diagram]](../../diagrams/27/ed07c6ffb530183065ec25e3e2434f64.png)
![[Diagram]](../../diagrams/28/39cf810bc4da05177a6a639d1ff131b3.png)
![[Diagram]](../../diagrams/2/b7d2fe1dc7726077c5f06482e016ea0d.png)
![[Diagram]](../../diagrams/10/c097d43d1e1d7f4edde11a5c593efa53.png)
![[Diagram]](../../diagrams/7/20aedf88a59ac1456bcddeb05f3d366c.png)
![[Diagram]](../../diagrams/26/4771f4ae6ad210bc35b93403f40eb22c.png)
![[Diagram]](../../diagrams/3/07e023a02f7ce5cf487b16a5718438dd.png)
![[Diagram]](../../diagrams/42/e798d5a761f9ad178d5bb0f380686cc5.png)
![[Diagram]](../../diagrams/33/b0b4482480816c0ad061ff483c0bb62a.png)
![[Diagram]](../../diagrams/25/0c7d0a76008686d5e28f2a034fbb710e.png)
![[Diagram]](../../diagrams/9/038da14a72a59c45e54547509f03e58e.png)
![[Diagram]](../../diagrams/23/dac75a13a6b270ca07d23dc3b6fbaafd.png)
![[Diagram]](../../diagrams/41/c0acec27793945e5086bdee74af72e52.png)
![[Diagram]](../../diagrams/2/61ccc550d1e3003a7de76cbf4ac0b76d.png)
![[Diagram]](../../diagrams/36/d3ddea671b784d41d00d63da8e5d147b.png)
![[Diagram]](../../diagrams/2/897ab5c407bab68f95b0ce084aa70783.png)
![[Diagram]](../../diagrams/18/a257484e9c1b4f295303b2dfbcb55a90.png)
![[Diagram]](../../diagrams/23/49667c2e64313c6c98e523a7e0bf1ef4.png)
![[Diagram]](../../diagrams/35/654f351e03b1964b6e463b2831ab28d9.png)
![[Diagram]](../../diagrams/43/34d49406db33877631835e4ec99c7661.png)
![[Diagram]](../../diagrams/25/f322c1f0f69551a083c47d44af3db307.png)
![[Diagram]](../../diagrams/34/050e9c77c3a7ecb9cddd729e43586a38.png)
![[Diagram]](../../diagrams/36/dd34d0175947ea3968020a4680d1ae33.png)
![[Diagram]](../../diagrams/15/0d106e26378e3c3388df8da997401e03.png)
![[Diagram]](../../diagrams/43/88207afdc936ef593f65ea022e31aff8.png)
![[Diagram]](../../diagrams/5/9597e0c386ed5f9297c0793cbefb116f.png)
![[Diagram]](../../diagrams/44/e27e17840b8dc130474a2b29c3112e1b.png)
![[Diagram]](../../diagrams/32/43e261087d9d012c2594d1216ae94a57.png)
![[Diagram]](../../diagrams/17/aeb24e3f225e918cf5f71a478074d894.png)
![[Diagram]](../../diagrams/42/1c197c944e20de1a00ca0646ddf73e57.png)
![[Diagram]](../../diagrams/8/200e01fbfe9803ae5b0c8481fcb6637e.png)
![[Diagram]](../../diagrams/29/210a8cbfabc2036aa31073bc19c094bb.png)
![[Diagram]](../../diagrams/51/50fd6fea840882ed24a19655babdadbf.png)
![[Diagram]](../../diagrams/32/9ca861bf93e7343f1331d00ec826b470.png)
![[Diagram]](../../diagrams/1/2a09b70f2499e373648a980cc644bcff.png)
![[Diagram]](../../diagrams/23/9b488b9a51b8af298d331d0a59fe7be0.png)
![[Diagram]](../../diagrams/8/c71e9af552ceca42add4aa184e223102.png)
![[Diagram]](../../diagrams/31/3006d2be8a3b3de282cb94780276cbf3.png)
![[Diagram]](../../diagrams/42/85b42acaf1cb35babb0d96de2e88fb91.png)
![[Diagram]](../../diagrams/25/8f3179e960a8ba5956fdb373599d72ef.png)
![[Diagram]](../../diagrams/35/55db6e4482c8f4e8762efa87ba9574f1.png)

![[Diagram]](../../diagrams/35/8428742b380342235a04d014c1856da3.png)
![[Diagram]](../../diagrams/9/b92ea0e2d3acc000160db023a48f96a0.png)
![[Diagram]](../../diagrams/0/20155b352bf5c388dcdbbc4515d69eb9.png)
![[Diagram]](../../diagrams/25/972bc42b2f160a0b5dceb4a98ac84089.png)
![[Diagram]](../../diagrams/5/6a46ad991d8ba4e13defe959ddf1fef5.png)
![[Diagram]](../../diagrams/16/6df05a53db838aa850c7350151a5171e.png)
![[Diagram]](../../diagrams/31/f0cff045920f3d1fd4e75eea2ea93503.png)
![[Diagram]](../../diagrams/24/4ebb99803cf0628c18981c1c1d6164be.png)
![[Diagram]](../../diagrams/15/d0cf9f8415c7f0e90e142d74bc6a55bc.png)
![[Diagram]](../../diagrams/48/c89f0b490f929bdf54c086ef9133c209.png)
![[Diagram]](../../diagrams/12/46c855175352f91175dda081cfea15b0.png)
![[Diagram]](../../diagrams/42/67b07f22c12a8578a389380b6b34e24c.png)
![[Diagram]](../../diagrams/49/309f6cf8ba32e882ea0f5769025fea89.png)
![[Diagram]](../../diagrams/9/3e471686caf2aed5921dc546668761a5.png)
![[Diagram]](../../diagrams/22/9a16598abdf752ba1e938de7ca0ed697.png)
![[Diagram]](../../diagrams/29/20d9d4960f512ca6841d6f73b2b2db83.png)
![[Diagram]](../../diagrams/48/2ab84269c780f94f22629da8f2731805.png)
![[Diagram]](../../diagrams/19/fec8d9606d50bb5219899ae0025a9ee4.png)
![[Diagram]](../../diagrams/3/030881d7b0e8acd0b50ea82a453b1228.png)


![[Diagram]](../../diagrams/42/ee6fcaf7cbff798951439ddfcc5e147f.png)
![[Diagram]](../../diagrams/1/7f9ab62f16eeb7431f99caff810f4c5c.png)
![[Diagram]](../../diagrams/25/33c32773e17ee90fafdc9a22abbfc368.png)
![[Diagram]](../../diagrams/29/19ff543d048de6b60c94c6c0015bd609.png)
![[Diagram]](../../diagrams/47/aac0372b6cfe0e3adcc3b285d3fac854.png)
![[Diagram]](../../diagrams/25/8039f0e34d538d6318f2a9e5c1e6e600.png)
![[Diagram]](../../diagrams/8/ade4cfddea042954b43e70c3b0b5d3cc.png)
![[Diagram]](../../diagrams/16/c80ec83f4fd863b2790d11a7b60edd02.png)
![[Diagram]](../../diagrams/30/ee6c6b18e0268f3617d314e746413d7b.png)
![[Diagram]](../../diagrams/8/33da5d3f01ce2d7bc767d0d17b04539c.png)
![[Diagram]](../../diagrams/23/aa59ea411f099fb1649a0cf5264f06c5.png)


![[ext]](http://www.gokgs.com/servlet/graph/nem-en_US.png) http://www.gokgs.com/servlet/graph/nem-en_US.png
http://www.gokgs.com/servlet/graph/nem-en_US.png![[Diagram]](../../diagrams/39/72fb3b32129e674a492a622aaa9091fb.png)
![[Diagram]](../../diagrams/28/cb60c810a0d65d7572ab02101c79c12a.png)
![[Diagram]](../../diagrams/13/a7a1db3e96d6a84674d6b85300c5303c.png)
![[Diagram]](../../diagrams/32/4c19e9bbedc14192e48da1b53742242e.png)
![[Diagram]](../../diagrams/3/25153acf19c39f9073ad1425987c1af8.png)
![[Diagram]](../../diagrams/42/7a645ed628092ec651daadf4df1c7ea5.png)
![[Diagram]](../../diagrams/17/202e5b2bc28f4517380c9356dc621632.png)
![[Diagram]](../../diagrams/0/d20dc354aa66eca2c68869a1e3d56461.png)
![[Diagram]](../../diagrams/42/77c36b6f2eadd93d535977301c0bbc47.png)
![[Diagram]](../../diagrams/15/ffdc17ff733c2eed3734a8471c21e68e.png)
![[Diagram]](../../diagrams/3/d0a4088255f67ed560c5a2c5d1e4d71f.png)
![[Diagram]](../../diagrams/3/04e5454cb8c8bd4ebb32879e5b1d0196.png)
![[Diagram]](../../diagrams/44/749eba1679a8989119209b9be83f6d71.png)
![[Diagram]](../../diagrams/1/45b50ad0f158863176436956f03ed92d.png)
![[Diagram]](../../diagrams/33/6e6e115b525a44865447e2c4be876d37.png)
![[Diagram]](../../diagrams/0/cf7079236aa1dd7100748a7ca67ca3d3.png)
![[Diagram]](../../diagrams/24/f1e3a753884f59e813dc397435db12d5.png)
![[Diagram]](../../diagrams/43/2a0afdaf0da6fccc1de65e7605ff7619.png)
![[Diagram]](../../diagrams/6/fb313ed8c4d5c92dd367b26cee4c5772.png)
![[Diagram]](../../diagrams/26/4b193955614475ebd0bb211fd4976755.png)
![[Diagram]](../../diagrams/45/0eb23af331a0548e83121d3d1c975c16.png)
![[Diagram]](../../diagrams/24/c68bc67e3e6b90738ab60d3691c1742e.png)
![[Diagram]](../../diagrams/33/7a5240d010800e4a5f5bbbf5b171453b.png)
![[Diagram]](../../diagrams/12/75ca03d32c892c89f27f354952da5e32.png)
![[Diagram]](../../diagrams/32/681200575d4a76a756f128230b52462b.png)
![[Diagram]](../../diagrams/47/f06c25651b0d8ede1970abb88dee4577.png)
![[Diagram]](../../diagrams/46/3b4adb37441630a02864d0a292727c16.png)
![[Diagram]](../../diagrams/48/a699742fee906b5662ca64d3f7cf6ecd.png)
![[Diagram]](../../diagrams/10/1fcd18ab2aa2d6134c8dd256017ac410.png)
![[Diagram]](../../diagrams/14/d488c7fa07b1cd59546584eb6a215c86.png)
![[Diagram]](../../diagrams/30/b21e95c38e992652d686d98fa4816bbb.png)
![[Diagram]](../../diagrams/4/b9b9796b770bb145fbd5bcfeec6f0e73.png)
![[Diagram]](../../diagrams/21/92da58a4e67d40acebc0f8f734fc3b65.png)
![[Diagram]](../../diagrams/16/a237db41517a7a9b643515ff9f8e2b22.png)
![[Diagram]](../../diagrams/23/97b78434d5da2e074e5ee48f34ce85ef.png)
![[Diagram]](../../diagrams/5/592a68235e74e277c9005c254e991d1f.png)
![[Diagram]](../../diagrams/36/f05b39534a0d731b6dd840e4049d8682.png)
![[Diagram]](../../diagrams/42/82b3147ea377f42d292f4f8ccde37c37.png)
![[Diagram]](../../diagrams/43/ef2d2ea49e4f07dcfd991fb29c51ac61.png)
![[Diagram]](../../diagrams/32/7d1707ee0e9955cd0f94e730baff1582.png)
![[Diagram]](../../diagrams/49/5c8ccf7ee7010f68d6856a77ee7d9cb7.png)
![[Diagram]](../../diagrams/30/6553cceffa2233298c657366a8f6849a.png)
![[Diagram]](../../diagrams/27/898fcb3ac1791b57ab3384015fd8922d.png)
![[Diagram]](../../diagrams/40/a5876e958fc5acb7c2504a1fb9e3140d.png)
![[Diagram]](../../diagrams/46/514ce1750f3571ba387cc81e8b167711.png)
![[Diagram]](../../diagrams/45/b9d0569c2aca1209407c0dc2b782e1b3.png)
![[Diagram]](../../diagrams/42/2deb9f840efe2d0d2c3af707ae6f0c0e.png)
![[Diagram]](../../diagrams/10/82bd76858132644b9da2d1d961b97add.png)
![[Diagram]](../../diagrams/18/00db04167942469b824b8c9b24f98b33.png)
![[Diagram]](../../diagrams/16/9a86d180b03eb8bdf05c369317473d47.png)
![[Diagram]](../../diagrams/32/221f635ebe37d064d7cddd870de1364d.png)
![[Diagram]](../../diagrams/40/4bf2d7a711a5191707476778e97aa028.png)
![[Diagram]](../../diagrams/31/5f86e6eb4c2fa8eee889f3c86e89c292.png)
![[Diagram]](../../diagrams/1/3043c6ed69518487e10bae2154310ef6.png)
![[Diagram]](../../diagrams/36/b83f33521eaf18ebec67c7b66a077777.png)
![[Diagram]](../../diagrams/49/e02698c19851a234cccbe0abec85ebcb.png)
![[Diagram]](../../diagrams/44/04cfce4ce408ff68a387144a58bfa8db.png)
![[Diagram]](../../diagrams/7/33bc350bfee14d02bfca4f03247a9684.png)
![[Diagram]](../../diagrams/9/e940019c0ed68e08052690b8a4e6ff4d.png)
![[Diagram]](../../diagrams/36/e4fe18274ccf935ba23cb1c75482dea9.png)
![[Diagram]](../../diagrams/28/a66450709c02a8a77c215cd64990bb7a.png)
![[Diagram]](../../diagrams/41/78107c82485a7d454ec42ae8cf864d6f.png)
![[Diagram]](../../diagrams/35/734d93f851757ff06472c4e7737072b0.png)
![[Diagram]](../../diagrams/47/06c548371d7bd37b776a42a64a50743e.png)
![[Diagram]](../../diagrams/20/d184124e2c1af6d6715cf9b9db3f1309.png)
![[Diagram]](../../diagrams/10/446bbd144bbe24938158f40014539240.png)
![[Diagram]](../../diagrams/15/6b621f6a130721a893611a41fdf1aa0c.png)
![[Diagram]](../../diagrams/23/347246905e3122f0f7852a4fbea7806c.png)
![[Diagram]](../../diagrams/33/2d9697d0d691061edca46093cb8ae957.png)
![[Diagram]](../../diagrams/23/95892a8db4c3c2ed2e344b4b0378b5a2.png)
![[Diagram]](../../diagrams/7/ad3ea3e57ef34106e5f238f853840cfb.png)
![[Diagram]](../../diagrams/42/79f280313bdf6503ee2c93d8b3439248.png)
![[Diagram]](../../diagrams/34/5f799766fb8e13f0f2ca63e3491c87a5.png)
![[Diagram]](../../diagrams/26/ef2e205c24cfb12e74335aaac2bad844.png)
![[Diagram]](../../diagrams/32/ac54036f2227345c6fe7221e7c475f5f.png)
![[Diagram]](../../diagrams/30/2bf91de3da9bef49528a8526373b7b65.png)
![[Diagram]](../../diagrams/43/c907ce7d84e59a3c5371f654935be249.png)
![[Diagram]](../../diagrams/7/f42dd7e7ca79bdf089812a3d2e759ceb.png)
![[Diagram]](../../diagrams/7/c2386ca82021a55941bdde7b058cd51f.png)
![[Diagram]](../../diagrams/28/f60c61b34bc240e59740f0c5dc153650.png)
![[Diagram]](../../diagrams/8/f634bdc8b80f0055a039557e2b3076f3.png)
![[Diagram]](../../diagrams/18/d84a1544acc47d469a5784a38f8a1432.png)
![[Diagram]](../../diagrams/45/d6a342664c2dff787b7d926de4d375b5.png)
![[Diagram]](../../diagrams/27/7b78493769f6bccc5f8f43201f0838e5.png)
![[Diagram]](../../diagrams/17/7b634fe27f3396650775538a7696c6b5.png)
![[Diagram]](../../diagrams/5/4c32ad8343854d288b002d86ff148f5f.png)
![[Diagram]](../../diagrams/49/8b10a6a2011e82de9b1502df0653de6a.png)
![[Diagram]](../../diagrams/26/0587667ce379cdbf1290a849341e0783.png)
![[Diagram]](../../diagrams/19/4f8c025eef5a2aea69b8383b65f025ff.png)
![[Diagram]](../../diagrams/40/5266536559a4f26e85731b8ef488bf7e.png)
![[Diagram]](../../diagrams/52/01c35e1dc260a4c0cdbf29cab5597193.png)
![[Diagram]](../../diagrams/41/4444c339ca61c6c32fea3dad527f54ee.png)
![[Diagram]](../../diagrams/14/bee309b9e7f0cf6fe98ec8ec63cee530.png)
![[Diagram]](../../diagrams/46/02899f44ee1d8f060f6ec7a83bc256a7.png)
![[Diagram]](../../diagrams/21/cc00d89f8fa7ddd9117127068613856e.png)


![[Diagram]](../../diagrams/15/926ab19179a9b7b6d175b48bd4dbb483.png)
![[Diagram]](../../diagrams/44/1acd1c115364f8741b33769bd00a1c0e.png)
![[Diagram]](../../diagrams/19/c367bc706ae532e762e2e20e3eb1a5fb.png)
![[Diagram]](../../diagrams/46/b6c357ec24880e6dbca1c41d5d302b52.png)
![[Diagram]](../../diagrams/14/d180acb53a0b932fa7922a8850d1f154.png)
![[Diagram]](../../diagrams/33/8509a4462818e450e888230d619daab7.png)
![[Diagram]](../../diagrams/19/1566433ec6ed3cbfab0f97d4ce1db332.png)
![[Diagram]](../../diagrams/49/d41848eaae2af4476d2b5f8e4819b86c.png)
![[Diagram]](../../diagrams/8/b7d40ac2ae2a605b53d5d46aff3fd7af.png)
![[Diagram]](../../diagrams/51/c458939ba5762e264f34134fd7148d74.png)
![[Diagram]](../../diagrams/44/eae5a10d5ae4b6516ae40daebb259835.png)
![[Diagram]](../../diagrams/37/837ff24af69c4adb80a545847cb4bb5e.png)
![[Diagram]](../../diagrams/44/62520fc713fbe044255f841a98c28a32.png)
![[Diagram]](../../diagrams/50/d3868f390389c987aab801d94196a34e.png)
![[Diagram]](../../diagrams/13/19890ca2047ca4b5cacc3fb5e016df07.png)
![[Diagram]](../../diagrams/48/8a559e4136716d39fa93d5258542ac6d.png)
![[Diagram]](../../diagrams/10/fcfc9c16b35838b8a18108186dd5a113.png)
![[Diagram]](../../diagrams/0/a18790025e0175e62dd6875af9ddb2f5.png)
![[Diagram]](../../diagrams/27/5c7da0ebbbf7b4a5753ed94a202cfdcb.png)
![[Diagram]](../../diagrams/19/bc13d754f024b0b5ee25707d2d1e5ce6.png)
![[Diagram]](../../diagrams/19/2233da0538767858891b611502a1357a.png)
![[Diagram]](../../diagrams/49/6824018ba463a9fac514d1403a62aa88.png)
![[Diagram]](../../diagrams/20/bc1388f6479e56a4016663f2ed9fae27.png)
![[Diagram]](../../diagrams/19/0da0cf6ad25cc01c4de0532430953a4c.png)
![[Diagram]](../../diagrams/1/e5b2d02d988fe77846af823f560c0714.png)
![[Diagram]](../../diagrams/18/c802c050b9cf018c9ef9728d33b51209.png)
![[Diagram]](../../diagrams/13/2d57fbfaccf230b440166e20ee9b5e07.png)
![[Diagram]](../../diagrams/16/15ef8842c83f77f9451d818a981df1dc.png)
![[Diagram]](../../diagrams/12/5ad3685084ba92c20fc8052ecdca9622.png)
![[Diagram]](../../diagrams/39/0723f82b12324a82c82f4eb48f8524b0.png)
![[Diagram]](../../diagrams/51/35365d4ce17ad348f458351a7cbf2e3a.png)

![[ext]](http://www.gobooks.info/pics/p47.jpg) http://www.gobooks.info/pics/p47.jpg
http://www.gobooks.info/pics/p47.jpg![[Diagram]](../../diagrams/10/34f8a996daff108621a5b72beb45a4e8.png)
![[Diagram]](../../diagrams/16/5d6c17c62aa20b44ef59b4df23e4d677.png)
![[Diagram]](../../diagrams/39/464539f7dec1228044ea59b90124c8cb.png)
![[Diagram]](../../diagrams/29/2e447f50f933ac1dc93fe284d9ca4191.png)
![[Diagram]](../../diagrams/34/3af2fb0dd060be414087abae6b06a761.png)
![[Diagram]](../../diagrams/46/042ec719660577b9cdc5b548e32098b4.png)
![[Diagram]](../../diagrams/34/4ee6428be71d83ea4ba4c150f46becb6.png)
![[Diagram]](../../diagrams/5/b510b6a3eecaccf992e2305f5b0d70cd.png)
![[Diagram]](../../diagrams/4/bf3997c011d91d497360362c49800b23.png)
![[Diagram]](../../diagrams/18/10255524ed4b7ffc3fd07130ba79b8a8.png)
![[Diagram]](../../diagrams/29/31abaab528d7fc394acf5c4f76e4b495.png)
![[Diagram]](../../diagrams/52/4cb926b21c6a03d175784426443121f0.png)
![[Diagram]](../../diagrams/28/ab09276e0a1e84e486479b5a4cb23645.png)
![[Diagram]](../../diagrams/2/b1465311b539f84bdbb8783483d958f7.png)
![[Diagram]](../../diagrams/22/308b26753055dd40317927912b187fb0.png)
![[Diagram]](../../diagrams/19/0742787db5086232263a7cd7714836b0.png)
![[Diagram]](../../diagrams/25/fa7704b5a33c8bfb317ddf96c01d0c03.png)
![[Diagram]](../../diagrams/21/566274ead91172ad1da9ac489bad45b1.png)
![[Diagram]](../../diagrams/1/fe2e72c3d657a928c902b835c85d5f84.png)
![[Diagram]](../../diagrams/17/e10619a8f569483a28f6f456ef711ec4.png)
![[Diagram]](../../diagrams/31/4a9a557f3ea87bd2324db01d50e98f46.png)
![[Diagram]](../../diagrams/0/664cedc997b1ef0e0186fe9387cba474.png)
![[Diagram]](../../diagrams/30/693a033ff9a8d349a526adde501b350a.png)
![[Diagram]](../../diagrams/48/65c86a5e9244690e6076c7ad0d898caa.png)
![[Diagram]](../../diagrams/33/4cd3d12870502dbfea5789b671b0c20d.png)
![[Diagram]](../../diagrams/14/bb65eedb27dec7b45fe168a9517f9661.png)
![[Diagram]](../../diagrams/35/1b194682dafad6814d6f873c57367292.png)
![[Diagram]](../../diagrams/41/75d61c0d414e4bc35af51309d78b3575.png)
![[Diagram]](../../diagrams/41/d3ee8426a4dc685a7429e5e8be0be9e9.png)
![[Diagram]](../../diagrams/26/880ed9eb309da92c2ed72aaa1c43958f.png)
![[Diagram]](../../diagrams/23/adfe6435df733fc2621eb1cc85690d42.png)
![[Diagram]](../../diagrams/38/b51a16db17983057fd81b2dfb161635e.png)
![[ext]](http://matthieu.walraet.net/go/tuchola2004/big/349-4922_IMG.JPG) http://matthieu.walraet.net/go/tuchola2004/big/349-4922_IMG.JPG
http://matthieu.walraet.net/go/tuchola2004/big/349-4922_IMG.JPG
![[ext]](http://matthieu.walraet.net/go/tuchola2004/big/349-4923_IMG.JPG) http://matthieu.walraet.net/go/tuchola2004/big/349-4923_IMG.JPG
http://matthieu.walraet.net/go/tuchola2004/big/349-4923_IMG.JPG
![[Diagram]](../../diagrams/1/9f4f719b9f95aacd3e4fe23ab36aa653.png)
![[Diagram]](../../diagrams/19/ea3551d26e53695cbb1e9d52cc3f4637.png)
![[Diagram]](../../diagrams/6/21d24d2b9cba69be03f785891a59294a.png)
![[Diagram]](../../diagrams/43/8d1f8a5825cff8af62327a785b717695.png)
![[Diagram]](../../diagrams/35/c7a5e21ad575383a11c68ec5701737ff.png)
![[Diagram]](../../diagrams/0/a1bced27f841e8e3b60ba05d1ad2be30.png)
![[Diagram]](../../diagrams/6/9ada521f4988a302540ff9ba29b2a420.png)
![[Diagram]](../../diagrams/32/1b15aad192a16c3590a9f37404aa570e.png)
![[Diagram]](../../diagrams/11/17352d4b6782a2e545fb2e52447c10cb.png)


![[Diagram]](../../diagrams/27/e1cda2a311154ef1a90fe732361e3998.png)
![[Diagram]](../../diagrams/35/912cc7b7d0274fdc6c99007a19aa732d.png)
![[Diagram]](../../diagrams/39/ac013787f883e2f1895df9a16bc87daa.png)
![[Diagram]](../../diagrams/35/53a62a458d6b14fbc0a788bbb8f39655.png)
![[Diagram]](../../diagrams/38/509c7477e65e96271e4137ae41d1e8d8.png)
![[Diagram]](../../diagrams/40/7d8367bcb29ab8636a7a12c303795628.png)
![[Diagram]](../../diagrams/51/9a3a23193f51e4dc2bb40137013c0183.png)
![[Diagram]](../../diagrams/25/b377b09ec6f4a914621852eb991268de.png)
![[Diagram]](../../diagrams/43/73f1985ec70a7242884814493daa25bb.png)
![[Diagram]](../../diagrams/12/009d4761f220588389972bb47f61079e.png)
![[Diagram]](../../diagrams/12/ab90882909dc980de9b51c0f805b5868.png)
![[Diagram]](../../diagrams/34/ae3c4f2c4895ed296d9f5602a829f6cb.png)
![[Diagram]](../../diagrams/35/587343ad1ae1e6791b3933868c721c43.png)
![[Diagram]](../../diagrams/12/4bf61203ddf9bfac92e10b004de9005f.png)
![[Diagram]](../../diagrams/34/56d2d163ec8e0b4f0fc115584b15457a.png)
![[Diagram]](../../diagrams/33/688cd545fce1721d007ff03283729a61.png)
![[Diagram]](../../diagrams/50/9552708d4bb63276ba40b952a1a9f050.png)
![[Diagram]](../../diagrams/38/42152b7234f9fbc61c87980aec71130b.png)
![[Diagram]](../../diagrams/7/0766106dc23a1b7197acc2fdfb0d4201.png)
![[Diagram]](../../diagrams/45/3ce018131aef3024a3e350b113f5d83a.png)
![[Diagram]](../../diagrams/44/08aa366ae77d90fad1677c5dd895084f.png)
![[Diagram]](../../diagrams/41/911ab9dc301045a47857fc38b0f44b9b.png)
![[Diagram]](../../diagrams/22/8b265404af239747db24a44c3bcd44c3.png)
![[Diagram]](../../diagrams/48/58f4d3a0a9d76d7f5c8dfe200605ef4e.png)
![[Diagram]](../../diagrams/24/a5233be2f28779aa97f7783f39062d72.png)
![[Diagram]](../../diagrams/27/21551d13bcb8a9f85aeed70f8c1f50cd.png)
![[Diagram]](../../diagrams/35/31343a2e197eed6ec9c898465001ad15.png)
![[Diagram]](../../diagrams/2/42d2f5d98583d9bc071c6209e2303eb0.png)
![[Diagram]](../../diagrams/41/88823b3b4934a108023c4e16590e5746.png)
![[Diagram]](../../diagrams/21/ee5b4d7243e3290f017db8a892dc8758.png)
![[Diagram]](../../diagrams/2/6fce8a1599fdc8dbac746dbeb6b460cd.png)
![[Diagram]](../../diagrams/37/2444c6639623939ae44014d24b6146ac.png)
![[Diagram]](../../diagrams/0/01c2de57638ede0c84a40e9c8d429456.png)
![[Diagram]](../../diagrams/36/63d412d0ba674714c4d3955a73a8d73a.png)
![[Diagram]](../../diagrams/42/f95aeb3d03a5f06f838d9fb162ba292a.png)
![[Diagram]](../../diagrams/35/fc1e3b32cddc75c097e9d9f459d80269.png)
![[Diagram]](../../diagrams/11/4c6755800abf4d0af41c4a4bd65c80e4.png)
![[Diagram]](../../diagrams/0/d69c89613d3bf84496a3bf0525b55778.png)
![[Diagram]](../../diagrams/4/1a31a357fbd05f8ca46f221ed74e6b46.png)
![[Diagram]](../../diagrams/8/b20a03f9cb64ed9d34b0230841077986.png)
![[Diagram]](../../diagrams/0/8443614ca2aca74f303171574efdc6d2.png)
![[Diagram]](../../diagrams/1/a84ec54e4b912bef1d8ae88d3d758413.png)
![[Diagram]](../../diagrams/28/e2eea3429604b575e1063cd40d74f13f.png)
![[Diagram]](../../diagrams/42/850c368df29300603eef7187e2b13ecf.png)
![[Diagram]](../../diagrams/27/501c3b3e7c06367a733b07a601217e65.png)
![[Diagram]](../../diagrams/14/698eb4bfb7511332f547492ac90a5a89.png)
![[Diagram]](../../diagrams/42/59dbcf525b054ae4f249262d274832a6.png)
![[Diagram]](../../diagrams/1/fd8e736e0f2ac555e3a417c7b4e0f8e1.png)
![[Diagram]](../../diagrams/52/15e37a1211a52941267b114afb7c6ac9.png)
![[Diagram]](../../diagrams/50/cb89907c75bb513b6e28e04ed4c26bbc.png)
![[Diagram]](../../diagrams/30/c6ac2ac9408beb1e26b022e89f317259.png)
![[Diagram]](../../diagrams/11/1480cefac9b0344c443ea6fe4db00a83.png)
![[Diagram]](../../diagrams/16/f63cfbce48da2478e35c659833154f26.png)
![[Diagram]](../../diagrams/44/bb7bbb592e4b2f095ba8bcadd721fd2b.png)
![[Diagram]](../../diagrams/28/c02252034f59ffb508a3c1b67f9cba5d.png)
![[Diagram]](../../diagrams/18/c2845084fc53e3544bfa682923585d7f.png)
![[Diagram]](../../diagrams/47/38496076b5dd35498350486807f4a727.png)
![[Diagram]](../../diagrams/23/85d052df03d05ef81bf2fe566560615c.png)
![[Diagram]](../../diagrams/43/042d0dc017d09157c6796b230ab5561c.png)
![[Diagram]](../../diagrams/13/88dd9ad8b822422e78847a0af65901c0.png)
![[Diagram]](../../diagrams/14/d1057dfdcb607731978ec92b898bb642.png)
![[Diagram]](../../diagrams/33/bcd51c3247ebfe16d5fb703e26c8e011.png)
![[Diagram]](../../diagrams/39/7d57a67f2706d94b33942daa9e4c6abd.png)
![[Diagram]](../../diagrams/49/17c8496d3940a07fd7d10e1716ba2f61.png)
![[Diagram]](../../diagrams/47/bcb1897d123d9b42c87dbe47a624c49c.png)
![[Diagram]](../../diagrams/41/0099199485cf0b508fa4424b2d2eb677.png)
![[Diagram]](../../diagrams/46/084374ade339ee3b92a476931fae827b.png)
![[Diagram]](../../diagrams/51/db6e72595cb0783188904ca975800a63.png)
![[Diagram]](../../diagrams/41/f62058923d33b718cfed7115fd30e339.png)
![[Diagram]](../../diagrams/9/2c3fbc55975466323cd9244eed6235a8.png)
![[Diagram]](../../diagrams/47/9d16b25e6d71c0656593af329a98a9a9.png)
![[Diagram]](../../diagrams/9/e8245a63d632dbfcba353c58810b6821.png)
![[Diagram]](../../diagrams/6/5c1469e0aea239a07d1372690ceff5d0.png)
![[Diagram]](../../diagrams/41/8eff768094f7de0122ee5f7b1fa06e47.png)
![[Diagram]](../../diagrams/51/c7836dd5354ab558ff92a302ac7556a3.png)
![[Diagram]](../../diagrams/49/7419d18a1d5c1581e2f298b1f48e7caf.png)
![[Diagram]](../../diagrams/6/64fe112e6f143ca659e0db69e41ae846.png)
![[Diagram]](../../diagrams/13/6474c839ad5ed108e25333537d7072ed.png)
![[Diagram]](../../diagrams/5/0b738529264f56a0f7bf5a73814acdb6.png)
![[Diagram]](../../diagrams/36/e203c5e47d300550359ed11a2b0d1fb4.png)
![[Diagram]](../../diagrams/16/4fde0b22b1866ab315685980784f4b40.png)
![[Diagram]](../../diagrams/18/ec94db2d5b4068d5f87ef95d55a0c31c.png)
![[Diagram]](../../diagrams/40/6456b5877c38f2284edbd44e1cf5ba23.png)
![[Diagram]](../../diagrams/44/a6c309309b480cbf0f7d3c6c6ad66950.png)
![[Diagram]](../../diagrams/42/056dd0fc3f3a40f2550ee4fcb70a3152.png)
![[Diagram]](../../diagrams/2/0a665449530c1e91fb773a44f98e22b6.png)
![[Diagram]](../../diagrams/37/0dbe6405065bb9295871d3c6c9b68ef1.png)
![[Diagram]](../../diagrams/15/3c8e5870e229eb947536c5f22a738efd.png)
![[Diagram]](../../diagrams/45/07f53d76483e5f914cc5182f00d8b77d.png)
![[Diagram]](../../diagrams/48/a3c2e896795c974d58840e66c98a8b75.png)
![[Diagram]](../../diagrams/41/20c0f4be2376fdefa2cf2a5f79c28c8e.png)
![[Diagram]](../../diagrams/19/6c51d4ea4007cc4475ccf10e2ad51367.png)
![[Diagram]](../../diagrams/31/00960dd956929633005ade9c0d9bf431.png)
![[Diagram]](../../diagrams/8/84dc7b9b3bc4535f1585635824ebd6ec.png)
![[Diagram]](../../diagrams/27/29f0f418edf954a50958bc3a46f9cc6b.png)
![[Diagram]](../../diagrams/1/d723f4d5cde96cdae2655a6904d3fb19.png)
![[Diagram]](../../diagrams/15/e23bc91c446480f2ddc880665cae860f.png)
![[Diagram]](../../diagrams/47/eebfc870e24ab29ce47419e68ce45bea.png)
![[Diagram]](../../diagrams/19/62c9f3a572beb87b21749aeb9a5fd4c6.png)
![[Diagram]](../../diagrams/3/8c30aa9821d497546dd261cf2c24ed38.png)
![[Diagram]](../../diagrams/33/74c04fd5c459fd76a28ed297fb758e87.png)
![[Diagram]](../../diagrams/0/2c460383f03bd62dff608fbc1188b23c.png)
![[Diagram]](../../diagrams/3/0e9fc33e8b1c6a4b36c1144a739c7030.png)
![[Diagram]](../../diagrams/37/ce9496055fa49c99bad421d02a73a45c.png)
![[Diagram]](../../diagrams/16/09efe96ec1b6a375499a411aa44471e3.png)
![[Diagram]](../../diagrams/13/fc4f5b89683e2116ddbbe90d91b55bab.png)
![[Diagram]](../../diagrams/19/376ac2cb68ab9217bb6ae75c85360c30.png)
![[Diagram]](../../diagrams/9/0ac52b7a50e1a6cb7e7eb4b1fcf70a08.png)
![[Diagram]](../../diagrams/44/457b73cccd0769b8227724846616651d.png)
![[Diagram]](../../diagrams/33/d6a84233451ef2e76061cf85a904aa81.png)
![[Diagram]](../../diagrams/41/6d6d79776d5b50b2a18f33590ee2f80e.png)
![[Diagram]](../../diagrams/23/83b96687b721fb6f805000d0bd5e501d.png)
![[Diagram]](../../diagrams/6/44287b05fd9a4ccc7ceda916e4332a74.png)
![[Diagram]](../../diagrams/21/cb10c9a9af23daede0b7a77ca0de44e5.png)
![[Diagram]](../../diagrams/18/6177251eea37f76a92bbb6f2711b4d5b.png)
![[Diagram]](../../diagrams/6/861b0dbfbf48375132ed6d4a3bb10b6c.png)
![[Diagram]](../../diagrams/7/5c1556af2a10050fd146aa2da864e47b.png)
![[Diagram]](../../diagrams/27/0f11cfa54a32ae9f308065bacd222b9d.png)
![[Diagram]](../../diagrams/8/adacb939b86e8ae5d3aa6fe117bff8e2.png)
![[Diagram]](../../diagrams/6/ed8f6148c95758d0083683bbafd40f92.png)
![[Diagram]](../../diagrams/14/5489477d56f06e8da0ca6b8afdaba24b.png)
![[Diagram]](../../diagrams/19/c49e888d08eb46a205a4e95b66af9ceb.png)
![[Diagram]](../../diagrams/1/d2044448ade11a82509d8d65a0c4391e.png)
![[Diagram]](../../diagrams/39/3c1c43417926056c0c395dc162165dd9.png)
![[Diagram]](../../diagrams/19/6720a0384f3c58e95cd15ae04bff8474.png)
![[Diagram]](../../diagrams/14/9069ff093278630b7b81f50fca802492.png)
![[Diagram]](../../diagrams/25/d99c3b07587a22c708913b219ad8d0f6.png)
![[Diagram]](../../diagrams/48/e658c1267d7497ba09f950d45dd395be.png)
![[Diagram]](../../diagrams/42/5f0df0d71d7e019387925bb9cf96280c.png)
![[Diagram]](../../diagrams/25/811931fb02d28cd7e51ac13f33b82bac.png)
![[Diagram]](../../diagrams/8/c2f02e97d0289cbe9b104a19b14891a5.png)
![[Diagram]](../../diagrams/0/7927a26de3e32737aa066d3a9a753af7.png)
![[Diagram]](../../diagrams/5/ef887120303ffe44848d0a2280df1287.png)
![[Diagram]](../../diagrams/45/7246d2b582dcc6ec4af1614ae97c735e.png)
![[Diagram]](../../diagrams/28/49a73aa8410f3e8a11143c98738a3d43.png)
![[Diagram]](../../diagrams/15/a1bf8f34eff488550a1d0f65b898f66f.png)
![[Diagram]](../../diagrams/47/b5c34238c9bd3a9701114036cd38e2fe.png)
![[Diagram]](../../diagrams/34/573d3069e974dc74b2ebf04d423ab3ca.png)
![[Diagram]](../../diagrams/47/5faf0754a03218737d9c6bd12f05c125.png)
![[Diagram]](../../diagrams/9/bc3051ad34a072f7f5b669dbd524edd2.png)
![[Diagram]](../../diagrams/35/88ec477af39c34a1d1dbe6dac8fbe76a.png)
![[Diagram]](../../diagrams/13/0f14701987c6953118d970e7b276d4f9.png)
![[Diagram]](../../diagrams/43/41b216734c457845bf25f40eb2d357c3.png)
![[Diagram]](../../diagrams/13/278d5bce950425d9f59c5d64a05656fa.png)
![[Diagram]](../../diagrams/16/b5c0867c50c3cc041d63328392f8741a.png)
![[Diagram]](../../diagrams/22/175c709e0204b5f90d9e4a954bb90520.png)
![[Diagram]](../../diagrams/47/e6a7b5820e69899c975c6683325ba871.png)
![[Diagram]](../../diagrams/3/f85a550f90af3d25d2f170748e4a3766.png)
![[Diagram]](../../diagrams/7/00bfb8dc4a573a6890320bdd042b41ab.png)
![[Diagram]](../../diagrams/5/4bd3ddb2ff40694bd307306d27c1a8a5.png)
![[Diagram]](../../diagrams/45/043877fbf88217da49ff9662f81ef769.png)
![[Diagram]](../../diagrams/10/f64d980bd541e20594a7b4cecbb595e1.png)
![[Diagram]](../../diagrams/26/13b96b3e7a5a1355471b6cbdbedacab7.png)
![[Diagram]](../../diagrams/40/3b7f3839d6cff363c9280f67e8709328.png)
![[Diagram]](../../diagrams/18/e6fcf3e5dc022f1ed9ec1e7d5cad7c81.png)
![[Diagram]](../../diagrams/42/2f6302639f87f0a392ff67aae6413e49.png)
![[Diagram]](../../diagrams/47/2bda965ee977f35095f28181f280a9d6.png)
![[Diagram]](../../diagrams/15/f14fd7b6f27f6338adb7156b1c897257.png)
![[Diagram]](../../diagrams/32/ddb7346aea00a774affbcdcfd036973b.png)
![[Diagram]](../../diagrams/38/5db16adcca781b0e18f119ec35b037c9.png)
![[Diagram]](../../diagrams/40/4d557390ef03ba476db4f3ed5efde6d8.png)
![[Diagram]](../../diagrams/44/10f4a223226b30dbae2c671f2908718c.png)
![[Diagram]](../../diagrams/17/d80ccf6868dc779c11fdc003db8b91a3.png)
![[Diagram]](../../diagrams/24/3c6aaf94b3a04dd8089dc6576612f598.png)
![[Diagram]](../../diagrams/5/cfdc1d9edbf75bcffc5cdd133759c8c7.png)
![[Diagram]](../../diagrams/23/2aa710a9a05e1a5856c8c2c74e87fe3a.png)
![[Diagram]](../../diagrams/44/f6a4e6ae1a9d7fcf80349c4aa0de86fe.png)
![[Diagram]](../../diagrams/42/eaaa79850079062c72d0cfd2c663ba23.png)
![[Diagram]](../../diagrams/23/9ee7f3e2dbad99a869572d42b67fa6e1.png)
![[Diagram]](../../diagrams/31/bd2f2518832b74e8f2df4fdc4bc6eb7f.png)
![[Diagram]](../../diagrams/28/0834a150b60e92a4a97d4f2c3bc67c1c.png)
![[Diagram]](../../diagrams/0/9525d573be0a28e5ded822dd3242847b.png)
![[Diagram]](../../diagrams/28/c0f241e3de7df666f4b72a482879e7e3.png)
![[Diagram]](../../diagrams/33/ffd934c14bde43690a8abc03e742d602.png)
![[Diagram]](../../diagrams/15/44b147670cf8415087cf3a8ffef4e872.png)
![[Diagram]](../../diagrams/50/d6b19933397d3367a6717728009c2ade.png)
![[Diagram]](../../diagrams/6/6a0c6fb3512a8883e5357a6070e6fdee.png)
![[Diagram]](../../diagrams/38/445fdcc06d0e903a35523ed0c8c8c237.png)
![[Diagram]](../../diagrams/15/376c7010726eaf52c2b07f6f692b1245.png)
![[Diagram]](../../diagrams/14/e0ddce44e02ceac528637439a218ff9b.png)
![[Diagram]](../../diagrams/7/0db7e6ea858f4617bac76015346fc957.png)
![[Diagram]](../../diagrams/50/7ecee37124f99cf08bfd763c6bea4690.png)
![[Diagram]](../../diagrams/22/f9b4b0157387324d3151e8a18b370b7c.png)
![[Diagram]](../../diagrams/37/fa8c6f94b009331a243fcfb32491d625.png)
![[Diagram]](../../diagrams/36/53e434971bd09f7f6d76d34121248500.png)
![[Diagram]](../../diagrams/18/36e398e66b4c19ccc3cd0f1bbc0f5bc8.png)
![[Diagram]](../../diagrams/24/3fd915caf18909d6b072406b0d5cbbea.png)
![[Diagram]](../../diagrams/40/9a2afc84732ffb0899d49411813833f6.png)
![[Diagram]](../../diagrams/36/6546e926b1c8350ae224e169c25c7212.png)
![[Diagram]](../../diagrams/34/ebd8527bf882ba06776f7d1cfea6e052.png)
![[Diagram]](../../diagrams/0/ea11dd7e738a2347335dd23a748c1020.png)
![[Diagram]](../../diagrams/31/5208efb47e68a092b22de8e7dd5d0965.png)
![[Diagram]](../../diagrams/26/3fe70aa2484263511b65022e61482147.png)
![[Diagram]](../../diagrams/39/22735b3ccb6acbe5c5a652a4fa4d349a.png)
![[Diagram]](../../diagrams/44/17887cb82ffcaa070e82e69746ef7203.png)
![[Diagram]](../../diagrams/37/fe47741478be4f1a52ad927a6f52b890.png)
![[Diagram]](../../diagrams/35/c9fe4ae22a8c92ab7a4654d34993d95f.png)
![[Diagram]](../../diagrams/22/cffe8a38b8e9b9bf3c2f6528438f1f1b.png)
![[Diagram]](../../diagrams/3/9ec08514a450d3e2495e157226ff22f2.png)
![[Diagram]](../../diagrams/30/a6a954635830598f7f78dbfa8bfaa0ae.png)
![[Diagram]](../../diagrams/22/a85dad46a858e63d6e8c788332a01cd4.png)
![[Diagram]](../../diagrams/4/c1b3af0a71f1a8770cee62a35405b0f4.png)
![[Diagram]](../../diagrams/22/29fee8bd55de47b79da2a19813926447.png)
![[Diagram]](../../diagrams/10/5e59e3b3fbc1b78f187ae00a8ecf6d48.png)
![[Diagram]](../../diagrams/29/674dc0462c06e8888c85df62154d71ea.png)
![[Diagram]](../../diagrams/32/dc41aa502faf0476f769a551855eec41.png)
![[Diagram]](../../diagrams/16/f68c5a723605c392e735f241882c54b4.png)
![[Diagram]](../../diagrams/24/35fa580947e95dc7078e4c36e1717c8b.png)
![[Diagram]](../../diagrams/40/d032a0a25c7ce209ed709e025e487a6f.png)
![[Diagram]](../../diagrams/15/d808f8bb27e94f82fe3187aa0e16afc1.png)
![[Diagram]](../../diagrams/26/0b67c9e83a73b04331ed87e9aa663e36.png)
![[Diagram]](../../diagrams/40/bb9a5933327106184b1b69c5355eff14.png)
![[Diagram]](../../diagrams/29/6d0bd6bdc906903088a9d20e263d7562.png)
![[Diagram]](../../diagrams/34/2ea6d1c1ec03bc2f68d630f14f1a3e8d.png)
![[Diagram]](../../diagrams/25/8c9cf44211e319c4772d926eb4cf7418.png)
![[Diagram]](../../diagrams/8/05ee8890d09523d78ac9ec71481e63c5.png)
![[Diagram]](../../diagrams/45/5a124af68b57fe52ff25a9ce037d0f25.png)
![[Diagram]](../../diagrams/28/94093e1f329c9c0f64509256f3da24cd.png)
![[Diagram]](../../diagrams/14/24b4d4a1f5cfd554f3a3747056e09d96.png)
![[Diagram]](../../diagrams/8/d2a5f29fe239f6b0dace979d4dae48b2.png)
![[Diagram]](../../diagrams/3/500a3aaa8e4d6ddef36267472a1fcd1e.png)
![[Diagram]](../../diagrams/5/f5b20bbdafaee3a42625d7846330299e.png)
![[Diagram]](../../diagrams/32/7045f478c9a974f51f424ab69b4ce2d5.png)
![[Diagram]](../../diagrams/19/faf1199fd51f49733eff5251dad26c2f.png)
![[Diagram]](../../diagrams/33/24858a698dce5ab99f4843adf0b0fdc6.png)
![[Diagram]](../../diagrams/51/1db66b95e7847ad3235ef5f582134f70.png)
![[Diagram]](../../diagrams/8/ae21f3fd08107e2200032b3a3155ff76.png)
![[Diagram]](../../diagrams/24/6e9ac2cedd8c464ac3aa89130478efd2.png)
![[Diagram]](../../diagrams/22/b857656a3c55170463e13269cab6a7d3.png)
![[Diagram]](../../diagrams/49/2f2d48c448858f230711ea475ae04bf4.png)
![[Diagram]](../../diagrams/43/000267c2dc40cd0f81ddce3459f3b588.png)
![[Diagram]](../../diagrams/43/8fc003e12715aba1b68cb8e41fb0ee14.png)
![[Diagram]](../../diagrams/26/6e49d559943b30466f802e326598b144.png)
![[Diagram]](../../diagrams/37/39cc7cb8556a87e24b5ff0d82d56d451.png)
![[Diagram]](../../diagrams/30/443f6faad9498f7a67a828884017d289.png)
![[Diagram]](../../diagrams/35/e4ebe6801ccd49b8db5e1bab8b1dc2a2.png)
![[Diagram]](../../diagrams/44/95f8792f1903c418f8167da44cf0eb7c.png)
![[Diagram]](../../diagrams/48/30cd041b023131a84c3feaab9c644def.png)
![[Diagram]](../../diagrams/37/76747b925069e39dac043dbb3137aeca.png)
![[Diagram]](../../diagrams/48/7fb662c646e9aa01b377f0b0cefd8608.png)
![[Diagram]](../../diagrams/5/705cae8855addc1d30d61972dfd277b8.png)
![[Diagram]](../../diagrams/40/58328aa417f96542a49b0a87af23ed3f.png)
![[Diagram]](../../diagrams/16/637430c451ad339766fe85155d26ba3b.png)
![[Diagram]](../../diagrams/27/e9bb580ae58e54a43af62ce8f4e2adf5.png)
![[Diagram]](../../diagrams/6/453ccafbe4258e1e3595e8ece20f89d1.png)
![[Diagram]](../../diagrams/20/7d43d8339679e8b2426db9cbef1344d7.png)
![[Diagram]](../../diagrams/25/dc5af22d4d4ebf8a6647c731f4f23e09.png)
![[Diagram]](../../diagrams/51/52a1fd9bc9191d311a3fde1ee6cfbd64.png)
![[Diagram]](../../diagrams/29/a0299128543e8add1d482c7053093f1f.png)
![[Diagram]](../../diagrams/10/a0240b30a389856f2bfc6adfa9b03e9c.png)
![[Diagram]](../../diagrams/3/fed05520a4449798fd2db97b8002507b.png)
![[Diagram]](../../diagrams/35/0fa3f97ced17cda0a910285e34bc365a.png)
![[Diagram]](../../diagrams/18/3990ad158b2f8ea0daa1df0428621596.png)
![[Diagram]](../../diagrams/27/24b29e9f5c9dc3ef445e6c1c7e5dd74f.png)
![[Diagram]](../../diagrams/7/1618b2a815751a6deb7f6fde8bac3c6c.png)
![[Diagram]](../../diagrams/37/662ffaa93c6eb9b7cb0bcd0f32e8d69c.png)
![[Diagram]](../../diagrams/42/8ff5be0a02ee79fca886243a571e1105.png)
![[Diagram]](../../diagrams/9/5641b0d0b035863c7441c92d9a1e34f2.png)
![[Diagram]](../../diagrams/21/e0f7acac180cf6a14133d707e014e69c.png)
![[Diagram]](../../diagrams/48/2bd5a70dd26c0e5787ad6d0df1a18aad.png)
![[Diagram]](../../diagrams/36/2f217e649dccc6b63251310b870821a4.png)
![[Diagram]](../../diagrams/28/541ed358fe54c4c438650b28e0513e2c.png)
![[Diagram]](../../diagrams/25/b8a396874767bb7b26c14595ecae0adf.png)
![[Diagram]](../../diagrams/41/9ffbe562c44a0cba668792ee0cff80f3.png)
![[Diagram]](../../diagrams/35/2995bd14624b9fda2cfc6eb0910dd988.png)
![[Diagram]](../../diagrams/4/ab46ea014e1d4bc54c05f5550b8398b6.png)
![[Diagram]](../../diagrams/7/df405a37d354e6f8b6380830f6e8dafc.png)
![[Diagram]](../../diagrams/3/cb86635c639ec849a6b02d1706957f82.png)
![[Diagram]](../../diagrams/25/6f4cac05b2440ff12ff46e458a5225f7.png)
![[Diagram]](../../diagrams/30/0c112a87edcb3d374360973811b270ae.png)
![[Diagram]](../../diagrams/43/b3f84f4e7153d37e2ef54ffa489db88f.png)
![[Diagram]](../../diagrams/25/401cb71ef4b6f3555bcad39562c40d97.png)
![[Diagram]](../../diagrams/0/33ae3ce7469f9a6652e6af4c5af59e0d.png)
![[Diagram]](../../diagrams/12/58e6b81d8035c8ced6a253238d856794.png)
![[Diagram]](../../diagrams/21/4ed0439b8ff225728988886e5ffe34f5.png)
![[Diagram]](../../diagrams/4/876f47f28428fe70178f66ab20d393a2.png)
![[Diagram]](../../diagrams/6/ce77c34d396aeae566c2151e70e5360c.png)
![[Diagram]](../../diagrams/16/a288952dcc2a2782b2633f038113e5e4.png)
![[Diagram]](../../diagrams/9/672ea1b0dacd4aa6a812e6d9cdbb9d8d.png)
![[Diagram]](../../diagrams/18/52a9759356557fefaad704e665377fd2.png)
![[Diagram]](../../diagrams/2/480213483f661ea6464f0807fbd4fddc.png)
![[Diagram]](../../diagrams/33/710418a873233a95cadfd93277c3551c.png)
![[Diagram]](../../diagrams/26/45d8d354f4c13d85a516a77595aad8ab.png)
![[Diagram]](../../diagrams/0/5983533c3eebd4caf148e8c9b60c59a6.png)
![[Diagram]](../../diagrams/38/18df1761a93651ef7c6010393c40ee3f.png)
![[Diagram]](../../diagrams/16/b4a91be7d4d0ffc1273be2a3794c2b3c.png)
![[Diagram]](../../diagrams/50/48ca8c9ee0b7b8ba57569472c8a46414.png)
![[Diagram]](../../diagrams/26/1dd9c9ce050414dd7c1ebefbb05de274.png)
![[Diagram]](../../diagrams/39/d7fe43935adc4da75143fc63b2467166.png)
![[Diagram]](../../diagrams/50/a4ca76c08d785e34630d9ec5192c86d7.png)
![[Diagram]](../../diagrams/13/b7bd3ea0f8205a913d8450aeacb5af9d.png)
![[Diagram]](../../diagrams/31/4894dec454c56170fb9c053b6b04cee5.png)
![[Diagram]](../../diagrams/39/169617e8f4ce780ddc614ca73f4e2a68.png)
![[Diagram]](../../diagrams/26/dee9f93dee22c9ab86674487ce359925.png)
![[Diagram]](../../diagrams/38/c2d4b2ece9838e5b3a8ffa5e67560e00.png)
![[Diagram]](../../diagrams/0/8795fc1e4d453b9f8da4f70780bfb25f.png)
![[Diagram]](../../diagrams/36/9f84cf489d17c369525af3b35b4a7bf7.png)
![[Diagram]](../../diagrams/1/b9b976b86b8b1c1492d1ce3a62fdb52b.png)
![[Diagram]](../../diagrams/25/6fe1b07241beb75d20957d6eb94650a1.png)
![[Diagram]](../../diagrams/19/af38f4a530345270fcbf7eaaf008318b.png)
![[Diagram]](../../diagrams/29/cda058e92c894e5cf6034bae3a7addb1.png)
![[Diagram]](../../diagrams/49/10d8f25e6c2b0c30aee87625bfa0fbcf.png)
![[Diagram]](../../diagrams/33/7656fe1a6e25627c7364aace945f9002.png)
![[Diagram]](../../diagrams/14/440078a2b4e5e60d0ca1b7f9638cb503.png)
![[Diagram]](../../diagrams/31/25585f0ae12df301f9090982b3d66c7c.png)
![[Diagram]](../../diagrams/48/3e8e39ffbeca14ba3d2f8336555dbd7c.png)
![[Diagram]](../../diagrams/23/64f9a6f930b7e3759abd7f18ad840fdc.png)
![[Diagram]](../../diagrams/44/a9b418cc479c8d77bd0a050fa21cda0d.png)
![[Diagram]](../../diagrams/2/5aae6fd5fe0fc79d40c4f3a103435a38.png)
![[Diagram]](../../diagrams/41/4cbe805e8e0ae3b62a9973404dcd85bb.png)
![[Diagram]](../../diagrams/16/0da20a2089578834b2a536a0dfa7a81d.png)
![[Diagram]](../../diagrams/40/1640de62f176a47fa84864e99a1bdff7.png)
![[Diagram]](../../diagrams/30/6aa3b0ae39049e2296aef78b9ed68a19.png)
![[Diagram]](../../diagrams/38/57ff843c28ad1dd1b0bc958c2c294a82.png)
![[Diagram]](../../diagrams/52/755cc498b7a9713594d27923f8016681.png)
![[Diagram]](../../diagrams/47/dd14556123eb9575e46b30ab9f321382.png)
![[Diagram]](../../diagrams/24/9702ac4ee45100ed7fa4cf4de93c353b.png)
![[Diagram]](../../diagrams/35/5cd847d95940d4a587c16f8cb8e4bfe6.png)
![[Diagram]](../../diagrams/42/a4f68ec6a49bb7136e2172df41345417.png)
![[Diagram]](../../diagrams/22/d83170135e70a1b20a8d50131fb7cc87.png)
![[Diagram]](../../diagrams/34/b3d7c36e3ede6af2802a4dd381ad532c.png)
![[Diagram]](../../diagrams/6/d04d478c49fbc0a61d446cf0d017025b.png)
![[Diagram]](../../diagrams/11/c4616bca50889bcfdc71e97b6666979c.png)
![[Diagram]](../../diagrams/29/a0f5cbd73a4d7b1ec1d8ebe6e0461f96.png)
![[Diagram]](../../diagrams/45/1e98a9e7c4c44a6c8d3cd33338462040.png)
![[Diagram]](../../diagrams/36/092dba5485185592005c01184cc61886.png)
![[Diagram]](../../diagrams/39/bb6e024e7403c7ee320b4f92a1a3d86a.png)
![[Diagram]](../../diagrams/33/33d0b3063a70e5d607c036b64f53763d.png)
![[Diagram]](../../diagrams/35/aaab3320a8371898b186f34595f60257.png)
![[Diagram]](../../diagrams/5/9cd744c0d03d4bf1190e2f270c09ab07.png)
![[Diagram]](../../diagrams/0/fa058ac631618b4b43cac39618ecdf2a.png)
![[Diagram]](../../diagrams/25/6485ff4a2ef21f67bee3fd95da92ec72.png)
![[Diagram]](../../diagrams/51/b11606b65546df945becc99c0484d402.png)
![[Diagram]](../../diagrams/17/937d87ca795c3d94d4ce4455e7e8c29e.png)
![[Diagram]](../../diagrams/31/9f786939ece6dc6f8253ff9f2266ef0d.png)
![[Diagram]](../../diagrams/37/9a6036f8e152269d2b0720053ff37c64.png)
![[Diagram]](../../diagrams/21/de83d859137c922e44892f119f9f9a97.png)
![[Diagram]](../../diagrams/6/2314d43ad33b1b0bd1fbc96235fd07d3.png)
![[Diagram]](../../diagrams/36/e9479ca26ce01157b4cc6a3420571c34.png)
![[Diagram]](../../diagrams/10/3d7ec060b675aa7ba6b1661c728626b8.png)
![[Diagram]](../../diagrams/24/af43e51d019d1c3c8c6117c43189502a.png)
![[Diagram]](../../diagrams/30/e3b1cc5a8a0bed83b0ebad44d6f20942.png)
![[Diagram]](../../diagrams/20/bd9708476bfc38d282e8d14ec7de5e93.png)
![[Diagram]](../../diagrams/30/e74bf23bcef6e212ca33d61ad615cc3f.png)
![[Diagram]](../../diagrams/14/4c9e9090f3b736782da5333403b11833.png)
![[Diagram]](../../diagrams/34/fe24269c9cf6b6b60d915d649033209f.png)
![[Diagram]](../../diagrams/49/23525eec05f6600545f22294f5dd25ac.png)
![[Diagram]](../../diagrams/39/2d6edd6dcbc75a7d55865869835d3e48.png)
![[Diagram]](../../diagrams/16/dd5214b5e74f751539a14f1f3b186afb.png)
![[Diagram]](../../diagrams/34/d19c76d1a89c6fa0585a72519cfcfc1c.png)
![[Diagram]](../../diagrams/8/d51f06cb85e325ac05ee4f92eaace437.png)
![[Diagram]](../../diagrams/13/3a0f57a080398ae02c2949c95344e13e.png)
![[Diagram]](../../diagrams/24/85ed566b4f3312f55f46e90d589767ad.png)
![[Diagram]](../../diagrams/50/0985b5d42f29000f5671dc6b7d3758f4.png)
![[Diagram]](../../diagrams/9/fb2da27e2676ba5db51d090dee934995.png)
![[Diagram]](../../diagrams/39/5695f5a32cbac1fd0cf1159ead36a7cc.png)
![[Diagram]](../../diagrams/31/77d25a6dbcd647e46cc7efe17e6ef130.png)
![[Diagram]](../../diagrams/45/35fe03a68ac4228702e61d2e3d1238f5.png)
![[Diagram]](../../diagrams/8/4613f66fd0875248aa68882d9160ada6.png)
![[Diagram]](../../diagrams/42/1f97e07df1eff9d06ee3c31d41ef6601.png)
![[Diagram]](../../diagrams/26/1a4992e9ae262868d2727a7ab2548d65.png)
![[Diagram]](../../diagrams/6/887da0fd313314661c758fe6419a4cae.png)
![[Diagram]](../../diagrams/5/80bd933ce5787f3e30a2bf9664c1e461.png)
![[Diagram]](../../diagrams/49/eb75402f26e1dee6aafa715c124ed5fd.png)
![[Diagram]](../../diagrams/19/601aacfe28dd28dc8bfe9d780cc54124.png)
![[Diagram]](../../diagrams/9/0901d4ebfd89a21b2d76fb84c69ae991.png)
![[Diagram]](../../diagrams/40/9f8d1d2ad2aa6811304f56ab75940c49.png)
![[Diagram]](../../diagrams/13/8aa369fc578f263040eecd36d193e1ac.png)
![[Diagram]](../../diagrams/6/e62d5f6d633908fd4057282f29e5df95.png)
![[Diagram]](../../diagrams/17/7766111a68d89f7dfd6d3cd05c204509.png)
![[Diagram]](../../diagrams/14/bb876cc04881fe84fbd56c4e2c735d9b.png)
![[Diagram]](../../diagrams/47/d87e1afea81688fad3fac4790f841231.png)
![[Diagram]](../../diagrams/11/f49b1ad93e3a0d377e880af9efa73b9a.png)
![[Diagram]](../../diagrams/6/d12ab8fbaf5e6db79bfefaa7693b8d2d.png)
![[Diagram]](../../diagrams/28/1350044ead3a577c25e083e2399ef7ea.png)
![[Diagram]](../../diagrams/29/58803e82eb48bc540efef001694c8e47.png)
![[Diagram]](../../diagrams/18/b2e13ff6d9ab2e69a033231676773d45.png)
![[Diagram]](../../diagrams/22/9134d59fcc811eae3912a851f19e0f33.png)
![[Diagram]](../../diagrams/21/9b4911b6a8236d8b4d6b3d5949e1a8fa.png)
![[Diagram]](../../diagrams/1/a5ddd4df803d534b4ec15cc3996b5048.png)
![[Diagram]](../../diagrams/34/b05a4fe0ad18a5b8e478dfd87f7c733d.png)
![[Diagram]](../../diagrams/41/f354be8584320c6c18f5a1562a909754.png)
![[Diagram]](../../diagrams/8/9da0816d6a839b695aa07fee29ba530d.png)
![[Diagram]](../../diagrams/30/e8204caecf13b3ff363116b05d66de33.png)
![[Diagram]](../../diagrams/32/02a72663fbcff05212553f0e00ddf610.png)
![[Diagram]](../../diagrams/30/68a7c373949e267cc043129d93aeb5aa.png)
![[Diagram]](../../diagrams/30/bfa3f13efa5a41e02beb9d163748a801.png)
![[Diagram]](../../diagrams/30/66f0e5cc89455f44e350d591ee23a4c5.png)
![[Diagram]](../../diagrams/33/4fa633be45ec323658912461f42fd51d.png)
![[Diagram]](../../diagrams/25/22d79e766d4ca3ee46535cd7e94064c3.png)
![[Diagram]](../../diagrams/51/ce296da5e7d7cc201c238f82b208c231.png)
![[Diagram]](../../diagrams/15/3847cf66717c0e1aacf70c19ef96051b.png)
![[Diagram]](../../diagrams/44/b050206716bb82db7c1064e907f47178.png)
![[Diagram]](../../diagrams/30/c5206eb673551ef39c7a94362a2ce01b.png)
![[Diagram]](../../diagrams/10/cec994c3a4fb2a69a1d6a082d5eab1a2.png)
![[Diagram]](../../diagrams/24/9f69ef9eff5b97f768057dad033b7dc9.png)
![[Diagram]](../../diagrams/46/837f1476ac28e0f0b447c01dc0c4093f.png)
![[Diagram]](../../diagrams/29/35c39d134a704eb4c5f2009f5dd98978.png)
![[Diagram]](../../diagrams/27/fc7085483d4b2727f84ceba89e3c61c8.png)
![[Diagram]](../../diagrams/6/b2d089ac2d2498b962d7ae271f2c927f.png)
![[Diagram]](../../diagrams/38/1a50d5168ff2e6f031b014f88ee24cd9.png)
![[Diagram]](../../diagrams/10/3150626fbdcea410f3f0c4017b0e23f5.png)
![[Diagram]](../../diagrams/42/bff2b98dbbb60552e2ed4fd52c2f9066.png)
![[Diagram]](../../diagrams/11/d7b158e756901abda80083fb4637dc0f.png)
![[Diagram]](../../diagrams/42/bd469d732cde6845b48522d31279e322.png)
![[Diagram]](../../diagrams/6/9b86d676aa4d524126f299fc5fa52c94.png)
![[Diagram]](../../diagrams/29/c18edcd67b2a42c99ba1664e7f0f05ec.png)
![[Diagram]](../../diagrams/15/5abf4f1b3d329f1cc9acce8db27b6915.png)
![[Diagram]](../../diagrams/8/e87c824c95743ea5a0122e38fc2a2fa4.png)
![[Diagram]](../../diagrams/2/e8a9085e97b08ffa1f2328fef65b89d2.png)
![[Diagram]](../../diagrams/41/7ccac788ac504d25e81d3aa1c6091129.png)
![[Diagram]](../../diagrams/44/01c0acba5e8d32a648c7f385b6ca710f.png)
![[Diagram]](../../diagrams/43/b194b98dd0c1d24313f1f6c2555c916a.png)
![[Diagram]](../../diagrams/6/c82e8409566e8a4b274e0060e3218a14.png)
![[Diagram]](../../diagrams/39/33be78ca51ccd7d3d6a93a0de832b80a.png)
![[Diagram]](../../diagrams/51/8871e1711628c2d787dcc9cee76f0b46.png)
![[Diagram]](../../diagrams/9/839bd3ae42b530925b50a76694decdcc.png)
![[Diagram]](../../diagrams/42/14db5104f91dc5feeab8c282f218fa9b.png)
![[Diagram]](../../diagrams/30/aca55fec7ead263729b1d34d7f3b39de.png)
![[Diagram]](../../diagrams/51/7e263ced0b2f38f453e479b32d292466.png)
![[Diagram]](../../diagrams/32/dcf3707d77e6de4ad5b4c066851e05ec.png)
![[Diagram]](../../diagrams/20/88c5d4ed75522548bdcee46870742c6a.png)
![[Diagram]](../../diagrams/17/c589b8aa183176ab64af0bb7735cdf7e.png)
![[Diagram]](../../diagrams/23/793692befbbab10e493235ba59fcc1e5.png)
![[Diagram]](../../diagrams/5/06e520caf806e1893b3f975ee9991cbd.png)
![[Diagram]](../../diagrams/28/71ea0a3486eb3f4f99c5d3d37600f0d5.png)
![[Diagram]](../../diagrams/22/29b66b22542d5666c1468234a6536e1f.png)
![[Diagram]](../../diagrams/26/60a756419f82a78b350ca1784b74d337.png)
![[Diagram]](../../diagrams/51/97a14b1787ee0eb124858ba152b7d6c9.png)
![[Diagram]](../../diagrams/18/243d7f1fc0e8ce585d6ce2d772ec4db0.png)
![[Diagram]](../../diagrams/1/e3de750e794fe988746a68fb45a644e7.png)
![[Diagram]](../../diagrams/20/cc2a62ac8c6bcb4025d3e3fbdf1b7db3.png)
![[Diagram]](../../diagrams/50/3df4ee55d5b1d10e3107ca6728ee6e3a.png)
![[Diagram]](../../diagrams/52/56cfa0844d4b1cb3ce452da0dfbff928.png)
![[Diagram]](../../diagrams/36/c79b4345033f12445c3aeb6632bb019d.png)
![[Diagram]](../../diagrams/10/667623f12f432f68327dcc3fb4a52f58.png)
![[Diagram]](../../diagrams/26/9870c55af96b53531c8b6cf1e10c4132.png)
![[Diagram]](../../diagrams/48/8e73d503b4ce6583451138ba8386f880.png)
![[Diagram]](../../diagrams/32/3a7056eb825cf8b48c75932cf0e69632.png)
![[Diagram]](../../diagrams/13/3bf15ebe82caa0f9e775cff5b8d0aa5f.png)
![[Diagram]](../../diagrams/48/367b6772fe7e8426c407d21d702d0bf3.png)
![[Diagram]](../../diagrams/23/75e3a3b3265eab7b92f00d1eccaf74ed.png)
![[Diagram]](../../diagrams/7/4dee357189660d14a284b9ae85a8fec5.png)
![[Diagram]](../../diagrams/49/2073d28b3ca5eb260bc30ad14f66456a.png)
![[Diagram]](../../diagrams/21/1349d9abeddcc22660ad3fb1667e190c.png)
![[Diagram]](../../diagrams/16/036f09e9ee033c1a6d4e363cb7257fa2.png)
![[Diagram]](../../diagrams/9/a69ae5c5c92ab6b3113c6756f8c4a08a.png)
![[Diagram]](../../diagrams/35/07b2426a19c93a926931c0e5369a0377.png)
![[Diagram]](../../diagrams/28/45d2db3c672d42efc707e8631287b9db.png)
![[Diagram]](../../diagrams/22/470246ca81672a0535e1941bd474e1d7.png)
![[Diagram]](../../diagrams/33/224f674c5af809e2777166e7754c9e92.png)
![[Diagram]](../../diagrams/16/8936bbfb6f50e334630f30fef0be3579.png)
![[Diagram]](../../diagrams/51/437b4319488ca34b887d2b5bd96affcf.png)
![[Diagram]](../../diagrams/20/db5e55ed9ee1dd2df64fe470b1e545aa.png)
![[Diagram]](../../diagrams/12/4c9bd6d781fd772a837f8b0053a08905.png)
![[Diagram]](../../diagrams/11/d53518487d11e715ccc5625d18a762cf.png)
![[Diagram]](../../diagrams/0/77cc6aaaccde7eb3be8875380cae4a0f.png)
![[Diagram]](../../diagrams/5/36b85fceaabf31fbff0849965289a6c8.png)
![[Diagram]](../../diagrams/50/fa162867d177177482210ae51b49b1fe.png)
![[Diagram]](../../diagrams/0/7eacb72de07188aa6f19c4177d7f2758.png)
![[Diagram]](../../diagrams/1/78f3749abc4b9972f5516932f7ab8ea3.png)
![[Diagram]](../../diagrams/42/09e38a73ad817a13ffdc783c7457014b.png)
![[Diagram]](../../diagrams/19/4c89dc8a4a52853d3a8ed985ae1ad9a2.png)
![[Diagram]](../../diagrams/49/79c8d87a0e0c64d181c545384b082ebf.png)
![[Diagram]](../../diagrams/30/3fe3f62bba58c4c7bf35a28c90fdb503.png)
![[Diagram]](../../diagrams/13/89ed12a01884bb558955a176a3e10b13.png)
![[Diagram]](../../diagrams/33/605fa56133c75b38ec42cfd3b2d66f8d.png)
![[Diagram]](../../diagrams/40/db05b5991a41afd313ecdc3f96969676.png)
![[Diagram]](../../diagrams/13/e5eb338a953cbcf977497a8b17b47c94.png)
![[Diagram]](../../diagrams/31/96358f335d201b00d5a5c347c38642ca.png)
![[Diagram]](../../diagrams/40/0800e09621fb62a07c9139b731f25862.png)
![[Diagram]](../../diagrams/44/09eb87548b202a83bc6c0188aae37a77.png)
![[Diagram]](../../diagrams/14/e2757ff28bb0d02ad2003755a147b7b5.png)
![[Diagram]](../../diagrams/36/fc05a581037a995c1aa8dd097c97d4cd.png)
![[Diagram]](../../diagrams/2/db92e089ff2bc83fce03dc0303b0a062.png)
![[Diagram]](../../diagrams/19/ce30898c5f3651dce8f9af4fb3f37574.png)
![[Diagram]](../../diagrams/10/8e61274956429710948c4170ab5d32a4.png)
![[Diagram]](../../diagrams/23/7ee8c2e29421e209f948f267d80c7fc8.png)
![[Diagram]](../../diagrams/31/c10b06ed07de6843f5ac623fc2906d53.png)
![[Diagram]](../../diagrams/40/e60dc6363720a839b53d6829d08c58e2.png)
![[Diagram]](../../diagrams/4/bc86d64c2c3e0d5c014dcdc48d803531.png)
![[Diagram]](../../diagrams/24/7d96c243fa97ea6962477200b4d819f4.png)
![[Diagram]](../../diagrams/41/f34ec764fe21d3f98da8e066a1f44a31.png)
![[Diagram]](../../diagrams/35/e53627a62ebf6265b729f958b538fa7b.png)
![[Diagram]](../../diagrams/37/d7026fd96f18cf36b4e5dd8aa328a391.png)
![[Diagram]](../../diagrams/31/bfcb3ed1d610c531b2b17d1e6e09951f.png)
![[Diagram]](../../diagrams/21/802f0b68d6a8e95c2814d883621701ce.png)
![[Diagram]](../../diagrams/4/a9f40666adac9f8aa38321b75df806ee.png)
![[Diagram]](../../diagrams/31/1e7c34e51868ffb49a0b142e6925dd63.png)
![[Diagram]](../../diagrams/41/0ddf195cb9e2620092514f59378be5ba.png)
![[Diagram]](../../diagrams/37/62aece9c21a2e8a75223b05b3783b8e5.png)
![[Diagram]](../../diagrams/14/55273e65e7d55fdd7a0f6f87d7a097e8.png)
![[Diagram]](../../diagrams/7/4e46b4a22bb488bc320784dec57f8219.png)
![[Diagram]](../../diagrams/49/162ee4d6a5704e8c599c25d4e5609329.png)
![[Diagram]](../../diagrams/33/ce5981153341f08a2ec4659705dfbd5e.png)
![[Diagram]](../../diagrams/23/e82d27feb135489d97846349481f323a.png)
![[Diagram]](../../diagrams/38/51cb35415ba27b4a9ea79f7fed0e95fd.png)
![[Diagram]](../../diagrams/43/4cbc8c06ac2bb62f64fabe85b14ed880.png)
![[Diagram]](../../diagrams/37/6067d7d7b5a7caa904b0bc88a62dbbda.png)
![[Diagram]](../../diagrams/15/277d4baacd4ccf4649d948420056731b.png)
![[Diagram]](../../diagrams/5/4e8015e7c6395219ddf53e57be634a9c.png)
![[Diagram]](../../diagrams/50/e9bf02212f2d8f67aa14b205a6f4d5a9.png)
![[Diagram]](../../diagrams/36/7a3205744af69bd10671c4e2b306700d.png)
![[Diagram]](../../diagrams/9/f6021db6de9db83a10a2eabb2e81d43d.png)
![[Diagram]](../../diagrams/12/c672d448dfc011c523bcbeaf30170f0d.png)
![[Diagram]](../../diagrams/27/85b8250d4f77d7777f2e2125c6f35fcb.png)
![[Diagram]](../../diagrams/13/021ef1ecdd6d62066bd28c51ef3b2be5.png)
![[Diagram]](../../diagrams/46/5543a6d1a291ad57fa5803ef78a4aef4.png)
![[Diagram]](../../diagrams/22/e0551c5fad4ba0704f199abb31456fcd.png)
![[Diagram]](../../diagrams/26/706673a8769f1a2a4bae39842d519570.png)
![[Diagram]](../../diagrams/52/f73756d408f48a729bf2cb5c36a6bcee.png)
![[Diagram]](../../diagrams/34/8595926c4fdf0151c7591f51d2fd0ddb.png)
![[Diagram]](../../diagrams/14/8bcdcc7acb4afd923c7a1b737b73c661.png)
![[Diagram]](../../diagrams/26/49e9a25c39cbe07ba0055864c54902c7.png)
![[Diagram]](../../diagrams/15/0c399b5b9ce7046d808a5a1096898098.png)


![[Diagram]](../../diagrams/38/17ea0d46fba3021c8979f90c68b6e3f1.png)

![[Diagram]](../../diagrams/20/6fc400a30fa9db730b1e655d15666922.png)
![[Diagram]](../../diagrams/3/9324508cc7189f28bf109256375d226c.png)
![[Diagram]](../../diagrams/42/553cac4e68f1a41e4d0fce1342ebd349.png)
![[Diagram]](../../diagrams/3/20ab0745518e0e77bc3fb8620f549627.png)
![[Diagram]](../../diagrams/31/030d1e894a661cfc5e5314fca067631f.png)
![[Diagram]](../../diagrams/4/80f2259549aaec77609ed9640bec4e9a.png)
![[Diagram]](../../diagrams/6/c6196096fe5288db6e00c3281d2511e0.png)
![[Diagram]](../../diagrams/44/6b6e694fa681327cfa62d78fb907503a.png)
![[Diagram]](../../diagrams/32/87b83f0d1996e017795a077d64e3ad0f.png)
![[Diagram]](../../diagrams/49/b5a2ebf6be3523af041396cd5122d95d.png)
![[Diagram]](../../diagrams/41/e1ed1a07ed86d250a20cd7b72daadc24.png)
![[Diagram]](../../diagrams/2/0d45e46a59aed0afc2d2a42fe6235f82.png)
![[Diagram]](../../diagrams/19/ced6af293f664e02f8d5a118362ad4c6.png)
![[Diagram]](../../diagrams/10/6db507ac2cc1441af42e424a0395fb2e.png)
![[Diagram]](../../diagrams/38/0cc29db267c4b51fd589fc14c30f3bc4.png)
![[Diagram]](../../diagrams/38/ddd278ba5c190801472026cdf3932e49.png)
![[Diagram]](../../diagrams/10/8f1dcf215791b754b27ea42ed74c07cb.png)
![[Diagram]](../../diagrams/51/8fee6ea0fdde46f6046ee815f0bb71bf.png)


![[Diagram]](../../diagrams/28/c4131ab757982415f7b20949d812f7b9.png)
![[Diagram]](../../diagrams/3/365ce427f9f8dd55bf42f98de855080e.png)
![[Diagram]](../../diagrams/35/52c37bccec403a6b1413869507813d3c.png)
![[Diagram]](../../diagrams/12/492dee8d6d4ce995e4b09c19fab16436.png)
![[Diagram]](../../diagrams/1/d4adf5a070b46d4415fc16fbbc38ef0f.png)
![[Diagram]](../../diagrams/23/114d69aac67ff2b8232cd5b5ed7dcb9c.png)
![[Diagram]](../../diagrams/28/02053fcf5e8be3d62f4b621c06dffc80.png)
![[Diagram]](../../diagrams/1/06283d61e8004ac1db856e41b296f651.png)
![[Diagram]](../../diagrams/49/c332106fec0221734883492327b36a80.png)
![[Diagram]](../../diagrams/39/6a02270e9c24184689c7ea84da617317.png)
![[Diagram]](../../diagrams/14/3f9a399d0619d40c69336f0c21b27acb.png)
![[Diagram]](../../diagrams/29/b6553d033da702e9b9edb44673bde16c.png)
![[Diagram]](../../diagrams/33/8b0c1967d290f500fb0191dd3f705bd2.png)
![[Diagram]](../../diagrams/1/9bd608f8e9f792249364b50a0ed08763.png)
![[Diagram]](../../diagrams/15/c949b1ec8e34e496f799e025ea25c242.png)
![[Diagram]](../../diagrams/26/2cebb2528efae79682fde46e67eb262e.png)

![[Diagram]](../../diagrams/38/c2c0158df2e6b9977ffc426fbc8b4210.png)
![[Diagram]](../../diagrams/35/1ae63e8f75d76aabc0c6ecda6ff97bdb.png)
![[Diagram]](../../diagrams/32/8fb89e180d246d62e02dbb393412f6fc.png)

![[Diagram]](../../diagrams/50/3435f535248cda6829bbe7c5866b89d9.png)
![[Diagram]](../../diagrams/47/e6ff797317f376b18efe1948156918dc.png)
![[Diagram]](../../diagrams/4/ffbf1916c64550fcb66d0197f52b68d5.png)
![[Diagram]](../../diagrams/48/1c7e336e17ac21d99f7e771b073626b5.png)
![[Diagram]](../../diagrams/28/995d279ad66a15d3891aff5135f3b7ea.png)
![[Diagram]](../../diagrams/12/4f9600324ee5fa9c2d924b3b1c289ee0.png)
![[Diagram]](../../diagrams/48/7fa0cc28fd447e290c146194194a8d20.png)


![[Diagram]](../../diagrams/18/d5f8567a36c444c373075bbb44e81217.png)
![[Diagram]](../../diagrams/45/158ef0061305f34e37eb455a1ff7d4e6.png)
![[Diagram]](../../diagrams/49/0d85f0a0dbdde296712ecad08cbbe2af.png)


![[Diagram]](../../diagrams/35/6b70d22523bb685fb834088b39ff2718.png)
![[Diagram]](../../diagrams/1/32181d453306ea31defe083371dcd884.png)
![[Diagram]](../../diagrams/43/76df3d25ae60a163a69525f4fbd9eb60.png)
![[Diagram]](../../diagrams/1/4848117f13ae9e57b8002f78d4bf52b6.png)
![[Diagram]](../../diagrams/26/b4b9da3bcd2b6e0461337bc57cf9ae66.png)
![[Diagram]](../../diagrams/43/4d8aa2bbf0f1f17c2d643edc77ef4fe9.png)
![[Diagram]](../../diagrams/45/de6bdc3ef06727043e3e2d663ac28dcf.png)
![[Diagram]](../../diagrams/13/08d5e149f79ac3ffd70cef6cc3a1674a.png)
![[Diagram]](../../diagrams/0/a563d1e8bf8d151236cc07ef02da8365.png)
![[Diagram]](../../diagrams/38/4476db6e835bd39af4b2fcbc9a1fe22c.png)
![[Diagram]](../../diagrams/8/619f799515068c9ced5db5671cd5416a.png)
![[Diagram]](../../diagrams/38/b060308b7a392c1e34515c2378849fda.png)
![[Diagram]](../../diagrams/4/630f12ab64a72d65da3c5dc54da12a5e.png)
![[Diagram]](../../diagrams/39/08f19fbb64dda9754647b4fe7b4998d1.png)
![[Diagram]](../../diagrams/15/3d90995efea042d4830e46c5cd3c0a03.png)
![[Diagram]](../../diagrams/7/3c52b2441905168b778dac19870a993e.png)
![[Diagram]](../../diagrams/44/df5282207044c6dc7b4492e4cb37dbda.png)
![[Diagram]](../../diagrams/49/12fd034e747aba786c9f878d8e5778bc.png)
![[Diagram]](../../diagrams/11/a90d54a064086bc348f39101d2710054.png)
![[Diagram]](../../diagrams/41/4f10b4153ffc54854e10bad128096441.png)
![[Diagram]](../../diagrams/6/06e044a632a40edb4b1037d9b910f3ec.png)
![[Diagram]](../../diagrams/2/7d4c860daa27bbdff9b751eca5fd3849.png)
![[Diagram]](../../diagrams/39/4f481ab67f19720c4e908f94c52ca01b.png)
![[Diagram]](../../diagrams/2/4a5520793a1383ff61de02db17544ccb.png)
![[Diagram]](../../diagrams/42/0607845fa041c25c7f87ea9bd16ce0c6.png)
![[Diagram]](../../diagrams/21/125e6950de9460bd1a8827a63c627411.png)
![[Diagram]](../../diagrams/50/b1bd21a43feb2464c7f57831d936c094.png)
![[Diagram]](../../diagrams/34/5b9c6a0c6f52984ce7d1d12e7c2a518b.png)
![[Diagram]](../../diagrams/21/6c3d15a0ce575a838386ec586564a3db.png)
![[Diagram]](../../diagrams/52/ce1d53ef1b90a7c3504db2215864f445.png)
![[Diagram]](../../diagrams/52/3e56a107f5f48a21dc923cab2c18bc44.png)
![[Diagram]](../../diagrams/36/df96104a385007d38c8bb51cc8745ef8.png)
![[Diagram]](../../diagrams/20/ce952c1a898431672cc9e3977e384d1b.png)
![[Diagram]](../../diagrams/11/8eb80b195d1a66bae2f5290dafc8ba4a.png)
![[Diagram]](../../diagrams/12/23d772d15d705e1a49f14fd2e7d4904a.png)
![[Diagram]](../../diagrams/46/855b228502925629a2643415940dc655.png)
![[Diagram]](../../diagrams/4/cc9327db626a1c09e509e5408d3de4c8.png)
![[Diagram]](../../diagrams/29/91be0bb6b2b76f8fbaf74ee8379e031b.png)
![[Diagram]](../../diagrams/41/b2705b75e51c6a8d72a0c0bd346d1588.png)
![[Diagram]](../../diagrams/19/07e00f6ba9c5f3a0155c378428d1ffd0.png)
![[Diagram]](../../diagrams/27/fcc3c023b295226069092e2e668b1214.png)
![[Diagram]](../../diagrams/20/281dcd1f71b33f0434990015f1bd8a69.png)
![[Diagram]](../../diagrams/52/1a22170ecf7559d3659e8ac6ed191fbf.png)
![[Diagram]](../../diagrams/49/6e831a4df49dc32631ce6820412af5a5.png)
![[Diagram]](../../diagrams/9/87e39ad8907345c5edf8c13ba0a2a37e.png)
![[Diagram]](../../diagrams/47/d22d75f97f3ed70101b63a0c5f983aa9.png)
![[Diagram]](../../diagrams/49/84c067cdc818b098661b7b3e53619287.png)
![[Diagram]](../../diagrams/43/de2089219343c4161f8e15309c675b5b.png)
![[Diagram]](../../diagrams/11/1c35c8026ffab6969ca9b2ceee89f7f4.png)
![[Diagram]](../../diagrams/4/768f7e60579a4c6156492f1a1eee4ad2.png)
![[Diagram]](../../diagrams/52/41898d7078f3e8039082d1bf058130e6.png)
![[Diagram]](../../diagrams/27/6ad549c243c303ee72a7429d0dc7b43e.png)
![[Diagram]](../../diagrams/42/2c289255245de2088dca8bce1166808f.png)
![[Diagram]](../../diagrams/34/43dee2ee16df4aa322c135d917635cc8.png)
![[Diagram]](../../diagrams/7/66d3cb857dd16bb9428c7c29fdfa6957.png)
![[Diagram]](../../diagrams/40/477b2c9fd530a4d36b1ec0ad7f280bdf.png)
![[Diagram]](../../diagrams/37/86e8515517bf1278b3128eca4bc3bf01.png)
![[Diagram]](../../diagrams/26/3d8538beadc791b5974e85ca5403cb8e.png)
![[Diagram]](../../diagrams/39/cc8fc367624c0678a6ad901b09181a3f.png)
![[Diagram]](../../diagrams/34/eedf97164885786bd29e201e031d5cca.png)
![[Diagram]](../../diagrams/46/a2b19c75b13356edf14e2ade0244c60c.png)
![[Diagram]](../../diagrams/24/c9493ca275f4d39c9a0d967b09e4e04f.png)
![[Diagram]](../../diagrams/33/4f4b1ab85a52c9584438b2b71780992c.png)
![[Diagram]](../../diagrams/20/1655d4cdfde2301387a492e5ff90c74b.png)
![[Diagram]](../../diagrams/21/4cdc51fe05d4505182a896781ea43858.png)
![[Diagram]](../../diagrams/36/6f23cc59007fd18d512f36bda71d28c2.png)
![[Diagram]](../../diagrams/11/44909b7c516d3ef9868f0c2fb529fa13.png)
![[Diagram]](../../diagrams/32/7679574e365c80cb6cb698025c840aa4.png)
![[Diagram]](../../diagrams/34/76da1b028d8ac94890b2d8552f07a8bc.png)
![[Diagram]](../../diagrams/11/17dd2f8abb45f8a123d86b84e6c95744.png)
![[Diagram]](../../diagrams/22/7227bc62ff7369c1b271bc1cb10ce1ae.png)
![[Diagram]](../../diagrams/11/c2f5e330f4de7e01e52547c00d7e4963.png)
![[Diagram]](../../diagrams/28/34e997f854f73f7fd436c0885c59ac6f.png)
![[Diagram]](../../diagrams/52/1dbf4734f391047b7215827bf973f964.png)
![[Diagram]](../../diagrams/19/3d7875234e162e38aeb2ad3bbf5ee56f.png)
![[Diagram]](../../diagrams/29/76774afe2858f22ee55d63de66f2c6d1.png)
![[Diagram]](../../diagrams/14/4cb4eb8b323524465a2dfa0369d71d77.png)
![[Diagram]](../../diagrams/36/67c0dd5987a0a26cfcce8ba09c881bc0.png)
![[Diagram]](../../diagrams/20/dc750ea9bfd8a7267588f94c6e2e7445.png)
![[Diagram]](../../diagrams/5/2dbdd095567e3a40ccd28f63fff55658.png)
![[Diagram]](../../diagrams/25/3789412c8b467091c82bad8c4f66a58e.png)
![[Diagram]](../../diagrams/30/8777fab58a48984d90b59eaa5fb35b3c.png)
![[Diagram]](../../diagrams/41/ade93d186ee5db49b03fd86a2fd4ed54.png)
![[Diagram]](../../diagrams/23/634cf6d4bbf4f3d071c79aadc42feeaf.png)
![[Diagram]](../../diagrams/8/04ab8f305edc27d7daa00d8ef9712c76.png)
![[Diagram]](../../diagrams/14/87673c364f9cc34c34ba9974996bda9b.png)
![[Diagram]](../../diagrams/11/1f92c81c9623f0cb232103fb2df9acaa.png)
![[Diagram]](../../diagrams/42/f40c015a4a60cc907753d150489bed2e.png)
![[Diagram]](../../diagrams/34/5c3d392f172dd3c72b95ccef7f11efa6.png)
![[Diagram]](../../diagrams/41/78492b4d2785daa65333cb72784ee89b.png)
![[Diagram]](../../diagrams/40/3b460b82cd439d1f07b2317469ec3c98.png)
![[Diagram]](../../diagrams/41/a298ba2ecedac2db84fc5c3a3fefdeb6.png)
![[Diagram]](../../diagrams/40/057b4a321ecb2ad5e4e10e11f8dcbc9e.png)
![[Diagram]](../../diagrams/50/3d051655bd3f93fda8671d2c325b2a61.png)
![[Diagram]](../../diagrams/51/dda2ff179fb8e3bac0a0e2501a963a55.png)
![[Diagram]](../../diagrams/51/dd6c136ee1d2d5b0e3dfe6d5ec6d4890.png)
![[Diagram]](../../diagrams/30/d49167888de540e070688938408c3f71.png)
![[Diagram]](../../diagrams/8/346ed8baf912a6dda2af37e27d507779.png)
![[Diagram]](../../diagrams/19/a25bdc7749951b9c5c8fd3529747133c.png)
![[Diagram]](../../diagrams/42/717fa7dd728aad4acb92a6989382d0bc.png)
![[Diagram]](../../diagrams/18/d4f48dedf412377c9acee98e71df1006.png)
![[Diagram]](../../diagrams/46/4cdf3242dba12bf679445d60a6b143f9.png)
![[Diagram]](../../diagrams/52/4344aef4d3dec0ff8d51b8f8e1969795.png)
![[Diagram]](../../diagrams/52/4f9242536c0290a7262f7929d33f365d.png)
![[Diagram]](../../diagrams/5/b249f49522441d2b5a00a6f2408b7950.png)
![[Diagram]](../../diagrams/12/9ca16f3a59ad1d1f0f291f996ad16fbe.png)
![[Diagram]](../../diagrams/19/2ded844742bea408ae73929d4332f672.png)
![[Diagram]](../../diagrams/9/0d22aeb5657d6baf402bc4a25e9af087.png)
![[Diagram]](../../diagrams/22/2de93411596d1642de89bb6b725a9cb5.png)
![[Diagram]](../../diagrams/37/083c7bd0bac94e803a6b2e797ac7b314.png)
![[Diagram]](../../diagrams/22/45e529c19876776ab73c82a87e6bc8d8.png)
![[Diagram]](../../diagrams/13/362e2270946c0c780251491a25f57b29.png)
![[Diagram]](../../diagrams/11/6e7be0b352a3db31d059bc5b00ce816a.png)
![[Diagram]](../../diagrams/33/aecb50d4200868992718847b700b7074.png)
![[Diagram]](../../diagrams/39/c69daaba6123a74693f14a9458d4f6b4.png)
![[Diagram]](../../diagrams/31/d97ef13bf3814f1616a1d967a6d2c419.png)
![[Diagram]](../../diagrams/49/da7b2022545de8faa03c76c39c222bee.png)
![[Diagram]](../../diagrams/14/c13967028736f73eb7a259241d06fe9a.png)
![[Diagram]](../../diagrams/21/a8d16c333c42c4299f6d985ea8c8884c.png)
![[Diagram]](../../diagrams/0/8998211c7aa9b443aafe6d883b3ed435.png)
![[Diagram]](../../diagrams/40/558a1c9c469ada25b324e7491f386bdf.png)
![[Diagram]](../../diagrams/27/34a974364345e2479da423d09a0d5270.png)
![[Diagram]](../../diagrams/33/169997319e1958ddb42aef13a685ed38.png)
![[Diagram]](../../diagrams/27/19768c8d50fe962a6b91b73f0491df3e.png)
![[Diagram]](../../diagrams/32/85f665b63248d48e445b7cb2ec97779b.png)
![[Diagram]](../../diagrams/14/b9dc7fe892e5560a4640937d0520103f.png)
![[Diagram]](../../diagrams/20/a1c86c74f11be189793edc00dcdb960c.png)
![[Diagram]](../../diagrams/16/450ed9dd1494ae5d45dcb5577dba59e2.png)
![[Diagram]](../../diagrams/28/9701271e89d4d78ade140eefad897a92.png)
![[Diagram]](../../diagrams/36/113bd316d691859156862dced8d8cb6f.png)
![[Diagram]](../../diagrams/36/286131de54718c7d23ecd0cd952b97eb.png)
![[Diagram]](../../diagrams/34/d1d21d11071b3d6959063e1a7ca42234.png)
![[Diagram]](../../diagrams/34/be634d9ad30215ca790d6022face1825.png)
![[Diagram]](../../diagrams/30/14e39c26233a723f109180c40154c58d.png)
![[Diagram]](../../diagrams/38/85d95e2b95d117ebb91e098f2e16fc78.png)
![[Diagram]](../../diagrams/22/4b125b27caceaf84e3ce5582bd8aee36.png)
![[Diagram]](../../diagrams/25/4a91ff0371b6c582c8a987312d4be7e2.png)
![[Diagram]](../../diagrams/22/d12b7618ad5e11d95c252598688785ed.png)
![[Diagram]](../../diagrams/20/c3cbcbe38a95fe28f5bbf187f0c54934.png)
![[Diagram]](../../diagrams/4/78bdf8bf96bb29372dbd161eb07fac02.png)
![[Diagram]](../../diagrams/10/a092b9aea6b7780dee91727144678174.png)
![[Diagram]](../../diagrams/19/8960fe73a7e32c40754948e76d86b2ff.png)
![[Diagram]](../../diagrams/1/e10170b66b99dcf70361c5476f98d5f4.png)
![[Diagram]](../../diagrams/50/bbee95094ee5e8dfd13c7e718dc98260.png)
![[Diagram]](../../diagrams/16/e22642179376279f6d60f5de38b87a32.png)
![[Diagram]](../../diagrams/26/812ca0dfab3c58768f55dd926bdcb7a8.png)
![[Diagram]](../../diagrams/51/06b0ded7aeda40196c90cf49605579ca.png)
![[Diagram]](../../diagrams/42/852660a47ed2c87539808f50441c2986.png)
![[Diagram]](../../diagrams/51/fb4110fd72414b7328aa603b5d16880e.png)
![[Diagram]](../../diagrams/19/6368b6281df6eb13722549d4a5200910.png)
![[Diagram]](../../diagrams/28/ea9785da55619b8c7fad83d5f4becf86.png)
![[Diagram]](../../diagrams/12/3a6c2e03d070298163a1f1524fe0f778.png)
![[Diagram]](../../diagrams/28/86f51a8f3a4af4bf4f4d424993ececcf.png)
![[Diagram]](../../diagrams/44/1fb1da4387157574b9cdb6038e611f07.png)
![[Diagram]](../../diagrams/27/aae831339c029c3d82a316fd50da3670.png)
![[Diagram]](../../diagrams/40/47a0dba6a4202047b5821e98e72c3e87.png)
![[Diagram]](../../diagrams/18/b1e6984ecbccc44e955db36920ba0689.png)
![[Diagram]](../../diagrams/48/7a0ffc96af63f8bb6677081962641a8f.png)
![[Diagram]](../../diagrams/2/e0696ae5be25b4633f069887bbb36781.png)
![[Diagram]](../../diagrams/48/4efb4b1c9c48fdb94b93ef63150f981c.png)
![[Diagram]](../../diagrams/19/8f2e2c6f0ab62daeaddf71c225247fd2.png)
![[Diagram]](../../diagrams/21/f0dd2f5573b70c79db764fd53eba4737.png)
![[Diagram]](../../diagrams/9/7240df54c672d6b3134745d28aeb5e27.png)
![[Diagram]](../../diagrams/32/a36c4204cde934dd25cc4d536bae0d2e.png)
![[Diagram]](../../diagrams/23/a560eeea4f67bafd668614a5e5ec986f.png)
![[Diagram]](../../diagrams/11/b30ddc8cf5790f606a472b8a410390f5.png)
![[Diagram]](../../diagrams/9/cb7a6cf4fbd1bc2f90d8a30fa59c79e1.png)
![[Diagram]](../../diagrams/42/1ef70de51cdf2dad94f30e00e303d028.png)
![[Diagram]](../../diagrams/40/13b2c5c434e5365475613258b8e4f7e8.png)
![[Diagram]](../../diagrams/12/58e93bcebe46cbfb74c6eca75b73bc89.png)
![[Diagram]](../../diagrams/35/7e4749c1518d3010927aad61b7297853.png)
![[Diagram]](../../diagrams/42/27d40142af3a97cf49395c07b474d58f.png)
![[Diagram]](../../diagrams/4/4849c2af0baef5bf00f24596a15127b6.png)
![[Diagram]](../../diagrams/43/c4b9b854928ab2cb90370ac29458073f.png)
![[Diagram]](../../diagrams/35/36917e864315f34a65604235d7b02f9f.png)
![[Diagram]](../../diagrams/7/d05c7aef902f14eac72f172ffb9612ac.png)
![[Diagram]](../../diagrams/14/f0fe134ac31ae3e42cd3a8526c92752e.png)
![[Diagram]](../../diagrams/51/40c56a717b283d294fe9e15cff7a6993.png)
![[Diagram]](../../diagrams/26/858473855c42ed3ff49fff4abe7c1e93.png)
![[Diagram]](../../diagrams/19/f8ac425247bca74e029b3a0e83e44fa3.png)
![[Diagram]](../../diagrams/22/fa1e4c32960cad62fec3ff9f3d6cf156.png)
![[Diagram]](../../diagrams/19/3c69bc1264be9e870162fce9a78dedd8.png)
![[Diagram]](../../diagrams/50/96f0e722e9f06d759af86d2b8ecf3e58.png)
![[Diagram]](../../diagrams/47/c47551784df0e336b9a448a68a89b814.png)
![[Diagram]](../../diagrams/3/f53c22c51da7bd3f4bcfd74deec5472c.png)
![[Diagram]](../../diagrams/48/a20547bb2a10ea842cd7a753c2eecbae.png)
![[Diagram]](../../diagrams/5/5518a42cceb797dcf7a064064ed78621.png)
![[Diagram]](../../diagrams/8/8746818f9845c02d9ff9acf254561327.png)
![[Diagram]](../../diagrams/32/4a71a795b10ffb06376ccf15205f97d6.png)
![[Diagram]](../../diagrams/22/9d5e88eb58b0f136a54c5b9e9fef2b5c.png)
![[Diagram]](../../diagrams/31/8f9b3a4e74735f0b5808ebb7db86e6df.png)
![[Diagram]](../../diagrams/41/d24b3aba55c7507585317a3985faa57c.png)
![[Diagram]](../../diagrams/3/725f89f298c87f49f721e54700a39bdd.png)
![[Diagram]](../../diagrams/43/2ed0c8084c6efa080ad1308fa4e5fa9c.png)
![[Diagram]](../../diagrams/22/b14b22c9d094a47ab67be1569a239e26.png)
![[Diagram]](../../diagrams/42/38fb763963c19e473640dc97b468551b.png)
![[Diagram]](../../diagrams/37/2ca056de87f5d04c83805a9e3832f81b.png)
![[Diagram]](../../diagrams/49/4aa9c4952289220430ea4d06dd06dfb7.png)
![[Diagram]](../../diagrams/21/56601592046185949fc49feca44ed011.png)
![[Diagram]](../../diagrams/25/30ec208310f1f8cc786d1a7340e746c7.png)
![[Diagram]](../../diagrams/22/bda9dbe9c4e05bd6db13c6b2d3774f5f.png)
![[Diagram]](../../diagrams/36/59372fffa830b8dba1f2a3c83f806060.png)
![[Diagram]](../../diagrams/4/862cf0c772f2a268fc781db1915a4edd.png)
![[Diagram]](../../diagrams/8/ac89bc3527cbd7f55d454b6ab8deb7a9.png)
![[Diagram]](../../diagrams/29/55946e5ea13b6ae789f58be42a96b9ff.png)
![[Diagram]](../../diagrams/41/4c41ddfdfb03a9eb4675405455b98ed2.png)
![[Diagram]](../../diagrams/14/48eb8526007cdb1c889f55ab34f03dff.png)
![[Diagram]](../../diagrams/46/114f7c362c9c00a2476229f015616a0d.png)
![[Diagram]](../../diagrams/50/a206efec6f88b79eb7e9d85862ff88db.png)
![[Diagram]](../../diagrams/37/7f2fbe765c9fb5df34bd1e2cb79127a3.png)
![[Diagram]](../../diagrams/17/94f1c0b40d1b50c80938b34b35d576ba.png)
![[Diagram]](../../diagrams/51/f6b9116235559dbe708bcfd56ae399ad.png)
![[Diagram]](../../diagrams/17/e80459b69be4c76491e68d13e198a26d.png)
![[Diagram]](../../diagrams/29/366e82212f5cad8c22a0c465395b3cca.png)
![[Diagram]](../../diagrams/12/a971462d83ded47dc59233903db61416.png)
![[Diagram]](../../diagrams/1/df7372fb1b91e434c9880223956d46ff.png)
![[Diagram]](../../diagrams/3/66a44ff9bbdaf4dfde9f604b30b8405e.png)
![[Diagram]](../../diagrams/3/d9441558b0ca867a7619982f69b25a67.png)
![[Diagram]](../../diagrams/33/44c6927365971e0dd27a4f7da1318886.png)
![[Diagram]](../../diagrams/26/6ca3cee37930b895ef8369f57eeea249.png)
![[Diagram]](../../diagrams/24/2565157acc204cab9aef2e6432e8cf59.png)
![[Diagram]](../../diagrams/51/32d328a3e7ef6c68dce1104cd515f521.png)
![[Diagram]](../../diagrams/6/e12d4dbca07e51168f3c0f1821c4ffc7.png)
![[Diagram]](../../diagrams/31/57dba811ed470bd9e66f47c5f9bcbb0b.png)
![[Diagram]](../../diagrams/16/8c45a02a475685b8c309823d80f75c29.png)
![[Diagram]](../../diagrams/21/341c608d8c5dd50ea392812e83561fb3.png)
![[Diagram]](../../diagrams/31/90bc99bff6af4642ac15f86adb16438f.png)
![[Diagram]](../../diagrams/9/0f65f7bb36c3e61badca6fe1b7604994.png)
![[Diagram]](../../diagrams/1/4fb80309fc95fa2785211aaa1193e219.png)
![[Diagram]](../../diagrams/4/02609ece6f896c96a00a59d18f52264c.png)
![[Diagram]](../../diagrams/32/1457a1a47c324c0e00c9bcf060a742b6.png)
![[Diagram]](../../diagrams/50/e1d6950aae7b30e7a98a12a6389782bb.png)
![[Diagram]](../../diagrams/37/6652b0fb1dc5ff6d08fd35f87f666bbd.png)
![[Diagram]](../../diagrams/11/a86ecf5d36dc30bfefa9a317c70e3ba3.png)
![[Diagram]](../../diagrams/33/9b27a81ea98811cd2e056a4c7610ef8d.png)
![[Diagram]](../../diagrams/23/c40614ca41c42ffd9b563bbe90d9ca6c.png)
![[Diagram]](../../diagrams/9/e62cb7c53737a58ac41fc9c6112e414f.png)
![[Diagram]](../../diagrams/15/16c58e599a87f9bc1126a33956f47de4.png)
![[Diagram]](../../diagrams/35/81c2074fc35472616311e415ddc5fee6.png)
![[Diagram]](../../diagrams/49/0f34523c9901916af90211849a79aed5.png)
![[Diagram]](../../diagrams/9/9b6e19af69eecbcfcf315d5a8f1df007.png)
![[Diagram]](../../diagrams/7/a45432543a46bac34ed6e026a03255bf.png)
![[Diagram]](../../diagrams/47/6d86ee965efe961b6704708faa655713.png)
![[Diagram]](../../diagrams/28/6209e82efcb293d9c0c5c0f6834b9122.png)
![[Diagram]](../../diagrams/30/b11bd80a5c524062f9703ee5fb83c0b8.png)
![[Diagram]](../../diagrams/52/8a6031ba4b258932a961e3cb61d5d2c5.png)
![[Diagram]](../../diagrams/17/6222caf87fae1562325efd9206c37927.png)
![[Diagram]](../../diagrams/44/00da7bff2957036e24e6955708440851.png)
![[Diagram]](../../diagrams/8/2623df1ec3751488a20a95deaa8a1717.png)
![[Diagram]](../../diagrams/15/689e45d12ba84b3e1d6edd3b776e5d2f.png)
![[Diagram]](../../diagrams/1/e2f14a17f63d4adac5eab85d39dcd537.png)
![[Diagram]](../../diagrams/22/42bd37317fd4949422430cc2e631ace6.png)
![[Diagram]](../../diagrams/24/322a0707c861988e686e8565dc8b60e6.png)
![[Diagram]](../../diagrams/48/9b1ca6bf639c7d17eb494a9541a34ddf.png)
![[Diagram]](../../diagrams/32/814307e29ed3ad5cf826197401202956.png)
![[Diagram]](../../diagrams/43/853317e8e0f41a6aff7ff28879be5362.png)
![[Diagram]](../../diagrams/49/488a373c4f3da419978de44488e8a3e9.png)
![[Diagram]](../../diagrams/50/5ed09569213a7123827bbc295e538815.png)
![[Diagram]](../../diagrams/20/ddf09282561a4fa729d6d42814cf7b91.png)
![[Diagram]](../../diagrams/27/9dac89fcd051d515a57ee5e2e6186e03.png)
![[Diagram]](../../diagrams/29/eabfb5d45131a507ec69c69cd1a38a5d.png)
![[Diagram]](../../diagrams/1/66cf1549f8edaedc149817711151a028.png)
![[Diagram]](../../diagrams/46/a41ef78c816f049245cb9a85054cdf94.png)
![[Diagram]](../../diagrams/4/5a11bbd896e69a431dbef01854ef6c04.png)
![[Diagram]](../../diagrams/6/b693902438675597eb238160f6bce70e.png)
![[Diagram]](../../diagrams/19/189a54f78ab8031c0549cdcc23efcd97.png)
![[Diagram]](../../diagrams/9/6963ed55c9824d9d6583c7914eed6515.png)
![[Diagram]](../../diagrams/31/8d3d8f74553e9ab2d6c3e34509ebfc1e.png)
![[Diagram]](../../diagrams/52/579411b56fd97b6b6e055602cc3a74d1.png)
![[Diagram]](../../diagrams/46/cbc9f81b07a829e6cc875ce3c0c2bf13.png)
![[Diagram]](../../diagrams/36/5dacb2c59d36b0d80877731d572ead03.png)
![[Diagram]](../../diagrams/44/6f06b0ac305fd6fcc926bedee813502e.png)
![[Diagram]](../../diagrams/51/b7d14e0d68505f3d5e4705d5ce08dfec.png)
![[Diagram]](../../diagrams/20/5d102498d52c3d29663d9bac5fa19633.png)
![[Diagram]](../../diagrams/22/72ad89f8881803d458a6d63ae81e8b96.png)
![[Diagram]](../../diagrams/44/60dd343eb1ee429a0ae3ba2d2702e154.png)
![[Diagram]](../../diagrams/39/07a189ab51674e63d304de4e085fc1d9.png)
![[Diagram]](../../diagrams/9/66fc9aaf061a04dfff7a7bf1f792b41e.png)
![[Diagram]](../../diagrams/38/441e6bb40ff699fea27f4576b434da8d.png)
![[Diagram]](../../diagrams/6/ed4ebb23ed8cd1cc953d83ce9d355490.png)
![[Diagram]](../../diagrams/26/5ad937dd1dfb2ae974ec2ac95ba3768f.png)
![[Diagram]](../../diagrams/26/5a4cf882052d936ae31c8ca1fa46a49b.png)
![[Diagram]](../../diagrams/43/994898e725718cdd7c0abf7b9e22f0bf.png)
![[Diagram]](../../diagrams/2/78d21c660e5da26ac8224c548e0e2ce9.png)
![[Diagram]](../../diagrams/40/8cc5aa969a3ca39ce7ea1963f240a8a5.png)
![[Diagram]](../../diagrams/2/0a6414de5b1fccd264956254e72adc57.png)
![[Diagram]](../../diagrams/29/ca74999cc41d87f21a97defae59bcb1f.png)
![[Diagram]](../../diagrams/36/f370a2167135045067cb296912fb8232.png)
![[Diagram]](../../diagrams/8/336496e70e381aa125ab4ac49e2fc183.png)
![[Diagram]](../../diagrams/46/8e0a2cea50672f1ce2d1049a96e87398.png)
![[Diagram]](../../diagrams/33/242e8fd0bbccd88f608f6e55105d2c3a.png)
![[Diagram]](../../diagrams/18/a166332ddddacf96b1cf93e1714070e2.png)
![[Diagram]](../../diagrams/50/c55e361225d50dbb7cae4ecfc89b927f.png)
![[Diagram]](../../diagrams/51/a14289acae713d32702ce89d01f12377.png)
![[Diagram]](../../diagrams/12/5e5f7429e17b89d493ef8a21748530d4.png)
![[Diagram]](../../diagrams/11/9c7d4e2df8b4431b5b8aba556d485705.png)
![[Diagram]](../../diagrams/42/b1bd29eb34c11bab0ba49a51a33945c9.png)
![[Diagram]](../../diagrams/45/fe5c8e5b55dfb9d53b03422008649923.png)
![[Diagram]](../../diagrams/40/51991bef23976b9f4c78869c57c65563.png)
![[Diagram]](../../diagrams/4/40f40bfc955ced69c28aafdbe2cb7342.png)
![[Diagram]](../../diagrams/4/25500092528dda317adbd317dcab0ba9.png)
![[Diagram]](../../diagrams/11/973b9423fd5a5da99d4987403585fb90.png)
![[Diagram]](../../diagrams/5/80fe1b351733a8e2e57945d7679eabb0.png)
![[Diagram]](../../diagrams/31/87fdf2d603706a5280931a0520a20104.png)
![[Diagram]](../../diagrams/41/fb485876090535b0ebbbf6dd02bec784.png)
![[Diagram]](../../diagrams/51/e35705461e620f3d041e121ebd4742d1.png)
![[Diagram]](../../diagrams/27/0d9d16018af1feb465b5df7ad8bc7e17.png)
![[Diagram]](../../diagrams/17/24d6e71aede86c073ef2b1222b191a02.png)
![[Diagram]](../../diagrams/42/461ce40ff2d5e770f5922aa133160dff.png)
![[Diagram]](../../diagrams/13/a6720a0b68cb8ac0ba8329aeb82cc30c.png)
![[Diagram]](../../diagrams/7/f475019d8911b0204ced7ac6d8f57285.png)
![[Diagram]](../../diagrams/8/209bfc5630103cb7cf36253699ddc45e.png)
![[Diagram]](../../diagrams/0/52a30999df1bf4d8a63f1d6f52b5c68e.png)
![[Diagram]](../../diagrams/34/efd8e0645a61bfed5dfa2c3220c0ed12.png)
![[Diagram]](../../diagrams/8/fa9cc14aac948f6ff8f99420d17275bb.png)
![[Diagram]](../../diagrams/50/213706888e5eee77c6e4e0338e8c4024.png)
![[Diagram]](../../diagrams/31/674a2b1641704f9d8e32771b27a38792.png)
![[Diagram]](../../diagrams/32/8d64a2f467062d149d9cd9bbcfb67608.png)
![[Diagram]](../../diagrams/23/a0156f6546174a8b2f273697976857fe.png)
![[Diagram]](../../diagrams/37/1f3b5773a029e441a57d223bfbe6b7a6.png)
![[Diagram]](../../diagrams/20/fcc6ce12ebeb555756b6197f82db360f.png)
![[Diagram]](../../diagrams/9/8bc919f2b44ce39055627648bd3d23fe.png)
![[Diagram]](../../diagrams/50/3871b120597c9fe9e993efad037785d2.png)
![[Diagram]](../../diagrams/7/c23103cbe63bd7a597e73c9d7cb91667.png)
![[Diagram]](../../diagrams/38/330b158fe415a2cd80a88d7108965b67.png)
![[Diagram]](../../diagrams/20/cef307d8f61fa1cdd5053a3e7e011f95.png)
![[Diagram]](../../diagrams/7/e09ec3cd004efb3c42bcbff72e1e87b2.png)
![[Diagram]](../../diagrams/27/e62bc20c5e97182f81b95a1c896108c1.png)
![[Diagram]](../../diagrams/31/63c8d4d15aaf2e313391797e39a58679.png)
![[Diagram]](../../diagrams/42/21deb3405c0c382c0e5cddd9725fd8f8.png)
![[Diagram]](../../diagrams/8/74a66b5176996af5f93c4e5a224ccbdd.png)
![[Diagram]](../../diagrams/38/c3ad7ad79df13cbf30b4f4ac6d0dba15.png)
![[Diagram]](../../diagrams/49/890dc0b4a731baee79cac1087b371c38.png)
![[Diagram]](../../diagrams/29/e6e91c2fbd3884209d31e4434a1d1709.png)
![[Diagram]](../../diagrams/26/eec895061d956bcfa5cf7902c60ab676.png)
![[Diagram]](../../diagrams/39/406d950b2d864767d0cd4ef0b266c66d.png)
![[Diagram]](../../diagrams/11/6c435fc8febf45616fec881f595a16db.png)
![[Diagram]](../../diagrams/34/4218656983f57e71fd5412be98517db9.png)
![[Diagram]](../../diagrams/10/acd0f6db504b6cff427cb9d3df99216b.png)
![[Diagram]](../../diagrams/46/9ba1e8bbe31a43ddb919c5710386779b.png)
![[Diagram]](../../diagrams/34/37da247e0f4bda64bf40a046b668ee45.png)
![[Diagram]](../../diagrams/22/ff18f5946eea9f5d2357382690af2f3d.png)
![[Diagram]](../../diagrams/16/acb0b834864791df17c9911c88582f72.png)
![[Diagram]](../../diagrams/44/9d6ff1b189125e1c65e36be534b103e3.png)
![[Diagram]](../../diagrams/13/a5c7587616e0906bdd488dd101804791.png)
![[Diagram]](../../diagrams/43/79e618d47d5f09b5cb0214b832381531.png)
![[Diagram]](../../diagrams/8/13163792ac8951c5aa654c44e2864524.png)
![[Diagram]](../../diagrams/7/62de1537b91a4dc15fb5872ebc2e720c.png)
![[Diagram]](../../diagrams/8/20489aaf9cc2a92b60739bf5701938a1.png)
![[Diagram]](../../diagrams/17/db8d5a79c8dc082f73ffb5882d549120.png)
![[Diagram]](../../diagrams/21/9be67476b5eff512f091e94af955076a.png)
![[Diagram]](../../diagrams/44/6b680c7ac884dc42bd83a9b012a40579.png)
![[Diagram]](../../diagrams/50/a54d05b787c577e79405f44c6b7cb3f6.png)
![[Diagram]](../../diagrams/27/0a660fb9036e56b27f38e824d6499f86.png)
![[Diagram]](../../diagrams/45/d9cee21f7aa80e7b3efd07107eba65fc.png)
![[Diagram]](../../diagrams/8/ce02453e11c00cb82ed7edb0cc77ca05.png)
![[Diagram]](../../diagrams/46/1db8bec96ac6f4ea954072d069a08643.png)
![[Diagram]](../../diagrams/25/3c74d59670cb2b94f7bb27e3fbc04214.png)
![[Diagram]](../../diagrams/29/5ddbaecedc36bcc67eb477e1959eb0e9.png)
![[Diagram]](../../diagrams/22/73e38cbe7959149d69e7d88eec10cace.png)
![[Diagram]](../../diagrams/0/ebf3ae69ecb570ce73cb680a669777aa.png)
![[Diagram]](../../diagrams/16/26aa7482e790c434a5ca7da9cf36ed31.png)
![[Diagram]](../../diagrams/10/74a55e68706f8210ac96e09866cee78b.png)
![[Diagram]](../../diagrams/3/c0c8b44f387ec438feac3e50b17eca7a.png)
![[Diagram]](../../diagrams/1/686e134318040a0766d2f71b6e74134a.png)
![[Diagram]](../../diagrams/16/7e188fb908f55f74a726981b7f5d5d14.png)

![[Diagram]](../../diagrams/44/da978c1f4fb56dae3199b8b02b19da96.png)


![[Diagram]](../../diagrams/30/3eecf714d0ddf9017ef286710da9056e.png)
![[Diagram]](../../diagrams/13/c2e3e14ff3785c7345c708f26641fa2a.png)
![[Diagram]](../../diagrams/44/05546d5a171118ede4d4793427fe84da.png)
![[Diagram]](../../diagrams/7/96a5db28f91f3f0583b5d3ee9302457e.png)
![[Diagram]](../../diagrams/34/58badd44fbb761856a9349c47dca65ab.png)
![[Diagram]](../../diagrams/9/65748e3e53bbdd5da800b73a4b62379d.png)
![[Diagram]](../../diagrams/47/9956c221509bd026e81d9a7e1b4141b3.png)
![[Diagram]](../../diagrams/36/2c6a71c5c7fb964c265050b6c7924906.png)
![[Diagram]](../../diagrams/51/d45d61351f241b694bf707739a54fa31.png)
![[Diagram]](../../diagrams/25/132783690a0b5493933365c2167f5f6e.png)
![[Diagram]](../../diagrams/35/7dbc369855e7a977346ddd03f95a9174.png)
![[Diagram]](../../diagrams/6/ce0268e412ad2bfae92ed1f6ef46b198.png)
![[Diagram]](../../diagrams/2/c5e0396a5014611709516fcf08ca73af.png)
![[Diagram]](../../diagrams/15/8234ce3222fbae952215b282f7b63ba0.png)
![[Diagram]](../../diagrams/47/b23b34435e947e427aafe81a4c7a548a.png)
![[Diagram]](../../diagrams/3/476846f5c7ec269f34957ed3b089ebf5.png)
![[Diagram]](../../diagrams/19/8874824d0f71a967f44e4b93ce5afdae.png)
![[Diagram]](../../diagrams/52/a872b231755a90407a8ddbd58084674c.png)
![[Diagram]](../../diagrams/4/dde24f1baf6cd87f3baeb99c80073326.png)
![[Diagram]](../../diagrams/1/496e101a6c5bf2ff7642ac1adb3b13ff.png)
![[Diagram]](../../diagrams/0/7b25a600f1505cc58d96a702e7095167.png)
![[Diagram]](../../diagrams/42/ae422d72656146b0ffa5204739a99e52.png)
![[Diagram]](../../diagrams/5/c8aaa15bcbb6d822402abca90cd53023.png)
![[Diagram]](../../diagrams/26/e28508cee8fbdaa75aedb715d5c8a13e.png)
![[Diagram]](../../diagrams/38/e08d32e685c26800e0e74b11e7b8978a.png)
![[Diagram]](../../diagrams/26/fd7377f27c13105e3c4fc557b4535f77.png)
![[Diagram]](../../diagrams/0/82f0a023afddd23709559a3d80165443.png)
![[Diagram]](../../diagrams/7/0ed35ada94adc8403c3d90dae32e1c6a.png)
![[Diagram]](../../diagrams/37/905aa6261bd229424d9a4b78ef4cd73f.png)
![[Diagram]](../../diagrams/37/ce5f98d6cc5b4af87acaa88a4193a975.png)
![[Diagram]](../../diagrams/21/f79299dbc14602d70e233cf040037c33.png)
![[Diagram]](../../diagrams/6/67dc47e042a8d55dfc97c56c5da764bd.png)
![[Diagram]](../../diagrams/17/6d14cb1050e4cbfec34b759f38aba778.png)
![[Diagram]](../../diagrams/20/f406d91f7b042ad83d8b62ca6596a545.png)
![[Diagram]](../../diagrams/12/b9a309261feb21bea789cdee335c0145.png)
![[Diagram]](../../diagrams/26/fbef9b44f847588b83e9f8887c7a29b5.png)
![[Diagram]](../../diagrams/39/a56b3accbe059d95c7ef97f368e606a6.png)
![[Diagram]](../../diagrams/49/48081942a0c27e7222f0b61867530e5c.png)
![[Diagram]](../../diagrams/51/035bc2809be6f3accc05f93c8aff758f.png)
![[Diagram]](../../diagrams/15/fdfd5381cb1560d5c67eaa069c984572.png)
![[Diagram]](../../diagrams/24/05184f8769de0e461258ae1b9be719a7.png)
![[Diagram]](../../diagrams/8/54ad16dcd473f12a574f41213e935a52.png)
![[Diagram]](../../diagrams/4/3162f501de9dc9114d4fb6f115c54423.png)
![[Diagram]](../../diagrams/47/073f0fd1482bb3abafccb8ff082f2b6a.png)
![[Diagram]](../../diagrams/3/58db31fa8c1e84049140f9cbb9dd92cf.png)
![[Diagram]](../../diagrams/35/4b3da2146d635e9b1fa637120cb1aa72.png)
![[Diagram]](../../diagrams/1/3005bc39fe700d3950259cc1b3200d8c.png)
![[Diagram]](../../diagrams/12/abe599c560b54bf0ade8b7639f33aee0.png)
![[Diagram]](../../diagrams/16/c55c6659ce40be0219b752858dab9a96.png)
![[Diagram]](../../diagrams/39/7f8fa02831c943bb2a4602f14f98b899.png)
![[Diagram]](../../diagrams/30/6cffff9725713834518695999008d1e3.png)
![[Diagram]](../../diagrams/16/d5180d4380f0b8676c86023fc019c4fa.png)
![[Diagram]](../../diagrams/43/dcde0fec6ca058fecd339815e4f006fc.png)
![[Diagram]](../../diagrams/14/c5bf82931e822341aa11e6c2baf34e2b.png)
![[Diagram]](../../diagrams/33/f516fb5e195194843908bf1466c38600.png)
![[Diagram]](../../diagrams/40/b0e23b0450ca5800eb912c280233b30d.png)
![[Diagram]](../../diagrams/3/054e4bd0f1f16497a0f14589e020f19c.png)
![[Diagram]](../../diagrams/17/ed72a154c8cd986829e3cb279c14b02f.png)
![[Diagram]](../../diagrams/12/ba120aacfc9a0af73dc45af506287bd1.png)
![[Diagram]](../../diagrams/5/c2e7fa5cb7c4d42c7ddbd30e9c376862.png)

![[Diagram]](../../diagrams/25/b8a9a94325608b888c6de742672f7b36.png)
![[Diagram]](../../diagrams/35/bee0e97a8616a4e8cbcbb5b7e217cbe3.png)
![[Diagram]](../../diagrams/39/ca6e8ca96119b476b2ad78f22548c783.png)
![[Diagram]](../../diagrams/6/15d1120d57c0d11b8dfe391f6d4407fa.png)
![[Diagram]](../../diagrams/51/ceeac7e52a52e6e632076fbc75e6c3ee.png)
![[Diagram]](../../diagrams/38/2e4b05447aea01e6e89c48feb7127c9c.png)
![[Diagram]](../../diagrams/20/5829a7a764bbb9e29b99f506dc57455d.png)
![[Diagram]](../../diagrams/37/8a9fe6a9f9c8f6c8785f9c97b21a94ad.png)
![[Diagram]](../../diagrams/52/64cddb20b6461200fea741eb6e839bb2.png)
![[Diagram]](../../diagrams/5/406b132208ceb690ed525e20c02a0225.png)
![[Diagram]](../../diagrams/52/ad1b2f5e76d49ad29fcb48398930ea23.png)
![[Diagram]](../../diagrams/42/ef9bc7e3a68a760a2dec6cce38e07779.png)

![[Diagram]](../../diagrams/8/d4b6d4c98699b3438bf48f67d1e06e04.png)
![[Diagram]](../../diagrams/3/455411c33b6120fa87062f712a0070c7.png)
![[Diagram]](../../diagrams/14/8f09fe357bd8c6d61a1562ff600a31eb.png)
![[Diagram]](../../diagrams/21/92a670242959898bb0a1592627b69555.png)
![[Diagram]](../../diagrams/6/43fed73f656930d532b1f4c1be37f0eb.png)
![[Diagram]](../../diagrams/49/ac8bd68b9afda27e40e2dcc7f89692ad.png)
![[Diagram]](../../diagrams/34/8d039f62a739df61d2941c0996cba936.png)
![[Diagram]](../../diagrams/4/fbfa9ab663b18a4aad82bae4e1b5ef1f.png)
![[Diagram]](../../diagrams/20/351bbd74d1deb86cbb74b6531ec21007.png)
![[Diagram]](../../diagrams/4/1157724b60b2f28ee62e9c2624d2b824.png)
![[Diagram]](../../diagrams/47/50e8eea5c1aa0c199ade2a5498f37906.png)
![[Diagram]](../../diagrams/46/88a2b32803285c9c5455935cb2f8f96a.png)
![[Diagram]](../../diagrams/34/fa3014def055aa72c07b57a22812456e.png)
![[Diagram]](../../diagrams/39/9d64658cb8f76f1c223cb162fc3f1d7a.png)
![[Diagram]](../../diagrams/47/180558ff58baf154e4fc61ca07de11af.png)
![[Diagram]](../../diagrams/13/456847f22b68031720d7c16c4a3cfbad.png)
![[Diagram]](../../diagrams/42/265e2a1a707b2517f1a38375e2a9621e.png)
![[Diagram]](../../diagrams/36/441cf067664d6cea505581b321c86724.png)
![[Diagram]](../../diagrams/46/9348c6a51d4cbdf4200576d47a91f136.png)
![[Diagram]](../../diagrams/41/c292e18b8b3ef0f54da53cb659f4c64c.png)
![[Diagram]](../../diagrams/41/3b83de4ae50146ad3040695ff2e0f85a.png)
![[Diagram]](../../diagrams/9/2637ac36beceb6f1a9958bd8f8fe1d69.png)
![[Diagram]](../../diagrams/10/8248f2628b6af2eaa724c94ba1bc9909.png)
![[Diagram]](../../diagrams/14/2e476a5dc9575caaeda8c55b54e105f8.png)
![[Diagram]](../../diagrams/36/8fe56dee88b4ad264ccd45e3e0e7bcb6.png)
![[Diagram]](../../diagrams/17/7a601140fcb004216d68e70418065413.png)
![[Diagram]](../../diagrams/10/ea7016e6190e2e7a0a48a3eb9d4cd785.png)
![[Diagram]](../../diagrams/41/445adba7d280912a85fbba068f01f238.png)
![[Diagram]](../../diagrams/14/fc4fc97774f81a6d6cb9b22a668de272.png)
![[Diagram]](../../diagrams/4/4c365898f735e1b2d2b874ff5f299a68.png)
![[Diagram]](../../diagrams/7/93750c574b7710c65a5a211fa5ad8a32.png)
![[Diagram]](../../diagrams/6/cdd37d88b7318351e702af060c52379e.png)
![[Diagram]](../../diagrams/32/5296ed81e0f8f368270c3cb014408cf8.png)
![[Diagram]](../../diagrams/3/a0234fe0725daff7814ff02473ad8eb4.png)
![[Diagram]](../../diagrams/4/55c91aaf2d521a3ededd5168b53c947f.png)
![[Diagram]](../../diagrams/10/bde86498f92026e72950091b84086b03.png)
![[Diagram]](../../diagrams/27/6fc8de0dbe07a3f92bab7173b3593113.png)
![[Diagram]](../../diagrams/26/8c673ceee8eac3a12117ccb1a7f4ed0a.png)
![[Diagram]](../../diagrams/22/364bdb29e684cd23594799207b94492d.png)
![[Diagram]](../../diagrams/5/c067e7fd72bb00b6b81489f1e5c1442b.png)
![[Diagram]](../../diagrams/40/21a0d1d41447f30a48d758ea777f1325.png)
![[Diagram]](../../diagrams/13/6ce5529d861b522ec9b3c3fac7a0951a.png)
![[Diagram]](../../diagrams/22/bd01476f974f98ecd6a6b2172f658c67.png)
![[Diagram]](../../diagrams/32/f60b582bd37e00d80714b7b17b48aeda.png)
![[Diagram]](../../diagrams/37/e67fd58743ce1193242c415e6d90f132.png)
![[Diagram]](../../diagrams/36/2bcb47aeee349d5f70fdd696acac21e9.png)
![[Diagram]](../../diagrams/0/e9fe415ebb45ea9173ed9f3a921b42c7.png)
![[Diagram]](../../diagrams/13/a2a6b04ad7623ff190c25efbe81efb87.png)
![[Diagram]](../../diagrams/33/bdc2e39bb63f4e28eb3acb58e4c62152.png)
![[Diagram]](../../diagrams/25/fe19474f165d80b5392497186b034e20.png)


![[Diagram]](../../diagrams/28/34c9751826c6676703190e1e6afe8fe6.png)
![[Diagram]](../../diagrams/30/15664eca11e8f1dfa95c4f301d0e1070.png)
![[Diagram]](../../diagrams/8/80fefde43254ef91ade8283dcf9f0114.png)
![[Diagram]](../../diagrams/16/e88faa33de616148002251dbb5a5c27d.png)
![[Diagram]](../../diagrams/51/33f81262a15d5d55a88cf47736226fe9.png)
![[Diagram]](../../diagrams/35/72aa55acc007dfcb3dcdac778796db38.png)
![[Diagram]](../../diagrams/36/942a02f7355a8480fca3a5ac2dd6ef17.png)
![[Diagram]](../../diagrams/50/ece93b6a8b5bd366f932ad018c01601d.png)
![[Diagram]](../../diagrams/13/0924fde32a38e8729e11bb8d044fa2b2.png)
![[Diagram]](../../diagrams/18/ddfb1972840b847083c8d68f81995ac7.png)
![[Diagram]](../../diagrams/20/5d447ec4ad319329b7a48f14f83b5f10.png)
![[Diagram]](../../diagrams/6/ffdffee4d2b38a7cfa43d3d01ba740ea.png)
![[Diagram]](../../diagrams/1/eb85ad881b11eb3bd369c6adc6d6f4af.png)
![[Diagram]](../../diagrams/26/0f1b832a7a46ab1b0274efa374a63462.png)
![[Diagram]](../../diagrams/17/348412254fbfb2fa6fd8c921eb4a4335.png)
![[Diagram]](../../diagrams/5/44876748ed4a2a34aebd9ae6899edc5f.png)
![[Diagram]](../../diagrams/20/e3daf90db0b3ca757ef1f52474033331.png)
![[Diagram]](../../diagrams/49/8ca343a465b9136450c276002b23fe94.png)
![[Diagram]](../../diagrams/28/5b498be2485f33b3fa1dfa00444fe0f8.png)
![[Diagram]](../../diagrams/38/5674c04bf1fb8a67cfc3b9a116cb8624.png)
![[Diagram]](../../diagrams/7/9157b7773b2c9ab01a5d2bacff9dfb40.png)
![[Diagram]](../../diagrams/17/611799151aedd729b708095264d16d71.png)
![[Diagram]](../../diagrams/13/db043e51dee93c0aff8ff66822a7ac75.png)
![[Diagram]](../../diagrams/20/6afeaadcaada452d62645032b4b976a2.png)
![[Diagram]](../../diagrams/52/ef7cf60e10ff81a0c54934b74a27372d.png)
![[Diagram]](../../diagrams/43/569db4ce08d1f50c3308e1997763c381.png)
![[Diagram]](../../diagrams/43/dde3cd9bfe78d8bb7af36bf40b4b15f6.png)
![[Diagram]](../../diagrams/25/9ec4a89ca5b9ba9d1947fc1155fc1667.png)
![[Diagram]](../../diagrams/39/467ee6317d6e38847c7406cb9b7fc101.png)
![[Diagram]](../../diagrams/19/002b7c56bca1af1bfd890cae70c92259.png)
![[Diagram]](../../diagrams/27/c3a3c2254ec8e1089367e94d04d3c7d6.png)
![[Diagram]](../../diagrams/49/db454ba5820d5c83d7a1cc708e836322.png)
![[Diagram]](../../diagrams/28/253f74fcbc994569d1d67cd1ac1a81d6.png)
![[Diagram]](../../diagrams/38/bfba1023191edf14be45122af4f51890.png)
![[Diagram]](../../diagrams/29/8798a693e87c4789f3cb6048e11f8ab8.png)
![[Diagram]](../../diagrams/4/84c68bc1cb24a4fc526726bd41ceb652.png)
![[Diagram]](../../diagrams/14/9666f33e5bb2582f105fb35d975333a5.png)
![[Diagram]](../../diagrams/44/32a08879488a4b2ea71694dd42f4172d.png)
![[Diagram]](../../diagrams/13/ea25ea4730a4761694bccb788f28fc7c.png)
![[Diagram]](../../diagrams/2/51211f18fab60a656a62fbb3cc5a019b.png)
![[Diagram]](../../diagrams/27/0e8508b7216f56ac5397f9173a1e4f89.png)
![[Diagram]](../../diagrams/14/0ce7d596a8d1346382ea8e1f5a42d6bf.png)
![[Diagram]](../../diagrams/4/9e82eac4214eaf5c076cd907b7963a87.png)
![[Diagram]](../../diagrams/29/0fba37182bb3549611bb623bad2c4498.png)
![[Diagram]](../../diagrams/17/ed28845b82159a7a886ec891ead2b4c9.png)
![[Diagram]](../../diagrams/47/52fd05c9482078d3b75ffe0829a26282.png)
![[Diagram]](../../diagrams/34/97b619d173c2b934866fe61507745a57.png)
![[Diagram]](../../diagrams/22/bb162f745ce8e12e29e6bf214d0862dc.png)
![[Diagram]](../../diagrams/9/5cae38234cb3dd81c7eb0bd6e8f71039.png)
![[Diagram]](../../diagrams/47/42cbc6a16498ef725d3537340eea2ba4.png)
![[Diagram]](../../diagrams/14/0ed832e7a0c01f0dfc472bfe571f5f5f.png)
![[Diagram]](../../diagrams/10/e9432dcfa9043af6c17f877b3ea8147b.png)
![[Diagram]](../../diagrams/25/dbd1cee8d1cc6a4573a29a3967c31afa.png)
![[Diagram]](../../diagrams/20/d14b5046ca8354729439e8c4e6303d43.png)
![[Diagram]](../../diagrams/50/f745e978ef2cf650fd5e363286d61111.png)


![[Diagram]](../../diagrams/0/b2e51aae46ec47613a5d18f9d724adb9.png)
![[Diagram]](../../diagrams/27/d19b79b64d7889a013586b97395cd9f5.png)
![[Diagram]](../../diagrams/42/0ba7c22d2e739055af65cb286aaf6c7d.png)
![[Diagram]](../../diagrams/44/8a1dde7153b9c3040b855b9ffd75ef34.png)
![[Diagram]](../../diagrams/40/eb9e3351996813dbc9fd4dd9f15738fb.png)
![[Diagram]](../../diagrams/41/1468168df1876be8f3e4887aa57561ee.png)
![[Diagram]](../../diagrams/30/789b2df34ec3c5b9d60453ee2cb4a226.png)
![[Diagram]](../../diagrams/26/b344dbc6869d7a750ff5e0f0e8bca329.png)
![[Diagram]](../../diagrams/12/f835e12d7c8e7715de089f45fca32f0d.png)
![[Diagram]](../../diagrams/51/cfda2a81ba199994b02c0e37288d3734.png)
![[Diagram]](../../diagrams/2/cd210b9138aedc7e691ae7edfb420bbb.png)
![[Diagram]](../../diagrams/36/aa7a3fed3618cbfc4033ad5c3d4d6630.png)
![[Diagram]](../../diagrams/14/d26e827eccf59e0a534bbf76e0bfae03.png)
![[Diagram]](../../diagrams/22/0067cacc1f1054ebcbe59987f0250a1e.png)
![[Diagram]](../../diagrams/30/1b2b837040bbd3c48a4a06a655cd72ee.png)
![[Diagram]](../../diagrams/31/3853f75655041e289af80f1c3be1ed7f.png)
![[Diagram]](../../diagrams/3/d5279acd5d1ae8f0fd69d0bf82e9d277.png)
![[Diagram]](../../diagrams/4/fe3f8d6e5671ad3b0e3c5985ab45682f.png)
![[Diagram]](../../diagrams/15/1e92594038c4a9ee47143eb0b51949f0.png)
![[Diagram]](../../diagrams/48/73b3332302db0894ea255c40c7cf8759.png)
![[Diagram]](../../diagrams/18/75226a40da72de37bbb7b1e56841e7cb.png)
![[Diagram]](../../diagrams/39/575dacfd48dd18a3640d832216fcc127.png)
![[Diagram]](../../diagrams/21/12d6e40501b4b94968af98a9eb31d719.png)
![[Diagram]](../../diagrams/16/25d5ed6ff0258a50f1659e08d0cec06c.png)
![[Diagram]](../../diagrams/39/d429c1dd56352225a890a4b3bec658da.png)
![[Diagram]](../../diagrams/43/ec99462cae96b3c5e18ffe5d7252a63f.png)
![[Diagram]](../../diagrams/48/4224d841757ce6e275440ba0178f7a87.png)
![[Diagram]](../../diagrams/48/f32c7f8591cc1a508b3f1f086b1e8a6b.png)
![[Diagram]](../../diagrams/40/2cb88d0993d3d461dfec82d3f6e0de53.png)
![[Diagram]](../../diagrams/35/27d6999c07fcca146a2b25ed0b01bda9.png)
![[Diagram]](../../diagrams/2/c197c932708163964ce44bfa765188ba.png)
![[Diagram]](../../diagrams/49/fef26bbfabdb25cfc9707faeb921e640.png)
![[Diagram]](../../diagrams/30/0397c5fc1f4e239507b8a51aece0a881.png)
![[Diagram]](../../diagrams/0/448ea3e3b537f5735945dddc21392d25.png)
![[Diagram]](../../diagrams/30/a8614b842e3bd202398b95cb5650547f.png)
![[Diagram]](../../diagrams/3/f2b6f75ae5180ab370195bd412824757.png)

![[Diagram]](../../diagrams/14/f530ff403bfe31fd95e5328ea24e3d4b.png)
![[Diagram]](../../diagrams/20/0939ce9b2231e240714b53e52c704872.png)
![[Diagram]](../../diagrams/4/c9e616400926f5c65992fa698cb1c7b3.png)
![[Diagram]](../../diagrams/37/263233941be5384cf14019e4f102551c.png)
![[Diagram]](../../diagrams/39/fdb6f3f41eca7003b8e161a5a6401c76.png)
![[Diagram]](../../diagrams/18/13bcc03107319cf70942daa389f0b4cf.png)
![[Diagram]](../../diagrams/14/13185d7514a6fbd51e44d08cd782f57f.png)
![[Diagram]](../../diagrams/23/a626912ce5d0771ae1a3f211c68c57ae.png)
![[Diagram]](../../diagrams/29/169279baed86a6dfdae286fcee08c349.png)
![[Diagram]](../../diagrams/37/71ab23dbd41e2227f21a0df731179adf.png)
![[Diagram]](../../diagrams/51/cb01695ac8cd7d2fcb9ded25c107de19.png)
![[Diagram]](../../diagrams/2/6aef849e91beb626ad438b33bd09c53e.png)
![[Diagram]](../../diagrams/36/ff9a3beed9027a6a1e3e5ce62edda5ff.png)
![[Diagram]](../../diagrams/7/df5c51bf0da94a4e5b4a62f8bab9010b.png)
![[Diagram]](../../diagrams/37/aa301aed98cfbb21dace9c39a01395c4.png)
![[Diagram]](../../diagrams/5/f4e2e9091b626adcb0070ad826f3f067.png)
![[Diagram]](../../diagrams/36/a5e6d65243c44a53b57f9717fb67ce2c.png)
![[Diagram]](../../diagrams/2/0a732e3cb43f041d992a13dc59ad7302.png)
![[Diagram]](../../diagrams/39/91392a737f193d0e63b5ae7aecc60402.png)
![[Diagram]](../../diagrams/25/e816c8ba3d8d1e27ac7cb04d05b18d6c.png)
![[Diagram]](../../diagrams/1/ef0997781c42ef3e8c197fdab9e84c5d.png)
![[Diagram]](../../diagrams/37/ff0cda141b6a42582307837938f0f249.png)
![[Diagram]](../../diagrams/44/c49acfc85c483e18b93223c2e178a21f.png)
![[Diagram]](../../diagrams/49/f60f3c517136e120e545d07c516ecaa4.png)
![[Diagram]](../../diagrams/0/1c81c22d70d3d75a7aab11af0e6f00dd.png)
![[Diagram]](../../diagrams/32/1e18805525d62975e05bffa1f9d097d7.png)
![[Diagram]](../../diagrams/9/09133556c48c2dfb963a69a5d8c7c3ba.png)
![[Diagram]](../../diagrams/41/27fb0fa16454b8b814610237ec777a5f.png)
![[Diagram]](../../diagrams/3/b890be8a5c52a1b395ad3dc353e160f5.png)
![[Diagram]](../../diagrams/45/6e4f04f77ae2770c0f5fe33325acfbe0.png)
![[Diagram]](../../diagrams/23/fb6ef55814c303de522df5d65a38c0dd.png)
![[Diagram]](../../diagrams/29/8792387b53f81d9d4f6ae57703af6c56.png)
![[Diagram]](../../diagrams/22/8dc7c8982457be95df94a58bebae0878.png)
![[Diagram]](../../diagrams/30/37b80a86ea870760620d25e6d229499a.png)
![[Diagram]](../../diagrams/14/062dd8d4c823856f3dbd66d5ae8b3f2e.png)
![[Diagram]](../../diagrams/7/5c1451389ef3768a595879d734434de0.png)
![[Diagram]](../../diagrams/34/36239778cd1753fb48fa880408da3119.png)
![[Diagram]](../../diagrams/50/657e8c259e109a72ae71054f0bc08e35.png)
![[Diagram]](../../diagrams/16/d264403562e9a746da884e697a611fdf.png)
![[Diagram]](../../diagrams/21/1a34ecd0cdcf5bc95e8f13e9f44a511f.png)
![[Diagram]](../../diagrams/9/57fd7a2f57b3926671462a48647b6869.png)
![[Diagram]](../../diagrams/38/38099f8f118b11b9b91313372271098c.png)
![[Diagram]](../../diagrams/2/e03a4c1bc758e63935c17293478f24f2.png)
![[Diagram]](../../diagrams/10/dbce00eb6527411e40c5fa5ef3b98d4d.png)
![[Diagram]](../../diagrams/32/4906dbedbd3ab645ce75b90e4db7fc65.png)
![[Diagram]](../../diagrams/10/97bed19f2ef47aff4bf6d248cf5cbe2c.png)
![[Diagram]](../../diagrams/32/ebf4e4379f7b64c2e902c28cb8a49cb6.png)
![[Diagram]](../../diagrams/21/431cee166ceaf6a1722c144cacf1d7bc.png)
![[Diagram]](../../diagrams/27/a8aa062a7ec3b227753bdbee7208142f.png)
![[Diagram]](../../diagrams/42/9802bc75ab3789066d90b16f72b6d091.png)
![[Diagram]](../../diagrams/24/5c45935982781463c3573e5c7c34c8c7.png)
![[Diagram]](../../diagrams/17/9d6537cc14c18c51243584c5fb3eb994.png)
![[Diagram]](../../diagrams/5/7596dea22f8f84d46217c4271cbd8f98.png)
![[Diagram]](../../diagrams/12/50281a87ad49d0d6e333f1907e7a8bc2.png)
![[Diagram]](../../diagrams/4/31bb110fa080a9c4b273296198b154e7.png)
![[Diagram]](../../diagrams/33/b5c5027c74351d171607798e263aacd2.png)
![[Diagram]](../../diagrams/43/270435fb96c26bfcb1469e9c7075edba.png)
![[Diagram]](../../diagrams/36/2d5a2a32c35e3d55c057f6cf1873a725.png)
![[Diagram]](../../diagrams/45/63ec4adbc988da97410123258c8ce38b.png)
![[Diagram]](../../diagrams/47/bdfd0b62afd2671a12c7e1bbdd95b8e2.png)
![[Diagram]](../../diagrams/8/38c5d23a90e9d02398c501143059219d.png)
![[Diagram]](../../diagrams/4/e39420f0ccedcdd5fe222fe3e63a21b9.png)
![[Diagram]](../../diagrams/46/3c10f1adb9d93c835c026880a75eda9f.png)
![[Diagram]](../../diagrams/2/78034a9f5b4241239764e6978525ed87.png)
![[Diagram]](../../diagrams/7/8bb438fe6a0bfe04b933a1cb8d1578c2.png)
![[Diagram]](../../diagrams/2/ebe88bf3fe89216fad6af20aad85d370.png)
![[Diagram]](../../diagrams/9/ab303bd7705b5c3ff202f766b1bf70e8.png)
![[Diagram]](../../diagrams/14/8f37c7a8b2cc1dc88ec2ee1c36a12f6e.png)
![[Diagram]](../../diagrams/13/7080f9499070b89479c0afcb8d85f865.png)
![[Diagram]](../../diagrams/50/191d19ed25ab452be8f3a203844d3cb6.png)
![[Diagram]](../../diagrams/45/a32ce78e9a290410579712d1857fed7d.png)
![[Diagram]](../../diagrams/17/eb356eeccc7bdbb85095bbe1bf0e2340.png)
![[Diagram]](../../diagrams/7/3490371a4b6f431ac4a67bee17bbced6.png)
![[Diagram]](../../diagrams/11/49fcff7a757816d0f0c3039694f9b7d4.png)
![[Diagram]](../../diagrams/40/3334167cbeb63fb1d2d12c7dc9446d20.png)
![[Diagram]](../../diagrams/8/4a975d29f17fac2a4b05d9a8919db0e4.png)
![[Diagram]](../../diagrams/14/57b95ab450ddc26fb7858bdbbb39543b.png)
![[Diagram]](../../diagrams/18/55dd890d506d9b6fb6f8985cc1bcb147.png)
![[Diagram]](../../diagrams/29/d1d2de47eb1f8594325010230e352861.png)
![[Diagram]](../../diagrams/26/c12e6295917ac809341c04c684762dab.png)
![[Diagram]](../../diagrams/15/052ff4efb2f9a010fcc46ce83658fb9a.png)
![[Diagram]](../../diagrams/49/8c64985ec26247e6e50a79826d29cb3e.png)
![[Diagram]](../../diagrams/26/f39012c6f0952b4d71e762548a16ba46.png)
![[Diagram]](../../diagrams/3/4d32a7a95ee7fef9b5490cec8ef18d9c.png)
![[Diagram]](../../diagrams/47/dd1bd591b9ac585fc9d7a38de882dc40.png)
![[Diagram]](../../diagrams/21/5fe84d156d35586bdb52f216126e785b.png)
![[Diagram]](../../diagrams/51/05fb1a0a2d43d50d660aa3efe20b68fe.png)
![[Diagram]](../../diagrams/18/1f0929b17a07f4f3b9b3db9d5db06c03.png)
![[Diagram]](../../diagrams/42/ad2457f7cd078235dc50423d66055380.png)
![[Diagram]](../../diagrams/11/bc90537304fa2f2766a4e3aae16da157.png)
![[Diagram]](../../diagrams/50/544a16aa67b7bcf8039952278267af13.png)
![[Diagram]](../../diagrams/23/482818e964a1de0d67d70016d5d49b67.png)
![[Diagram]](../../diagrams/48/f46f2630ef58c164560df9e2adadf04b.png)
![[Diagram]](../../diagrams/37/29a9f5307297f42804f68723e246fc98.png)
![[Diagram]](../../diagrams/29/1afa2289f3d1fa392770688b46110012.png)
![[Diagram]](../../diagrams/47/821d3bd9e8159e14e4556cb160126090.png)
![[Diagram]](../../diagrams/8/4f7d44ad72ed51fab876d1324f2176a6.png)
![[Diagram]](../../diagrams/15/14faec8a5f62c564d36ca7f28ad284fa.png)
![[Diagram]](../../diagrams/21/f8d69e0fc82a06a31d69404e1e6d1fe8.png)
![[Diagram]](../../diagrams/39/bf17d78f42d9729de24d6673b83212b9.png)
![[Diagram]](../../diagrams/31/a00d020dd78086f0758d6aea1316e69a.png)
![[Diagram]](../../diagrams/15/62b3004ad194f04e8d7f2c15fcb17956.png)
![[Diagram]](../../diagrams/1/2285cc9f41a8a55c13ae60ea8492d955.png)
![[Diagram]](../../diagrams/34/e2a31016d8f7f6979fd489430a52ab06.png)
![[Diagram]](../../diagrams/0/ffcdb5b2713299b0dd504769a7403f3c.png)
![[Diagram]](../../diagrams/9/7ff042d0ac063d9199bad0c304f32032.png)
![[Diagram]](../../diagrams/0/e4a021b51b782a485e610db0a6a125dd.png)
![[Diagram]](../../diagrams/3/5232390cf3503f1e3bc20eab2658dee2.png)
![[Diagram]](../../diagrams/50/e25b6e5e7a0f787f1be698bf02f1ffce.png)
![[Diagram]](../../diagrams/51/4680868bc52a6bedfe8d5fb3e310bcea.png)
![[Diagram]](../../diagrams/33/ac9bf345aa826630e21dfc5710093b19.png)
![[Diagram]](../../diagrams/41/2853132330d8571bdac798792df7b348.png)
![[Diagram]](../../diagrams/4/dd8605c1b173b54d87e5ace6c8666a52.png)
![[Diagram]](../../diagrams/52/ceff61861795e98bc009b35142d13cc7.png)
![[Diagram]](../../diagrams/17/31c6bbb796f8b3b7698fb710a111e4c5.png)
![[Diagram]](../../diagrams/32/62577bd4697d5bf9a0219d6407cd88f0.png)
![[Diagram]](../../diagrams/33/1db93e977e58e96fbc61423627689b3e.png)
![[Diagram]](../../diagrams/39/b21fd35073afb591963b2082a4ab1d9f.png)
![[Diagram]](../../diagrams/50/92132c1a1aaca30cc50469856093d14f.png)
![[Diagram]](../../diagrams/39/297fda68637765bad85529e3217429a0.png)
![[Diagram]](../../diagrams/36/a181c295f6d1e0e1c840a5f5108ef033.png)
![[Diagram]](../../diagrams/40/5bc9ff9982ea723cdb39457a0e0ae341.png)

![[Diagram]](../../diagrams/32/e8655e22421c9270d2d621a80b4c31ca.png)


![[Diagram]](../../diagrams/23/8d7b73209e604340712abc122628b7d3.png)
![[Diagram]](../../diagrams/16/6bad8837262b5684683c7de1ee6c2bd9.png)
![[Diagram]](../../diagrams/40/e914aa385d897ed9f4a7320961ef8eb0.png)
![[Diagram]](../../diagrams/16/459672087704cbe68eef4bf3f4cd7d55.png)
![[Diagram]](../../diagrams/1/a26cae9151022e397667e7d3dcf58126.png)
![[Diagram]](../../diagrams/13/c7b5c50943eb03de92a7246f09aeebce.png)
![[Diagram]](../../diagrams/27/9403e4746c1a38d01fbf25758a3f27a6.png)
![[Diagram]](../../diagrams/5/3a393dafb2f47b10529669830c63f961.png)
![[Diagram]](../../diagrams/6/41cb501b9a7fbbee2f142b97e1930382.png)
![[Diagram]](../../diagrams/49/6643544314a9eed936a4f6a648b9cb8b.png)
![[Diagram]](../../diagrams/29/77fb738e9428ee4aeaf526c77e4f82fa.png)
![[Diagram]](../../diagrams/35/4854e50707e1a03a1ceb1b992ade475e.png)
![[Diagram]](../../diagrams/25/34c069801bd1702a532b0b322cec2082.png)
![[Diagram]](../../diagrams/34/463a5d1292207b03915b577b203ae5d1.png)
![[Diagram]](../../diagrams/6/6b7795106faf9a22f513541a2fe29a81.png)
![[Diagram]](../../diagrams/35/c62d953f39f4899c556dbf952093c94e.png)
![[Diagram]](../../diagrams/31/27161787ed4f824d59638bab36fac731.png)
![[Diagram]](../../diagrams/40/b4228848ac1b7a92ecaea06e2050656c.png)
![[Diagram]](../../diagrams/46/378c0cc23912fbcda31191acf0547cb6.png)
![[Diagram]](../../diagrams/2/e6ac7ee822f751161d0efd5519b6e043.png)
![[Diagram]](../../diagrams/16/7e4c2adac0859b3bfc707019a0980975.png)
![[Diagram]](../../diagrams/19/99b4b8bb38e7c925d19ab9bad95d0717.png)
![[Diagram]](../../diagrams/16/21f890615b4b016d5e4c44d6e89c521d.png)
![[Diagram]](../../diagrams/33/dabfd14195f3aded1543f57eb98f5209.png)
![[Diagram]](../../diagrams/48/41a9121a53bd693764a2c34b8feee63e.png)
![[Diagram]](../../diagrams/17/5ee83d0562055082e66eae6c313cf74a.png)
![[Diagram]](../../diagrams/27/859b1f7c9100f7bb624a8ac37c0df047.png)
![[Diagram]](../../diagrams/47/69773168ab0388a21685b4efc2cce7c8.png)
![[Diagram]](../../diagrams/19/60fa177384e203521da838046e1aa07c.png)
![[Diagram]](../../diagrams/31/b5397d922ddafae32091edd5f0ead1b8.png)
![[Diagram]](../../diagrams/37/978b4b98bc0c337081e66bc016fc0926.png)
![[Diagram]](../../diagrams/7/1b30f83f569409e59cd53cee1623fc61.png)
![[Diagram]](../../diagrams/45/26c8065b037d4dca9530c47262ba91aa.png)
![[Diagram]](../../diagrams/23/40c3277b35a50a8fc0d546a055384260.png)
![[Diagram]](../../diagrams/1/ee3e19330e9c82a27c065286b68d0df1.png)
![[Diagram]](../../diagrams/4/bcd6d19e9419f5fa2e74b568e4cf9b9e.png)
![[Diagram]](../../diagrams/18/0569ffd01ca4a46b00e05c113c86e7a2.png)
![[Diagram]](../../diagrams/24/09fb80be39b6038fea85ff60b4957f5e.png)
![[Diagram]](../../diagrams/3/37456268a98386ec5a0fb64fec0d954e.png)
![[Diagram]](../../diagrams/22/a27b5b8fbe579315b5219f414d78798c.png)
![[Diagram]](../../diagrams/11/26534630bcabfc0fd1f6b9ed2a997041.png)
![[Diagram]](../../diagrams/20/75498f3c41e10c921c0790ec07f9e759.png)
![[Diagram]](../../diagrams/26/c57cdd907c5d0716a2f04028a7acf81d.png)
![[Diagram]](../../diagrams/11/d2f72fb5e0eda27a673a791c0c656a63.png)
![[Diagram]](../../diagrams/25/05f6dc136d7a831a80632305e38dc1e4.png)
![[Diagram]](../../diagrams/0/646f13c9119939bab25c4abe0681f2c0.png)
![[Diagram]](../../diagrams/3/41d8fa4fc0301bb78a9da15860758d76.png)
![[Diagram]](../../diagrams/23/5eb0fb3094dd449504e1193fb94b630a.png)
![[Diagram]](../../diagrams/52/6aecb32571c9f1e1796e90e7976bb575.png)
![[Diagram]](../../diagrams/36/cc6801c86fd06865fdecb74a7a578b06.png)
![[Diagram]](../../diagrams/20/d5c4208df615cbcf8e4d355a14ebf0c1.png)
![[Diagram]](../../diagrams/27/3f730dcaf2c95c2a31f63b7663133bb0.png)
![[Diagram]](../../diagrams/34/d7995005a3521129ce0450278b5089b0.png)
![[Diagram]](../../diagrams/27/dfb4b02e90d17318840c87a9e4d404f5.png)
![[Diagram]](../../diagrams/31/adf90b0d1a1f896c4eb4a66543f9da35.png)
![[Diagram]](../../diagrams/51/9a48ee75cf478e7a1978cd0ff4241919.png)
![[Diagram]](../../diagrams/28/838d9c07c62a8dba70eca3fb5d0e49d6.png)
![[Diagram]](../../diagrams/41/ff96bcb181b6d5c1ca2c95aa2fbf1bef.png)
![[Diagram]](../../diagrams/25/a21ab3e579f09665ba6a38a32a3ee72b.png)
![[Diagram]](../../diagrams/29/6905820d8ef79e3527e83405476f394b.png)
![[Diagram]](../../diagrams/24/942e4c1b2f49456b5ee30a376e80ea85.png)
![[Diagram]](../../diagrams/6/1e0cd13fd7ae3324b28af5d23e193e45.png)
![[Diagram]](../../diagrams/10/aef97cfc9442385f35d3d90524206817.png)
![[Diagram]](../../diagrams/5/616509807b059816428550b879e840ae.png)
![[Diagram]](../../diagrams/5/364214bcae15472c862c3bf2e451fda0.png)
![[Diagram]](../../diagrams/11/5d454d867af22c7589a4c316b8219b15.png)
![[Diagram]](../../diagrams/1/b91f13ae3575943bf896694d7f73ff5c.png)
![[Diagram]](../../diagrams/23/8db4ee919b594ae5f162c70d51de6371.png)
![[Diagram]](../../diagrams/27/8e87c77b76cf88b3928775ca54f9543f.png)
![[Diagram]](../../diagrams/24/731b6e01a07b14d611292d6555997d4a.png)
![[Diagram]](../../diagrams/42/7c043e350c52be7cd4cef260177c88cb.png)
![[Diagram]](../../diagrams/1/fa291fdd585c9f436e18c134d90ca298.png)
![[Diagram]](../../diagrams/0/ecba2d16f13591c1bb49ce3379723fa3.png)
![[Diagram]](../../diagrams/22/90bbc965a37c2bfd6c462c96068e5e23.png)
![[Diagram]](../../diagrams/46/2c0cce005ff6211c34345173fed3e2da.png)
![[Diagram]](../../diagrams/48/b0378d0a1530020afbf7faba42e45ab7.png)
![[Diagram]](../../diagrams/9/93e33dcbaf2c0ff416690efe03450263.png)
![[Diagram]](../../diagrams/41/25f414cf8efa0f77d8c632815f0fef57.png)
![[Diagram]](../../diagrams/26/454b9c1e321932abdfbb647b93edccf1.png)
![[Diagram]](../../diagrams/9/e1c7a978e5061567e6b4231fd34ac7d1.png)
![[Diagram]](../../diagrams/37/ed3495d2c78b77577039b9e67be30a8f.png)
![[Diagram]](../../diagrams/39/c37ad5d897ea1a0482867ff03e9145a8.png)
![[Diagram]](../../diagrams/33/d989f1408a4fdd23a3e2e1eba29ddf71.png)
![[Diagram]](../../diagrams/45/be20e843eb4307b245bf2078905f64fb.png)
![[Diagram]](../../diagrams/12/5de51a9cbc3dba9725580e10e477c44c.png)
![[Diagram]](../../diagrams/7/e8825986ad053e690ac2cd32a3b95614.png)
![[Diagram]](../../diagrams/44/f1d05345e3422982439174ca05221d03.png)
![[Diagram]](../../diagrams/41/fc203e12636ae2cd812bd552c8be49d5.png)
![[Diagram]](../../diagrams/1/f215d779cda08cf7157f8d3e3e273590.png)
![[Diagram]](../../diagrams/33/91e996228775593984406009670bd3f3.png)
![[Diagram]](../../diagrams/7/853e9c1f5e98a050fc5de973e921ac36.png)
![[Diagram]](../../diagrams/16/90cee728e32fd13d0d96d5f703b1bf86.png)
![[Diagram]](../../diagrams/28/a49d48c5085435da36d53e12fa45e83b.png)
![[Diagram]](../../diagrams/31/f035bd35c634285a3f624b9ae0c12cfb.png)
![[Diagram]](../../diagrams/49/6110f8bd47a4be63078a066255d26cca.png)
![[Diagram]](../../diagrams/28/33909e39e0f195d3e314239cb5eb1e1f.png)
![[Diagram]](../../diagrams/50/eb48860872028fecbe50e624e96aac1b.png)
![[Diagram]](../../diagrams/38/602f2c269fdc0c9ccf34062ba40f2610.png)
![[Diagram]](../../diagrams/24/70a99503117bf5eb396ac22d67eda8be.png)
![[Diagram]](../../diagrams/19/77140c7a301f818fc33d275a37e60663.png)
![[Diagram]](../../diagrams/43/3289e327ab6f0c1f9643532c6195ba45.png)
![[Diagram]](../../diagrams/45/0029dfd61c31c0cf901299ae894c5367.png)
![[Diagram]](../../diagrams/18/d642edcd48854796f6d5f293e7d3f2c1.png)
![[Diagram]](../../diagrams/27/737060936d8dcc253c08a4337f973d83.png)
![[Diagram]](../../diagrams/36/4712790cb49df2a04c88561c5d8bf866.png)
![[Diagram]](../../diagrams/41/5ad82f226082558e1434fb8934b1af74.png)
![[Diagram]](../../diagrams/5/fa2a8af370bc58dbb4074151b4bd9797.png)
![[Diagram]](../../diagrams/11/137b2be6042267a71029d7233314936c.png)
![[Diagram]](../../diagrams/35/eb57e482e5796866df7bc7c4c4f5ed16.png)
![[Diagram]](../../diagrams/5/360c58264b12d568a951e568a04c18ee.png)
![[Diagram]](../../diagrams/36/9e8df8edc0a587d27e7026a600f43e24.png)
![[Diagram]](../../diagrams/28/bbe2e544e8c760d93c19023079d19ebf.png)
![[Diagram]](../../diagrams/32/0362ff97ffd00f32043cb04358aa0bf3.png)
![[Diagram]](../../diagrams/17/f9c94df1d61ef50cff7df613825eec39.png)
![[Diagram]](../../diagrams/13/98be34cc2bb5bb6c4b0b4c00eaf3a1ef.png)
![[Diagram]](../../diagrams/49/1f4aad66d10087b85e3dd0d8492ab6f4.png)
![[Diagram]](../../diagrams/34/bdf0578eaff22a758a234efe87eb546d.png)
![[Diagram]](../../diagrams/14/97e8bfee9bf946e04283d43a94948125.png)
![[Diagram]](../../diagrams/14/293d8189cfcccbfef1852613af7fa6c0.png)
![[Diagram]](../../diagrams/5/86218f30ec3c30bc1ab7241b8588939d.png)
![[Diagram]](../../diagrams/50/a4afce3c65f62a6c474184f68488be66.png)
![[Diagram]](../../diagrams/47/668f1592af32e3fe5c2772e1fb58ffde.png)
![[Diagram]](../../diagrams/16/a932200c91d0eb80f0ee230fe8d86209.png)
![[Diagram]](../../diagrams/37/05e2eb8e39d7adc76128babb378b51e8.png)
![[Diagram]](../../diagrams/17/533c9bdf58b380b36990986087c12b27.png)
![[Diagram]](../../diagrams/5/72e82a2ac32244bca42df21931f408fa.png)
![[Diagram]](../../diagrams/33/c15442b6a2790bbb363bd0434c6269ea.png)
![[Diagram]](../../diagrams/15/c5fc8372359b160cfc54b10226b1232a.png)
![[Diagram]](../../diagrams/42/992362b7eaae6678b1cfc52eed70fd9e.png)
![[Diagram]](../../diagrams/27/f6b7ec88ea1383386603d271725dd0a4.png)

![[Diagram]](../../diagrams/52/6de54d0dc28d560408765b84f8e71a45.png)
![[Diagram]](../../diagrams/5/4d1161e82425e9375452ecf02ec94f99.png)
![[Diagram]](../../diagrams/32/6b68d253abaaddc25ecc70423e258b90.png)
![[Diagram]](../../diagrams/31/36e4b70b0f01cf7d8daf548e06650922.png)
![[Diagram]](../../diagrams/33/3483ce634d15a7067372a676ca18ac4b.png)
![[Diagram]](../../diagrams/29/249ce6c02807354e993085aae9a77bb7.png)
![[Diagram]](../../diagrams/52/243b84e32b1377a816eef1355e15f234.png)
![[Diagram]](../../diagrams/30/3b2eb800d5cfd36bfbd53310b968fa6d.png)
![[Diagram]](../../diagrams/35/6dd078cd2811eba9827ad753b684816a.png)
![[Diagram]](../../diagrams/17/595b70dee4404323dd371e3949dc00d0.png)
![[Diagram]](../../diagrams/24/fcf6e2cbb2cf719543703394d1d527f8.png)
![[Diagram]](../../diagrams/29/60465d468b2c25d5192dbc9ef2e8f3a1.png)
![[Diagram]](../../diagrams/29/4fc9673b2cb5b0907bb497cfbf6c69bb.png)
![[Diagram]](../../diagrams/4/c7d3b29a6d206e08cf6dab3abf35ce11.png)
![[Diagram]](../../diagrams/13/0446e9af227bb398fbea6721457278b9.png)
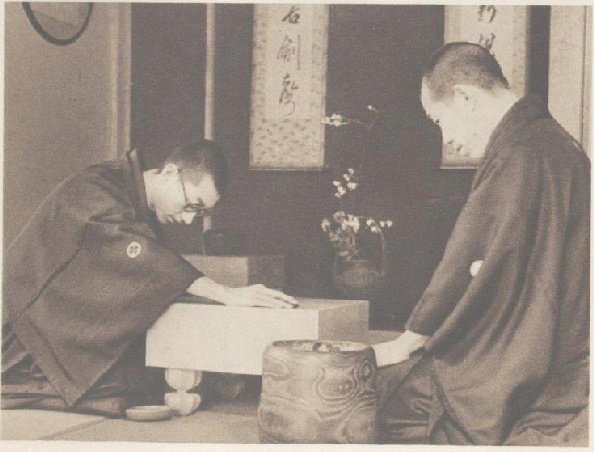
![[Diagram]](../../diagrams/33/957f2511986b940b38e3d003752ae4e1.png)
![[Diagram]](../../diagrams/3/2b789e8cba6cb3a6b349c45cd8a5fcfa.png)
![[Diagram]](../../diagrams/18/5067419ceecb2b181a6eec36a1001fe9.png)
![[Diagram]](../../diagrams/41/ca42573606941e687dd789520249dfdc.png)
![[Diagram]](../../diagrams/8/e74ab9379b94e214a74ff89bd3d385e9.png)
![[Diagram]](../../diagrams/28/d09ad89a57115abf07b2764f38d45f6d.png)
![[Diagram]](../../diagrams/47/5db4ee7b0d6d34d61a2440e6c460d44a.png)
![[Diagram]](../../diagrams/47/a9e6cc7529b1010185da1f0c581a1b98.png)
![[Diagram]](../../diagrams/31/5922886c1d50ace2e038cdd6a9a60edb.png)
![[Diagram]](../../diagrams/17/324e8f190d7f0b55af9eb03008102ed9.png)
![[Diagram]](../../diagrams/47/fa0a5e7d69d3f615512193528e6851ca.png)
![[Diagram]](../../diagrams/14/98d244adf284ae8a0f321a26ad4c11f4.png)
![[Diagram]](../../diagrams/35/b0d7a9dca64d5de697e5d11e83fa4df8.png)
![[Diagram]](../../diagrams/6/26f87093a81a2c1040d522a5b412b811.png)
![[Diagram]](../../diagrams/41/303bd8c96a8a474bb1e40537a5a68393.png)
![[Diagram]](../../diagrams/41/9b31e269137680d87228f88a1eaecdb7.png)
![[Diagram]](../../diagrams/42/d161afd7832293b07b4a962a81cf9da9.png)
![[Diagram]](../../diagrams/34/1db10b84cb624b783458ab7c16eb74b5.png)
![[Diagram]](../../diagrams/19/521a56b095d97f68058eabb639f65942.png)
![[Diagram]](../../diagrams/36/898f19d439ad329b7ad584fa6f22dbc3.png)
![[Diagram]](../../diagrams/48/940749fd6c4a563387d0f43f89874d74.png)
![[Diagram]](../../diagrams/51/df8abb2092690aeec8eb6aea7af38c2e.png)
![[Diagram]](../../diagrams/46/4ede720ddce209b2d86b90a093a6f602.png)
![[Diagram]](../../diagrams/44/3d49155a7656ea4f2bd54bea14bd7370.png)
![[Diagram]](../../diagrams/35/3df9c90ea89272c74d677fd2b88acb53.png)
![[Diagram]](../../diagrams/36/c49b12ee43e3f84f8a91e6b9a5c421b7.png)
![[Diagram]](../../diagrams/9/eb778dfd9530e0635e5ef48227bee5cd.png)
![[Diagram]](../../diagrams/21/ee6867211427923c956435b8f57dddac.png)
![[Diagram]](../../diagrams/42/7494366d744bd26169b853b2671fe559.png)
![[Diagram]](../../diagrams/14/e1597cb134de2c335c78aaf8d75f1064.png)
![[Diagram]](../../diagrams/37/132deeeed79a96de4ccd19bb95466f0f.png)
![[Diagram]](../../diagrams/41/4ff991bd02713706a2c3deb218730480.png)
![[Diagram]](../../diagrams/6/5fa897e852e4db73ba09f6fdb35ca4d4.png)
![[Diagram]](../../diagrams/39/3ed7b2d56c59b76075ea6827f35e3216.png)
![[Diagram]](../../diagrams/31/db13e929dbe65d8eba9442913638cfbb.png)
![[Diagram]](../../diagrams/25/fe401c43b0b5db3b7bb5efa62decbc9f.png)
![[Diagram]](../../diagrams/22/1fce5dcc802bfe5c8362b79fcf27d8bf.png)
![[Diagram]](../../diagrams/24/3696de7ca08cde0585abb84ccf09999b.png)
![[Diagram]](../../diagrams/48/1e160a833bde637a02bb8c524d95e90a.png)
![[Diagram]](../../diagrams/35/c35b2c98ec84399eb54b927da70c8271.png)
![[Diagram]](../../diagrams/30/dec360ce2e5fc9fe25cefb1d63662b6c.png)
![[Diagram]](../../diagrams/41/e1b12dbb1c9ed3d4a68aea52812dd2a0.png)
![[Diagram]](../../diagrams/9/a9707a81efd0006196310f5bc42b9f5a.png)
![[Diagram]](../../diagrams/23/2f5849b13b20254a9667af029f997bc0.png)
![[Diagram]](../../diagrams/3/0cf55a4bd5fe2167b06b550de103af69.png)
![[Diagram]](../../diagrams/32/a58ed9b88a8d18154e33c321f68b636c.png)
![[Diagram]](../../diagrams/25/1305491694ff30eb621d0f56a0b35e63.png)
![[Diagram]](../../diagrams/27/ed92c5d9ed2f06625ce9b7eef24ae1c3.png)
![[Diagram]](../../diagrams/20/20d8e01c2f2e2494a02c612022acfbed.png)
![[Diagram]](../../diagrams/7/3a4998b5e6ddccbb8a01f363d21a8920.png)
![[Diagram]](../../diagrams/14/f6f3265a4c1efaa7813371f25f31f437.png)
![[Diagram]](../../diagrams/0/286b563f12b7c7d569e92ab60ea034e7.png)
![[Diagram]](../../diagrams/41/43571155c8d525ba045e45b2d204210a.png)
![[Diagram]](../../diagrams/7/5f4db33832b0a9cf13d7e5e17c7faa39.png)
![[Diagram]](../../diagrams/43/8a469d3819ff538869bc9000aaa473ba.png)


![[Diagram]](../../diagrams/11/2f173c32761c2fbf1fb092ece93d2c1e.png)
![[Diagram]](../../diagrams/51/250d4604e7a81e636af4a36a8c551bcd.png)
![[Diagram]](../../diagrams/43/1a0256345ae2a44f6f030468d84855fe.png)
![[Diagram]](../../diagrams/0/e7636f7d0e2cf2a5b3aec36d41b5019a.png)
![[Diagram]](../../diagrams/5/541c14116a920f25a70770693599df79.png)
![[Diagram]](../../diagrams/0/057b43810bedae3729224b04e95ab524.png)
![[Diagram]](../../diagrams/19/8196740dd92873b63013552e011c53cb.png)
![[Diagram]](../../diagrams/13/46738240e7e6b5d44b144405a408109b.png)
![[Diagram]](../../diagrams/27/c6776b863da4c2df022e61b836f53304.png)
![[Diagram]](../../diagrams/15/8d98dc7f2d2960dafd655690aefe8cef.png)
![[Diagram]](../../diagrams/43/07eaae6c6229be204430c455a245ac85.png)
![[Diagram]](../../diagrams/14/7e0a0613cb83bc592f51bb8c95c0def5.png)
![[Diagram]](../../diagrams/22/91a436f5b5315bbd5114c98b4fde895b.png)
![[Diagram]](../../diagrams/27/1c4dbd5bb2a1356a0149c00557e1997a.png)
![[Diagram]](../../diagrams/36/b7673a3f65af27f6b08339a23ff1a886.png)
![[Diagram]](../../diagrams/24/a13a27c833b79db4405641e23971d103.png)
![[Diagram]](../../diagrams/47/6409b5c7c66dd3c70976cfedc12cbca3.png)

![[Diagram]](../../diagrams/2/c28a1a4569ac34aabfebf184e4c00b1e.png)
![[Diagram]](../../diagrams/36/07fa83e67f222c0bf5248a7aefece044.png)
![[Diagram]](../../diagrams/14/96ba1d2d0bb64a081ce44d5f73646d44.png)
![[Diagram]](../../diagrams/25/810cedaf46b67369843211051797e5dd.png)
![[Diagram]](../../diagrams/23/2d1ae52d75240e23106e96a296912dac.png)
![[Diagram]](../../diagrams/48/1b506de2b944dfec9e587a3fb2c893dc.png)
![[Diagram]](../../diagrams/3/9cdbe07396a0433f4c6c773584b5034e.png)
![[Diagram]](../../diagrams/23/6c020dbe48a4fca97b0752ed239dfdd5.png)
![[Diagram]](../../diagrams/16/0932952d272524307a1f998ab5671bbc.png)
![[Diagram]](../../diagrams/30/f4d39cbb91f4d7ec50e99e608357a6f3.png)
![[Diagram]](../../diagrams/0/0fc2a4983e351975115b73b4ead7429a.png)
![[Diagram]](../../diagrams/16/24a2e7e1118dbae4a3b2fe6ca73f7ed0.png)
![[Diagram]](../../diagrams/28/741f82f49f118333b659875b9192ad12.png)
![[Diagram]](../../diagrams/42/6d5efb9694f333e2dde21c47bd319342.png)
![[Diagram]](../../diagrams/52/11a4258396182fb4b0ab192b8df1e553.png)
![[Diagram]](../../diagrams/27/32f5317f06f5f23fe2280011a1a42a84.png)
![[Diagram]](../../diagrams/5/53cd5081ec0048d2dabb5e7bbc8bfa3a.png)
![[Diagram]](../../diagrams/27/7a1c4dc8c894c292639ee1e4d11b6527.png)
![[Diagram]](../../diagrams/44/9144a9e7ce761eab03b12950afd202d6.png)
![[Diagram]](../../diagrams/31/fd1ad5d795f73f15030c808b27530d11.png)
![[Diagram]](../../diagrams/46/010dcb550126914c2119ff56393a4c89.png)
![[Diagram]](../../diagrams/0/8518009ba30fda53dcf41fc05b6d46ed.png)
![[Diagram]](../../diagrams/28/421fc343aa4d5b5800b951f70bbb9bd0.png)
![[Diagram]](../../diagrams/34/6f9452950568e4d270b3d597ce11ff36.png)
![[Diagram]](../../diagrams/35/91764b1d364c045a0c98d19959c8b317.png)
![[Diagram]](../../diagrams/4/dcd8e93099ca8e6261760cbd5f142227.png)
![[Diagram]](../../diagrams/7/28cb0f036e1e626da71ab7f4fd60afe7.png)
![[Diagram]](../../diagrams/38/d0563f17d15da27f184a237d63514be2.png)
![[Diagram]](../../diagrams/50/027e278704bc7424fce81e2f9d1478e9.png)
![[Diagram]](../../diagrams/31/e65f434ff41aaf7d95366a090ded3ae7.png)
![[Diagram]](../../diagrams/25/3eb0dc22f878408bcbf9369671e982ea.png)
![[Diagram]](../../diagrams/35/9f234a2a734d40f19309e8a88bc55cc2.png)
![[Diagram]](../../diagrams/39/6aa95b702ba88589b6355f2f61137af6.png)
![[Diagram]](../../diagrams/21/255f864dfdc35a36c166c25dd2b5f55c.png)
![[Diagram]](../../diagrams/49/a838caf2b14c69ec8ff9de013b64bbf9.png)
![[Diagram]](../../diagrams/5/31e3186ba079f6407864803e6a98482f.png)
![[Diagram]](../../diagrams/27/f75961d17815914684f6680a6cb2b738.png)
![[Diagram]](../../diagrams/16/afcbfe68e05a1f2ba988b5128c90d16e.png)
![[Diagram]](../../diagrams/42/bb87dec5d4d7a880319afe6b08691abf.png)
![[Diagram]](../../diagrams/2/30e37bd1c530b6c8bb6ae5e19fca3d40.png)
![[Diagram]](../../diagrams/21/60212a5a883b8c8bcd4cdc17b9ce4db1.png)
![[Diagram]](../../diagrams/32/aa77f909f929ac0015083f20d39cb4a6.png)
![[Diagram]](../../diagrams/52/b6ad07ea1c1222926ad166e2236ebf9c.png)
![[Diagram]](../../diagrams/37/3c54278a42685a1e4b25aec229f0a101.png)
![[Diagram]](../../diagrams/39/a82c25f2278a1fb98f7f8fc6a77034fc.png)
![[Diagram]](../../diagrams/43/c0b682f3d92b9197faf422bda7b09f0b.png)
![[Diagram]](../../diagrams/45/3d7724b922b1cb052c3648f807b146ca.png)
![[Diagram]](../../diagrams/41/0ef03c55b564922a214c4a8adc2bd9ce.png)
![[Diagram]](../../diagrams/2/889cac4976fb8a0ebb34ed5f1f80846e.png)
![[ext]](http://tasuki.tasuki.org/pics/povray/goban.png) http://tasuki.tasuki.org/pics/povray/goban.png
http://tasuki.tasuki.org/pics/povray/goban.png![[ext]](http://shadowjack.weiqi.ru/files/3d_goban_1.jpg) http://shadowjack.weiqi.ru/files/3d_goban_1.jpg
http://shadowjack.weiqi.ru/files/3d_goban_1.jpg![[Diagram]](../../diagrams/15/cd8b352351f557dff7906b2afd6e8e14.png)
![[Diagram]](../../diagrams/29/ba4102b779e51a2301edaf6b3466f680.png)
![[Diagram]](../../diagrams/27/89239c6e144c72da521fb36b483292c1.png)
![[Diagram]](../../diagrams/11/be99609524a60b7d3b4f2fc975d4fed8.png)
![[Diagram]](../../diagrams/39/257e9fac31428b3f05dc0fade180e2cd.png)
![[Diagram]](../../diagrams/42/4be4111e40fd6936e4b77c308a27855a.png)
![[Diagram]](../../diagrams/10/5aa70c2845ff598a5e1dfe8e2740274d.png)
![[Diagram]](../../diagrams/4/c3eada6f8365f7b16a3ed7be44c68168.png)
![[Diagram]](../../diagrams/31/a96366564ff38a379e27264c0b524b5f.png)
![[Diagram]](../../diagrams/50/f32a2454a64fea8efca7d86ae44da9b3.png)
![[Diagram]](../../diagrams/4/643bbebefd0a7b0b27831a4424ba4310.png)
![[Diagram]](../../diagrams/22/6934221ff6b19a7d5e8c84cd569700bf.png)
![[Diagram]](../../diagrams/12/fd8f50dbc3f6b43a5cc14a3c07b7f030.png)
![[Diagram]](../../diagrams/41/012f5e877ecbe3f3ac09417bb1903bcc.png)
![[Diagram]](../../diagrams/38/daf95b329a195ca3e9d260835e12d996.png)
![[Diagram]](../../diagrams/12/893f3e6a91bb2ef15ae7202e8feeeb68.png)
![[Diagram]](../../diagrams/37/e26ee2b9d1cda0522e00ea7762c9e8b5.png)
![[Diagram]](../../diagrams/35/f1049f107b5799a82312fe6225d0e8dc.png)
![[Diagram]](../../diagrams/1/b841f3633a4485f7e97dcb39da3844a8.png)
![[Diagram]](../../diagrams/39/96e4bf03a0f0bce1ac1f3686b5a521c0.png)
![[Diagram]](../../diagrams/37/e78794137923a647b5c47694c095efd0.png)
![[Diagram]](../../diagrams/4/bc978f6fa85f07c28963c3b54e64c29c.png)
![[Diagram]](../../diagrams/34/4edd711c26733a6e20e60f14c3160a7f.png)
![[Diagram]](../../diagrams/16/5e7ee9e0ac11cee8a460f9faeb580d0a.png)
![[Diagram]](../../diagrams/42/e0ac0a029b0bd3e2a374d910373aba06.png)
![[Diagram]](../../diagrams/34/30c66a2ac89fa002ad15e87b11a962bd.png)
![[Diagram]](../../diagrams/7/1d67a96e937fd7125c0746e3df647c01.png)
![[Diagram]](../../diagrams/34/afe4a4be4d93f755473c4246ce77c5ce.png)
![[Diagram]](../../diagrams/37/d739c1ced577eadce1ae27939376c810.png)
![[Diagram]](../../diagrams/44/5c0d26b4bb3d5d05c25d46bb8a669873.png)
![[Diagram]](../../diagrams/49/cd7f5162d17aa06b77efc71906b5c477.png)
![[Diagram]](../../diagrams/36/e4538ffd1bcc4b23756c0554e4e3948f.png)
![[Diagram]](../../diagrams/12/6e265cf0d2c3e52fd69a06a62e2b3b07.png)
![[Diagram]](../../diagrams/9/cdbd1ac3b446afa097b193347f0033a9.png)
![[Diagram]](../../diagrams/33/626d4af4c7dbecd6b2f2582dd9c8fae3.png)
![[Diagram]](../../diagrams/52/a7e93eec57bf57128e4508010d35c5d7.png)
![[Diagram]](../../diagrams/41/829a6877468cf5ad953a6e6ec42c97fe.png)
![[Diagram]](../../diagrams/27/9fe3b1f0ea9ed9f9c27173f950020024.png)
![[Diagram]](../../diagrams/30/50755bcf90cffe177f3211c3f506cd64.png)
![[Diagram]](../../diagrams/32/487829cd8958523c0a5e3e7fd8dec0d4.png)
![[Diagram]](../../diagrams/14/538b909832a5478b03549af8e5f36dd5.png)
![[Diagram]](../../diagrams/21/f6e061104e68669250a4d49247db650c.png)
![[Diagram]](../../diagrams/42/0f32d38857befd9ea145b41ccfc155cd.png)
![[Diagram]](../../diagrams/7/d38259793b169320aff4252cb18ebe62.png)
![[Diagram]](../../diagrams/33/2bd15841ad4696e8090add4938e93785.png)
![[Diagram]](../../diagrams/25/9b0d7d00ee6431a86c810c24d3222bf5.png)
![[Diagram]](../../diagrams/9/983521eba7b08a57d950e406bb013d3e.png)
![[Diagram]](../../diagrams/25/d09070df723dea24e07c6ab910bfa2cc.png)
![[Diagram]](../../diagrams/19/84875bf185f34eb573e402c216dbfde5.png)
![[Diagram]](../../diagrams/29/5e60ff20cd8ce39c531caa20cac4b5d9.png)
![[Diagram]](../../diagrams/10/502e7918b639fc564e6122d38be2436e.png)
![[Diagram]](../../diagrams/28/f60b48965814a8fe316fa9b87acf5981.png)
![[Diagram]](../../diagrams/15/22b083a944ec5286cdc40ad394d548cf.png)
![[Diagram]](../../diagrams/30/caea1dba291eb19e4ac2d1ceeb615264.png)
![[Diagram]](../../diagrams/14/38ada3f43f2c08866eaadca2626af80d.png)
![[Diagram]](../../diagrams/21/d3b93bf4ebd3a726d77f5eea6b9ffe69.png)
![[Diagram]](../../diagrams/32/022e251d09610a440c16d6470a1447f9.png)
![[Diagram]](../../diagrams/26/93b66a5a7f9cf2859be8b0c84e2e69e2.png)
![[Diagram]](../../diagrams/0/69f7b8b1f2798e67cecf9fc550777017.png)
![[Diagram]](../../diagrams/31/b117e1a7a06eaf0ac483241fbb15bf25.png)
![[Diagram]](../../diagrams/27/caa7811c6ae45920c272ec726af8270a.png)
![[Diagram]](../../diagrams/11/9a62b07b681f6c4f16c5d56c51c9f95f.png)
![[Diagram]](../../diagrams/12/9c27cc971e0aa93f7394ddf69deb9ab5.png)
![[Diagram]](../../diagrams/6/5daf7fb8c512684a2089c543412f0fbe.png)
![[Diagram]](../../diagrams/32/7c617e89af423784dc0c07d9db1f45cd.png)
![[Diagram]](../../diagrams/37/3dc35d4fb1f96a0d9dc1f9b57046b435.png)
![[Diagram]](../../diagrams/6/308c3c6ce126b00044c2d60d78b57ffa.png)
![[Diagram]](../../diagrams/5/3c6f3d09445948377cad17359b18101b.png)
![[Diagram]](../../diagrams/25/e916dff9c9b39224fa80c1284b5dcfcb.png)
![[Diagram]](../../diagrams/15/a42bb2576fbbc6e25843ffc9d1cd4129.png)
![[Diagram]](../../diagrams/34/466352f0e757093210afe3008237bc66.png)
![[Diagram]](../../diagrams/6/89802d3ab60013f5d0c61ebfc15238c3.png)
![[Diagram]](../../diagrams/39/0210fe90de186364fcf52ea9da606caa.png)
![[Diagram]](../../diagrams/44/d49852a4ac22ff5d824cb57fd01d4acf.png)
![[Diagram]](../../diagrams/11/85164e88c3f594e5a8f565258704f582.png)
![[Diagram]](../../diagrams/14/09f53eddcc1d4c7f2235604fe892708c.png)
![[Diagram]](../../diagrams/30/721e07b025e1519a72cb9d2e33a6d072.png)
![[Diagram]](../../diagrams/7/7d52c96968bb15975d24d0b74225e75f.png)
![[Diagram]](../../diagrams/21/020225a770d8ab45c02d9913faa319eb.png)
![[Diagram]](../../diagrams/3/c03b76724371c5c1333326322fad8ec2.png)
![[Diagram]](../../diagrams/17/49c44e7f7df47064d31a37991b624943.png)
![[Diagram]](../../diagrams/28/1c571f6071a07975e7a1e11de5fc3f38.png)
![[Diagram]](../../diagrams/32/0a54e21b751b671b93fd9945e44041d8.png)
![[Diagram]](../../diagrams/35/8c65ef860a13cf42bbc43a3bd5d6cf02.png)
![[Diagram]](../../diagrams/20/c152170ab318ffdccf46bd9062deac7c.png)
![[Diagram]](../../diagrams/22/e709e44e8005df1b7220d7544fcffae7.png)
![[Diagram]](../../diagrams/7/5d7986fa1a2add0f2cec82a4dae98a0b.png)
![[Diagram]](../../diagrams/35/29198c5ca21f85dd2770c6e9212eaf42.png)
![[Diagram]](../../diagrams/28/a5392ea9075dd9f23070c36d371ee33c.png)
![[Diagram]](../../diagrams/20/e0779b7ba9eeb75034d7ac3e116a89cf.png)
![[Diagram]](../../diagrams/30/25b43a484aad93103a72ab642ba63f78.png)
![[Diagram]](../../diagrams/33/c74127984c36bbe406c1246f2881bce2.png)
![[Diagram]](../../diagrams/0/53106d755f902248a1dd188cbbd92f24.png)
![[Diagram]](../../diagrams/11/deb59f643c8b22a8c2e59ecf83e7e7d6.png)
![[Diagram]](../../diagrams/10/9ccfe9538c7c047033ea692652560bc5.png)
![[Diagram]](../../diagrams/12/cf053d8b1c1a18fa9a8c47119a6260e6.png)
![[Diagram]](../../diagrams/11/3b0a1a662a00e655686ffe91261f41e0.png)
![[Diagram]](../../diagrams/22/0996d8e191b56a6c5fe03ace8cfa6679.png)
![[Diagram]](../../diagrams/29/f2c4ebaf15d580691a1afdc690f17d5e.png)
![[Diagram]](../../diagrams/15/0151c7b9fb1b59fe59390bf3c1c5aca1.png)
![[Diagram]](../../diagrams/16/1f4e75e9b2a6432b527267d9a5899cd0.png)
![[Diagram]](../../diagrams/19/3ae0b061f1b2051006a79c5ea0c69f5a.png)
![[Diagram]](../../diagrams/1/2a861e754d85efcb6d7ec5acd7d86fab.png)
![[Diagram]](../../diagrams/27/c4a064a2fca694246408674a783aabe4.png)
![[Diagram]](../../diagrams/6/5b4e173b709dc857a4a75626bab01fa0.png)
![[Diagram]](../../diagrams/32/b261ad6b7f3c5d839872db5052582ad1.png)
![[Diagram]](../../diagrams/36/5649e0a17b1adbe8aff5a73f47398366.png)
![[Diagram]](../../diagrams/28/fc3b526d7bd8c6ba727338415ae92c42.png)
![[Diagram]](../../diagrams/16/41443f910d8ceab7f7fcc9a72c9924a8.png)
![[Diagram]](../../diagrams/42/55bbb5c11d709685e522671e4aa4f046.png)
![[Diagram]](../../diagrams/42/e8e80ffcac7ffe816d60e7b09ac14913.png)
![[Diagram]](../../diagrams/19/edd0800249ac5831882d02893cde0142.png)
![[Diagram]](../../diagrams/12/c477816cb976a2ea0105152742ce597b.png)
![[Diagram]](../../diagrams/0/d91d837fac48b0c9163d12fdbc472afc.png)
![[Diagram]](../../diagrams/4/862e4d4e8c79432bd7ce6c556a17d2e0.png)
![[Diagram]](../../diagrams/27/6b2c6d77235ab930d1558b369000b465.png)
![[Diagram]](../../diagrams/41/d7d45ef43b4350ddd4209226cd6817c1.png)
![[Diagram]](../../diagrams/25/14109b39011b3f0311434b0fdfe54c21.png)
![[Diagram]](../../diagrams/30/3293efc1e7b45ac939975ee293754098.png)
![[Diagram]](../../diagrams/4/73d67c0eb62b2a20e93ad0c975ce00f3.png)
![[Diagram]](../../diagrams/48/b5effcd63e7243cb4dd0be12b3e88667.png)
![[Diagram]](../../diagrams/45/986433b305539ac630266ca5a7a4a504.png)
![[Diagram]](../../diagrams/15/e74b23db8066954a2e3b23f635f87fec.png)
![[Diagram]](../../diagrams/38/95ab9565000551f3d0d7cfac137b4ae3.png)
![[Diagram]](../../diagrams/31/8071563d9d0079c68b51cf5957b5d60c.png)
![[Diagram]](../../diagrams/3/c19abcaace51cc9711d539ba2665d626.png)
![[Diagram]](../../diagrams/4/5a7b8acc8e96c14beb018017dcc39df6.png)
![[Diagram]](../../diagrams/11/7fef42e3dcf54058f917de143e5a39b3.png)
![[Diagram]](../../diagrams/48/11ff9b409c94f5034a5052c83b702ea2.png)
![[Diagram]](../../diagrams/23/7001c4afa85ee54dad62c138544261bc.png)
![[Diagram]](../../diagrams/35/7aa0747a0bf3e0168b9ee170c524c208.png)
![[Diagram]](../../diagrams/19/a9c2260d742497496d8d5058bd0773bb.png)
![[Diagram]](../../diagrams/5/8ad4bde2f96e150ba1a15f05aa23d329.png)
![[Diagram]](../../diagrams/5/1f9376b444a7fe4d1f2ae0855413daf7.png)
![[Diagram]](../../diagrams/4/051f0b08f869842b73e9366425a4ebe3.png)
![[Diagram]](../../diagrams/3/504476cc79541cac560940b5b91cdf94.png)
![[Diagram]](../../diagrams/13/c56a505c4379b0fa9ae59abc45af3daf.png)
![[Diagram]](../../diagrams/17/02a71cf262292303392e6b45af1299fa.png)

![[Diagram]](../../diagrams/38/8aa1a6a76605eb29e1e1694a85a8570e.png)
![[Diagram]](../../diagrams/12/6a3abe02753f8cf677939611daf798f4.png)
![[Diagram]](../../diagrams/11/5e945c469a138ec78ee76d3a641b78b4.png)
![[Diagram]](../../diagrams/34/d8e6e5b0406d82a8456d7272203d7337.png)
![[Diagram]](../../diagrams/4/86e203f7e8c181da6798dc07c07d6ccc.png)
![[Diagram]](../../diagrams/28/ed08048c6fb492124f24b6c78aa73286.png)
![[Diagram]](../../diagrams/52/7a15c82b84a269ffa3e065561dc656f0.png)
![[Diagram]](../../diagrams/18/7f3658208a21ffbb27921c720280f751.png)
![[Diagram]](../../diagrams/40/2a9a613c687945e718fb4b85a45a6ba3.png)
![[Diagram]](../../diagrams/27/7f5c3d628da7b3d133139cb5b3f35abc.png)
![[Diagram]](../../diagrams/1/b6b865e5c4197747b6f2561415659bbb.png)
![[Diagram]](../../diagrams/18/9c6775ddaad56c3565a6ff5e25777220.png)
![[Diagram]](../../diagrams/28/88c608fdb0e87490c29a3559b52108d0.png)
![[Diagram]](../../diagrams/6/1c979520461484cf8571914c37e098c0.png)
![[Diagram]](../../diagrams/33/baf1692e379d8cdb576f03dfe0134660.png)
![[Diagram]](../../diagrams/22/10213cc015d621d3ce7d0af5d0c6975f.png)
![[Diagram]](../../diagrams/23/15cc753af1fd655a5bf2ad444123786e.png)
![[Diagram]](../../diagrams/27/d4ff35139994b253b485824b36012eaf.png)
![[Diagram]](../../diagrams/1/53d969266e3b6dbe658fd5a81d3822e2.png)
![[Diagram]](../../diagrams/38/2d8f708b7961fa1d7aa777f5507ae6a7.png)
![[Diagram]](../../diagrams/23/e740ea7f29ed8bdbf8ff5a533afcb7c8.png)
![[Diagram]](../../diagrams/26/33d0272ee7004f766bef42b9b8a8f7d9.png)
![[Diagram]](../../diagrams/26/4b3fe4a74bc5a36bd72e370f339b2def.png)
![[Diagram]](../../diagrams/9/1a86c4b45ac7b23a4872b8c408289687.png)
![[Diagram]](../../diagrams/22/7bd4db699e843d559d8a24dd7ddcb6c0.png)
![[Diagram]](../../diagrams/18/8bbcc671c6ee9e6d3c69a2901c7ab7e6.png)
![[Diagram]](../../diagrams/23/49580e59285884aae5f40667c92a4dfb.png)
![[Diagram]](../../diagrams/51/4ebed03368365e0f29e38be64ac618a6.png)
![[Diagram]](../../diagrams/20/41f54f325ecfe5bf6cb4648a05ac3b0d.png)
![[Diagram]](../../diagrams/13/d6001f719e86ba2d4317aa60f65fac23.png)
![[Diagram]](../../diagrams/40/f586ac58ee712d02cd0911cf4e7da0ef.png)
![[Diagram]](../../diagrams/19/846b2873377a48f2489e51cbeaf1df53.png)
![[Diagram]](../../diagrams/15/445e0429ffcb92cbade3fb79780c3059.png)
![[Diagram]](../../diagrams/25/9b2dfe8800e6cca6f27cde89d42b6b0c.png)
![[Diagram]](../../diagrams/47/54da7e97a7cb632d1e8af146a4a7ecc0.png)
![[Diagram]](../../diagrams/17/f221db2edf0b8952b020768d051f2b54.png)
![[Diagram]](../../diagrams/9/be71484f34eb30e7fa6c4ef9cf402c94.png)
![[Diagram]](../../diagrams/52/7c48c96b503e661e21f0225039a439cb.png)
![[Diagram]](../../diagrams/21/a1cf622583120a378058ee91132a5a92.png)
![[Diagram]](../../diagrams/50/0f6289cbba07cd582fd9b57b27ee8027.png)
![[Diagram]](../../diagrams/31/d83eac3e045528f2029eef7755b70350.png)
![[Diagram]](../../diagrams/22/5388722d6b8da4f916848213815d9a92.png)
![[Diagram]](../../diagrams/22/5dcc95629fecc773f2235d9bc219784b.png)
![[Diagram]](../../diagrams/29/290ca9dfc7af51156b1ab3d1592e1908.png)
![[Diagram]](../../diagrams/6/e00b7e3e1d6ed4431b4e5c690097f8f9.png)
![[Diagram]](../../diagrams/12/9714e835f7cbdb36deb5c290c7e36a08.png)
![[Diagram]](../../diagrams/32/26f416f66db20c87ee89704da8ddb72e.png)
![[Diagram]](../../diagrams/48/9705843f7d390a79d0c2a7abf436f655.png)
![[Diagram]](../../diagrams/21/21c1059f6b105b9df443d845d4840a20.png)
![[Diagram]](../../diagrams/24/87beee6bd1110bf9cdefaf9e5068e8e6.png)
![[Diagram]](../../diagrams/18/1ecc619ee4610c60fae71e418fb81ec8.png)
![[Diagram]](../../diagrams/39/4a86cdf52c69f44a3ebacee1dfdfa17e.png)
![[Diagram]](../../diagrams/39/234cb32d269c5b7cb4a452e31cb2a61b.png)
![[Diagram]](../../diagrams/38/5238dd145080cfe1626d0707c95eb33e.png)
![[Diagram]](../../diagrams/3/d2a21719c82f565446f6f52f850e7b25.png)
![[Diagram]](../../diagrams/40/e716dfd5ba3006a551b3fe50f0d5ef35.png)
![[Diagram]](../../diagrams/40/206b22dd48cf1454e64c5fbe2882970c.png)
![[Diagram]](../../diagrams/6/9c0c40f427e97663734a400cc251cda6.png)
![[Diagram]](../../diagrams/22/c59d81a0480a33d5c91ad824a291bbdc.png)
![[Diagram]](../../diagrams/33/0e46e010d4a10e86685d61db53e23773.png)
![[Diagram]](../../diagrams/25/f24ebe7e384cb0779b905ce61ae1066a.png)
![[Diagram]](../../diagrams/50/4a334e9cdafc02238696ed5a1d1596d1.png)
![[Diagram]](../../diagrams/48/3ebfeaf2a23c56f3e5fc0a2220b4f911.png)
![[Diagram]](../../diagrams/29/1bafd827fa2d6de608057d1cafa24b87.png)
![[Diagram]](../../diagrams/21/f6332ce70495d9bea5fd2d3d896f39dd.png)
![[Diagram]](../../diagrams/12/ee68b2c59694cb788e07533efbcec14f.png)
![[Diagram]](../../diagrams/25/1f690474b0dc9ca3afed3879f38b2c9c.png)
![[Diagram]](../../diagrams/36/4a49bf21a8639b021c1e065869f802f9.png)
![[Diagram]](../../diagrams/0/31cd92b467d7c4ecf68d33aba016c90e.png)
![[Diagram]](../../diagrams/49/30f73804c8060e96f2fee7348261ffd0.png)
![[Diagram]](../../diagrams/33/2b050675556fd3cb898cf0ab77b14c8f.png)
![[Diagram]](../../diagrams/15/6d6fd61519dc53fb850df7da9901c6b7.png)
![[Diagram]](../../diagrams/4/1a6c14e678806e6cd2ec255d1e8251f5.png)
![[Diagram]](../../diagrams/27/14ccdd9183a6c0fa39dc96abdb8d655c.png)
![[Diagram]](../../diagrams/22/a594b859c701e222cad145c5f75f3117.png)
![[Diagram]](../../diagrams/52/0c8157d5301de9c8c2a9e98dfb01861f.png)
![[Diagram]](../../diagrams/10/36ae797ec27655f3d75fdbe3374c3621.png)
![[Diagram]](../../diagrams/23/0567375dff9144a86b4668a696cd891c.png)
![[Diagram]](../../diagrams/20/a57cab553969a9e9e8b1f47dff5e18c9.png)
![[Diagram]](../../diagrams/51/6b55439ea14c1e0717b0f773e623d744.png)
![[Diagram]](../../diagrams/30/1445e8a0fa9531ba30835d82ba369d01.png)
![[Diagram]](../../diagrams/41/3aea3ddd47c259543ff38d110fd4dbc2.png)
![[Diagram]](../../diagrams/33/60476384aedcdbe4d16e8bfaa3bedd7c.png)
![[Diagram]](../../diagrams/36/b0f7765ae74d703b90835d0881482802.png)
![[Diagram]](../../diagrams/28/e23238e9409cff999a456ab522ef62ef.png)
![[Diagram]](../../diagrams/12/8eb2df4164a59ecda1b9d2919c237c2d.png)
![[Diagram]](../../diagrams/26/a71cc96438419b0d76acf0f55a54379e.png)
![[Diagram]](../../diagrams/31/55a5dfad37ec3e3d40d16a4ca69b9a6f.png)
![[Diagram]](../../diagrams/28/cc55a1e8ca16385003639bc27d7c8d05.png)
![[Diagram]](../../diagrams/21/d46f8fbf9891b38dc2c671eefaa77abf.png)
![[Diagram]](../../diagrams/48/eeb2c6ee01dae7347220fcc7854232e0.png)
![[Diagram]](../../diagrams/20/c636d22bca40af1c8d28314a6400bc13.png)
![[Diagram]](../../diagrams/29/6ee180174fb9727ddbe431d5ee60ab51.png)
![[Diagram]](../../diagrams/22/1e144d0c8b4ae374e38623a0fc242ab8.png)
![[Diagram]](../../diagrams/6/b79d5e5b6941494d996e7ec4c7dcb2de.png)
![[Diagram]](../../diagrams/40/87ebb11b68a616ba002b272797359b8c.png)
![[Diagram]](../../diagrams/12/2b4dab52304d79077af24d23acd59fbb.png)
![[Diagram]](../../diagrams/46/2b88f1b5a2fa3f836eb73605bd82d61b.png)
![[Diagram]](../../diagrams/45/905b3d77e02dfa59c0480c588d452743.png)
![[Diagram]](../../diagrams/9/f0e9e68137bd914438e4556820e0a232.png)
![[Diagram]](../../diagrams/10/c492603fc9b6ed23e30c307182c4cd55.png)
![[Diagram]](../../diagrams/25/a1aec84cb0102fe02efcd515a2880c21.png)
![[Diagram]](../../diagrams/17/b403b9e586bab1c8486cffbf6e308a35.png)
![[Diagram]](../../diagrams/12/00b135717d169b1afdc2c39c881d4d11.png)
![[Diagram]](../../diagrams/7/ec67700a6737ecec97315d68fcaedc53.png)
![[Diagram]](../../diagrams/44/a528a8609b379f086d368756541309c5.png)
![[Diagram]](../../diagrams/47/62d177f340424208ecc3b54fd1c90757.png)
![[Diagram]](../../diagrams/11/a9521aa5cb8fcba1a122850cf5a7eecc.png)
![[Diagram]](../../diagrams/33/f8722760d83735908d00fbba401f784b.png)
![[Diagram]](../../diagrams/46/bddcfc6bb6625e376d5f6d55f9c7af0e.png)
![[Diagram]](../../diagrams/27/6d7f7bbdd7ca1f6a4fe9ba6abb3202f5.png)
![[Diagram]](../../diagrams/8/d77c2e530c941a07440470b4b94c8971.png)
![[Diagram]](../../diagrams/35/b87e5ba9b6c79e8b2024d67223d06b85.png)
![[Diagram]](../../diagrams/36/4363eae1451d86785a0f2da9002adf8d.png)
![[Diagram]](../../diagrams/28/0e21cd8b99001e30fbf99f26da8dfcfe.png)
![[Diagram]](../../diagrams/12/1c6ecf0852c2cb47f2f0af5d7ef1de4f.png)
![[Diagram]](../../diagrams/14/9db1965bc56474c290755c41e2091646.png)
![[Diagram]](../../diagrams/37/a02d1aa35ecd2a224ba54d37a76f45be.png)
![[Diagram]](../../diagrams/33/1705f064fddf210f328510e35e6d0f53.png)
![[Diagram]](../../diagrams/27/a76326569b3c1ab59312cb7b36756261.png)
![[Diagram]](../../diagrams/17/a36b8c8a4d32d8b332c56b5b68b83bc2.png)
![[Diagram]](../../diagrams/4/ccc9a51dac85828803698f1c78d9955b.png)
![[Diagram]](../../diagrams/29/b7dcb0a7105a7a4cb8b65f081757bd14.png)
![[Diagram]](../../diagrams/39/091a3f11afaabb238ee1820f9b208451.png)
![[Diagram]](../../diagrams/19/0ad5ba670a136e588d7f818318b8d63e.png)
![[Diagram]](../../diagrams/16/13383227eeab0f4c1c7d49a2f1c94df3.png)
![[Diagram]](../../diagrams/12/68d90748a90b5655d785b0a2fb8b69b1.png)
![[Diagram]](../../diagrams/4/9e79ee54ef9433af7699ea944a396fff.png)
![[Diagram]](../../diagrams/26/adc1cc9e2891cc724f022efee796e4f3.png)
![[Diagram]](../../diagrams/9/5d2f4d18befcfaf41b2707fff30341f7.png)
![[Diagram]](../../diagrams/6/e3990d33d96f0c1d5c3502d6141644cd.png)
![[Diagram]](../../diagrams/8/1d40a5b3cdcd7a48f14021cf137702a8.png)
![[Diagram]](../../diagrams/7/fd975319e2a2bc97657c734d48d8bded.png)
![[Diagram]](../../diagrams/49/155aa7ffdbc2e19343b20cdee9224d4a.png)
![[Diagram]](../../diagrams/8/126b294416783cee955d3f558ce07e32.png)
![[Diagram]](../../diagrams/37/b2e0180212266336d3971cac63890bee.png)
![[Diagram]](../../diagrams/5/3a8e449c5d040ebe9f5355aba0a8949f.png)
![[Diagram]](../../diagrams/14/7a51caf5dfb0bcae44f9d19b4786260c.png)
![[Diagram]](../../diagrams/31/064ba1892485b566dea6626ff48b0be5.png)
![[Diagram]](../../diagrams/47/1206d571985f9ad8083a803895d87d3a.png)
![[Diagram]](../../diagrams/49/64580edc325ad0c9f9f25cf108e228cd.png)
![[Diagram]](../../diagrams/6/0bd8c9bbe6d65119ce58558db4a7488f.png)
![[Diagram]](../../diagrams/20/87e7b0682adc4f7162459c6657685145.png)
![[Diagram]](../../diagrams/30/34f6f6c76c13aa19cac51777c879e4cd.png)
![[Diagram]](../../diagrams/30/b1652c6159fc6eff3ada3b39b21c9286.png)
![[Diagram]](../../diagrams/49/17d978d1cf9380eb4b37bf433f574605.png)
![[Diagram]](../../diagrams/14/4fd7b8e9f4ad4f9fb261399b11db0325.png)
![[Diagram]](../../diagrams/41/aa4f58bdbc86e2f9009b80b7c82879ed.png)
![[Diagram]](../../diagrams/26/af09971bf2a9a020b3da6648c29211ce.png)
![[Diagram]](../../diagrams/50/a85e9e1ce58857b7976f630427bcb9c2.png)
![[Diagram]](../../diagrams/15/b6ce7ba8dff2cf1fccbb60ae3cbe650f.png)
![[Diagram]](../../diagrams/2/5eb996a55a60ab88c4508a8a2bb5cdc9.png)
![[Diagram]](../../diagrams/1/3ad7fb1b53db5509c9dcd03cd922a006.png)
![[Diagram]](../../diagrams/13/b5996d0c8cb6232324a2701648cb6d3e.png)
![[Diagram]](../../diagrams/13/956e67512dd625516a1fbcda65ff416f.png)
![[Diagram]](../../diagrams/36/20390e0a1c08a9ca1b31c83e636c1a42.png)
![[Diagram]](../../diagrams/0/e9412b5e75d77b3e310bccdbd3f53b42.png)
![[Diagram]](../../diagrams/20/aa103a5af4bb48e5b98bea7e905680a1.png)
![[Diagram]](../../diagrams/6/0ee5726bc2ff5cf8992d9ba53e8fdb15.png)
![[Diagram]](../../diagrams/26/42ec150a5f17d4321801e808f547b815.png)
![[Diagram]](../../diagrams/28/ad3468b61a769225aadd366696c8e0e1.png)
![[Diagram]](../../diagrams/31/ba3b0848663c299e4e651ccad91fdd07.png)
![[Diagram]](../../diagrams/32/521d7c846d93076bbb75da42fddef10a.png)
![[Diagram]](../../diagrams/13/c25593d926735f4601a86cf117b504b2.png)

![[Diagram]](../../diagrams/42/d29c6a065689a6c54f16a21da3177923.png)
![[Diagram]](../../diagrams/12/e7997a31ff41caba7f42ebcbbb38f1a3.png)
![[Diagram]](../../diagrams/7/0c2277a4cf9f89dd8b5b167425bf1486.png)
![[Diagram]](../../diagrams/43/072e03762575842c9dc738309e72b789.png)
![[Diagram]](../../diagrams/0/17ff99c672ce8876cb0a3a03b001d766.png)
![[Diagram]](../../diagrams/8/e450dbf4f086fe93610cc7826f3804b6.png)
![[Diagram]](../../diagrams/47/97bd0d964d34a994b37393699e2cdfef.png)
![[Diagram]](../../diagrams/29/c3820ff63cae410b6498e0826c5b53f5.png)
![[Diagram]](../../diagrams/15/281bb7823745a3edb28fad091125da33.png)
![[Diagram]](../../diagrams/17/54ea87da80e1eac3123798b3e4216a7d.png)
![[Diagram]](../../diagrams/36/096aa534d28f9f9adfa269a6b76187d4.png)
![[Diagram]](../../diagrams/19/ae2f19f3a6976e22817112c7b2499751.png)
![[Diagram]](../../diagrams/40/25a664b95f7701f11da1dfcbdca565bd.png)
![[Diagram]](../../diagrams/32/8df4aa83f5611b1dd6ce34a5a23b91e2.png)
![[Diagram]](../../diagrams/0/e65a74cc8dc091f3fa2d28671cf824a1.png)
![[Diagram]](../../diagrams/30/fc5f3fd0760d57e48c3919db3ea59958.png)
![[Diagram]](../../diagrams/7/25e64934476bb5bbc0059624ec016f68.png)
![[Diagram]](../../diagrams/23/cd2ae5465a6f663fc424a7d555f366d1.png)
![[Diagram]](../../diagrams/16/f2685d3ae63a06fea3ce9b5a06f97edb.png)
![[Diagram]](../../diagrams/38/5fb811fc59b7e4df58ab015eb49987d0.png)
![[Diagram]](../../diagrams/33/1fc28c7e30210f02e9fa2e89906994cb.png)
![[Diagram]](../../diagrams/43/b0a40fecec8eca8d09a1308eab95d48f.png)
![[Diagram]](../../diagrams/40/a3b0b42585cd5290f90125082cc5c866.png)
![[Diagram]](../../diagrams/17/f3013a13808e2ab88b5d943a5d7a9271.png)
![[Diagram]](../../diagrams/41/a8ff1604d50046cc00321501c03fa625.png)
![[Diagram]](../../diagrams/24/fc7915692f43a121e9c2cd10bbe2f83b.png)
![[Diagram]](../../diagrams/33/086a64f89b6b39a29a1f8dce4ecfa714.png)
![[Diagram]](../../diagrams/2/689d84e03ffb92664661865b8f3dc1c9.png)
![[Diagram]](../../diagrams/43/cf15bac35bc98e53cac286619e4b0ddf.png)
![[Diagram]](../../diagrams/25/c456fcb0fdf5a5a1bcf4d4a01b969405.png)
![[Diagram]](../../diagrams/51/f7b7866ad97dd89be3b335d9b2ab3cc7.png)
![[Diagram]](../../diagrams/13/fb776f9ce73d481ff77ca0b165fd2a0c.png)
![[Diagram]](../../diagrams/48/255436a8c9efb62d876396899c291006.png)
![[Diagram]](../../diagrams/41/959cb45408b31f80d9d8021e3ce6a3a6.png)
![[Diagram]](../../diagrams/18/f09acedac1e5d4617548e24ea7bbd3be.png)
![[Diagram]](../../diagrams/33/8f7deddbc1b9cc4c89a3d970eb8c5147.png)
![[Diagram]](../../diagrams/37/bbebe1d78acb0ee475687bbaae7dbd67.png)
![[Diagram]](../../diagrams/50/ba2d7c3c5c176ddc44813fec73fe149d.png)
![[Diagram]](../../diagrams/27/0a1ba500f732dabba02db07c0da9fec2.png)
![[Diagram]](../../diagrams/41/beb200ae05fdad7d78b1cbd10c7074ce.png)
![[Diagram]](../../diagrams/34/e2b82c0edad5fbccfcbda212a06556af.png)
![[Diagram]](../../diagrams/49/5dc2510c124a3c6673534e6556863cf7.png)
![[Diagram]](../../diagrams/36/bd551a9b706db824a15ab01e875d41e6.png)
![[Diagram]](../../diagrams/31/3077c748c0d4a3c07be1869ba479cf6f.png)
![[Diagram]](../../diagrams/17/e4ff94785b5fcc75d9a262bbef73effa.png)
![[Diagram]](../../diagrams/37/ba50f35eb416565c031f9a3c531d5515.png)
![[Diagram]](../../diagrams/43/a88b31e5ed937161de34a3508766e183.png)
![[Diagram]](../../diagrams/32/24720e1def83117e31c9b2c5e495f1f9.png)
![[Diagram]](../../diagrams/1/9eacd268ce8172b5fabe4dd6ec6adec7.png)
![[Diagram]](../../diagrams/1/2ab2751aef4ddeb9fbf309e819f05135.png)
![[Diagram]](../../diagrams/20/9cf013b590036c2228561c05eb79477e.png)
![[Diagram]](../../diagrams/27/ae8038d83e2df51b53841c415acba10f.png)
![[Diagram]](../../diagrams/38/58a93dc8fd4a6b5243be4abe047f41e9.png)
![[Diagram]](../../diagrams/28/d109a6ad469ee8c79d25f1d6e8d8e7f7.png)
![[Diagram]](../../diagrams/1/24a9db1b072593f2ffa8d2eeba9bc797.png)
![[Diagram]](../../diagrams/20/3adbd284c71941906b27e4c2a8526a40.png)
![[Diagram]](../../diagrams/10/ddae0c187537f58cbc401d9e549853d7.png)
![[Diagram]](../../diagrams/49/f1c27e2f2fad92b4824537e39a1cb0e7.png)
![[Diagram]](../../diagrams/24/d4b0a35192ff1cf7b90712d2aaffa707.png)
![[Diagram]](../../diagrams/25/766c515c8c1a3b3fe652910166374d1e.png)
![[Diagram]](../../diagrams/8/77e046e5f8187bd6d3155c4f39954874.png)
![[Diagram]](../../diagrams/20/cae72732434df9d8e7c4d6d0f6bcad5f.png)
![[Diagram]](../../diagrams/32/acada6c2398498f5410a8195cd393684.png)
![[Diagram]](../../diagrams/24/43b4c0aeb3752edc8b88f6a4c6a3c2e2.png)
![[Diagram]](../../diagrams/41/26ec79b133e5685ae7d5920854e18d10.png)
![[Diagram]](../../diagrams/8/39d6bc9dadbbff177912c98faa677805.png)
![[Diagram]](../../diagrams/8/ece9efac924a97ff0db83ecd15f7ed21.png)
![[Diagram]](../../diagrams/25/2fd125f73b48c0d8eba362c7e7fe6adc.png)
![[Diagram]](../../diagrams/7/3c11abca9bab6ce60cece534526a4c5e.png)
![[Diagram]](../../diagrams/25/0149d9be51f04b62df3857e26c7c3a28.png)
![[Diagram]](../../diagrams/11/6d8e1fc76567be073355d6eac697945c.png)
![[Diagram]](../../diagrams/36/43062d4d03cb3efbfe14cffd09b32914.png)
![[Diagram]](../../diagrams/5/525967e2419188353d8d1d1361f54788.png)
![[Diagram]](../../diagrams/14/53996f188266155cd7e218c040521b6d.png)
![[Diagram]](../../diagrams/6/d4eb5f8b99f701883e6f5d71427f2048.png)
![[Diagram]](../../diagrams/47/9f7d8a3c1f7e2985c8777f3ad2728483.png)
![[Diagram]](../../diagrams/1/f60568290d7d3085eb4cd2799f2dc1dd.png)
![[Diagram]](../../diagrams/33/2d5f4ae0ab14e696eab91b3ac22ba7d7.png)
![[Diagram]](../../diagrams/10/4a04bbf866a8aca758d788f54b52a299.png)
![[Diagram]](../../diagrams/44/3447f0aa219c059b6feb331b48ff8819.png)
![[Diagram]](../../diagrams/19/013953e8332b01e2f77f5ba7aff3ed4b.png)
![[Diagram]](../../diagrams/6/4514499ec8a8be64ae8a2b0acd1e201f.png)
![[Diagram]](../../diagrams/18/72162ed108a926f1c22823eead89462a.png)
![[Diagram]](../../diagrams/16/d98519c8c0ed1a13b855403817d77185.png)
![[Diagram]](../../diagrams/50/645e14a7376431e6f52d457ff99f73ea.png)
![[Diagram]](../../diagrams/11/a498e29d70f3a465cb5ffcd6f8fbe8fe.png)
![[Diagram]](../../diagrams/5/318db27ed6219b9ed83a4bf3e3b3dbdf.png)
![[Diagram]](../../diagrams/46/9039c11f4d1716adcde153e81bdd0944.png)
![[Diagram]](../../diagrams/50/343b9f246f09e528f467251cec74a86a.png)
![[Diagram]](../../diagrams/21/6afc3f65114bbb10c615e0b085ece281.png)
![[Diagram]](../../diagrams/17/5f472cabeec85d329cf1449bbef15592.png)
![[Diagram]](../../diagrams/20/e6cef98497886f5836ba40d0b827f1c8.png)
![[Diagram]](../../diagrams/44/62ffd7ed81f4c439915ef1c6657f3fa0.png)
![[Diagram]](../../diagrams/39/995a31d66efbc2500410f8b44576e7ff.png)
![[Diagram]](../../diagrams/15/b5354d842617ccc540c33e8268b18df6.png)
![[Diagram]](../../diagrams/15/09f04a17fabf0637ad45bef35cea3fa4.png)
![[Diagram]](../../diagrams/22/9bbae862d33f974f44cfec6eaf72f983.png)
![[Diagram]](../../diagrams/49/861b1def21ebc7d6c612222aa21090fd.png)
![[Diagram]](../../diagrams/16/ca283d5ba5e4573a1989f63609172c3e.png)
![[Diagram]](../../diagrams/46/59699cd12af2a09684602e679dd02e3f.png)
![[Diagram]](../../diagrams/39/e06814ddb6cdcd1d4084b02e480e7bb9.png)
![[Diagram]](../../diagrams/33/792fe27edaff320f2a909ba790d70a3c.png)
![[Diagram]](../../diagrams/30/005c83c5a1afa65351b2da92c4a27b2e.png)
![[Diagram]](../../diagrams/41/9c25fb3c48126517d9d99aaf73fb5469.png)
![[Diagram]](../../diagrams/9/7f28513317d642ee5496dc693638d19b.png)
![[Diagram]](../../diagrams/2/7476d54854fb9fd4a384803fea0aa736.png)
![[Diagram]](../../diagrams/46/c9349659e2e2386dadeeb37c6ec2fdbc.png)
![[Diagram]](../../diagrams/19/dfb07f6ebc5d675507df05c16d835a47.png)
![[Diagram]](../../diagrams/51/1078f13eae94d7fef857f52a9270c5b5.png)
![[Diagram]](../../diagrams/8/89a573d2816d1a0e8933bbdc73c0fe3a.png)
![[Diagram]](../../diagrams/45/d3c0dd05ce04e56fa7cf9e7bedace0af.png)
![[Diagram]](../../diagrams/27/ab7b6542db6c6f7fdb5568a11e9a91c8.png)
![[Diagram]](../../diagrams/8/9a22cf2ab37a94169ffd95664bcfe7d4.png)
![[Diagram]](../../diagrams/40/f83a2e61b3a2cc90dd4635feac2dea57.png)
![[Diagram]](../../diagrams/31/a79501d62de9d8d97da052191387f831.png)
![[Diagram]](../../diagrams/31/447a0fd3587ec0e86253e78c95335db8.png)
![[Diagram]](../../diagrams/23/a5d04dc4713690ab97e72ca2dd3b5de7.png)
![[Diagram]](../../diagrams/11/92efedb5390269d40096de6a919424f8.png)
![[Diagram]](../../diagrams/36/454f2b80294d8a0b56e68ae9291057c6.png)
![[Diagram]](../../diagrams/48/7304cfbe1e5987fb0de304da270f9b3e.png)
![[Diagram]](../../diagrams/16/84c366b4e34cc7482890da23565f6d99.png)
![[Diagram]](../../diagrams/14/df778d6249301b19b730ecb4bb9ac131.png)
![[Diagram]](../../diagrams/36/ae17ec64c6be1e20479c48c3a57d1e60.png)
![[Diagram]](../../diagrams/41/fe5b6a8bd4cafb1996e3e8f2bcfa3e9b.png)
![[Diagram]](../../diagrams/16/1e24d0ddb1cbf5b26b0b99a3826be5aa.png)


![[Diagram]](../../diagrams/8/b42d4c39659a6b2e6f0d47d37fe84e7b.png)

![[Diagram]](../../diagrams/50/ca0ffa497980c439ee3aed720bb38eb0.png)
![[Diagram]](../../diagrams/23/2c017740eef763431df8207551ac8903.png)
![[Diagram]](../../diagrams/15/cce9b6e1229d181f688bd1b0b309acc0.png)
![[Diagram]](../../diagrams/0/015852e65db16c865ff51ed73b28981d.png)
![[Diagram]](../../diagrams/22/e4ad9785aa88087bc51c84dad68fffba.png)
![[Diagram]](../../diagrams/2/a25f0f0d686b34fd969f5757d040a918.png)
![[Diagram]](../../diagrams/12/557f7ff9e115b6b1bdcb5c31535356ab.png)
![[Diagram]](../../diagrams/50/cf73fdc82d0553f8db424e8766bd5f15.png)
![[Diagram]](../../diagrams/1/de0f9aad34d0e014c6ab93ae3b1973fb.png)
![[Diagram]](../../diagrams/43/4550d4cd492dd53d141eadbc472a2654.png)
![[Diagram]](../../diagrams/8/8a7a63045b7c1e5ca86024fc62424a73.png)
![[Diagram]](../../diagrams/17/1489ee069e942a5369c44c1973d0cc2f.png)
![[Diagram]](../../diagrams/31/ee86f013f0aac107fda46b9b4616d30a.png)
![[Diagram]](../../diagrams/25/bdb5e90f4fe6cc59f3534352cd3f0633.png)
![[Diagram]](../../diagrams/45/c9e43ee4b45fda67e6ae9fca50c4127f.png)
![[Diagram]](../../diagrams/12/793dcfd25c02b0dbfec89faeb967e7cf.png)
![[Diagram]](../../diagrams/12/cae492151411c73a6fc1bab17ef4ed3d.png)
![[Diagram]](../../diagrams/47/5770370f4fe5ceb6c6a9e7f70e6ee370.png)
![[Diagram]](../../diagrams/23/db5f170bbcfcd0661d8dd314c1d9d4ad.png)
![[Diagram]](../../diagrams/29/c6d095eafbc3516ba4bcc256b9098a2d.png)
![[Diagram]](../../diagrams/2/df6c6abd5b7d9919ea6976e46de91a37.png)
![[Diagram]](../../diagrams/4/9c6b0f3a564c20f57d23e09468e2fdd5.png)
![[Diagram]](../../diagrams/38/4da8a8bec49ff4f936772a409366a93c.png)
![[Diagram]](../../diagrams/18/ba3d2b25a23eae2c29d0622793e968bf.png)
![[Diagram]](../../diagrams/32/d89693602f3b3662139485df16e0bb9f.png)
![[Diagram]](../../diagrams/5/cf3f5a41ee21da37393dd932d506ecff.png)
![[Diagram]](../../diagrams/31/81bf99de6bdd1756fb2029a170bfae65.png)
![[Diagram]](../../diagrams/31/cc5d14cae82ea045ab1c125ec4f45df2.png)
![[Diagram]](../../diagrams/6/e258408cd5a6c301dd0f3114383e5e1e.png)
![[Diagram]](../../diagrams/27/bc70ac4d3846114f71ae98f9103c58d7.png)
![[Diagram]](../../diagrams/50/c2f0b1881e63584ad5098de491bc73b6.png)
![[Diagram]](../../diagrams/7/0ecdf0a89de0f7039d2edcb860071b99.png)
![[Diagram]](../../diagrams/49/de23ab12096dee4da2f32c7a6851ea01.png)
![[Diagram]](../../diagrams/44/c23e83fe3a6a09ff79f4ff63b17c3b5e.png)
![[Diagram]](../../diagrams/41/308ebc861fa64fb4017d83b371f082aa.png)
![[Diagram]](../../diagrams/1/fec9a24f0ed4e95050ac31f2f628c3b9.png)
![[Diagram]](../../diagrams/38/de52884f99306acabb619d289ef3789f.png)
![[Diagram]](../../diagrams/36/3f1b5aa240548367dcaaba3111d4abed.png)
![[Diagram]](../../diagrams/27/8a65347d7070ff69800c5ba7876e2f2e.png)
![[Diagram]](../../diagrams/30/acb2b3c6cf45b49de46a9a0fd43689ec.png)
![[Diagram]](../../diagrams/24/9cc888239ff69d0bbc7232285c75d281.png)
![[Diagram]](../../diagrams/27/09f7a2f0221c90ccde954d7ba72f050f.png)
![[Diagram]](../../diagrams/12/4386a3567fd8d71f39677adce17efdd9.png)
![[Diagram]](../../diagrams/36/f897f45e7e5ba48e89f996ab3bb86d60.png)
![[Diagram]](../../diagrams/14/1f7b32244b65b078a12b1a049a8fe8c7.png)
![[Diagram]](../../diagrams/12/bdcf075fdb63c8aa2748db85f115ff51.png)
![[Diagram]](../../diagrams/44/48854ee42ba3b6bbb60da7bd84968ab3.png)
![[Diagram]](../../diagrams/25/c4405c5a30ee656ba21c6805214d5a39.png)
![[Diagram]](../../diagrams/33/5a76c0ac49f4225723d24cbbe0a31c4a.png)
![[Diagram]](../../diagrams/11/e1aeaa8df5ebf652ec6ae7e563dd85f9.png)
![[Diagram]](../../diagrams/52/ec0d4a27873561ca4bfe6efabfd2c27d.png)
![[Diagram]](../../diagrams/50/bb110b303e30ce4132431fde3924db9d.png)
![[Diagram]](../../diagrams/9/3320c25deea2c8c858924fa6485ed8f0.png)
![[Diagram]](../../diagrams/37/0381df31acfb324e487dcda0e36a457c.png)
![[Diagram]](../../diagrams/43/a55807108ad9018a83f4d6a794e7150c.png)
![[Diagram]](../../diagrams/1/dc513c625070899af1c546f730341085.png)
![[Diagram]](../../diagrams/45/2c2444ce3e484b380667bcb9ce1aec51.png)
![[Diagram]](../../diagrams/2/8960f0341724cf7c86ec7829bfe19230.png)
![[Diagram]](../../diagrams/3/d6177abd5f8181c16524c5edc6286589.png)
![[Diagram]](../../diagrams/46/30876adf820ad20ca918662b01f1d597.png)
![[Diagram]](../../diagrams/9/8491d8ad0ca5643b49bcd6a51a50b7f9.png)
![[Diagram]](../../diagrams/23/07d34b307c2fd654dad70b760f9633b5.png)
![[Diagram]](../../diagrams/17/2114c4207a65f2e7bdc9864036fe9fad.png)
![[Diagram]](../../diagrams/48/885773040489a3370410d4eca3e0c518.png)
![[Diagram]](../../diagrams/33/eaae63a8a6d7537c97430b4223ae053f.png)
![[Diagram]](../../diagrams/52/286436cf532aa68652746e89381108a2.png)
![[Diagram]](../../diagrams/27/5bc3833a958e780ee354ac967b968737.png)
![[Diagram]](../../diagrams/35/b81ee2fb13c74eb0fc7cd04c8cf52c8d.png)
![[Diagram]](../../diagrams/17/dd3e6d627ca262baaeec60581b38944d.png)
![[Diagram]](../../diagrams/6/ec6dc6c6feee803e2d41adfbb2a7eefd.png)
![[Diagram]](../../diagrams/35/89476c84ad4d3cc45c372cc165cd15b3.png)
![[Diagram]](../../diagrams/17/f284c1b414f81afc3b95564878174b4d.png)
![[Diagram]](../../diagrams/23/5c5d4c88de7d0c652ddf0c726e184a3a.png)
![[Diagram]](../../diagrams/24/e53bc5220e15f5e824bd14c39230a93e.png)
![[Diagram]](../../diagrams/29/bf749620223c48486a6a163814d3945f.png)
![[Diagram]](../../diagrams/30/12c5f1ed2a2da2f350f245c3dc13ab9f.png)
![[Diagram]](../../diagrams/24/eed8aa15d48cf385090b8785cbe0b8de.png)
![[Diagram]](../../diagrams/23/bc36cbe940f0ee0b70d66d4a291580c9.png)
![[Diagram]](../../diagrams/52/2552bd890ea6ca859bb9dd1736aa93f9.png)
![[Diagram]](../../diagrams/49/48acde8f1d613bd6e344024ae90ac0f5.png)
![[Diagram]](../../diagrams/47/d190d6a7f3d6d5fbd3846b4cff53a1d8.png)
![[Diagram]](../../diagrams/34/4e572f80c83b2c4d13195e4a3e48d5e6.png)
![[Diagram]](../../diagrams/22/48290f96ecd3aacd15a9893cc42cdf36.png)
![[Diagram]](../../diagrams/50/e3ed6164a9643540df0a52f632e29c69.png)
![[Diagram]](../../diagrams/23/f72f9ecf8a72486f0cf7f430bd89319b.png)
![[Diagram]](../../diagrams/8/c26922b979f6ba10b34286adbcf94a4c.png)
![[Diagram]](../../diagrams/13/7366cae1835ea077ccb5beca90a43806.png)
![[Diagram]](../../diagrams/2/a16081ccb363126bb4205a001984a0f1.png)
![[Diagram]](../../diagrams/49/676bc1e7b766571ff65bc0ff4fb0b660.png)
![[Diagram]](../../diagrams/36/1af1fa99fa6683ed8004e8c4348b63e8.png)
![[Diagram]](../../diagrams/34/4067d9387d609f5017280880de943fa2.png)
![[Diagram]](../../diagrams/4/cc6872d0e90d86abf0b95729a5323f02.png)
![[Diagram]](../../diagrams/44/f4a42b0b4b1e7ecfaeef2c40ddad5626.png)
![[Diagram]](../../diagrams/22/0d69864338ef63dc9366ea41aec0911e.png)
![[Diagram]](../../diagrams/38/bdf9b4a4954a3458dcb1c6c6f123f79e.png)
![[Diagram]](../../diagrams/21/d3dd836b2b4d3a3fdbe0e7a84cde5597.png)
![[Diagram]](../../diagrams/23/8bccac563ba80ba59b297d71a6cfc482.png)
![[Diagram]](../../diagrams/17/bbf421b6a808d75b70aab91bc8854075.png)
![[Diagram]](../../diagrams/42/17d13d8f942ebb5b9477b53c6c98414e.png)
![[Diagram]](../../diagrams/19/121983d6efafe27d5d67ae546be4b28c.png)
![[Diagram]](../../diagrams/3/88535a0b2a7757438587b52bd3a84221.png)
![[Diagram]](../../diagrams/30/9008f6238548ff5f6769126f68b39a6a.png)
![[Diagram]](../../diagrams/0/7490a6af4de7269387bf1f32a3bb012b.png)
![[Diagram]](../../diagrams/18/1153fb7ae73b0e5886c047ac0bf8c213.png)
![[Diagram]](../../diagrams/34/8de0a11a5bf6955f2ae143665c1c5684.png)
![[Diagram]](../../diagrams/39/b1b82635ba947189650f85721d061dfa.png)
![[Diagram]](../../diagrams/21/995b8ae88058c6fe1ff8a48a62e1d4cb.png)
![[Diagram]](../../diagrams/20/85850f740ec3404668c25e3232f6904d.png)
![[Diagram]](../../diagrams/36/10ad94b7205dcc569d7478d2439f2247.png)
![[Diagram]](../../diagrams/2/8a7d22cff63d3aa1620a69659adfdeec.png)
![[Diagram]](../../diagrams/30/ecb4e17712d12aaffc0e32c799870747.png)
![[Diagram]](../../diagrams/35/16edb8b402d856faedeb287423efda5a.png)
![[Diagram]](../../diagrams/37/9390a0fb630efa1ae5709dc017bfa213.png)
![[Diagram]](../../diagrams/4/a7e9382beca1976aaf7adf99fb021484.png)
![[Diagram]](../../diagrams/42/b1da6179e15025683401b9a038bd50e0.png)
![[Diagram]](../../diagrams/42/0c9a6263c73ca6b5e5ad48afa21fab8f.png)
![[Diagram]](../../diagrams/29/3b8f643da8f960beee1f33e38eed0265.png)
![[Diagram]](../../diagrams/48/a060ce2ce85e95792351f9462d3fe0fc.png)
![[Diagram]](../../diagrams/40/b911b39ca46938eaf08b2f9698af8d78.png)
![[Diagram]](../../diagrams/16/13afb8ab35a566e98cfef912534fec79.png)
![[Diagram]](../../diagrams/14/b4ec24bafc0f29d4e3e6b672d8a13452.png)
![[Diagram]](../../diagrams/23/48bce6eb3f4d3b2e85c65b089a2fff8d.png)
![[Diagram]](../../diagrams/44/f645fc982e73078dfe07b09cd231f187.png)
![[Diagram]](../../diagrams/7/2f510e45fad32ac930a9ba1f86c7c8aa.png)
![[Diagram]](../../diagrams/29/94313c925de6e9935d3c87a3a672dc4f.png)
![[Diagram]](../../diagrams/39/7255f40a2513fdc165c9edf25e5622e2.png)
![[Diagram]](../../diagrams/45/25711d9f4cc4ae684d72f9632ba0af20.png)
![[Diagram]](../../diagrams/24/b3e5fb07687de78bcaa327deee043a97.png)
![[Diagram]](../../diagrams/15/43ad28b0e1744c6b419c2299e9ea7ae1.png)
![[Diagram]](../../diagrams/51/0c5a3b25a37a3d95bc402cad31ddc851.png)
![[Diagram]](../../diagrams/44/77dd835cd6c6b95ca8944bfd82b6600d.png)
![[Diagram]](../../diagrams/43/474dbe20023f66adcf3e095d8748f6e0.png)
![[Diagram]](../../diagrams/1/e233fbeae1ae342f7297a5587d557796.png)
![[Diagram]](../../diagrams/35/c5aeeef96621802bbe42e44231633d5c.png)
![[Diagram]](../../diagrams/11/9f758f73582b9ffebf5bf1923a51a172.png)
![[Diagram]](../../diagrams/20/ebc08e55a97ec3eca4e11883039b3e45.png)
![[Diagram]](../../diagrams/50/467f3cee5e934ce85318a006f680e698.png)
![[Diagram]](../../diagrams/1/1a1862765444e92bbf945e9b943f042a.png)
![[Diagram]](../../diagrams/12/e56611563362d44ac1c8bd337e9c2ee2.png)
![[Diagram]](../../diagrams/37/27ebaba6ae8ae4d1b1137ee4de637a99.png)
![[Diagram]](../../diagrams/40/0db89b16f94c2646b6eb7fab50c61eff.png)
![[Diagram]](../../diagrams/20/74710153095c091486bf2b3ee3f1d379.png)
![[Diagram]](../../diagrams/34/40d54cf861c1f0c53aa2cae457c57b67.png)
![[Diagram]](../../diagrams/13/7c397300a45438b26601a3200ac4d1fa.png)
![[Diagram]](../../diagrams/3/2c70e793571a92646d7b49e30ffd4ca4.png)
![[Diagram]](../../diagrams/12/c7cd3cb94a32b228d01b1393b54073e1.png)


![[Diagram]](../../diagrams/44/950d0ad6c2bc5f040cd571718b223467.png)
![[Diagram]](../../diagrams/41/2b3e77a4e2a18fbad1418dd5ba392d1a.png)
![[Diagram]](../../diagrams/49/a620f57058a6ca9698928caafb017fce.png)
![[Diagram]](../../diagrams/1/b2e7c2a9d3fe1851497e2e8c3b43168a.png)
![[Diagram]](../../diagrams/1/490835a25abc578e5106f097c3f8caef.png)
![[Diagram]](../../diagrams/16/179552bb375d6b16f7948f92fe95e6ea.png)
![[Diagram]](../../diagrams/31/e5b9cd1eb854a4be560124ab9a2f1d90.png)


![[Diagram]](../../diagrams/5/114cda2afc66e43a2f2adb4f59ee46b7.png)
![[Diagram]](../../diagrams/18/3a39afdb5d04c58533ed82d0b5ccb911.png)
![[Diagram]](../../diagrams/37/cc94c9603ddcd580ecb8e02145dee0a6.png)
![[Diagram]](../../diagrams/35/b3af45f16644918a48c474590e17a3c4.png)
![[Diagram]](../../diagrams/46/974e5ec108ef243b4f37f8e58ffe851c.png)
![[Diagram]](../../diagrams/21/30067805cba9ca12885df0772e7143ed.png)
![[Diagram]](../../diagrams/30/ff842a2f34454f2234cb459f77df8a15.png)
![[Diagram]](../../diagrams/6/1e3d5f256dcae024d44ed10069a186a5.png)
![[Diagram]](../../diagrams/41/81b8f4d35e39d43224d53933d54a6aba.png)
![[Diagram]](../../diagrams/48/01e7c0ab1c9f37951fb98f9e13f0aaa3.png)
![[Diagram]](../../diagrams/1/842ad36afb1dd2d4881a0a7562c6ae19.png)
![[Diagram]](../../diagrams/32/8700f716ea07024d7b449cde48201d7c.png)
![[Diagram]](../../diagrams/3/33ee6d5f0dae61f3bb7f2bd1798e39e7.png)
![[Diagram]](../../diagrams/5/06f919d80e41a00d4a4f634c4ee98572.png)
![[Diagram]](../../diagrams/25/12c5ee6021923288ee836a4df5735910.png)

![[Diagram]](../../diagrams/19/667a992bf96be567f107dd7ba80a250c.png)
![[Diagram]](../../diagrams/2/08dbc8aff221d8ac21bdc29955b836f9.png)
![[Diagram]](../../diagrams/24/76bf764dc562eb03ff27863aba6d55af.png)
![[Diagram]](../../diagrams/43/b3bfc4ebf1c67debeebf1b8567d725c0.png)


![[Diagram]](../../diagrams/36/ff03ae3027636ae636c41d45e87fefee.png)
![[Diagram]](../../diagrams/52/3c270b04afbb032b40ad9b99471e1b15.png)
![[Diagram]](../../diagrams/22/8d5fad4fd07d1f3f48e0e6722c42e943.png)
![[Diagram]](../../diagrams/33/a4e5492a1a617109279ca135c78da676.png)
![[Diagram]](../../diagrams/8/8bb37911989df45460566426a74b6468.png)
![[Diagram]](../../diagrams/20/acbf69b6a9741484d3b959a97820f121.png)
![[Diagram]](../../diagrams/40/fd98f269e80ad55e0b3b594304246525.png)
![[Diagram]](../../diagrams/45/e52b60a034b806fee7c095297a58f79c.png)
![[Diagram]](../../diagrams/37/25933c59dbd4d01e088b461de81bc949.png)
![[Diagram]](../../diagrams/17/7b0ab5b82ba13b264160670f5b0b6571.png)
![[Diagram]](../../diagrams/2/66cf5fde03661556f40afdd988811e81.png)
![[Diagram]](../../diagrams/25/b3532fceea31063b0ca539b1ffdaad1d.png)
![[Diagram]](../../diagrams/48/ba0de39ecfff1e4bb8565631a9dc025e.png)
![[Diagram]](../../diagrams/48/d7b46e2e3e1873dee9cdf9b940c2cfa4.png)
![[Diagram]](../../diagrams/38/1ce4b27f94fe7ee0c56e765b3aa90c08.png)
![[Diagram]](../../diagrams/9/d8921f739787540aeabbc297cfb09358.png)
![[Diagram]](../../diagrams/35/f00f78fd9b8946da068f218267197e07.png)
![[Diagram]](../../diagrams/29/65b7d8416fa4fcaf9af762247320b1e0.png)
![[Diagram]](../../diagrams/13/72f75ae9ef35602345bb4a15f367136a.png)
![[Diagram]](../../diagrams/27/a5bb0c4d2b325cb8326cbeed53ba2e04.png)
![[Diagram]](../../diagrams/52/2f827a79a15ec89a67232b8a9d1896ca.png)
![[Diagram]](../../diagrams/29/cfee32db7c7feb582fd8f338e8b96b97.png)
![[Diagram]](../../diagrams/19/db346db3bfa0276f9f2d1fd5515b513a.png)
![[Diagram]](../../diagrams/3/1a0532becfa2f1b69bec2da583cfa291.png)
![[Diagram]](../../diagrams/43/36bfa0a42e7c16396ab7d4d2f5c3cb75.png)
![[Diagram]](../../diagrams/52/9df6e7b2970c9808b9088db2d0242192.png)
![[Diagram]](../../diagrams/52/eab6485f3a4a9642687aa83594f86a5a.png)
![[Diagram]](../../diagrams/37/d1990dd25ffa217f2612f680a199a88c.png)
![[Diagram]](../../diagrams/14/c4c4a336b35f3a53e81e8e12373eeaa4.png)
![[Diagram]](../../diagrams/23/aaeaa49f859137baf2e4a5bf4216a14b.png)
![[Diagram]](../../diagrams/16/6d229333158f2ca11a5db93cb71ee42e.png)
![[Diagram]](../../diagrams/6/a2ab733adc3e6b43870580ba89436dad.png)

![[Diagram]](../../diagrams/39/07d7dd11840a7861ce645d1967ed0146.png)
![[Diagram]](../../diagrams/3/a643e54f90cb1cd44536c72df353c37e.png)
![[Diagram]](../../diagrams/17/0d9c92aaa76c32851289c03f3ba53f71.png)
![[Diagram]](../../diagrams/29/582ae15b28b42d17f221cda4c0a8d813.png)
![[Diagram]](../../diagrams/0/0ec96a32a26009619520049834d14872.png)
![[Diagram]](../../diagrams/24/1839ef8fc9115c06394dfccc8d1cdb2a.png)
![[Diagram]](../../diagrams/29/5f71abaae44de210462f90ba0b2eae68.png)
![[Diagram]](../../diagrams/40/415fa526ec6f2c90ef98d01b06be41a7.png)
![[Diagram]](../../diagrams/30/4d25e08bcf6a7da7ce12282399792a2e.png)
![[Diagram]](../../diagrams/48/876ad2bfff941151963e90c5b3b95e51.png)
![[Diagram]](../../diagrams/43/194df12cd3ee10ebd86dde459720c4e0.png)
![[Diagram]](../../diagrams/15/cbafd8ee0c0b50713f443a4076674774.png)
![[Diagram]](../../diagrams/38/2d5994db4dddf9021c41e6abfec587d5.png)
![[Diagram]](../../diagrams/44/d063f6c4316894d8bda932641f9853cb.png)
![[Diagram]](../../diagrams/22/2857fb8e9b31b66ee1b32182d2b4152f.png)
![[Diagram]](../../diagrams/49/19eca985cecff7b91d649c54cee12194.png)
![[Diagram]](../../diagrams/8/942261808049aaf7cae233f13e6af495.png)
![[Diagram]](../../diagrams/22/5c46056e273421a8d02b3a4e9361d33b.png)
![[Diagram]](../../diagrams/43/46fc0bf42fb6f19240e8db9088bda8e9.png)
![[Diagram]](../../diagrams/21/9267f31d6a3c6318650b9bf8dd2e3528.png)
![[Diagram]](../../diagrams/29/b59700bb52b231c38a3777973dac95b0.png)
![[Diagram]](../../diagrams/11/7d0d60340479855d73eb4599050bb7ac.png)
![[Diagram]](../../diagrams/44/215601b63874b669421e78203e46fa4f.png)
![[Diagram]](../../diagrams/36/ea662a9f21939d5e6ba785345159e2e9.png)
![[Diagram]](../../diagrams/18/0805f6ef1a3d02a3a0ed68ad8d4c32e4.png)
![[Diagram]](../../diagrams/21/645659afa6cd63021acb39c9dd5a4f69.png)
![[Diagram]](../../diagrams/48/cd810b4dc50588f5a6f773c25041128d.png)
![[Diagram]](../../diagrams/16/608e918c67c048ef5b05316eb41f7df6.png)
![[Diagram]](../../diagrams/38/23d4909463e6c2add9937d662c6ae062.png)
![[Diagram]](../../diagrams/42/c69cbd4ef138ec7d6473e73723b1aa27.png)
![[Diagram]](../../diagrams/8/5811a854f4a1f014be471eb30e5f95f9.png)
![[Diagram]](../../diagrams/1/2791d602835d6a23a4fee781e0256f29.png)
![[Diagram]](../../diagrams/18/3543f492789365291e3222f1f055064a.png)
![[Diagram]](../../diagrams/1/d98b7f43d8f0111154728c11527e57bd.png)
![[Diagram]](../../diagrams/26/a3d29e208bedb3720e98c0cfb5d675a8.png)
![[Diagram]](../../diagrams/1/8928b22d1bc79aa98f6fc8dd1563c49f.png)
![[Diagram]](../../diagrams/39/9209b9e53e654e789c7673f0039ac820.png)
![[Diagram]](../../diagrams/29/2ca4e5a0dfab001ec205495347743301.png)
![[Diagram]](../../diagrams/13/53be2df1738277b47f8686a03877a4bf.png)
![[Diagram]](../../diagrams/26/359ddbde4c32c826e636ccc5f0704fea.png)
![[Diagram]](../../diagrams/46/c295e2fbe70688c4723b92aa47080757.png)
![[Diagram]](../../diagrams/29/876b0e6b43435c025956aa7c4d7ca88c.png)
![[Diagram]](../../diagrams/0/126aff9934077fc6764322f163c01812.png)
![[Diagram]](../../diagrams/37/a0117b0e08c7a87ba9a2118c0b1d6130.png)
![[Diagram]](../../diagrams/50/b520351ff001c10b322f0b58a4c81275.png)
![[Diagram]](../../diagrams/46/fc7121fc8a9c0605f3a09cc19e702ccb.png)
![[Diagram]](../../diagrams/22/c3e258264ae826003f3e50028d1c8f6b.png)
![[Diagram]](../../diagrams/33/47f4676b92cf07a61465b3a140fce422.png)
![[Diagram]](../../diagrams/24/170cc63d953adcc24e23a86e12783fa3.png)
![[Diagram]](../../diagrams/8/f229274fd7fe0f2234c714538e18b133.png)
![[Diagram]](../../diagrams/20/ae05fd32d44f9bbfe2c61068fa01afbb.png)
![[Diagram]](../../diagrams/11/3f498ddbd51bc50d3331d29b3b47ec0e.png)
![[Diagram]](../../diagrams/42/306958d96347ea4cf4ceb453cc8112f2.png)
![[Diagram]](../../diagrams/4/6a70a1f0e214d392fcf4a910c09a7516.png)
![[Diagram]](../../diagrams/4/2537cdd0f9dd1498e3c193ef3416de90.png)
![[Diagram]](../../diagrams/11/60f45b80306582c8823ca40ede754a75.png)
![[Diagram]](../../diagrams/36/52137ce2025e6e92fe2ff624e7c04b52.png)
![[Diagram]](../../diagrams/22/958d6d79992469d779b9990eec29815f.png)
![[Diagram]](../../diagrams/13/10f25bda8d7775506ea90fffc5b2f2a4.png)
![[Diagram]](../../diagrams/37/f00355c0a9cccf07f2d8051cf451ce17.png)
![[Diagram]](../../diagrams/43/2f940458690f43d87395fe3fac117067.png)
![[Diagram]](../../diagrams/30/1f9a235c8ec75db510c1da861b853f14.png)
![[Diagram]](../../diagrams/10/94ffab31863c1a8c97305f5f46eed9b3.png)
![[Diagram]](../../diagrams/32/4cf06b65aae93f107fd929ae981361c4.png)
![[Diagram]](../../diagrams/3/c2e7bb945b883c0a19ab784d8c792f37.png)
![[Diagram]](../../diagrams/26/806ba34fa132a3de875e9bf600ee13cb.png)
![[Diagram]](../../diagrams/34/f9b293af1de4f6b69a07d1637f874ee0.png)
![[Diagram]](../../diagrams/35/279d979a87c0c65f3a150c590b583f92.png)
![[Diagram]](../../diagrams/34/bdddaa088224fd3ed15805efb789ec20.png)
![[Diagram]](../../diagrams/26/f55d5e3b69e0146e79dc57c5999e3762.png)
![[Diagram]](../../diagrams/20/f466a1e7320a3e394bf7b7a327469ba0.png)
![[Diagram]](../../diagrams/19/15520ec1cdb9d6a23c14c12758e20728.png)
![[Diagram]](../../diagrams/13/aa3a0fdd5535bb74638e0f163fede2e1.png)
![[Diagram]](../../diagrams/38/cbf187552559a3f1cabc2fb9eea252e6.png)


![[Diagram]](../../diagrams/14/045619dc1374cbdd775a13b266ba771e.png)
![[Diagram]](../../diagrams/7/3343debf228bedf6d89156c9e62e036d.png)
![[Diagram]](../../diagrams/18/a72723e1f5418c57557a8b3912abdbe1.png)


![[Diagram]](../../diagrams/23/a41728c55e8819b87a1f249f454f7caa.png)
![[Diagram]](../../diagrams/14/94acd1fe66e490ec0ec3134c95d0cd49.png)
![[Diagram]](../../diagrams/1/1270961d17231e33b5c27896ae881aa2.png)
![[Diagram]](../../diagrams/6/83b3fbb869225e6d7cb1d661d405c285.png)


![[Diagram]](../../diagrams/30/49c8b70cda62a454cc49ba68a1c7b8db.png)

![[ext]](http://img72.imageshack.us/img72/3073/step012zd.jpg) http://img72.imageshack.us/img72/3073/step012zd.jpg
http://img72.imageshack.us/img72/3073/step012zd.jpg
![[ext]](http://img72.imageshack.us/img72/3610/step027qr.jpg) http://img72.imageshack.us/img72/3610/step027qr.jpg
http://img72.imageshack.us/img72/3610/step027qr.jpg
![[ext]](http://img339.imageshack.us/img339/2320/step037aw.jpg) http://img339.imageshack.us/img339/2320/step037aw.jpg
http://img339.imageshack.us/img339/2320/step037aw.jpg
![[ext]](http://img339.imageshack.us/img339/6580/step040ql.jpg) http://img339.imageshack.us/img339/6580/step040ql.jpg
http://img339.imageshack.us/img339/6580/step040ql.jpg
![[ext]](http://img363.imageshack.us/img363/8994/step050fq.jpg) http://img363.imageshack.us/img363/8994/step050fq.jpg
http://img363.imageshack.us/img363/8994/step050fq.jpg
![[ext]](http://img363.imageshack.us/img363/8674/step067nb.jpg) http://img363.imageshack.us/img363/8674/step067nb.jpg
http://img363.imageshack.us/img363/8674/step067nb.jpg
![[Diagram]](../../diagrams/41/523526deb0140c28aef8c86e5e150241.png)
![[Diagram]](../../diagrams/9/fdbf7f2cb404818c9dc72a9e3d85f6bf.png)
![[Diagram]](../../diagrams/51/eeb9e260c49b0a89e8936f70927e0c64.png)
![[Diagram]](../../diagrams/11/f89e392a5e6b42a6d60c76f98e4821ab.png)
![[Diagram]](../../diagrams/51/f2b12feb2e2b99eb397e157bf370b82e.png)
![[Diagram]](../../diagrams/36/25946d44ec9c32db07128fe6e39c8fb5.png)
![[Diagram]](../../diagrams/34/c18659e826c919a4f70dd1186c1eb20a.png)
![[Diagram]](../../diagrams/17/16972a1b8e8ad2634eadfa19c5a66e17.png)
![[Diagram]](../../diagrams/49/6ce4081321fe2cb0c4608ff4d799d357.png)
![[Diagram]](../../diagrams/38/dcfa870bceac3fb811981d0cda9daa2c.png)
![[Diagram]](../../diagrams/27/04d24f69370fa2105c8ee0cea3d06777.png)
![[Diagram]](../../diagrams/21/1ddabce4f9bc94079a4ed299884792c9.png)
![[Diagram]](../../diagrams/33/a8dff4e4d024909be9fbd2dc8e9b68fb.png)
![[Diagram]](../../diagrams/44/ba4e5704955b8f6b1d0a741773be9437.png)
![[Diagram]](../../diagrams/12/49918268db6e573b82513aa5a3af8ba0.png)
![[Diagram]](../../diagrams/33/b962950f242a37bd2cbbd6cf8386e7d7.png)
![[Diagram]](../../diagrams/30/6bb7931b4899df3e45cb90c048563b62.png)
![[Diagram]](../../diagrams/30/8d155e6d0aa5643f1ca61adc0ef704a8.png)
![[Diagram]](../../diagrams/3/18a62d9cbc31fc99c325c8beba840d0c.png)
![[Diagram]](../../diagrams/43/9411799a6619618b88ee294a73bf3689.png)
![[Diagram]](../../diagrams/20/7d7c9eabbb7bb3c122d198ebe58ac1cd.png)
![[Diagram]](../../diagrams/5/3c03fb93f058e479a3d1bcd6553b5f2a.png)
![[Diagram]](../../diagrams/21/baad5de0725eada2f873c675dd86cfd7.png)

![[Diagram]](../../diagrams/18/24cbfd62a1bae327b7d54090c01def4f.png)
![[Diagram]](../../diagrams/21/dd129c663db2fc64a66df16c61d3c439.png)
![[Diagram]](../../diagrams/1/dece67fdf98d83e143a6d648b522924f.png)
![[Diagram]](../../diagrams/11/9981af1d3e12093da02e1c129fc407bc.png)
![[Diagram]](../../diagrams/48/c8189a41a1d03f3a4a52e73383db93e2.png)
![[Diagram]](../../diagrams/26/086fd2280f8e719bb469be6126bbbde3.png)
![[Diagram]](../../diagrams/3/c064b3f6921bd6ff4278ce6c78360d9f.png)
![[Diagram]](../../diagrams/33/1100efc3f6df44ab7ca3d1ecbe3ade20.png)
![[Diagram]](../../diagrams/2/89bd4ea0c7b8b5b7dc0ee9495302b3ef.png)
![[Diagram]](../../diagrams/37/cc571235dc53d694b8d14de3e59cb9d2.png)
![[Diagram]](../../diagrams/12/e758c7ff81d9ebc4cb138ce21ebed814.png)
![[Diagram]](../../diagrams/47/2fb9f9678c7b967dae9df3374902e7b2.png)
![[Diagram]](../../diagrams/5/e6398fb169132a10c7415f1d23ee9878.png)
![[Diagram]](../../diagrams/28/03a6165c5c006c0b0976078876d0f802.png)
![[Diagram]](../../diagrams/31/93a97f343776cff759db2f23730441e1.png)
![[Diagram]](../../diagrams/10/f2ba60285418fd8a88507a9fdc81db2f.png)
![[Diagram]](../../diagrams/15/c810935f3600e101d6e2748d7328f39f.png)
![[Diagram]](../../diagrams/10/bb567968919121bee122b5eeb6fba8e7.png)
![[Diagram]](../../diagrams/47/4cf367b169796f1d768ddaeb04b49c70.png)
![[Diagram]](../../diagrams/35/386efea294c100a8c14f65a315d19fd4.png)
![[Diagram]](../../diagrams/22/69f64032f7c67d48beab2e08930adad1.png)
![[Diagram]](../../diagrams/2/c8485706a40018dc536945cb942523e7.png)
![[Diagram]](../../diagrams/15/0db3e188e35b39515d73e42f5026d36f.png)
![[Diagram]](../../diagrams/47/677cb8b1c25b556ac62a8dbf9b326be5.png)
![[Diagram]](../../diagrams/2/cf33b61313ca1e32008eaa1e56614707.png)
![[Diagram]](../../diagrams/4/cf86544b4b9e73d0d541a2f0a281ebc5.png)
![[Diagram]](../../diagrams/24/56a665be043913aa52f0cdbf47d4aa41.png)
![[Diagram]](../../diagrams/40/575c23d249fa40fd28dd693b7257cb5e.png)
![[Diagram]](../../diagrams/3/5061fc76506831371718ce07989445be.png)
![[Diagram]](../../diagrams/3/492a086d2006a462d2406292fafb4660.png)
![[Diagram]](../../diagrams/29/bd0a120a1a4aa65e9d7c60ada5f22558.png)
![[Diagram]](../../diagrams/37/c765d61bc7e99b27a3239d1feb7134a4.png)
![[Diagram]](../../diagrams/28/1a3ec88abdd5ef2597d104059d8f9c5e.png)
![[Diagram]](../../diagrams/21/990f6d45b0886c41485de421079a1d62.png)
![[Diagram]](../../diagrams/40/c48a7dc637ba4e4aa4cacf262d332efb.png)
![[Diagram]](../../diagrams/39/dadcfee46f07d506d77486909a09fabf.png)
![[Diagram]](../../diagrams/3/ad4326c44608f8fa6756ed967abbb161.png)
![[Diagram]](../../diagrams/14/942b86eac8787214a361c9a0a21fff8b.png)
![[Diagram]](../../diagrams/35/a5682ec1fedfb6a25a76579a53fab961.png)
![[Diagram]](../../diagrams/16/5693c559e18f9d08b01a4a6b7bfa3ee5.png)
![[Diagram]](../../diagrams/19/0ce7566037e23927f4bd82fb3b85b8b1.png)
![[Diagram]](../../diagrams/19/c5fcfbeab89136f0422869f0d093ccb7.png)
![[Diagram]](../../diagrams/1/ff7b9ee72f617ec43d33b417fb9035b1.png)
![[Diagram]](../../diagrams/48/ebc849888a62aff289b8e72d582958c1.png)
![[Diagram]](../../diagrams/12/8e7b22b93cffc044dffdae036bb71adb.png)
![[Diagram]](../../diagrams/20/28821b0a3e3f1a4a139b1f6aed4e8861.png)
![[Diagram]](../../diagrams/29/dfb59667f7cf3d906c1aeab9022743ca.png)
![[Diagram]](../../diagrams/46/0231403f5c1753aba14a1c3e3b3f5c42.png)
![[Diagram]](../../diagrams/47/44a2e66234ad307c0d13fcf2a5fd15e4.png)
![[Diagram]](../../diagrams/3/f9c5c6be113bbed24e5e6563e6dba442.png)
![[Diagram]](../../diagrams/15/f21890019e4fb1301a7ec61e1371211e.png)
![[Diagram]](../../diagrams/31/cfa7408998f3594bfb3e16f25c149b8d.png)
![[Diagram]](../../diagrams/47/332f150ec1524faf262eac2a92f6caa5.png)
![[Diagram]](../../diagrams/46/ec078b19540680e43a9307bf9803c196.png)
![[Diagram]](../../diagrams/52/a198d9513a1e3bc2fe671d749bf45b6f.png)
![[Diagram]](../../diagrams/36/00cfe84bdec2e86dd5682beb45a7a028.png)
![[Diagram]](../../diagrams/46/96935936596e5b8914bf20df02b2fd1c.png)
![[Diagram]](../../diagrams/10/25edb539d19db3e73cc88acc86518c7e.png)
![[Diagram]](../../diagrams/50/90920f669c6a9833fab278914691f5f7.png)
![[Diagram]](../../diagrams/43/6766399848456793b664dad1b965e885.png)
![[Diagram]](../../diagrams/12/ec5109b728b06b6a65f463c17b878e9f.png)
![[Diagram]](../../diagrams/41/e1ac8d85c623bc130ea19c631992bfd1.png)
![[Diagram]](../../diagrams/33/ddae05e95f4c5308cdf8a62ed687a77f.png)
![[Diagram]](../../diagrams/27/2454d2165b8c1d5e562a65f9f50ee4e1.png)
![[Diagram]](../../diagrams/4/03aec0cef6347c5a9ba6c803387b0b2c.png)
![[Diagram]](../../diagrams/2/e69e4095d8bf76a2187d7aa14d98e5f9.png)
![[Diagram]](../../diagrams/37/52919735178d87fb71b7c77a10b21ede.png)
![[Diagram]](../../diagrams/7/ef1810ba498e4e40441a4d2d876b3088.png)
![[Diagram]](../../diagrams/30/0ca20ddcbb87c915acab1e89b469bd50.png)
![[Diagram]](../../diagrams/44/515f841e234e50ec1450e3f4a51f2820.png)
![[Diagram]](../../diagrams/37/6d1c16114f71d1a545e99c49edbfa550.png)
![[Diagram]](../../diagrams/26/17b7220f5bd52fe2f63752f696b10a05.png)
![[Diagram]](../../diagrams/27/cc2539a6ffbecb2d60a253c24443dd02.png)
![[Diagram]](../../diagrams/25/9c137250cb9aad1c2f92d3a15dd64f98.png)
![[Diagram]](../../diagrams/49/b11331aec5bbf1af83d635f7d9b5f7fa.png)
![[Diagram]](../../diagrams/47/9a261ba5644e86219bc133ae7708f3e0.png)
![[Diagram]](../../diagrams/43/365fb6c389708dfc4d341560b940db67.png)
![[Diagram]](../../diagrams/35/aa9708b247611d35df4aef91740ba35a.png)
![[Diagram]](../../diagrams/46/c999432c18d18c7b0f3d47ba9ef4e91b.png)
![[Diagram]](../../diagrams/44/20a6ce4609a9af3c98c3eaec59edeb8d.png)
![[Diagram]](../../diagrams/2/3a18f8387efcbf52974cba6fd43a264f.png)
![[Diagram]](../../diagrams/13/3e2a23bc8afb76769872a2611f033692.png)
![[Diagram]](../../diagrams/21/83ee3295ef5b77dea44f4b262dcca591.png)
![[Diagram]](../../diagrams/31/3f060ea0c850d086a53da1b0579a6d36.png)
![[Diagram]](../../diagrams/32/281c57a3a5460234d5ad0b32d8397cc0.png)
![[Diagram]](../../diagrams/27/3cdb464fab10c6a6c788db856e99ef99.png)
![[Diagram]](../../diagrams/7/3bcfbd064634977ad7e0919181592699.png)
![[Diagram]](../../diagrams/3/3c7a9848f2853a710ecb3b526c6a8ace.png)
![[Diagram]](../../diagrams/16/602416d5a22685d1fc0f01db3511a531.png)
![[Diagram]](../../diagrams/19/fa971e0b0285078413d00562242d6a87.png)
![[Diagram]](../../diagrams/40/17e4ec11f61645a8b3be8975b731bc08.png)
![[Diagram]](../../diagrams/6/a7c9da126f1a36541588f45ecbe441af.png)
![[Diagram]](../../diagrams/7/8b211d3fa7e0b1c65bf2886dae5f7f65.png)
![[Diagram]](../../diagrams/51/8a352d11bbc80b4eda5afeb5100db2eb.png)
![[Diagram]](../../diagrams/45/2e8ade5a629db569f4141f1c4f51961a.png)
![[Diagram]](../../diagrams/26/6bd19c7ec99572359a8dd61ff5596199.png)
![[Diagram]](../../diagrams/24/3c785fb572299f136b841935c179762b.png)
![[Diagram]](../../diagrams/10/204aaf904eb1b571cc7b6872f5a2f2ec.png)
![[Diagram]](../../diagrams/34/d69ee790e84a7816acc80a50b476fbe3.png)
![[Diagram]](../../diagrams/24/e671e036eb0bf204c24ab0d8d237dc2d.png)
![[Diagram]](../../diagrams/21/ce4ef5c688774c4d65972c8037d992d2.png)
![[Diagram]](../../diagrams/25/09e38c1da9b778ab23993f5a1ad0b84b.png)
![[Diagram]](../../diagrams/15/f00f1e00266d89b1e9b7739f88b532a6.png)
![[Diagram]](../../diagrams/16/aef4eedf1fb02d24c5dab2ac654191fc.png)
![[Diagram]](../../diagrams/20/3ac8a73428931333c38a37466eec6458.png)
![[Diagram]](../../diagrams/4/294962317901102d2f3a65ccc7911176.png)
![[Diagram]](../../diagrams/46/31529e9663f73ef13127d1bc8cfbd21c.png)
![[Diagram]](../../diagrams/26/be55e97e5b70e0c625d21dbf3ecdf401.png)
![[Diagram]](../../diagrams/43/f98fbf3e56835816d0cc448b4579fb4a.png)
![[Diagram]](../../diagrams/6/ece0853c7a4bb89b6cd3fefb4a9bcdf4.png)
![[Diagram]](../../diagrams/31/d2ec64a58334706e21dd49ad36073a61.png)
![[Diagram]](../../diagrams/2/2128993a33108d945ca73424ec6ccaf9.png)
![[Diagram]](../../diagrams/15/f394d045980883857de3a563e3efff18.png)
![[Diagram]](../../diagrams/34/504b6dfe99c66e02eb77eaf5bdcce313.png)
![[Diagram]](../../diagrams/11/1f206ff5718e73537ecbb58171b6aa9f.png)
![[Diagram]](../../diagrams/16/4b67dc99c0d5096ee181c1e885533c5d.png)
![[Diagram]](../../diagrams/43/60317c14fc493fc672a1d97043ae924c.png)
![[Diagram]](../../diagrams/5/f2e613d915ada36a712f07946ef5bf14.png)
![[Diagram]](../../diagrams/14/4c4d486ee903c61920268cb492032d5c.png)
![[Diagram]](../../diagrams/1/32b216df3268c8c5b6eb4dc19fae33cb.png)
![[Diagram]](../../diagrams/38/ee1901899bcc59b1aab4c6dc942ee91b.png)
![[Diagram]](../../diagrams/40/c5c76eabe3cd25353367479efa39e05a.png)
![[Diagram]](../../diagrams/33/83826d37fe0bd9f383f7399cd2f36e56.png)
![[Diagram]](../../diagrams/52/bbcb0619c210d19c260ac4141fd5fa19.png)
![[Diagram]](../../diagrams/21/27f943286dbaf0d93a985d3155c5e98e.png)
![[Diagram]](../../diagrams/47/506be34ec3f2c547d3d5346cdb58570a.png)
![[Diagram]](../../diagrams/51/dbf1b771c562a8711929620baffa5a97.png)
![[Diagram]](../../diagrams/28/98ff596793345e477c2bc12a5897ec61.png)
![[Diagram]](../../diagrams/48/d8f65b416fa4713c5a7bb5c2ec8ff638.png)
![[Diagram]](../../diagrams/38/4f06a096b9f2808dc09736bfabb5d0a9.png)
![[Diagram]](../../diagrams/40/3dadc5424748b61d0cf3421b8ab2da31.png)
![[Diagram]](../../diagrams/51/43627a3ecd7fcc018b7dcaba5df6e9f0.png)
![[Diagram]](../../diagrams/38/4e8e22a4a7d0eecf51e859241ec3a88d.png)
![[Diagram]](../../diagrams/22/d5d8d003f85b6c4aa0b77b97dce3ada7.png)
![[Diagram]](../../diagrams/16/b0aa333f8d845776f73413649a74db05.png)
![[Diagram]](../../diagrams/47/4faf47bf03ff17bd799ec912b1afc5df.png)
![[Diagram]](../../diagrams/52/822e45411ba6297ccc054ca9ad68aba4.png)
![[Diagram]](../../diagrams/45/531cf0f91ecc9b058a7af3dbbbceb8f3.png)
![[Diagram]](../../diagrams/52/d78b567c9a34d3914c41e15fb8ada440.png)
![[Diagram]](../../diagrams/39/67b46ae45818e4e78c7251cc33a64c24.png)
![[Diagram]](../../diagrams/10/2cd4959fabbcf9d4f257512a48841c6c.png)
![[Diagram]](../../diagrams/51/22f6ca833105716eda86cecf0565e871.png)
![[Diagram]](../../diagrams/10/b44d852b8042ffe84c30a2f51d07adfb.png)
![[Diagram]](../../diagrams/35/86515b2f9d1e51027aca07fd2fb17350.png)
![[Diagram]](../../diagrams/46/9ca3a092870e24f32ffa6cbf90a27112.png)
![[Diagram]](../../diagrams/38/4f189bda05d54f49bec878382cfce31b.png)
![[Diagram]](../../diagrams/9/8a3b83078033e3c47e4ef0c23716b693.png)
![[Diagram]](../../diagrams/20/4016cbf07a58a5301d3ab203e0ab6424.png)
![[Diagram]](../../diagrams/43/61310365c296be1d3908d0a0d31418f5.png)
![[Diagram]](../../diagrams/14/b66f3d2a687a97ea098540adaddbe1c8.png)
![[Diagram]](../../diagrams/37/06c77038734148271a2dd0e942cdd571.png)
![[Diagram]](../../diagrams/32/766bc3fb61a4a0a6dae2cbff0e55ee1c.png)
![[Diagram]](../../diagrams/12/ebdbadae140445e152969d6e21467eb0.png)
![[Diagram]](../../diagrams/49/49575a8f4d38e5352aba18cf89f41527.png)
![[Diagram]](../../diagrams/1/17fc5edaafbe1e83538a7c53a0bea1ca.png)
![[Diagram]](../../diagrams/35/29365d13b07a10949e22dc14ec782ad6.png)
![[Diagram]](../../diagrams/15/29e7a73d823694d76aeaa07c6fbb9e2b.png)
![[Diagram]](../../diagrams/27/24566ef35560e70575cd629649798e98.png)
![[Diagram]](../../diagrams/8/e6f5ac5ecaa6f15098823f68d573f99e.png)
![[Diagram]](../../diagrams/16/af2c8504b12fa017fdf2e6014136f61c.png)
![[Diagram]](../../diagrams/40/69055d72a40faa54e54853effa9ef9b7.png)
![[Diagram]](../../diagrams/19/b7462d43fdf24b62be727f19722b3ca2.png)
![[Diagram]](../../diagrams/13/c3c2d592368fe9982845e2bb152d1cd0.png)
![[Diagram]](../../diagrams/45/6116d4177abf26eebcd6391c6217ee5e.png)
![[Diagram]](../../diagrams/31/83ada0195042476aa3485ca9831ba555.png)
![[Diagram]](../../diagrams/13/c17718fcf9c501ee48b81dc429005419.png)
![[Diagram]](../../diagrams/8/9283a3e65bfb7530b6cc3cf9544f7e16.png)
![[Diagram]](../../diagrams/26/0ef67d5dc4458a2f4a2fdab1a883be78.png)
![[Diagram]](../../diagrams/43/8e1d23d85e1e0e3f3dc466cd47b4919a.png)
![[Diagram]](../../diagrams/1/76b24827732c5490b97e350d200b175a.png)
![[Diagram]](../../diagrams/41/bc48d5d7afe6196dc2e13d40d2371c6f.png)
![[Diagram]](../../diagrams/26/40307710d3e5d6654d8f4a9fa4fcc018.png)
![[Diagram]](../../diagrams/19/179aa04e7e861001bb7dd391921177df.png)
![[Diagram]](../../diagrams/7/17e3dc3b766b9356b01e447730706b46.png)
![[Diagram]](../../diagrams/42/0ed250fd5281f6a69c1cb85dfbd80d9a.png)
![[Diagram]](../../diagrams/49/8a17262db23dc6915a049ac14c8083d0.png)
![[Diagram]](../../diagrams/51/b413e7babd1787e64759bfef50665f15.png)
![[Diagram]](../../diagrams/43/7fec375a65ba682d1e9f5fe9e5695a1e.png)
![[Diagram]](../../diagrams/26/1cd5f09e4b0fecafc585d03f1ebe8c24.png)
![[Diagram]](../../diagrams/24/ac19e2420580dfa76c96f6e36d978a9f.png)
![[Diagram]](../../diagrams/44/c47589e5e0ab14ed9dc82503d5b1f35b.png)
![[Diagram]](../../diagrams/17/4c4ee26247592d3cc23bbc3d1acf3c63.png)
![[Diagram]](../../diagrams/37/1b8dc6553bae17a81b980016716fed78.png)
![[Diagram]](../../diagrams/4/f673233a812431861f41721207cb9731.png)
![[Diagram]](../../diagrams/23/cd1eafb2fb610dc618a7e703f34323a7.png)
![[Diagram]](../../diagrams/14/d1dafc6abd37f86e0f3557f18088de19.png)
![[Diagram]](../../diagrams/44/f69d2062e21e7eb524d475f1a5bbb7b8.png)
![[Diagram]](../../diagrams/27/e1af0de554a7fac0663cd589667d2240.png)
![[Diagram]](../../diagrams/14/dbb01e8f18f4a42aae8f399f06d48162.png)
![[Diagram]](../../diagrams/29/50dc97819b8a09a3567fb5fbbc5b5f11.png)
![[Diagram]](../../diagrams/42/a9d7a716756c3b72cdc3cfac8f26a8c9.png)
![[Diagram]](../../diagrams/5/2b45c19a79ae40ddff8d1ac9718c943c.png)
![[Diagram]](../../diagrams/42/fe50ba569fae1b1872318aaa9872e8b1.png)
![[Diagram]](../../diagrams/4/686d03912c1c2895004a7bdcc5cee6cd.png)
![[Diagram]](../../diagrams/43/6dda05ab30a5708bff9727e29757945b.png)
![[Diagram]](../../diagrams/48/49e9a22a241e8ec7fd377d020582607d.png)
![[Diagram]](../../diagrams/5/f70e8887e15219b305dd300bf45224fc.png)
![[Diagram]](../../diagrams/1/1e7b60e265b697c1a1f6a11d61ec102d.png)
![[Diagram]](../../diagrams/22/278cec0baefb5a258d6f945320c035bf.png)
![[Diagram]](../../diagrams/12/de124f3f7e876932379d6764d7b840f7.png)
![[Diagram]](../../diagrams/24/b720d38948c15e0d406a5929f3635840.png)
![[Diagram]](../../diagrams/13/035679a0fae6a3abe316bab3ebe6a443.png)
![[Diagram]](../../diagrams/27/c55b1235f7cc8a9f1cdec5a46c16dde2.png)
![[Diagram]](../../diagrams/8/f047701688f8ce07d10b3f8134e688d2.png)
![[Diagram]](../../diagrams/51/c7473f9499e0b70ef3b2cd8890c38331.png)
![[Diagram]](../../diagrams/22/5a7e12fa4b66e59ebec94df7258e7b6f.png)
![[Diagram]](../../diagrams/12/f766540ec99c496e9ab1e9c8aa0937d9.png)
![[Diagram]](../../diagrams/35/208d8d98072fadc30152b1f371da2c9b.png)
![[Diagram]](../../diagrams/7/a40506a83aabc16e5efcef3b603a31e9.png)
![[Diagram]](../../diagrams/7/ce8a55827fb8f721753b12229ee3c2c0.png)
![[Diagram]](../../diagrams/20/4704ea8b556b42f3d6f2edb812aea817.png)
![[Diagram]](../../diagrams/10/b315e66657c6dd53a98f17ee4cf58a87.png)
![[Diagram]](../../diagrams/21/d647dff8e223b66fc8d9543b324556d0.png)
![[Diagram]](../../diagrams/4/00d24d66f94b516c338be608fdeaac7c.png)
![[Diagram]](../../diagrams/16/7db73349606eb1a3a1376938134b30c2.png)
![[Diagram]](../../diagrams/50/ec173fa99985eb16417cdaf908bb590a.png)
![[Diagram]](../../diagrams/51/96b11d738bd34a9c2aedb939b65a142b.png)
![[Diagram]](../../diagrams/32/19c2eba353c3c5e3a958761483074a9c.png)
![[Diagram]](../../diagrams/38/0e36e848980ddf27860dce717301afb9.png)
![[Diagram]](../../diagrams/37/f590c2ff31f87b5eac8e0b3cfa1efb33.png)
![[Diagram]](../../diagrams/3/89839964307d374a7ede6a15d2b79e16.png)
![[Diagram]](../../diagrams/42/8c302f590daae01ccc329c958839bd9e.png)
![[Diagram]](../../diagrams/25/da415e06385317f535390ce5487f9d47.png)
![[Diagram]](../../diagrams/15/e489b930e0599ecafc44f78e886f10f3.png)
![[Diagram]](../../diagrams/26/d0b8d07f701545a687bdac2832da5ee5.png)
![[Diagram]](../../diagrams/34/6cc41db0b3e2d97b730ce8f6c1f6a07f.png)
![[Diagram]](../../diagrams/32/5cecae4e9f3e64bd4578dbd95cf06733.png)
![[Diagram]](../../diagrams/0/609e011069c5ca046fe07c46e08000e8.png)
![[Diagram]](../../diagrams/1/a914576432e96203dea55993543155ef.png)
![[Diagram]](../../diagrams/19/bec111735ad3b1511617947a9df6ec51.png)
![[Diagram]](../../diagrams/42/97a95a3aea9af40c1420d7a98cdbfdfc.png)
![[Diagram]](../../diagrams/38/c49db61813bcbe9a997dccb183e0b947.png)
![[Diagram]](../../diagrams/38/69a63241ec64783468300f2614096da3.png)
![[Diagram]](../../diagrams/47/5d2ae0fa10bf8801bd17436ee1fc0bf0.png)
![[Diagram]](../../diagrams/1/be52d80a4060c7a908dc4e8533148e09.png)
![[Diagram]](../../diagrams/36/593e843cfac5165f97ffa9f2f81eeeb2.png)
![[Diagram]](../../diagrams/6/33bbc2d9319da08ce0052a515df7167d.png)
![[Diagram]](../../diagrams/49/102abedb90f2dd307933b17e9dd54ff2.png)
![[Diagram]](../../diagrams/49/c857ac1c50769b0e3a84dacbb72c51ce.png)
![[Diagram]](../../diagrams/16/703f262562360836d2d163492cbae7bf.png)
![[Diagram]](../../diagrams/42/a5286f9975c9a079394253ecea63f0d8.png)
![[Diagram]](../../diagrams/10/d132df78340c8cd2d8e33f5c30911bfd.png)
![[Diagram]](../../diagrams/11/8b2ed2ea6851e200aec5f9ee3f5cb194.png)
![[Diagram]](../../diagrams/18/5b9807cda081076abd6f676a0960b70b.png)
![[Diagram]](../../diagrams/32/bd15dcda56f25225ebe6ca0ea4d76d93.png)
![[Diagram]](../../diagrams/32/c3d1a21e7241d3af9f5d387bac4c0af3.png)
![[Diagram]](../../diagrams/21/b043ea95302d79bba54be0acc99177c0.png)
![[Diagram]](../../diagrams/17/1918847d6f1d6897b81cb0852f95c560.png)
![[Diagram]](../../diagrams/26/7dd02f0eb0a2402940b774865812c495.png)
![[Diagram]](../../diagrams/8/273095357e16626feccafa343b4b9a3d.png)
![[Diagram]](../../diagrams/41/ee0c15909808aa1421c3ec7b5251ea3c.png)
![[Diagram]](../../diagrams/37/2d5271fd8f503c4361abfb8ad009d919.png)
![[Diagram]](../../diagrams/10/f997f9b786e1fd67bcae28872cb5ba78.png)
![[Diagram]](../../diagrams/24/b21fb54d14bb101a5fdd29b9a9ffdb2d.png)
![[Diagram]](../../diagrams/27/75a653d3c2f975368528942a76ca0e46.png)
![[Diagram]](../../diagrams/24/7fd215f42492ee4b90476a1aa241d13e.png)
![[Diagram]](../../diagrams/0/21bfa680b23658ea35c3f199eb458903.png)
![[Diagram]](../../diagrams/10/6fd81e289211a7a081946b282eba09fb.png)
![[Diagram]](../../diagrams/17/7acdf3f6b8a689b6413b894c32975657.png)
![[Diagram]](../../diagrams/28/768c18a02e4583712c4157c97a2ebca4.png)
![[Diagram]](../../diagrams/31/fc5cf74bc12cd1f3ea2b5f07789e468f.png)
![[Diagram]](../../diagrams/28/7bfd1601f41cb8928eca908db1d00d66.png)
![[Diagram]](../../diagrams/15/4b4d63afde34af209f1707b9e1fa0aa6.png)
![[Diagram]](../../diagrams/20/dfffe55c87ca01c65c69cee559a3556f.png)
![[Diagram]](../../diagrams/32/69f60617661e07a895861b4448450f18.png)
![[Diagram]](../../diagrams/34/4ad312eec70098c84cf2d571f747814b.png)
![[Diagram]](../../diagrams/26/f5db5eba423a60fb265d48aeba0b4c0f.png)
![[Diagram]](../../diagrams/24/770b0c5a9a15b816e070441009d68917.png)
![[Diagram]](../../diagrams/10/c4d377ac5b00fea8b93e7a69250d75e2.png)
![[Diagram]](../../diagrams/14/d215d558abd3731db1570922146a9626.png)
![[Diagram]](../../diagrams/36/6ac163af1ab81fb114a55bc02053c1da.png)
![[Diagram]](../../diagrams/15/881ec72b26836b28195c15dca9ef529b.png)
![[Diagram]](../../diagrams/13/0d9104f5641d463ebf0be83a47c6ee04.png)
![[Diagram]](../../diagrams/10/8015cdb3f13e5595ce195245ee5d77cf.png)
![[Diagram]](../../diagrams/36/ea8b300d9ef59a73f6c7a5f45fde904e.png)
![[Diagram]](../../diagrams/5/b7a16e7213887d4a0548ed25a11faa92.png)
![[Diagram]](../../diagrams/32/3dfd41df4084333c2d792bf1a6029561.png)
![[Diagram]](../../diagrams/49/b1fd5cc31c69c9651253c2f94dc66e7e.png)
![[Diagram]](../../diagrams/0/7b19e970f2ed0604b4f89ae6dbbd8077.png)
![[Diagram]](../../diagrams/21/59d760e656979dc3b6262ec7ff0a60da.png)
![[Diagram]](../../diagrams/33/52e42f0036a3d2a6fd072947ceeec072.png)
![[Diagram]](../../diagrams/8/8477ecf7eb2e964356d878a71e411954.png)
![[Diagram]](../../diagrams/6/aaf34138b209e0902abafc31c3de85f2.png)
![[Diagram]](../../diagrams/4/cb8058ab6a5f18b0fb6599afdfb1ac9f.png)
![[Diagram]](../../diagrams/6/b8d9ff8dc1bb334752b054b72bc8809f.png)
![[Diagram]](../../diagrams/24/afc794d931d4fcda025b69f7a9033ce8.png)
![[Diagram]](../../diagrams/17/571264cd564e76b39ff7921c01ef4b62.png)
![[Diagram]](../../diagrams/7/15e5408ab8f126ea4bb9d7c3d3377dba.png)
![[Diagram]](../../diagrams/27/e2e900b0cc82d6eed89c6c57bd00f72a.png)
![[Diagram]](../../diagrams/13/371b289fd2b4e32ac284799b3a27cfb9.png)
![[Diagram]](../../diagrams/1/cd3759ce036bcb6ab6ceb4d5c7fa6914.png)
![[Diagram]](../../diagrams/18/9bc6ab0791a3c847d2ff74cd908474bc.png)
![[Diagram]](../../diagrams/35/aad54cd2cc7de9a66e649289b0647e32.png)
![[Diagram]](../../diagrams/34/33c3caf90fbe99e0811e2c9e2d9eb99c.png)
![[Diagram]](../../diagrams/20/8e81421b794a8d4e3d9d7b90ed75233c.png)
![[Diagram]](../../diagrams/47/f8fcfac7788ecf09f2e73002beec37ea.png)
![[Diagram]](../../diagrams/36/9073e8e456539944350da73805f0ac15.png)
![[Diagram]](../../diagrams/25/f2c1b20e5148e83afa490189ed39163b.png)
![[Diagram]](../../diagrams/14/17935932a368572baae9043b0a296e73.png)
![[Diagram]](../../diagrams/2/f12b044ba02f177b5612bbf7dbb315fc.png)
![[Diagram]](../../diagrams/52/a51cc9ed6436152450e6737da633cdcb.png)
![[Diagram]](../../diagrams/0/3c2dac6e37cb4c4951fc74350d03396b.png)
![[Diagram]](../../diagrams/40/01bd973888b1dc71cc8b163dcf99a412.png)
![[Diagram]](../../diagrams/12/cfbd55b4d38613864d1657d48ac87253.png)
![[Diagram]](../../diagrams/29/22e7f5eb056e70373733fffec6125965.png)
![[Diagram]](../../diagrams/8/fd297846ecdb59379ee3a895e4b96754.png)
![[Diagram]](../../diagrams/1/9019df79d8957af2d57cdbbe994794c0.png)
![[Diagram]](../../diagrams/5/5386ef3682277ac748a96b2fa082e588.png)
![[Diagram]](../../diagrams/21/c6aae597b38be01693db305b573596a6.png)
![[Diagram]](../../diagrams/14/ee6ff0a1480ce22c1abec12a891c8650.png)
![[Diagram]](../../diagrams/48/dc9b1e6adbb89c6cd836ba2da1310ebc.png)
![[Diagram]](../../diagrams/9/541cc2d03d717b15f72d5e39c5e83d7d.png)
![[Diagram]](../../diagrams/22/60385b11a481d6268e0cb442ed9d05a0.png)
![[Diagram]](../../diagrams/34/acd509d4386d6b295b5cc579f44b63aa.png)
![[Diagram]](../../diagrams/15/fb5515c5f44a4198a69a9c0da3f74e80.png)
![[Diagram]](../../diagrams/11/ea4be4d85fe7600d815925b311967e81.png)
![[Diagram]](../../diagrams/48/d9384bfc0c097a6e56287b3caca8e5e4.png)
![[Diagram]](../../diagrams/10/0a9d4c7697239b67cee7b9b9f4749c72.png)
![[Diagram]](../../diagrams/11/754228cb27fe76ee47fe28636d1d5524.png)
![[Diagram]](../../diagrams/38/aea02bb1b30b42f1c2daf3fca11f21f7.png)
![[Diagram]](../../diagrams/30/2f79f288f4d039b3826b426fac552c25.png)
![[Diagram]](../../diagrams/48/1e763d382d15f8ab5dc19b9b91b87258.png)
![[Diagram]](../../diagrams/13/263a566a0a1d374d4779a1db9fc79435.png)
![[Diagram]](../../diagrams/37/f423b24657770beda92f77369714d7e9.png)
![[Diagram]](../../diagrams/52/a22a9603afc8cd076b5722120966d374.png)
![[Diagram]](../../diagrams/29/ccc687d68471d6533634428d9ba02e3f.png)
![[Diagram]](../../diagrams/22/76cb5d292f6934bf55891b5434aefe32.png)
![[Diagram]](../../diagrams/29/5aea6fbc31a17e0524be3f9980679d28.png)
![[Diagram]](../../diagrams/30/49b377667f8550161497cf754b520d32.png)
![[Diagram]](../../diagrams/49/90f65844b6b5bb03a4729ee67fbb3fdc.png)
![[Diagram]](../../diagrams/46/560212db643650b8bbe676fd04db50dd.png)
![[Diagram]](../../diagrams/49/2e011c1ddf872f0d9004464ce229baa2.png)
![[Diagram]](../../diagrams/17/c487633e5fb226062217c784c3bd1306.png)
![[Diagram]](../../diagrams/13/265624138307bf5c74e739e88cd723d2.png)
![[Diagram]](../../diagrams/19/96a10fda6169fbd072a34ae1728bc45b.png)
![[Diagram]](../../diagrams/26/ba04451a5cad5509ba41a19da7344455.png)
![[Diagram]](../../diagrams/35/79dde5d59e1ffb474b686e9d12f28496.png)
![[Diagram]](../../diagrams/5/7d8998eac36a1187af795744703b57b4.png)
![[Diagram]](../../diagrams/32/69e99951291834a2d847e83d28e93085.png)
![[Diagram]](../../diagrams/20/0fc695006a2de03bca7a86a36dedfc9f.png)
![[Diagram]](../../diagrams/44/06de733e8b8555cccf6130dcc43f84e5.png)
![[Diagram]](../../diagrams/36/ebd6fc8ece7c95f6de6c5271cf258357.png)
![[Diagram]](../../diagrams/38/f5772f45c9ed1a6c0afded0c2313e860.png)
![[Diagram]](../../diagrams/33/6f24a46c697903d48521c3332d619b4f.png)
![[Diagram]](../../diagrams/21/3818f5112ea873de0a668c1fe95d13da.png)
![[Diagram]](../../diagrams/32/d9e2be37328287541d02f3e7c3c7095d.png)
![[Diagram]](../../diagrams/19/fbad58b53e54eb3fb74b1f9ac804d45c.png)
![[Diagram]](../../diagrams/5/d48398e3b3aa979837407a3ae4ba81ea.png)
![[Diagram]](../../diagrams/37/0dcb34bdc4b840369e6b21db4ad04fdb.png)
![[Diagram]](../../diagrams/46/0fef73efb94fba52c4de8e2ea0f2e0e7.png)
![[Diagram]](../../diagrams/14/6668b5f6b361b08ccd6e711590792990.png)
![[Diagram]](../../diagrams/13/0985f6e08ce8c50486e4fdacbfe2925e.png)
![[Diagram]](../../diagrams/19/163955ae9bbf0deadf689a605210f5ae.png)
![[Diagram]](../../diagrams/46/2aa27b25e1f9dfb3181a224c884ac1e5.png)
![[Diagram]](../../diagrams/10/2e2d69e6871ccbd868a6769c2357459f.png)
![[Diagram]](../../diagrams/26/d5da02f7588ddd4251f4d860f52afa6f.png)
![[Diagram]](../../diagrams/7/18d4d15ab0e1df55710929d06aa64822.png)
![[Diagram]](../../diagrams/21/b2560cf62db72521f8edce3b7d0d4c73.png)
![[Diagram]](../../diagrams/39/48e022246dc345bbfc3558f0b7e295f5.png)
![[Diagram]](../../diagrams/18/8504f8e9d42e1dd6cf494ec88b567519.png)
![[Diagram]](../../diagrams/35/46a806471cfa3bb4a4f4ff22b02bc6f3.png)
![[Diagram]](../../diagrams/49/546d3ee72ca4b0ef7ac0a63dbb845ad3.png)
![[Diagram]](../../diagrams/35/a9f9bac8d0db0b9468b9049107ae8d2c.png)
![[Diagram]](../../diagrams/38/6ca093b3682e3580c82599c2c9b5ab4f.png)
![[Diagram]](../../diagrams/24/eb3745a42f4003c10dd0d6bb1e0233a8.png)
![[Diagram]](../../diagrams/10/2904b3ebabe86076c44869da93ac74f5.png)
![[Diagram]](../../diagrams/48/d88df5498003f0408ee4bfd16425a8dc.png)
![[Diagram]](../../diagrams/32/73e2fd19b108fdefabbfc3216063b8be.png)
![[Diagram]](../../diagrams/41/78915b1f656ca743a4c47b3b985c9797.png)
![[Diagram]](../../diagrams/8/fd076a82d44e6506427287a68f707be6.png)
![[Diagram]](../../diagrams/40/b7edf7e91715043f6aa5e0f1f1468ffc.png)
![[Diagram]](../../diagrams/12/97d6e67d9dc5fa8960e567f1768cbd3a.png)
![[Diagram]](../../diagrams/17/10db99855c09f6412bcd18cd87245262.png)
![[Diagram]](../../diagrams/6/a2fc22f442975a07f1dd8d6c4b50bc73.png)
![[Diagram]](../../diagrams/33/31658658cd44aac4d37bf14bd15c4705.png)
![[Diagram]](../../diagrams/29/f0ae7131df8c6261ddac6f8c3851e2b3.png)
![[Diagram]](../../diagrams/44/bf395db1c6717cb9a51037f63ba54129.png)
![[Diagram]](../../diagrams/44/55eba92e4ff43a76871bfe1d61665b49.png)
![[Diagram]](../../diagrams/9/cff95e1856971c3d5872c32e624a32e9.png)
![[Diagram]](../../diagrams/17/4da8e7fa9b90ee4678fba83ce09bfc35.png)
![[Diagram]](../../diagrams/46/4875ea2f9d5aee401fa06c2175ad8611.png)
![[Diagram]](../../diagrams/17/702a85180aae543af915dd4b429f5404.png)
![[Diagram]](../../diagrams/17/68f96becd2d073fe68a670db5958012c.png)
![[Diagram]](../../diagrams/34/d4728b2a9648856abd6301d376282a80.png)
![[Diagram]](../../diagrams/37/b11e5ae879e62da17126addb48a29de2.png)
![[Diagram]](../../diagrams/45/6307a886dd84fdfb5c99781bf1ad41aa.png)
![[Diagram]](../../diagrams/11/606a5d0360c626bf0fe587f1b71c614d.png)
![[Diagram]](../../diagrams/20/85eed449c9ad32ce1d00c93a5cb757b0.png)
![[Diagram]](../../diagrams/11/c3a7d43f37c83f805b0d1d8cae035c44.png)
![[Diagram]](../../diagrams/35/0d06e7f9c43dee26a83fac80ea7f4af2.png)
![[Diagram]](../../diagrams/37/b4bc5e6fceae85dd75f65282b3c0fe1a.png)
![[Diagram]](../../diagrams/42/f3c6d5fb8a0d4688e5d3d97e324c6ce7.png)
![[Diagram]](../../diagrams/21/44f0bcadfdabc58f32894258ad2a2868.png)
![[Diagram]](../../diagrams/25/76b87c411e6fd863cc7bfc9cca3daa77.png)
![[Diagram]](../../diagrams/13/5d5803924978642d0eecfc3478e3e5b8.png)
![[Diagram]](../../diagrams/12/7ee7140add02de1820e5596fc8718bd5.png)
![[Diagram]](../../diagrams/14/86bc40f577d8157de00609af580c4cdf.png)
![[Diagram]](../../diagrams/24/1673737972a51b8b4e75a019ea3df7e1.png)
![[Diagram]](../../diagrams/51/d60a961f088ef5eb376af66971bb979e.png)
![[Diagram]](../../diagrams/31/7b08e248c023d3435ec879368dfabf9a.png)
![[Diagram]](../../diagrams/44/54eebabe7ec92dca3449125b8abfd7fa.png)
![[Diagram]](../../diagrams/51/d25f11610425ef67d282b75abf3faed4.png)
![[Diagram]](../../diagrams/17/46f0d011dc7fd0146a0bb9401879449b.png)
![[Diagram]](../../diagrams/28/b4c8e21829a90a151c4b96167e6ada73.png)
![[Diagram]](../../diagrams/29/91552c85f3a89de38e90cb64fb009609.png)
![[Diagram]](../../diagrams/48/f2e2537baa0450ce60efc1287681b71f.png)
![[Diagram]](../../diagrams/41/97c0655a79cf4b86c073b747c49d8056.png)
![[Diagram]](../../diagrams/46/4b7fb1787adb9c559fe2eae3a4923ef1.png)
![[Diagram]](../../diagrams/40/caf584390223c813122b3850fdc26973.png)
![[Diagram]](../../diagrams/27/e6042b7bd09c61946048fe3e581644cd.png)
![[Diagram]](../../diagrams/46/6da70fe39deaf40fca632d21c13dbe4d.png)
![[Diagram]](../../diagrams/16/3c817b599436d6d20be0ba08a3965f1a.png)
![[Diagram]](../../diagrams/9/b52377c2a0ccf875bafcd06fd1ed80dc.png)
![[Diagram]](../../diagrams/29/ebcb94e20ea01a028dbdb32c0a8f5dcc.png)
![[Diagram]](../../diagrams/40/0621587594d313d190d66207fecde671.png)
![[Diagram]](../../diagrams/7/4b66db1407f9f2d4cf23d4a36b9d7337.png)
![[Diagram]](../../diagrams/37/47957c4f3f924293456393718019f016.png)
![[Diagram]](../../diagrams/35/04869d45ea5bb3dd199320ebe60bae44.png)
![[Diagram]](../../diagrams/46/c1aa082c2dd9e728b8c991d63046a657.png)
![[Diagram]](../../diagrams/44/0c16a7509f19fed866f867214ea96ac3.png)
![[Diagram]](../../diagrams/15/5d49a34c9c1daad89ab285ffae280e09.png)
![[Diagram]](../../diagrams/51/0597040e3d5c6b49f871c7f842b3fe1d.png)
![[Diagram]](../../diagrams/11/8b18f0974977b652ac1cf42eb4be10be.png)
![[Diagram]](../../diagrams/12/4e54a4df86fb4b67b0eef4e0d065d923.png)
![[Diagram]](../../diagrams/22/c245649cc3e4813a738eab5c642be556.png)
![[Diagram]](../../diagrams/27/eea64ed946e813a43dfd2af29d7e56d3.png)
![[Diagram]](../../diagrams/52/b730474acc30dee8dfb49c0f909ce7e3.png)
![[Diagram]](../../diagrams/23/b10ee9da2df78b018c4f75194e170aa5.png)
![[Diagram]](../../diagrams/0/9a89f1551551ae25ce2892f71dcfe7f2.png)
![[Diagram]](../../diagrams/14/fd04ea9034c8017286c849e30609251a.png)
![[Diagram]](../../diagrams/46/30e0000eba3cea500497f693985c9ae8.png)
![[Diagram]](../../diagrams/24/a04b202275ffb36d57d71d57f9d18a8c.png)
![[Diagram]](../../diagrams/50/8d1a1f2dcd0c3c76ed8d94f1d0af8a58.png)
![[Diagram]](../../diagrams/25/cb2207c4ccfb2c071bda04e944ad5208.png)
![[Diagram]](../../diagrams/50/eb15844905947de7dcb3cdf3d6d12c73.png)
![[Diagram]](../../diagrams/0/d91a0acefa9cdd793eea968a8a76e76e.png)
![[Diagram]](../../diagrams/49/db84deb86190e0f955b207ad5c8f5254.png)
![[Diagram]](../../diagrams/25/9ddc1591ca1148aad3565370505860a7.png)
![[Diagram]](../../diagrams/3/f3e4d2995983560be21e2b67a321c032.png)
![[Diagram]](../../diagrams/10/2d12cc951f0a1f37c9dc6122ed0b3737.png)
![[Diagram]](../../diagrams/35/91816e74be8e5cee17fd34cb5baa9a2d.png)
![[Diagram]](../../diagrams/30/7a4ecf3cb5b87380c77686b8ac45c7e2.png)
![[Diagram]](../../diagrams/18/e4d7569428a6828f878a48687145f3ec.png)
![[Diagram]](../../diagrams/9/9ea20f26aec24dba88461abaf77cdc0e.png)
![[Diagram]](../../diagrams/0/fd2cf2be5e2a03b72dc2c6704a527db3.png)
![[Diagram]](../../diagrams/34/2222c77e7cf6bbcc8e23215b4664ca8b.png)
![[Diagram]](../../diagrams/16/54c563b56b41c64fa7b6f364da274acb.png)
![[Diagram]](../../diagrams/26/fd6638a6a7c9b21a2d431d2c49bc0a41.png)
![[Diagram]](../../diagrams/3/965209e87eb91c662177fd1c26dbb605.png)
![[Diagram]](../../diagrams/43/ec6eac9c8d362b48f993d9bef13bb70b.png)
![[Diagram]](../../diagrams/48/d260ff5848b0306ea5db00dad8057311.png)
![[Diagram]](../../diagrams/29/2716def80fffb9a976391412537e8fc4.png)
![[Diagram]](../../diagrams/18/c65dc5ef5291e6689b8c61f7aa84cc7a.png)
![[Diagram]](../../diagrams/44/2669abad24f3d7e84481fda255540003.png)
![[Diagram]](../../diagrams/29/89900e1b9d1f73ed3b43f298defe7126.png)
![[Diagram]](../../diagrams/27/477e5b71701fff85d757bd0816c2a7fb.png)
![[Diagram]](../../diagrams/12/5c81e2a584965bef7005b0be0d67bcda.png)
![[Diagram]](../../diagrams/39/ce6323ab26df160a213e153b96a5d8ef.png)
![[Diagram]](../../diagrams/37/edb7846f11bd698ee5dd34df2e67d178.png)
![[Diagram]](../../diagrams/40/a12cb0a4acf1ced1351dac42e2cd2763.png)
![[Diagram]](../../diagrams/45/d91a69942fbba2be7df37765fe0310d9.png)
![[Diagram]](../../diagrams/14/18ec6a6e352a3c0457a2b20c845abe13.png)
![[Diagram]](../../diagrams/10/2a0a8fc6187f8eb0e380da4c91c0fc12.png)
![[Diagram]](../../diagrams/19/d16b68f1bb5f8838013f79bb79a17b4e.png)
![[Diagram]](../../diagrams/14/735048a821f2513ca4b7fd11cca85f79.png)
![[Diagram]](../../diagrams/14/6d0c976b2db23bb5b54d78a0d348c379.png)
![[Diagram]](../../diagrams/27/118130e9c05f9a4bc0252dd9496cfcfd.png)
![[Diagram]](../../diagrams/0/5ef4340e3f8563a91e615c6e84d8642b.png)
![[Diagram]](../../diagrams/23/bb925e34745e2feedefa7b9a9e27ffe6.png)
![[Diagram]](../../diagrams/40/a59a251b3c3a17cdac1b7e59c66589c0.png)
![[Diagram]](../../diagrams/35/abaa3a952bd740af2d9488b40b84deff.png)
![[Diagram]](../../diagrams/43/6effd57d5cb705c9ff20469fe33c4685.png)
![[Diagram]](../../diagrams/10/961a00adf45a72161da32a754be80d25.png)
![[Diagram]](../../diagrams/23/6c0c47698e1318fe534542322505b770.png)
![[Diagram]](../../diagrams/27/95c6fc86328584bdbd17bf991c2bae29.png)
![[Diagram]](../../diagrams/32/447f0bd91f7c0de3bdb27889a885d0b4.png)
![[Diagram]](../../diagrams/0/2ce99a9bafa33c881d243ceb9d4fb3c2.png)
![[Diagram]](../../diagrams/42/6883a57efc02aadebf35b91e314191a8.png)
![[Diagram]](../../diagrams/51/f2944888f3e5435f9c041b1e13c5e7d4.png)
![[Diagram]](../../diagrams/12/a0dd3478ed24585c6208aa02a6b0814c.png)
![[Diagram]](../../diagrams/38/db74ef8f3bb26e64a716eb70a3680164.png)
![[Diagram]](../../diagrams/25/1f81f1cdae6565fa664c435e704c9138.png)
![[Diagram]](../../diagrams/50/4dad56fa08a9800db769a363ff84df64.png)
![[Diagram]](../../diagrams/39/8ad106a9cfd99d001f4b1a664f406444.png)
![[Diagram]](../../diagrams/2/ec298b3f6b295d6485f8d73d89a6dc4b.png)
![[Diagram]](../../diagrams/33/98c9eaa922da17461b2e449361d24814.png)
![[Diagram]](../../diagrams/2/964666f41dca7b808b7ac76730c79cc8.png)
![[Diagram]](../../diagrams/22/879ed390b492090c5286dad9d656c4ea.png)
![[Diagram]](../../diagrams/12/71495dd4a35eac2ea8b38789ede449a1.png)
![[Diagram]](../../diagrams/42/cbfc8f14e8ecdc00c4acc3fa5a826ef5.png)
![[Diagram]](../../diagrams/37/cec320f1a1f72ea84a7054c405972abf.png)
![[Diagram]](../../diagrams/11/268d3055bd34870ab35e94b037c9bbf6.png)
![[Diagram]](../../diagrams/14/6c09ed34a637bf624fdb701da5552985.png)
![[Diagram]](../../diagrams/33/d7151bf121cff9fc6c7c506dd9f5bd8e.png)
![[Diagram]](../../diagrams/33/8738e5140000e30d11251f7eb9239952.png)
![[Diagram]](../../diagrams/12/5053ed7c02acdd4a4b5e2d811534d4b1.png)
![[Diagram]](../../diagrams/23/792d785877593cc30dab4b411837a0ca.png)
![[Diagram]](../../diagrams/50/0a3bc15b919524ff04c7aeb4eda532e2.png)
![[Diagram]](../../diagrams/37/0f124331fa19e8d3eb4d357197d6417e.png)
![[Diagram]](../../diagrams/28/d67272ec9e8083cc5c68af3ae200e1d8.png)
![[Diagram]](../../diagrams/35/363621a5151f2a16966ad45779256d61.png)
![[Diagram]](../../diagrams/2/5b047934a0a08ddd8c342ae9a75f3c04.png)
![[Diagram]](../../diagrams/37/3a1b3e9b84fbac2e092e1aaf650ae379.png)
![[Diagram]](../../diagrams/32/6c6daa3ba582c34f170b39bd3df54187.png)
![[Diagram]](../../diagrams/21/498771bb9b0b86ec0bc43b28fff5269d.png)


![[Diagram]](../../diagrams/43/c64715ebb5d2c9c1ffde1f7b0874f4dc.png)
![[Diagram]](../../diagrams/22/4f21c85317f71a8af78e5f3952e3ab10.png)
![[Diagram]](../../diagrams/3/14c99dc229104832b6709d0b9162e5f3.png)
![[Diagram]](../../diagrams/26/70b4ce70de264157acc6434bd219d87e.png)
![[Diagram]](../../diagrams/6/dcc21de832e25bd35db4a1b0c6a9c186.png)
![[Diagram]](../../diagrams/48/7bd64f36f6e7566c7ad08e9604336481.png)
![[Diagram]](../../diagrams/46/a29bdd3a9116d4a8bb65f74702980673.png)
![[Diagram]](../../diagrams/47/97ea3842b8b6cbec3a75a2f0b8fbd790.png)
![[Diagram]](../../diagrams/2/7ef436be746b294515a7ec5cd4230246.png)
![[Diagram]](../../diagrams/18/66eaed53bbd6721ed18b3dcf618e06a7.png)
![[Diagram]](../../diagrams/46/37caf01d811b8f29dba55e1144b1d094.png)
![[Diagram]](../../diagrams/33/9f6f210bb02181596983999effcb7d24.png)
![[Diagram]](../../diagrams/30/ce393bf0631e28775a30cd8048c1d039.png)
![[Diagram]](../../diagrams/12/da53182721520756fe913542d03abf0d.png)
![[Diagram]](../../diagrams/9/243190e2767f310ebf3d10acae6df795.png)
![[Diagram]](../../diagrams/16/f8a1efd3554a9d2c8d5563f3aa5c56e4.png)
![[Diagram]](../../diagrams/22/f4765322459b3b6a00d303e2ebc2cafb.png)
![[Diagram]](../../diagrams/49/8ef4cd4a30108044249bc3f75d4e9732.png)
![[Diagram]](../../diagrams/21/4353874b4cc692bfb99775704f491300.png)
![[Diagram]](../../diagrams/29/21d612b027552a19128bd504c5cc334e.png)
![[Diagram]](../../diagrams/46/acf8ffce58f0702e1a098fb2e00ceb11.png)
![[Diagram]](../../diagrams/11/f4b70176537cfc5ee911006ded26ed3e.png)
![[Diagram]](../../diagrams/19/08f14edf7afd0dad807bcdcae832517f.png)
![[Diagram]](../../diagrams/43/ce55e3727ed889c4593a72c87cb1d679.png)
![[Diagram]](../../diagrams/42/b54dc994d7d8a6ba19e73a5cb8facf23.png)
![[Diagram]](../../diagrams/16/2581f16fc4a830ad65751e86c7f10128.png)
![[Diagram]](../../diagrams/15/84cee70a4b84e229f16c06e5a4f59249.png)
![[Diagram]](../../diagrams/22/077407b0ef0bcc93ac4483a241e1e8c6.png)
![[Diagram]](../../diagrams/6/b5f5ec0c5d5bb754abc8ae8494b3a31b.png)
![[Diagram]](../../diagrams/10/ec65977264aa1e31374dbf713761f56e.png)
![[Diagram]](../../diagrams/34/3007191d7b6ac83d7c8c8c1b49343163.png)
![[Diagram]](../../diagrams/24/3ddfffa942c4864347ba1cbff5300fda.png)
![[Diagram]](../../diagrams/23/3801f5df609d64de9d8ab3fa1d85426a.png)
![[Diagram]](../../diagrams/49/0983b9d16171cf4a7150e5017de2444f.png)
![[Diagram]](../../diagrams/22/4962c368e62b80f8d28d29db1f4b1ceb.png)
![[Diagram]](../../diagrams/12/20fa1e8060d1b4a931b7bd623b0f901d.png)
![[Diagram]](../../diagrams/21/826697a86f53391422a82a2d19d761f1.png)
![[Diagram]](../../diagrams/39/3932317de2bbe8344954479978c9a439.png)
![[Diagram]](../../diagrams/38/fdf5f275257e9a3b9cbf3dd431fbca43.png)
![[Diagram]](../../diagrams/0/a8b1753f599cf78c84da6737ca29f502.png)
![[Diagram]](../../diagrams/35/cade067855954f635e015250b81f9522.png)
![[Diagram]](../../diagrams/50/a0ac3aa38ff2981b18df0dee2d809b03.png)
![[Diagram]](../../diagrams/47/2d6543ddbcf39e3d81b1d9adcc958871.png)
![[Diagram]](../../diagrams/26/2ffadec91136178782322a63cfbd6412.png)
![[Diagram]](../../diagrams/44/dbfc22cc09d5c0bc7e38ca27cbccdc86.png)
![[Diagram]](../../diagrams/14/bb891e882cf2af42b364832bf14ef40b.png)
![[Diagram]](../../diagrams/20/e8f089fdac0fcd70c5e21caca06f5f21.png)
![[Diagram]](../../diagrams/43/4c0c7bb20a9272a1fceadc77bc2ec31c.png)
![[Diagram]](../../diagrams/2/21ca21825034a35de4986aac171f1db8.png)
![[Diagram]](../../diagrams/45/8695d632864b7241de85ad861c695106.png)
![[Diagram]](../../diagrams/6/1a6e7fd935bff6b9d874a192c748d0a2.png)
![[Diagram]](../../diagrams/18/99fe26fdc56ffcc1e6b0977fd415b468.png)
![[Diagram]](../../diagrams/48/08f05b3a52ce75d084c85a121cdb45b2.png)
![[Diagram]](../../diagrams/28/5405dd8a9f7058aa6405da958901d9a5.png)
![[Diagram]](../../diagrams/43/77d30175fd2e63562d9fecf5af538057.png)
![[Diagram]](../../diagrams/33/9c0ef000344f64eef732a405507821c3.png)
![[Diagram]](../../diagrams/49/2205426bbe044ffc3014891988082616.png)


![[Diagram]](../../diagrams/12/adb5bee14f2746e0db2ee86b4bcb0d0a.png)
![[Diagram]](../../diagrams/33/108a635d4107dfafd32a23e4baeb1c9a.png)
![[Diagram]](../../diagrams/7/32a36ce11c5ca90e1fa32a2573b2d1e6.png)
![[Diagram]](../../diagrams/32/78d1b94b474f258f0eddc0bcef1bcc33.png)
![[Diagram]](../../diagrams/29/a6e5f0ce4ed2a7585ddbbcedc61756d1.png)
![[Diagram]](../../diagrams/15/a274a6e7f6e9b4337686edda94dcd58a.png)
![[Diagram]](../../diagrams/11/01be726e5e82e0da9c957ea21a9032a1.png)
![[Diagram]](../../diagrams/19/6870e586044f13754e12dfaae559c000.png)
![[Diagram]](../../diagrams/38/1a301a294ec6c660990366246d12e91e.png)

![[Diagram]](../../diagrams/24/6cd3ba5727ad89b4a70dbe999b0e26f2.png)
![[Diagram]](../../diagrams/45/4765a2b6947f7ed5c91e8c39243c4fc6.png)
![[Diagram]](../../diagrams/30/67fcf10d35f8e555c1a0b1d653dfd1cf.png)
![[Diagram]](../../diagrams/26/daf8b3a23cea97b0afb21e5eb2f57b32.png)
![[Diagram]](../../diagrams/1/3929d3b4412013217568684b239e1ba9.png)
![[Diagram]](../../diagrams/11/ce873d1a5fd93b65886c1cae55c7b134.png)
![[Diagram]](../../diagrams/23/efe9d5e6af873e5a80ce37cb4d674fc5.png)
![[Diagram]](../../diagrams/18/6d1731c44e357d0fd90aa7fc4ff47ea6.png)
![[Diagram]](../../diagrams/49/c0a551c2ad30d16654856f07eb10339d.png)
![[Diagram]](../../diagrams/24/d9829be7c4f929553d1d94f42c95ea13.png)
![[Diagram]](../../diagrams/9/1ac932058d898b809eb32829ef1d3c8c.png)
![[Diagram]](../../diagrams/28/92569acdbbd5780feb414df1fe26929f.png)
![[Diagram]](../../diagrams/19/74f30aa73f334143475bec2f8d3b4a85.png)
![[Diagram]](../../diagrams/48/6f3ccce7a45e24a877f279930b231e47.png)
![[Diagram]](../../diagrams/34/ed47842450cf3669c511f53153d60f6d.png)
![[Diagram]](../../diagrams/41/7b1e3dca92c33126a47d1723be0b7cad.png)
![[Diagram]](../../diagrams/38/2755d2abb6adace7bab1329b78144ffe.png)
![[Diagram]](../../diagrams/11/42afe7c305826076abda2a5bafd224c4.png)
![[Diagram]](../../diagrams/29/b004259c0e5d9bb4381346d80f1915e9.png)
![[Diagram]](../../diagrams/24/7959e1c90e3b3859dae9bbc12524e063.png)
![[Diagram]](../../diagrams/48/75179adbcb406e4db284e80f2e83f539.png)
![[Diagram]](../../diagrams/23/9fcef59a61af964ed76382799ada6aab.png)
![[Diagram]](../../diagrams/28/fab90c025aaa7ed1e4bc63f9b791a593.png)
![[Diagram]](../../diagrams/43/9c7ed544e82a84ef6d3796c0569222d2.png)
![[Diagram]](../../diagrams/49/bf5f07e91da69347b05ea5a1368f3db3.png)
![[Diagram]](../../diagrams/3/07595cf3008a30e7130d03dc70d45d0e.png)
![[Diagram]](../../diagrams/32/8a8166f0aac5f2a04429838cc0bd1c48.png)
![[Diagram]](../../diagrams/41/923155a2bf7f42172de37cef3e27a25b.png)
![[Diagram]](../../diagrams/44/73adfc34ebdacfdf56d9fbb97d76b470.png)
![[Diagram]](../../diagrams/29/b1570c8dfa284ff42f2564ee3446aea7.png)
![[Diagram]](../../diagrams/21/be4a7c6a468935205c1f517bba35de49.png)
![[Diagram]](../../diagrams/33/9914076e3ffd4f7e6f381554eb87e485.png)
![[Diagram]](../../diagrams/26/c63f6b9341620a0a800a5095daa8a540.png)
![[Diagram]](../../diagrams/15/2fe2bdb1a0107aa03a3e91f69d9534c9.png)


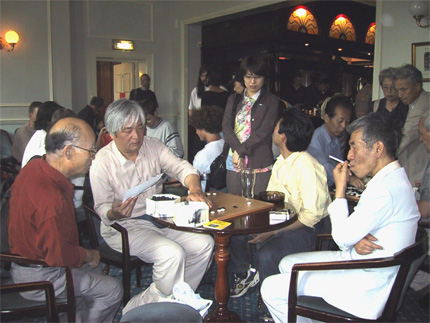
![[Diagram]](../../diagrams/52/a046478cc5a6ad4dd774ecdea4d3a35b.png)

![[Diagram]](../../diagrams/46/52daefeb8c3be0714af0ac5a025f3a38.png)
![[Diagram]](../../diagrams/4/d1de6caf43783e39ab82f10ce5eef7d0.png)
![[Diagram]](../../diagrams/9/d643b7df2cae19b6f73765ae139bc407.png)
![[Diagram]](../../diagrams/47/4a3946b889468a01bbf2f130a2b5d638.png)

![[Diagram]](../../diagrams/33/02b42c0d65b56b9dbe9c843c9c6d145c.png)
![[Diagram]](../../diagrams/8/ccf15a6095e6d65bdc86690052d92255.png)
![[Diagram]](../../diagrams/48/276dec5d0b05ed05727ea24a2f08970e.png)
![[Diagram]](../../diagrams/1/c6408b820bdca19557998a797a5a7afa.png)
![[Diagram]](../../diagrams/36/090d5bb63e0edcc6650f2443ecfcd0e9.png)
![[Diagram]](../../diagrams/18/68c2491999c8088dbd3e4f6579a58adb.png)
![[Diagram]](../../diagrams/32/bb3c82785d6637b0a346f893ffa2a34f.png)
![[Diagram]](../../diagrams/20/01530e095207d943eb89c128495c095e.png)
![[Diagram]](../../diagrams/7/26bd64432f8d19eb932c453dcb049200.png)
![[Diagram]](../../diagrams/32/59f7d6189ab1e5c127c96d3f38fd4c02.png)
![[Diagram]](../../diagrams/46/8be9d4ad1e9b5752d02f07c5a626565e.png)
![[Diagram]](../../diagrams/47/104129ab74613ac0be29222de2644146.png)
![[Diagram]](../../diagrams/39/917ea8d96d359173d24d69a252672b98.png)
![[Diagram]](../../diagrams/43/52e709afa10a532976bb140befabfe7e.png)
![[Diagram]](../../diagrams/29/3e3eda37eef5f802cb04f680db94cbc8.png)
![[Diagram]](../../diagrams/31/a6639c9b79ac05ae3933d2e35faab7d1.png)
![[Diagram]](../../diagrams/5/04a2518e08fb8c298707be4d2758a50d.png)
![[Diagram]](../../diagrams/14/e6953b0b4bfc0ecd25812ead19e92808.png)
![[Diagram]](../../diagrams/23/acb4a8a8765ffe9887dd19b1e5fa1cb3.png)
![[Diagram]](../../diagrams/19/dfdc0bc21950ab3f3ebae2434d305b10.png)
![[Diagram]](../../diagrams/11/05b82ca76c90aa4678602a7581df5827.png)
![[Diagram]](../../diagrams/26/4b22e105bddf2a10353c8beac7bf7158.png)
![[Diagram]](../../diagrams/47/b56acf1a721e918d9a948ce8a624abab.png)
![[Diagram]](../../diagrams/13/0f56660889e015e244e046d2da12c344.png)
![[Diagram]](../../diagrams/21/1d9a3b6f6246392fb9b0627ae2e15a73.png)
![[Diagram]](../../diagrams/47/cbcd24e10435d182416d61fe7e219bfe.png)
![[Diagram]](../../diagrams/36/ba376a11a8dd80ffaa6fb4eb1fd90c5f.png)
![[Diagram]](../../diagrams/10/5f7faa4993d4aa36bcf1f75d55449014.png)
![[Diagram]](../../diagrams/38/253df06ea5646eba85cea99dc865bc1d.png)
![[Diagram]](../../diagrams/21/8bf571b01737650e4fbd0a2e5e2af5d2.png)
![[Diagram]](../../diagrams/17/fa31cfeb6f9f08fbb693a06a2c93e7f7.png)
![[Diagram]](../../diagrams/36/8cae5119d61b7028e9f691c7a55ebbf8.png)
![[Diagram]](../../diagrams/38/de32774b8349f6829b403edbde57e93a.png)
![[Diagram]](../../diagrams/32/3147d419fa0a27ddd395d9c9a16d31b5.png)
![[Diagram]](../../diagrams/17/989bb5bbe8acac2ab909cb7925e9040f.png)
![[Diagram]](../../diagrams/37/e7353b12b4d1a1130e93e11157d371fd.png)
![[Diagram]](../../diagrams/40/9dc0f09e7f6a0a3e1913155806438715.png)
![[Diagram]](../../diagrams/29/8b5455b74183987261198c671a0e7d88.png)
![[Diagram]](../../diagrams/31/1f8f334791da66e635aa4fbdce338531.png)
![[Diagram]](../../diagrams/50/0a4b117be43cb54c1a85d846c22473cf.png)
![[Diagram]](../../diagrams/11/a12a98fb7992f0c5e4cf688729e0253b.png)
![[Diagram]](../../diagrams/18/bd8fc742bc5117f1acaae355eefe5869.png)
![[Diagram]](../../diagrams/1/8946dd22e8dae29e341b62795fb7de76.png)

![[ext]](http://goama.upstream.ru/gallery/albums/masterGo/normal_stars_1try_600.jpg) http://goama.upstream.ru/gallery/albums/masterGo/normal_stars_1try_600.jpg
http://goama.upstream.ru/gallery/albums/masterGo/normal_stars_1try_600.jpg![[ext]](http://goama.upstream.ru/gallery/albums/masterGo/normal_hand_girl_01.jpg) http://goama.upstream.ru/gallery/albums/masterGo/normal_hand_girl_01.jpg
http://goama.upstream.ru/gallery/albums/masterGo/normal_hand_girl_01.jpg![[Diagram]](../../diagrams/11/cf8c848da237b70dfa1cb089927db46f.png)
![[Diagram]](../../diagrams/48/52c74a6741d1b7a20dab535c0a908dfe.png)
![[Diagram]](../../diagrams/33/0c24b08af999f47814985965d880a9ad.png)
![[Diagram]](../../diagrams/12/80c02a7ba09a189ba02b3383e20006de.png)
![[Diagram]](../../diagrams/13/951c161af6198a36a77eb6da4ad1ecca.png)
![[Diagram]](../../diagrams/10/7f5d8b63c22aad7f48da0ff0257dea71.png)
![[Diagram]](../../diagrams/21/456773b056f9fd75962fa483029fe36e.png)
![[Diagram]](../../diagrams/34/ce64f9337f6d6b6f32162761c91d0287.png)
![[Diagram]](../../diagrams/9/103151ee7d6cd465bc18cc3b3393a9a1.png)
![[Diagram]](../../diagrams/47/fd11a8f6ad931967612849e7d59a7f98.png)
![[Diagram]](../../diagrams/41/748cb54e5ff9267918e11bcbf92c61f6.png)
![[Diagram]](../../diagrams/30/06cf7e82994775ba9da89e22a8bcc9d7.png)

![[Diagram]](../../diagrams/21/612c07f5002b4b2da1a4d599145d6181.png)
![[Diagram]](../../diagrams/1/0d7f076fdb5bf4ab40cef89b02889eb6.png)
![[Diagram]](../../diagrams/26/f7776422e71289d162655a575520a57d.png)
![[Diagram]](../../diagrams/47/ba62feeabf6f535df223a7c59aab6b38.png)
![[Diagram]](../../diagrams/15/3488c4ac4058bdfaae3b257132084106.png)
![[ext]](http://kgs.kiseido.com/servlet/graph/sbaguz-it_IT.png) http://kgs.kiseido.com/servlet/graph/sbaguz-it_IT.png
http://kgs.kiseido.com/servlet/graph/sbaguz-it_IT.png


![[Diagram]](../../diagrams/4/2a716d3658546931583e9ac1e8427472.png)
![[Diagram]](../../diagrams/20/ec81ba4629a7a9c348f46965e9cc29b2.png)
![[Diagram]](../../diagrams/45/fa33773598b057ff19a4439e8b7f6122.png)
![[Diagram]](../../diagrams/0/73ddf1b11b6126667e3ddcf3cb94b89e.png)
![[Diagram]](../../diagrams/19/3c86a3cb6367092bad85d05eb6f18edd.png)
![[Diagram]](../../diagrams/48/8a18260b0a2cfea49ee1cd4162932a5a.png)
![[Diagram]](../../diagrams/5/9c856b45ca31d91ed2a60506581634f1.png)
![[Diagram]](../../diagrams/35/18d8bc72aaa1b72631762358b9f90fc9.png)
![[Diagram]](../../diagrams/37/9426cc87e29639fe9fdc34a2424baab0.png)
![[Diagram]](../../diagrams/42/b7962f40e5178cf87e2ce25a9bf5ae6f.png)
![[Diagram]](../../diagrams/4/b79c60168ff7e6f79e53b7ca4091aa05.png)
![[Diagram]](../../diagrams/42/da7ea0efc9723fb7f6ae25a07ba4d5fa.png)
![[Diagram]](../../diagrams/5/f488757531e005b77232bf698d47c540.png)
![[Diagram]](../../diagrams/51/ab798e9ddca36c2eca28ddf1585ef78b.png)
![[Diagram]](../../diagrams/48/796d03ed6e7a821710f2f0fc19ddac4b.png)
![[Diagram]](../../diagrams/14/9e0ce45a3024ce1f6d8332d7573b3ae3.png)
![[Diagram]](../../diagrams/23/f1326bd1802cb70445a5e4d3324e1402.png)
![[Diagram]](../../diagrams/6/d792469223ff08e4fc04be52eb4b541a.png)

![[Diagram]](../../diagrams/30/052809dab235eb03f4bc31e00e38f7c3.png)
![[Diagram]](../../diagrams/47/d2c787936af86650cb56bc3a6d3100f2.png)
![[Diagram]](../../diagrams/6/24bfabdba0ed48635280e64f9c5b9980.png)
![[Diagram]](../../diagrams/38/37f92f6012979fdbe332be3251897d8e.png)
![[Diagram]](../../diagrams/45/80c469fab2e2c78628ad8356c1b1150b.png)
![[Diagram]](../../diagrams/50/850088ac38b79b3aad557dc12dffe45a.png)
![[Diagram]](../../diagrams/10/2ad86a1ac3ca9b540f41ce3c943591b5.png)
![[Diagram]](../../diagrams/6/de8409df68301989d37af2ee35e87c76.png)
![[Diagram]](../../diagrams/39/bb75ff9aca1e493ec77dfeb4850d1058.png)
![[Diagram]](../../diagrams/50/a2072c4980036bae5a0950252787ea83.png)
![[Diagram]](../../diagrams/3/473d8cb421b8dbfb62c06b7ed8ae6133.png)
![[Diagram]](../../diagrams/27/620afae74361136f1ebd9296998f95be.png)
![[Diagram]](../../diagrams/32/896ef139992911203121ed06c5b7f0aa.png)
![[Diagram]](../../diagrams/50/50173157fa97955a59a2e2cba11255a6.png)
![[Diagram]](../../diagrams/9/ba2a07b3ad66df9edd6c184218c995a4.png)
![[Diagram]](../../diagrams/28/9880f28a6191480caa3ccd650e14b51c.png)
![[Diagram]](../../diagrams/32/654fe6992466877ec2cdb5b191c12fee.png)
![[Diagram]](../../diagrams/17/637a23b897da5b0502b43f44d23068e0.png)
![[Diagram]](../../diagrams/26/229f645f79416e4bf5bd2cbaa2186de8.png)
![[Diagram]](../../diagrams/40/05dfdd5649eab77787d2cd2aaeed6a04.png)
![[Diagram]](../../diagrams/34/5672900ceb3fd9aa581266dd4234b61c.png)
![[Diagram]](../../diagrams/25/0822e5511d9b4e3805dd45f8c55ce67c.png)
![[Diagram]](../../diagrams/31/98bf9073546b219f55efb4d5b15b4923.png)
![[Diagram]](../../diagrams/36/c206201f2f5809a045180bdf95a5e36d.png)
![[Diagram]](../../diagrams/23/21f31d30c248b023d404736f52e3b4a4.png)
![[Diagram]](../../diagrams/3/0f5c8c367431abbea92ea5efba76e77c.png)

![[Diagram]](../../diagrams/22/8efa339da4cee3f11eee9dba57be68f9.png)
![[Diagram]](../../diagrams/31/745dcabb7d01ff79851f507e253fbe09.png)
![[Diagram]](../../diagrams/43/e8d5a489cbfcf215e7f8a1d614a4a6e6.png)
![[Diagram]](../../diagrams/2/3af8999277a9bb6e2af88e594dc33f1f.png)
![[Diagram]](../../diagrams/36/5826d7da814c73727f6c379e5f1228b3.png)
![[Diagram]](../../diagrams/46/49e58c3783d32c5432f0d7d91e3a05b8.png)
![[Diagram]](../../diagrams/13/cc9dfad958464691de8aefbd320e3f49.png)
![[Diagram]](../../diagrams/7/8984ef5667cf31d639502a59c0f97f74.png)
![[Diagram]](../../diagrams/1/d9d73a01e872c8c735c96b4eef5aceed.png)
![[Diagram]](../../diagrams/33/4bb236eed017b021f813dc4bd08ed92d.png)
![[Diagram]](../../diagrams/47/8be4cb9585c8948b927a1c4da18c566f.png)
![[Diagram]](../../diagrams/36/ee6ff413c1ae9b444e7c9b7ba487100e.png)
![[Diagram]](../../diagrams/2/7f95dd4df7dbe79544c053bd6a44fd34.png)
![[Diagram]](../../diagrams/35/4f8b72b22ef849fe53c5ce3a0a6574ae.png)
![[Diagram]](../../diagrams/48/3d5538faf07165b15c34167fba0a8f1d.png)
![[Diagram]](../../diagrams/34/1573519230748e7720096deadb2c9ded.png)
![[Diagram]](../../diagrams/9/c0131f2ea22c8970ef32c168f92da149.png)
![[Diagram]](../../diagrams/12/7547e774abe9c1356585abca6b1f827f.png)
![[Diagram]](../../diagrams/13/8580b49692041a6ff0e28a4146995963.png)
![[Diagram]](../../diagrams/14/66d85cb7f0ca42ae976b7d0e68c587ee.png)
![[Diagram]](../../diagrams/24/3f3a4c39a453b7141e1e2cf6b7eccfa0.png)
![[Diagram]](../../diagrams/17/cac1bdd061cd3ead735f7a484ac7cbbf.png)
![[Diagram]](../../diagrams/23/608a3fc2d2e13b7984327af4c9cd5fd5.png)
![[Diagram]](../../diagrams/4/a572687598ce785cc73b933f7ead1f43.png)
![[Diagram]](../../diagrams/52/5ee87c09d7347a63e0f34a66d6767557.png)
![[Diagram]](../../diagrams/25/75aef4253a6f423313bc267c24adecd3.png)
![[Diagram]](../../diagrams/46/ea4d51d7f174e50fba6e91cdd443d11f.png)
![[Diagram]](../../diagrams/31/12a5bfd9207ccfc227e0b5df75c3c486.png)
![[Diagram]](../../diagrams/4/7419fea304ed36b3bc168548584265ca.png)
![[Diagram]](../../diagrams/52/4d0708d7c3072da103c45891503683c8.png)
![[Diagram]](../../diagrams/37/5207c707ced59a3b699b1d2172e1eb49.png)
![[Diagram]](../../diagrams/20/74fdcc1beede33026f8020b4829ab4bf.png)
![[Diagram]](../../diagrams/24/c67222dcf41a5f91401675ca07adb05a.png)
![[Diagram]](../../diagrams/21/111b741839e2c2d11c3acd5ce1759ba1.png)
![[Diagram]](../../diagrams/23/29e797c9262f0a5bb44002943cdd4c7e.png)
![[Diagram]](../../diagrams/12/1e5a0f5369f0cf31b2bad769cb1f3dcc.png)
![[Diagram]](../../diagrams/6/a5b39701bad9fe8735040f9117fffbff.png)
![[Diagram]](../../diagrams/45/81ec7363145b93328dca57e0c873fa8c.png)
![[Diagram]](../../diagrams/6/9bf79cd4744cff4eb5b8f796da1906bc.png)
![[Diagram]](../../diagrams/30/160fef06518ac9c899e2b0f010cf15fb.png)
![[Diagram]](../../diagrams/10/3b22e7baf33e02df2b8642eeefb52633.png)
![[Diagram]](../../diagrams/9/8d2e48de26780561817ffc6d1b81a594.png)
![[Diagram]](../../diagrams/23/be5020d4c9b0380411579034864e6021.png)
![[Diagram]](../../diagrams/25/7f2528ae4ebc2e4ac8dc1f990c7590b7.png)
![[Diagram]](../../diagrams/39/940f0fdc6fe221fe3bb066d8913640ac.png)
![[Diagram]](../../diagrams/15/c8d49d6fe2790cb4614bed965b9b8b2b.png)
![[Diagram]](../../diagrams/47/7f6d653b0530f7c2e0f9b804a0925fe1.png)
![[Diagram]](../../diagrams/2/ffa329e72f6d2761bfd268daf79a25db.png)
![[Diagram]](../../diagrams/35/02546feb26bdc46a215a68da9af3f33b.png)
![[Diagram]](../../diagrams/29/7be486a9dba2040e32ddd72793d624b5.png)
![[Diagram]](../../diagrams/9/35bb468e813fc9f3443169b0d117dcd5.png)
![[Diagram]](../../diagrams/44/4090845c45fbe7babb0a411f7ac27966.png)
![[Diagram]](../../diagrams/37/c279297473d1dd87c0c1253565e063dc.png)
![[Diagram]](../../diagrams/34/cb1d662557cae196d19687747725ff51.png)
![[Diagram]](../../diagrams/47/f18ac6c547974c357339066a87bc21a9.png)
![[Diagram]](../../diagrams/0/a8b9524c589c61312567e39e1c82ec80.png)
![[Diagram]](../../diagrams/17/e81e30fa603c48ec38397e26835c3867.png)
![[Diagram]](../../diagrams/40/5466ad0bcc2078984dbf86cd697b63e1.png)
![[Diagram]](../../diagrams/18/e5119b172b942ca4b36e241ffcff215f.png)
![[Diagram]](../../diagrams/33/d35161deefb6137126b2283a01d62a24.png)
![[Diagram]](../../diagrams/47/52db6fb12b999a6be78c899b26de1f7d.png)
![[Diagram]](../../diagrams/51/0c3e9a981ddd31ccb79107a96b11ec61.png)
![[Diagram]](../../diagrams/43/d2f09608c50a1f2cd1607c879b9ab9f5.png)
![[Diagram]](../../diagrams/44/66bb1f9bf298733de3ca0d693d6a7545.png)
![[Diagram]](../../diagrams/19/07bf83ab5cee4be2f30cd6de7a326440.png)
![[Diagram]](../../diagrams/46/5d5fbc5954aa50a2dbb3b9dbb19575ed.png)
![[Diagram]](../../diagrams/52/02bb4f001f1d37e2a7419848d0e10f85.png)
![[Diagram]](../../diagrams/48/a266c1f281613307cb82b7d42e3e6803.png)
![[Diagram]](../../diagrams/52/06a5e7357cbc0b78c7621350fba5a3f9.png)
![[Diagram]](../../diagrams/21/a2b6158d55737727891a11e7cf1d79c9.png)
![[Diagram]](../../diagrams/27/4a0ea7530691510bc5107d28a361db3e.png)
![[Diagram]](../../diagrams/52/ef767092197bc5ae73ee45baa2f7cc27.png)
![[Diagram]](../../diagrams/30/05c9d55730d926cd985205c4df6efcd7.png)
![[Diagram]](../../diagrams/4/0a86e6e5d84646377267d95faa724b9e.png)
![[Diagram]](../../diagrams/17/4b0365446a9a3d04c79a87c8ebd346fa.png)
![[Diagram]](../../diagrams/3/8da88329e40e35684003744da6290731.png)

![[Diagram]](../../diagrams/38/18d0cf3b916897531f93c71be8415bca.png)
![[Diagram]](../../diagrams/47/dc642bfa0e0bac05c101435450f41f1b.png)
![[Diagram]](../../diagrams/9/56b0bc9f290d5a038ae0a1390f9bcd1f.png)
![[Diagram]](../../diagrams/45/febf1612b8c1e0b815c5295b8284c1e2.png)
![[Diagram]](../../diagrams/49/156a119abbb54e8f1f54e3e847a312c8.png)
![[Diagram]](../../diagrams/3/07ad71f8a5f226ef4cb61df5f94234a3.png)
![[Diagram]](../../diagrams/22/e2671d5a0565e096365cc2cc5857dbd0.png)
![[Diagram]](../../diagrams/18/fc251f76dea2cc6ade35337bb8f22ce7.png)
![[Diagram]](../../diagrams/10/4a952381203f99fdefbb5c6e48c35bf6.png)
![[Diagram]](../../diagrams/35/60e41f06123b5c4f301cf6dd5b688668.png)
![[Diagram]](../../diagrams/44/43f3bdf079fda76feff7c71bc19ef8b4.png)
![[Diagram]](../../diagrams/4/d14dfee3034c51ec5ee552e9a429e6ac.png)
![[Diagram]](../../diagrams/44/100c6d16704a6fc04110d6b7e18ddfb7.png)
![[Diagram]](../../diagrams/0/bafd349f34426670e1bb60fe0463f67a.png)
![[Diagram]](../../diagrams/30/c1b8f56bb2c8ba24972b245e6f7d87a7.png)
![[Diagram]](../../diagrams/13/40e9536270153d025370623378887991.png)
![[Diagram]](../../diagrams/30/ba919ba254d23921e4db3ae4bf2e8fb6.png)
![[Diagram]](../../diagrams/37/b1cc38f804f5c44bfda7593089a83f36.png)
![[Diagram]](../../diagrams/29/7f6be8d3296066982acfc47c4e6c5e1a.png)
![[Diagram]](../../diagrams/7/0144d02190e80054da672802f0b73827.png)
![[Diagram]](../../diagrams/42/489e9ca02f5ee6697764fe22777362f1.png)
![[Diagram]](../../diagrams/52/01a301269c54165195eda8db36f46a56.png)
![[Diagram]](../../diagrams/29/2725d45fb62dc4d0b6db8bceb7285def.png)
![[Diagram]](../../diagrams/36/5d05d16b7a4355e6238d16c4c50568bc.png)
![[Diagram]](../../diagrams/24/e12fd398b16b2ebe1a2ab1e999db3b79.png)
![[Diagram]](../../diagrams/35/6b4fc0d706e4b8c2eca489d6b1031153.png)
![[Diagram]](../../diagrams/37/c34995f7e8589be309463f0b5d9bf154.png)
![[Diagram]](../../diagrams/42/4a8aa4ad0db8b0ef1aa68f29db4cf826.png)
![[Diagram]](../../diagrams/2/eac718892380e62cde3acddfb9c1f8df.png)
![[Diagram]](../../diagrams/3/163ec1c318a4df451e8dec292602a670.png)
![[Diagram]](../../diagrams/29/a7c02012a9df05a5e1c2e2c2c3dea11e.png)
![[Diagram]](../../diagrams/11/551bc48986001108ab547bf67ace3769.png)
![[Diagram]](../../diagrams/5/a8f5b7a8583823e014d5981fdbe7b246.png)
![[Diagram]](../../diagrams/1/a8054bca3e58d4bf8d44fe0646ab6784.png)
![[Diagram]](../../diagrams/5/99b17dae387203494fd2ec06d0c646d7.png)
![[Diagram]](../../diagrams/41/bbdaaf05cb3ac93368abab452671b45d.png)
![[Diagram]](../../diagrams/29/db5fc1059d7e24103c53ebc422e9b748.png)
![[Diagram]](../../diagrams/8/a76da100cfeeb27a5bd030cc332d8ddb.png)
![[Diagram]](../../diagrams/40/eb5f97de12b664d3022f2c02bcf71961.png)
![[Diagram]](../../diagrams/23/fe6a63c7a270d6c3971a26292fbb960f.png)
![[Diagram]](../../diagrams/0/52199b490b17c53e5e657679d09b353c.png)
![[Diagram]](../../diagrams/29/b9b2aaaf2441f6df60db31a2747c7013.png)
![[Diagram]](../../diagrams/30/19944642a371ef49fff07c480889cecd.png)
![[Diagram]](../../diagrams/0/4ccafd4f333fda0a2d0ee1132ff98bd7.png)
![[Diagram]](../../diagrams/21/fc22743b406a8b588f4a8cd09d876cfe.png)
![[Diagram]](../../diagrams/21/d4e1da314afb8f6433c84755ad452bdc.png)
![[Diagram]](../../diagrams/29/5188e748881611af96ecc1887ab6a0e7.png)
![[Diagram]](../../diagrams/15/86aeeaafba0f9e4f71cb51fdf8ca8a3e.png)
![[Diagram]](../../diagrams/40/f370c067449d899e8a300942f2ca3eb7.png)
![[Diagram]](../../diagrams/13/7d4939e048cd52e7d24bec295bef037a.png)
![[Diagram]](../../diagrams/44/6ab53c039d5a39e3db6a7613a5339d2f.png)
![[Diagram]](../../diagrams/19/da94effb3c837a95b9fe2d0a8ff1f8b6.png)
![[Diagram]](../../diagrams/15/7e4e4ce06d67a6b63cdc8700b4eaab3c.png)
![[Diagram]](../../diagrams/3/6a1fbe6ad9daf9dedb26ee1e0082d825.png)
![[Diagram]](../../diagrams/44/8a6a71c003f06ae265cb952b135fb321.png)
![[Diagram]](../../diagrams/47/9e41bc9d62e924efc1755e32b59f5493.png)
![[Diagram]](../../diagrams/31/329e5ea9bab41ed6fa59e09bdaf790b8.png)
![[Diagram]](../../diagrams/40/e4d10ac42c3d0a3555da08d77b0de884.png)
![[Diagram]](../../diagrams/31/23516f115974c5c8bd2e8901b3814a06.png)
![[Diagram]](../../diagrams/24/26797f04994c796396eff778c1ad096f.png)
![[Diagram]](../../diagrams/42/2b43a5e65db5a1a68336bf29412bf37e.png)
![[Diagram]](../../diagrams/42/78bcb624dbf63995b730769c85d1c09c.png)
![[Diagram]](../../diagrams/21/4708108a16227bf3d640cc01816f40d2.png)
![[Diagram]](../../diagrams/52/bd1135eecdf7a8b20bfa12df1a448de5.png)
![[Diagram]](../../diagrams/10/878aa652ef2b308ddb1ba952bf1577c3.png)
![[Diagram]](../../diagrams/31/2298b1384319aadd12e0e477234f5da6.png)
![[Diagram]](../../diagrams/16/786538fd8dbae361faabd2b0bf17eacb.png)
![[Diagram]](../../diagrams/18/65a9fe35bbd7a791371e752c0f8c088a.png)
![[Diagram]](../../diagrams/11/431bfa64ca357a5338dd179ee272db62.png)
![[Diagram]](../../diagrams/11/4491833e5e2da2354cb1f421d30215e2.png)
![[Diagram]](../../diagrams/42/1a5433313c6f9e3d389ed6fffc43c89c.png)
![[Diagram]](../../diagrams/11/b3f9be127d72e4214270e7a0998eb2c2.png)
![[Diagram]](../../diagrams/19/4c270d96e6534303850883747ff9640e.png)
![[Diagram]](../../diagrams/19/fb6c3589cc7ea4c89d6304da1541a95b.png)
![[Diagram]](../../diagrams/29/1186a571f54577ac1cf6ebb0c039e3e5.png)
![[Diagram]](../../diagrams/42/c401269bd68ed555921be267c3cc680c.png)
![[Diagram]](../../diagrams/52/17b7be5a2626894e5f149b5452e9e15c.png)
![[Diagram]](../../diagrams/20/4ce71083c104d9648618c15ae5d3c41b.png)
![[Diagram]](../../diagrams/14/18f7f462fc89ef0fdb3f67edf160b1d3.png)
![[Diagram]](../../diagrams/34/25ce41a7afcddb20238de0937515c197.png)
![[Diagram]](../../diagrams/16/630fd5822ce5f433d097aa1c68d2737c.png)
![[Diagram]](../../diagrams/16/b3910675ba4e6b9cf6131775194a9585.png)
![[Diagram]](../../diagrams/18/37429010a06031878a3196299b18bad9.png)
![[Diagram]](../../diagrams/18/f98f94711c97c36c864c7abefc2d8f7a.png)
![[Diagram]](../../diagrams/8/f773a3a8d1bb5205007dbd57977b4950.png)
![[Diagram]](../../diagrams/39/46ca1bbc57ec510fad23889f2177ce73.png)
![[Diagram]](../../diagrams/4/6b83fa4fb2fe3dcb95ee803656402b80.png)
![[Diagram]](../../diagrams/5/91afc1e4a7092891eb98595ede0add00.png)
![[Diagram]](../../diagrams/40/b86f06543cb1721515d6107625594985.png)
![[Diagram]](../../diagrams/28/2ba59e4b7f9e350a198797c7f7adc9a7.png)
![[Diagram]](../../diagrams/50/0bdb67d6741bf7a656b52611e9b928fb.png)
![[Diagram]](../../diagrams/3/98490a7b06fe5128058b95856cb8dda6.png)
![[Diagram]](../../diagrams/16/26aae01bc535fa3d441885027cfc7d91.png)
![[Diagram]](../../diagrams/16/83d97d098a8a664553128cec978101f5.png)
![[Diagram]](../../diagrams/24/418d7823239d394b4af935b4a618153a.png)
![[Diagram]](../../diagrams/9/ca93ce6b410845c5b5171efe809375c1.png)
![[Diagram]](../../diagrams/26/6477e758990ab0840ee6259c4783a0cf.png)
![[Diagram]](../../diagrams/48/1293a773c4024b690f73a9a7750b2ce0.png)
![[Diagram]](../../diagrams/17/d7be7c3c9d330d570092a3d417a2b2e3.png)
![[Diagram]](../../diagrams/39/aa0f68d4709e9fdadbe21e04553f65f2.png)
![[Diagram]](../../diagrams/51/205dff511e2c1526c80f3d090c0f9985.png)
![[Diagram]](../../diagrams/31/8367bb708d606ab099eda4cb6b5580c8.png)
![[Diagram]](../../diagrams/35/6ee553e22c5eb7000e6b05748a95ede5.png)
![[Diagram]](../../diagrams/30/e72f285c26da97fedcb4cc78a043a520.png)
![[Diagram]](../../diagrams/36/d6bf97011985d8279c3cd7764c4ce0e7.png)
![[Diagram]](../../diagrams/5/f6d9320d8d5111273757b033f8f8c78b.png)
![[Diagram]](../../diagrams/23/b180f0f5c4fb58e42aeeb42676379a7d.png)
![[Diagram]](../../diagrams/17/3a99d7bf3f8454a9cf6a94e636588b75.png)
![[Diagram]](../../diagrams/43/e360b18ec1000ce5083fd2822f3fe10a.png)
![[Diagram]](../../diagrams/11/9f505799f8fc6a2f3da91a5661427257.png)
![[Diagram]](../../diagrams/10/b12c74c36125dcee1435ab0543bb2273.png)
![[Diagram]](../../diagrams/21/6b6115e1327599c403ad4401d0370abc.png)
![[Diagram]](../../diagrams/44/6e5c43f0af92665bb6c0fbc44f4d85f2.png)
![[Diagram]](../../diagrams/27/8392001fadf85ea80b00175cb64b7025.png)
![[Diagram]](../../diagrams/35/94addad0d58cabf939609b434512f9af.png)
![[Diagram]](../../diagrams/50/16bb52eca0a4c95033c973937a589eb6.png)
![[Diagram]](../../diagrams/19/a5098c99fd0bbf63d5bf62057f10afc5.png)
![[Diagram]](../../diagrams/26/28581265aa54b5b1ea19660a80343705.png)
![[Diagram]](../../diagrams/42/aaf1369121de222d29b9abb98539fec4.png)
![[Diagram]](../../diagrams/24/a919fd6777410ad565d5d5b5caae2cbc.png)
![[Diagram]](../../diagrams/7/2111d4de014951dc2b3abe9f2d3ad1a9.png)
![[Diagram]](../../diagrams/1/c9b43335666b829511f1694ca8b115ef.png)
![[Diagram]](../../diagrams/15/ce154da10574e795704a2b7f9255a56d.png)
![[Diagram]](../../diagrams/36/b4ab2cfc9d1cbd3f5d997c751f79c903.png)
![[Diagram]](../../diagrams/12/6ce2914d606c20e8f3172d77828a6707.png)
![[Diagram]](../../diagrams/20/61007302d7845adbb87ae350d7cbad32.png)
![[Diagram]](../../diagrams/29/d2c07a00df0bf483588ff14512cdb5cc.png)
![[Diagram]](../../diagrams/51/aa325fd61b9aeb1c05e99cc08adffb70.png)
![[Diagram]](../../diagrams/45/36486dc4fd1b580c4dff67dee7926597.png)
![[Diagram]](../../diagrams/51/767ab10d6ca5eae67e5a5c80cf14b212.png)
![[Diagram]](../../diagrams/11/77d7202793429c32143f301563573d5f.png)
![[Diagram]](../../diagrams/28/255d618fcf3705ccb1d88987053c3d39.png)
![[Diagram]](../../diagrams/6/1e5add63599d56e925a0b6d18628c1e7.png)
![[Diagram]](../../diagrams/12/7cdc90e7ada8ad98d7fa7a08b5fa0907.png)
![[Diagram]](../../diagrams/25/405a02b64f11dbe213dc13968ad47389.png)
![[Diagram]](../../diagrams/41/c5140251f453294556f7338516cf2cf9.png)
![[Diagram]](../../diagrams/6/b7b247ff57c3e60b743f875f0b225aed.png)
![[Diagram]](../../diagrams/44/11056c01440d6d4b504babcdba43a264.png)
![[Diagram]](../../diagrams/43/7496486c5be4314aff7e6520e68eb944.png)
![[Diagram]](../../diagrams/23/4ffa6c71dafce5728ab96d0106312df8.png)
![[Diagram]](../../diagrams/36/38cbb33d1b64f5ee7802ac8c3d09722d.png)
![[Diagram]](../../diagrams/2/2fd2d9c4612aa6d6ed3ecef98692b6d2.png)
![[Diagram]](../../diagrams/39/14db39d8822c9f5eb760c6aeeddd125b.png)
![[Diagram]](../../diagrams/9/9751300c40db7d4921c03dc7a584c6e9.png)
![[Diagram]](../../diagrams/3/e029aec9f57cce4a83cd50f557a376a1.png)
![[Diagram]](../../diagrams/48/a5b34d68f1b87db93cf8b653e620d0b1.png)
![[Diagram]](../../diagrams/0/a89a46054bd277cca19910f17569a385.png)
![[Diagram]](../../diagrams/28/7836e10eabfdce4e58bbdbeb7f363eb8.png)
![[Diagram]](../../diagrams/23/7bea23eddeba63140d6b461d9addd17b.png)
![[Diagram]](../../diagrams/13/def9b7e739052a230b03bb92bc6589ff.png)
![[Diagram]](../../diagrams/23/39087955224e338f94b3141b936ba2a6.png)
![[Diagram]](../../diagrams/13/46be51efc1b0feedd04605e935a217c9.png)
![[Diagram]](../../diagrams/2/a2227941ddd727b53a8ead50cdefa9e4.png)
![[Diagram]](../../diagrams/25/a8de15cbbc6d5b6ba6ded56f5d78f969.png)
![[Diagram]](../../diagrams/15/bfcb211e29b3d5bef78a16899cf2df69.png)
![[Diagram]](../../diagrams/16/0264768ab76426e2ad9a7039357e1f4d.png)
![[Diagram]](../../diagrams/31/67d1c74028cdb35d299edd58f21d106c.png)
![[Diagram]](../../diagrams/31/7ca83f3158616b4cf239cdd875928ad4.png)
![[Diagram]](../../diagrams/8/91bccf5f91e82e7d1a653309a4240b20.png)
![[Diagram]](../../diagrams/2/50cad4aadea7a1090c879592c97a76ad.png)
![[Diagram]](../../diagrams/18/75f054ad835c6a8867dc1ad8a296eb85.png)
![[Diagram]](../../diagrams/27/ffc1356fcb3f1ee699358be8bf401a57.png)
![[Diagram]](../../diagrams/50/57bd92448487f5ecb4999d1c2445b9cf.png)
![[Diagram]](../../diagrams/48/3aef086c8be3f575faadff7bc2d02945.png)
![[Diagram]](../../diagrams/30/06175388c552beafa8e50bb164ae99c0.png)
![[Diagram]](../../diagrams/45/f1160def964a6f38d469667ee5fdbde0.png)
![[Diagram]](../../diagrams/7/a5f37a1a52aa745ef446dcff4b5da08e.png)
![[Diagram]](../../diagrams/33/0b79790a9c835f5d2ca5c090b4a30e08.png)
![[Diagram]](../../diagrams/20/0202da985ca13e611d6559dfbf78fb80.png)
![[Diagram]](../../diagrams/32/7c05cbde11774e8a401fac452220996f.png)
![[Diagram]](../../diagrams/2/92b49f6088fb8872799d696852984e1c.png)
![[Diagram]](../../diagrams/6/5e0b6ebb4b1eef84a24d1263c6281519.png)
![[Diagram]](../../diagrams/7/48faf3399f2a66c579da57b67f4ed71f.png)
![[Diagram]](../../diagrams/11/e7eac5c26d27d78f91e66828472868f5.png)
![[Diagram]](../../diagrams/50/a510ec21d160f47b53bbc9f5594d180e.png)
![[Diagram]](../../diagrams/12/9516e9eb486f8ec41661dd887f8da6da.png)
![[Diagram]](../../diagrams/10/e5f0f0d14fd0b0116266520edbd689f5.png)
![[Diagram]](../../diagrams/15/230fddabd4edf0d2402b4590a1c02954.png)
![[Diagram]](../../diagrams/2/ac16bac3a53b0fa09d627e6ae4ce73ea.png)
![[Diagram]](../../diagrams/24/c523fcdc857fc5bdc57b014e77e9c17a.png)
![[Diagram]](../../diagrams/5/563d67753f6294adb1a815b0233955bd.png)
![[Diagram]](../../diagrams/5/4e6fca61f359b0b74d27c25b46579896.png)
![[Diagram]](../../diagrams/12/554c0056884b6c6081a0da1b2646b94f.png)
![[Diagram]](../../diagrams/25/9f1a61f7916ba071f517980e4db4ef07.png)
![[Diagram]](../../diagrams/37/822b58e1f12df016ff2194789546692d.png)
![[ext]](http://badyk.ru/files/P5140012.jpg/normal) http://badyk.ru/files/P5140012.jpg/normal
http://badyk.ru/files/P5140012.jpg/normal
![[Diagram]](../../diagrams/41/7696a2b97ad55d571195f432154566fc.png)
![[Diagram]](../../diagrams/14/17ee1132099c39655da80ccbd6cc7ad8.png)
![[Diagram]](../../diagrams/34/973ced7560fe5c962b375f4e939eab67.png)
![[Diagram]](../../diagrams/20/f53346f03db922fb9c1d3f17701b0b21.png)
![[Diagram]](../../diagrams/45/6e7dd7618aa4254db19d432fbc9b6978.png)
![[Diagram]](../../diagrams/49/d8ae8dcb05bff8ba3dbd1efb944106f7.png)
![[Diagram]](../../diagrams/36/1f6f7cce7b7c944686d479181aa862fa.png)


![[ext]](http://www.feniello.com/go/album.png) http://www.feniello.com/go/album.png
http://www.feniello.com/go/album.png

![[ext]](http://kgs.kiseido.com/servlet/graph/shadowkid-en_US.png) http://kgs.kiseido.com/servlet/graph/shadowkid-en_US.png
http://kgs.kiseido.com/servlet/graph/shadowkid-en_US.png
![[Diagram]](../../diagrams/8/1d6dcc3229dce65edf62194be1ea2272.png)
![[Diagram]](../../diagrams/20/fe0bc3959d806cbf22ba1a908a0961f0.png)
![[Diagram]](../../diagrams/43/934348f3529edd3929d252988d663854.png)
![[Diagram]](../../diagrams/10/f4829ebafcb0540b69ca37a1eab9cb0f.png)
![[Diagram]](../../diagrams/26/9e2a9396e97297c98103227b2d164b31.png)
![[Diagram]](../../diagrams/44/a7dd903c7d8bc80de858800e6166db44.png)
![[Diagram]](../../diagrams/27/3f22b84aa54f9a2e476cd0ae272e942b.png)
![[Diagram]](../../diagrams/35/81a86b76d22e5060304d37ae7f162522.png)
![[Diagram]](../../diagrams/32/622003ab972e20aa6817eed457916abf.png)
![[Diagram]](../../diagrams/36/4eb1ca7918f533b868b8143dcb6d868f.png)
![[Diagram]](../../diagrams/39/9c36a5a661c9da6aaa07386af9a81a65.png)
![[Diagram]](../../diagrams/7/5ef80fd127eecfc4bf21f4d30524bd19.png)
![[Diagram]](../../diagrams/42/4443380bd1daa05659f4a6674f8350e3.png)
![[Diagram]](../../diagrams/47/ea89cc21af66d36c36a5a6d53112928c.png)
![[Diagram]](../../diagrams/45/6f50a475420a0efff087263213413a33.png)
![[Diagram]](../../diagrams/28/6c9891e0c597ce01fa2bebc1cb877f53.png)
![[Diagram]](../../diagrams/6/1e1fd66166b7eddbc55a16a700bed50e.png)
![[Diagram]](../../diagrams/35/90b4ea8f58e8c360dee6f49081381d7f.png)
![[Diagram]](../../diagrams/10/0197acd8f42af308b1a125f5b4fdb67a.png)
![[Diagram]](../../diagrams/7/47501fb6c9104b8addca08dcd736afdd.png)
![[Diagram]](../../diagrams/27/cf676e0782083057964cc354f1136843.png)
![[Diagram]](../../diagrams/5/48dedf152d22b6a94d48f313ac2e08dd.png)
![[Diagram]](../../diagrams/51/a13f1fc74119e3c0162387d61412b359.png)
![[Diagram]](../../diagrams/27/7f5b1f586aba93fbfa7a9a48809f7f97.png)
![[Diagram]](../../diagrams/28/2280fa8378d2b226a985cf5cb42f335d.png)
![[Diagram]](../../diagrams/37/341c52f1c1ae5791f17428c229c09f10.png)
![[Diagram]](../../diagrams/15/15ac97a5bd7f5e1e0fb60cb28106a2b6.png)
![[Diagram]](../../diagrams/23/bc6971916231d5860d364ccf1cf7661b.png)
![[Diagram]](../../diagrams/19/ad74f710fec1035f88a699484a63bf16.png)
![[Diagram]](../../diagrams/47/e83bc72cbf33cbcf4019a91188011266.png)
![[Diagram]](../../diagrams/10/000e483765ca5a624e8b82c2d53c20aa.png)
![[Diagram]](../../diagrams/23/c0a8443921daea98f6b6930fccfa40d1.png)
![[Diagram]](../../diagrams/12/8632426177ece225a046540e2e651bdb.png)
![[Diagram]](../../diagrams/40/e72ad10b62696e2d8915b68687b7d5cd.png)
![[Diagram]](../../diagrams/2/0e10ba08a3262f067e51a942298162da.png)
![[Diagram]](../../diagrams/38/d2220975a09670379d9a23e9f6ab4876.png)
![[Diagram]](../../diagrams/33/bb9f95c1354f08cd203b1b58920b6d35.png)
![[Diagram]](../../diagrams/35/c3f6bb4a5a3ab1810bb6ea7423c137d0.png)
![[Diagram]](../../diagrams/35/16dc05b462c49fcaa8708e3811d8b1e9.png)
![[Diagram]](../../diagrams/28/e58e8379f4e3297bb7f46386fd0dabee.png)
![[Diagram]](../../diagrams/8/5ebedf64d536a8fa28d1f9236edf7c02.png)
![[Diagram]](../../diagrams/27/1bb3c6105ae820a02ca1721b607527ea.png)
![[Diagram]](../../diagrams/38/a34ee3885ade5a9ce4d0e1f4d420e312.png)
![[Diagram]](../../diagrams/9/ceb33fd2a1b73913234e105af931c33b.png)
![[Diagram]](../../diagrams/30/4b2b95acde8970020696ea167f372893.png)
![[Diagram]](../../diagrams/29/a8db39835eb32868ab8731d19db4062e.png)
![[Diagram]](../../diagrams/21/f7369264ef215ef20ff6fd51e99d33dd.png)
![[Diagram]](../../diagrams/15/2c3e703f8265a2d827f7a52886813664.png)
![[Diagram]](../../diagrams/47/4b93c0852233563e9bba82465909f9d6.png)
![[Diagram]](../../diagrams/7/87cd106e85ce7f54ddfd2daea501c514.png)
![[Diagram]](../../diagrams/10/052be30058b00e97bc96e848facf73bc.png)
![[Diagram]](../../diagrams/0/4124eb4a912cff7b904d3ab0edddaabd.png)
![[Diagram]](../../diagrams/46/f73289f495989821605d1d60204e136e.png)
![[Diagram]](../../diagrams/9/029a5cb29b45a29a317e1a800ccd97bf.png)
![[Diagram]](../../diagrams/20/384863e6881a0acb56ed91860160c977.png)
![[Diagram]](../../diagrams/33/9f4b67db2d11b4682fa378b2c3c4d07e.png)
![[Diagram]](../../diagrams/27/811c6da09efd32e0893768f76776dafb.png)
![[Diagram]](../../diagrams/41/7520c9f3841baa2c223079ed790d7371.png)
![[Diagram]](../../diagrams/45/c1912b47308f9aaf5a8c92e8252fa349.png)
![[Diagram]](../../diagrams/13/a8bbdbdc3cd3b3b501b584a36feb1406.png)
![[Diagram]](../../diagrams/40/1bec22cf54d62bda023e2993c85e43be.png)
![[Diagram]](../../diagrams/51/b18e53cc25b6f56dcb120369969153d5.png)
![[Diagram]](../../diagrams/42/84d4024c9eb9f11cf66bcdd1883dd647.png)
![[Diagram]](../../diagrams/48/8e092e2dc86c01d7a8cf08a4acf31b20.png)
![[Diagram]](../../diagrams/50/e73448d48873b5310b96a3b7bf562355.png)
![[Diagram]](../../diagrams/47/f904c849f087c366f79f1b83702281e3.png)
![[Diagram]](../../diagrams/50/9e7d4a397e1ebe2f433710a77f5acaa9.png)
![[Diagram]](../../diagrams/35/e04cd6779dcac01bd5372b5975c43b28.png)
![[Diagram]](../../diagrams/37/a64c3a9ade0b0812bd9adb2ca4d86c3c.png)
![[Diagram]](../../diagrams/2/b4fe1d12f8afb6e63e021d66b674de31.png)
![[Diagram]](../../diagrams/6/5ef01bdff405e1db12115d15b004661c.png)
![[Diagram]](../../diagrams/1/497a5e544ae757dc675273c7465e64db.png)
![[Diagram]](../../diagrams/22/2051aaa88c583f5eea1f741f95949460.png)
![[Diagram]](../../diagrams/19/92776d5e9b2461c88dfa170ac12ff4a7.png)
![[Diagram]](../../diagrams/49/688a4c11df34338a5a3e6e5889917cfc.png)
![[Diagram]](../../diagrams/27/878fb738b3be57bd10bfffbb77538f71.png)
![[Diagram]](../../diagrams/49/8c5c796876fe71d3e5fb70c131ea866b.png)
![[Diagram]](../../diagrams/44/24ba4f47199e12593431227caddab08b.png)
![[Diagram]](../../diagrams/34/519c43d933d1da6b2cb27a08da2533b0.png)
![[Diagram]](../../diagrams/43/688bb088e312ddc9d0520b0d55a74ad6.png)
![[Diagram]](../../diagrams/9/e888d9e9a06fdba15db8705086641237.png)
![[Diagram]](../../diagrams/25/f59873d2dfa680044ce129fd31410548.png)
![[Diagram]](../../diagrams/8/c6e75fca12b09a2f3a95c8c43d7d8726.png)
![[Diagram]](../../diagrams/26/e4754b01b546f45029bce6a84d55ce33.png)
![[Diagram]](../../diagrams/41/645c982d53a9670732a0fd494d23c2ad.png)
![[Diagram]](../../diagrams/40/723c50e2cf38f34eb1d60ddf728378ff.png)
![[Diagram]](../../diagrams/41/95dc3ed7cd2594adbbb636ecb95acd4c.png)
![[Diagram]](../../diagrams/25/612be8dc0459ca1616040124cf4f06b3.png)
![[Diagram]](../../diagrams/8/aa47c04585c3ea99a572183798b05f3a.png)
![[Diagram]](../../diagrams/40/c3ead84f295f4fc646fa381ad7841994.png)
![[Diagram]](../../diagrams/9/40b5361f43984a7faaa3258e6663f9f9.png)


![[Diagram]](../../diagrams/11/64b6be915a44d8817328fc041da49bcd.png)
![[Diagram]](../../diagrams/15/4f39882b365a2d1ae7710762ffe8e2bd.png)
![[Diagram]](../../diagrams/1/e5d723e885660acc3b86cb6cb2a4e08a.png)
![[Diagram]](../../diagrams/49/52a7eab7e4839dadb6c7b72a338210c0.png)
![[Diagram]](../../diagrams/20/beadf620ff337f562a11e2e7ad968479.png)
![[Diagram]](../../diagrams/21/d252a99f9f33328ef0ee8197548a7f5d.png)
![[Diagram]](../../diagrams/36/e2e9fe1e2121c3287a18b2162eb122ad.png)
![[Diagram]](../../diagrams/40/f9e202db5a6c4423adfd32127afcde3c.png)
![[Diagram]](../../diagrams/9/116ff9e60bc99c682c08820ab8216bd2.png)
![[Diagram]](../../diagrams/25/b42dab1e8ce13f9bc425810ebf756ddb.png)
![[Diagram]](../../diagrams/3/e2742a7778b56084a801aa940f2fb03e.png)
![[Diagram]](../../diagrams/21/908fe61d44fce0c2cb981a90f0b1e95a.png)
![[Diagram]](../../diagrams/2/9761fa1a703d7c850007bfafa05390e9.png)
![[Diagram]](../../diagrams/16/02ed1993c9e11893df8c154f2442f86b.png)
![[Diagram]](../../diagrams/41/0cdbb5bf19c47e1121e7c67a04eab8e5.png)
![[Diagram]](../../diagrams/16/7616f8ca46f9208c4b2bf9b653d8720b.png)
![[Diagram]](../../diagrams/2/e2f687cd80457da64140a215032917fb.png)
![[Diagram]](../../diagrams/24/f351f23307ab53db626dd3acae0f1e96.png)
![[Diagram]](../../diagrams/52/adee9864fb713aacdb8a7775fb933413.png)
![[Diagram]](../../diagrams/40/e6d853ec0ac962bc39f3873b0dbd4ae3.png)
![[Diagram]](../../diagrams/30/76c77d19114ccb92d6842af4c400f7fa.png)
![[Diagram]](../../diagrams/15/9efb829b2e31b3d23dc9c1c5b777b972.png)
![[Diagram]](../../diagrams/31/cb94ffe2de296e74efefc31e32317e27.png)
![[Diagram]](../../diagrams/40/a14ebdb516341b80a895dd1a4caf0bb7.png)
![[Diagram]](../../diagrams/22/abb621d0808adca44f38d1c8fda0ecfe.png)
![[Diagram]](../../diagrams/2/c991ed831ab267834fbc11bb29909866.png)
![[Diagram]](../../diagrams/39/2e9a9e43cbe0eecc8094ba1ec5e14d7e.png)
![[Diagram]](../../diagrams/27/1256cd0b45758a9d65eb6642f41b7a85.png)
![[Diagram]](../../diagrams/33/128d7e821c62b598510fa9c010b9aedf.png)
![[Diagram]](../../diagrams/47/01d4d85477a0df45c050f0a645a6c842.png)
![[Diagram]](../../diagrams/8/af28d2e05dfe1f1a2bf1176a4497b770.png)
![[Diagram]](../../diagrams/1/606acebe2f4d8f9e5027a2fda61a190e.png)
![[Diagram]](../../diagrams/10/0bbda44cce31bf6f6fe9075a04432fd3.png)
![[Diagram]](../../diagrams/41/37bcaa0346b3ec6581faa45b83adbfdd.png)
![[Diagram]](../../diagrams/20/ec70549255790a2bb7218a2051da3aa9.png)
![[Diagram]](../../diagrams/14/0f8592da024f981d45f280158800f826.png)
![[Diagram]](../../diagrams/17/1b7ad1cb07c84d25ce7075b182d7f5a0.png)
![[Diagram]](../../diagrams/16/f1df65bf154104ee222be371df968e72.png)
![[Diagram]](../../diagrams/41/ba05188f860d9b79b8c5c762b67d8559.png)
![[Diagram]](../../diagrams/22/2d331bcff80812ace397b62a415eb0f9.png)
![[Diagram]](../../diagrams/32/ccc00051ba58356e51e27363f86d0657.png)
![[Diagram]](../../diagrams/24/522c289f61a69c84f68e01b731704550.png)
![[Diagram]](../../diagrams/3/b0ce061495f8fdb78e78443a809b6c2c.png)
![[Diagram]](../../diagrams/6/513debd98cbff3d8a4133e1a5fff0827.png)
![[Diagram]](../../diagrams/4/08a95e1bff32c248556623e08c6e08c2.png)
![[Diagram]](../../diagrams/33/6409319969ce506753371c7586013880.png)
![[Diagram]](../../diagrams/9/3458a2ee002cfb75ea975d200e1832e3.png)
![[Diagram]](../../diagrams/9/094dc549c84a2aeb84889451edee197a.png)
![[Diagram]](../../diagrams/45/065d537a1c0956ef601981b77268cfc6.png)
![[Diagram]](../../diagrams/37/74b849a6522ee4e819706ad2a4bdcaa2.png)
![[Diagram]](../../diagrams/9/c0276307bb3c787a4d83cf94791aa581.png)
![[Diagram]](../../diagrams/12/d2cead04558fc3ec695b2663533798b9.png)
![[Diagram]](../../diagrams/4/197e3cbc733ea4805ac034e7172fe39c.png)
![[Diagram]](../../diagrams/4/62769868e89c2b7a5fd9fba55965a853.png)
![[Diagram]](../../diagrams/50/d692607e49309f8e0f344316683ef2ef.png)
![[Diagram]](../../diagrams/24/4178d7085ab2b349068229c3117aaeb6.png)
![[Diagram]](../../diagrams/11/b4c6cecd51541f3fd20739dc1c2d108d.png)
![[Diagram]](../../diagrams/24/d26d57013a7a6cd36718d2f1d50e0c78.png)
![[Diagram]](../../diagrams/4/894ccb7cf28aa248798a73008f7c626d.png)
![[Diagram]](../../diagrams/31/66d95fabc95b3aaed3382b343b91b597.png)
![[Diagram]](../../diagrams/7/ad3c45944e003ad1661b64a110c057ac.png)
![[Diagram]](../../diagrams/9/e9f3a0c1fbb1d3ed2ad07674409b1759.png)
![[Diagram]](../../diagrams/20/a862b0d916899bcb81948b141a18844f.png)
![[Diagram]](../../diagrams/35/c4a5c3fa72f51cc3424a243fd8f7195c.png)
![[Diagram]](../../diagrams/24/30ce310cd653b7c437d9a0e0777d3145.png)
![[Diagram]](../../diagrams/46/4635eb8bda955349a1e4c74a778c627b.png)
![[Diagram]](../../diagrams/32/d212cc44d0106b509e34059ad600c616.png)
![[Diagram]](../../diagrams/49/cae406edc8002c917ceab1cd506bde92.png)
![[Diagram]](../../diagrams/24/0b8c486e37e0a0693384e5bfdd3e5283.png)
![[Diagram]](../../diagrams/50/ba301a2e4c42c57bacfb17c7a4359cbf.png)
![[Diagram]](../../diagrams/16/00be9a6009da6c78cbabf2d702a6ea2f.png)
![[Diagram]](../../diagrams/8/03a886a8d5c71de26b2fd803feb61585.png)
![[Diagram]](../../diagrams/47/e49a05b3faa78db90f50b3450dbdb38d.png)
![[Diagram]](../../diagrams/52/88714ade33564f3c6fd5f1ee173adc65.png)
![[Diagram]](../../diagrams/29/4282ea2b8c8a273187789fa5d60aa0e6.png)
![[Diagram]](../../diagrams/22/a1b5fc40e85a0c6b8cb24b327726de11.png)
![[Diagram]](../../diagrams/45/b19f920c57d9c5d2803f28eec49052d5.png)
![[Diagram]](../../diagrams/21/a2f33a6c3d5ca29c9293ffc895beedca.png)
![[Diagram]](../../diagrams/1/a70d91db1495da8bcd4e3066b24a46b2.png)
![[Diagram]](../../diagrams/50/21458bf16945edf1d0ebef497d8d46bc.png)
![[Diagram]](../../diagrams/24/33a51c843eb2c55885d99bd8deba95f5.png)
![[Diagram]](../../diagrams/22/fa7ab2848ba54e9d56714e0c98dc63f9.png)
![[Diagram]](../../diagrams/46/e730dfe42434db16c8a8c61294eea451.png)
![[Diagram]](../../diagrams/7/90f4986241898e6d79edfb389faa6035.png)
![[Diagram]](../../diagrams/4/bcfbae82137d523d253041d9c7f4fc3f.png)
![[Diagram]](../../diagrams/29/cf9204ae6abecc12a41661981d2eb0db.png)
![[Diagram]](../../diagrams/29/ffa4404d34e25e4a5b485e3a7c2781e6.png)
![[Diagram]](../../diagrams/27/11c5ab112b8c9fc7dc5b1b6438bc4783.png)
![[Diagram]](../../diagrams/16/e1e85986959f18024e8bb72e64954b70.png)
![[Diagram]](../../diagrams/0/2057a0139c1b4c4ef62d08fd349213b8.png)
![[Diagram]](../../diagrams/9/17d5c052dabc92b680c74294ce8082aa.png)
![[Diagram]](../../diagrams/28/62f47b10ea2d33d3584c3787b304d67e.png)
![[Diagram]](../../diagrams/30/e5f9be53c27606267f698e6a863081fb.png)
![[ext]](http://img53.exs.cx/img53/5865/goblood9aj.png) http://img53.exs.cx/img53/5865/goblood9aj.png
http://img53.exs.cx/img53/5865/goblood9aj.png![[Diagram]](../../diagrams/24/94635461557bc693ac1e695486af91bd.png)
![[Diagram]](../../diagrams/8/48bce9abf30e88396356b034f1e2e37e.png)
![[Diagram]](../../diagrams/13/67a0cd597f30008153b94d6dc15e2fc6.png)
![[Diagram]](../../diagrams/21/0de4cd374abcf785fea4a933afb3593a.png)
![[Diagram]](../../diagrams/29/e4a19e6b41411cb1b9a5edd90a94bbbc.png)
![[Diagram]](../../diagrams/35/198713e0e31873518cb674d47e6eb410.png)
![[Diagram]](../../diagrams/32/1afe18f635f2f96f98e918fd33c78a76.png)
![[Diagram]](../../diagrams/26/bcf405d9891bb11bb7a086f6ead7c057.png)
![[Diagram]](../../diagrams/32/ff8d24ddae385477cf97fe3bab3c0170.png)
![[Diagram]](../../diagrams/48/f78a81e3a72add3329340e6882c3d0c0.png)
![[Diagram]](../../diagrams/45/412edf53222aa303e72be0cb8b0b26d9.png)
![[Diagram]](../../diagrams/2/43295d379fba900e60623335ea29db8e.png)
![[Diagram]](../../diagrams/11/d9519b89bd61714dbc5831792b6c6e9e.png)
![[Diagram]](../../diagrams/23/e044adec99ec33c8b5464c00a05ce8e0.png)
![[Diagram]](../../diagrams/0/c21f6826229335b7c764db181f48391b.png)
![[Diagram]](../../diagrams/14/1e4abb9d85a458740164f2ad5c0f6cf3.png)
![[Diagram]](../../diagrams/33/ae41e3f0fe9fc55ceed11aabbc144482.png)
![[Diagram]](../../diagrams/34/382b195eb0ab59667e0c57db2a9c1b8a.png)
![[Diagram]](../../diagrams/17/09d41c3ea90240829df6ff62e43c592b.png)
![[Diagram]](../../diagrams/8/6586824eac63d453f97ac6d3d0ad90c1.png)
![[Diagram]](../../diagrams/51/0f4707c59578a334a1c60bf59d4d3a7b.png)
![[Diagram]](../../diagrams/32/458e00a92d4317448d2fc2b1743ced01.png)
![[Diagram]](../../diagrams/24/9d4e21d4fe4d7c65eb58d19771ac5dfe.png)
![[Diagram]](../../diagrams/13/97df6a115e4c346107398f9e60d9e74a.png)
![[Diagram]](../../diagrams/12/5cddf906ece477988a0f5415d733ba3d.png)
![[Diagram]](../../diagrams/48/c90f9ab5da5021fa281348c0d069e3c5.png)
![[Diagram]](../../diagrams/33/1fa58e2690e11510b2e568e1bbd4fac0.png)
![[Diagram]](../../diagrams/5/0a976bea65febc243dee90d87690ea54.png)
![[Diagram]](../../diagrams/11/ad9c0f7d885e77c2bb5cb60374b0c112.png)
![[Diagram]](../../diagrams/39/2ac4c9dc3168e7a5f33fc2bd7afd2ef6.png)
![[Diagram]](../../diagrams/22/c37694188761c4bfd0a28fdcb72d6c16.png)
![[Diagram]](../../diagrams/43/1948a98c0083d3830f795ce4d8e89513.png)


![[Diagram]](../../diagrams/45/0ddc9d5c0fb96634e61257178686f953.png)
![[Diagram]](../../diagrams/14/f886402e8de24ab4c34e7fffa626df89.png)
![[Diagram]](../../diagrams/22/dcc8a6d6f3e2daca67bcac17ffcb873e.png)
![[Diagram]](../../diagrams/4/2d055d9aec824d039190e7a3491f6775.png)
![[Diagram]](../../diagrams/1/8208c888082f22be58c61b2a31a1d1c9.png)
![[Diagram]](../../diagrams/45/b9e2678e9dae01fdb1cfc98445050352.png)
![[Diagram]](../../diagrams/3/f8088ed1e4184899b403e2722cda1493.png)
![[Diagram]](../../diagrams/47/b9992cd6e90fd744c0a713d14a48139d.png)
![[Diagram]](../../diagrams/2/3957f49c5442d7f5ddc1a54c9ef1031b.png)
![[Diagram]](../../diagrams/23/d86e53dffbca5076295c4848599fbf44.png)
![[Diagram]](../../diagrams/23/162ff0474ac7c97af135d4e4f26478d8.png)
![[Diagram]](../../diagrams/20/397ac552cd8723b8f03c359a621355b0.png)
![[Diagram]](../../diagrams/25/0b3c83b9c1db63d1b1757bd5d8b114ef.png)
![[Diagram]](../../diagrams/48/a02aa86865661584d375cd07554cf2e0.png)
![[Diagram]](../../diagrams/11/51179a529a2be98035b181d0d7149f8c.png)
![[Diagram]](../../diagrams/26/b1404f262618b8f51b0b2e0d574e6815.png)
![[Diagram]](../../diagrams/43/a68f32fbb3886fdde58838b9c206c2f4.png)

![[Diagram]](../../diagrams/22/dd1e545a855768749fb595f9fc2a906f.png)

![[ext]](http://www.webone.com.au/~nikkiw/shusaku.jpg) http://www.webone.com.au/~nikkiw/shusaku.jpg
http://www.webone.com.au/~nikkiw/shusaku.jpg![[Diagram]](../../diagrams/3/4dcdeb0dd35e54dab6864c9bfdb9e950.png)
![[Diagram]](../../diagrams/13/68c1aea5fcf15b9e08a2019ba6a8a578.png)
![[Diagram]](../../diagrams/1/2199a6b131355cffb882e6187328f518.png)
![[Diagram]](../../diagrams/23/8d947fd4514c4f0d01da0320fe724f29.png)

![[Diagram]](../../diagrams/3/6459c48a0f204f8b4f0c1bc5e8d9737b.png)
![[Diagram]](../../diagrams/8/8a920921d253a4e7bf6a004866a6710d.png)
![[Diagram]](../../diagrams/50/8a17f27db5732de378fd8b809a4ce1aa.png)
![[Diagram]](../../diagrams/45/b22754ea0675afd9f69ae2f1790ae118.png)
![[Diagram]](../../diagrams/19/16447dbb79e465bedae1dab774429140.png)
![[Diagram]](../../diagrams/16/a5a7b3baab4defa0ef23a7f9216d857b.png)
![[Diagram]](../../diagrams/2/8e44916089ad8d6aae2b7071e9a2d115.png)
![[Diagram]](../../diagrams/51/fe98fb172b87da9938e4648b73bb41f8.png)
![[Diagram]](../../diagrams/0/37553a64183a2e36ff077e8687454442.png)
![[Diagram]](../../diagrams/25/d4424705059c325384ef2440ea0739e5.png)
![[Diagram]](../../diagrams/40/b246ecbda587114e30ffe8bdfcfceb6e.png)
![[Diagram]](../../diagrams/21/108f8062fbe2e9b6db297c61eaaf37b9.png)
![[Diagram]](../../diagrams/21/8b6fe3a7c5773f2750318db5e9b6f34a.png)
![[Diagram]](../../diagrams/49/21660dd3fc04e8fbcf1bb4832f416539.png)
![[Diagram]](../../diagrams/2/fcba4c0a92ba466afb53b691f882b805.png)
![[Diagram]](../../diagrams/13/2090b75620bfaf3f9ddfde5655987a32.png)
![[Diagram]](../../diagrams/9/7e4670b3fde852996c6dd95a79169893.png)
![[Diagram]](../../diagrams/39/2b35cfc4795d989af8c5d82f1e471f30.png)
![[Diagram]](../../diagrams/37/31676a66a6d2b8509bc79b6438eb8aab.png)
![[Diagram]](../../diagrams/2/3d205dc010a97e25caba57e4a290e3e9.png)
![[Diagram]](../../diagrams/44/9769df340162de35259d3cf994b3a313.png)
![[Diagram]](../../diagrams/36/018f48cd79820586049222d3afbed481.png)
![[Diagram]](../../diagrams/37/9a8a9be9893a2edb9cbd90474fc7488c.png)
![[Diagram]](../../diagrams/23/f853154fab1fad10d8a7389e111ae7c5.png)
![[Diagram]](../../diagrams/45/383c9a2155a1998167f903129dc41e15.png)
![[Diagram]](../../diagrams/39/0e38ad3e8d7f41bead17422624b49338.png)
![[Diagram]](../../diagrams/26/7657f5647832a5b7f97d0d2613980f7b.png)
![[Diagram]](../../diagrams/17/df407febb2e9e14a1c7fe085659faf71.png)
![[Diagram]](../../diagrams/50/4420e4f6cca127cf83d97bef0748cdf9.png)
![[Diagram]](../../diagrams/40/e7b4ee45296ae65c4551d7de948a2588.png)
![[Diagram]](../../diagrams/17/5090b1453f993640febd55dd318e70cf.png)
![[Diagram]](../../diagrams/50/7ae9bcafed9827de3378b19cddb75cb7.png)
![[Diagram]](../../diagrams/23/3f2d6ebcf8d421006e7de0bac72b266f.png)
![[Diagram]](../../diagrams/24/bf8d349d8db4e967980e0718bdf730f1.png)
![[Diagram]](../../diagrams/51/7d21560d6014a3fe9b55778fc93cb029.png)
![[Diagram]](../../diagrams/24/227b9f6475515f2dbc795cd3bf9aa65e.png)
![[Diagram]](../../diagrams/44/1c36b496dd8ff82fd00175914e5b3226.png)
![[Diagram]](../../diagrams/46/7bd2c0ec2800c9d9051b34769be87fce.png)
![[Diagram]](../../diagrams/32/b0f77af26659dc9cb542b8acda8a66eb.png)
![[Diagram]](../../diagrams/29/5cf5f82597785c18f0a0342b78dba82e.png)
![[Diagram]](../../diagrams/4/d6f62698937dfebb956abe9659cddb9c.png)
![[Diagram]](../../diagrams/9/89bba2e0cfe506da0ec70c36646a8c91.png)
![[Diagram]](../../diagrams/22/fd1ceddfa57a8322d2e644781a9f41e8.png)
![[Diagram]](../../diagrams/16/b2fb262c7f7e84b925ae4249024a1505.png)
![[Diagram]](../../diagrams/2/48a5ecf26d420ebe5767ad4139c38821.png)
![[Diagram]](../../diagrams/13/656b4e2658e8a2639fb70ddb358ead33.png)
![[Diagram]](../../diagrams/27/647c3b4294e924462e5eb4dcc4551cb0.png)
![[Diagram]](../../diagrams/5/14974aeb3c258720a7b3c3df97a113ad.png)
![[Diagram]](../../diagrams/3/beb0ebd4a234c8f0cb3e50cc1ed01af7.png)
![[Diagram]](../../diagrams/50/27ec5c92aa5a475836f43dcbb592a26c.png)
![[Diagram]](../../diagrams/6/4ca2d9b9aed62960559fbdf1bf3da115.png)
![[Diagram]](../../diagrams/12/515faf38c0aaaaded9f8aec83f1d10be.png)
![[Diagram]](../../diagrams/14/d6f02c5c0fc3f2729ea356963ee6ebe9.png)
![[Diagram]](../../diagrams/9/a96191b60f465ea01d2b153db12bfc16.png)
![[Diagram]](../../diagrams/30/66ac9f176e5f3e0e97267dcef65724aa.png)
![[Diagram]](../../diagrams/17/22e08a3aa53ad9647f7b578d979abd09.png)
![[Diagram]](../../diagrams/31/6b8b9491854ba7995a7f9b88cbeffa38.png)
![[Diagram]](../../diagrams/2/9d377ed3ba9f48c549a71fa14cba0c3e.png)
![[Diagram]](../../diagrams/29/e0c032f716cb9d3c4f4b8b0fb14573f4.png)
![[Diagram]](../../diagrams/52/ae92eb38f13ab9730ed5046a82eb974c.png)
![[Diagram]](../../diagrams/5/baa6828feae302be346605348b2ff632.png)
![[Diagram]](../../diagrams/30/5b793c749d20701202e807382fe6cbcd.png)
![[Diagram]](../../diagrams/13/6a6b20217c5ca8c63629530cad24505f.png)
![[Diagram]](../../diagrams/14/da7d9bf5a69813e29c49ca088fd00b20.png)
![[Diagram]](../../diagrams/23/a8889940b471748ee80f87316dcd7ea6.png)
![[Diagram]](../../diagrams/27/8e549d32e53ffafb097447ebe5830148.png)
![[Diagram]](../../diagrams/48/a2304cbacc5533ca92113ae03070cb56.png)
![[Diagram]](../../diagrams/35/b766c184330828055c17d9e963c93d18.png)
![[Diagram]](../../diagrams/49/917e3b26bdb5941961b8841a8ada423b.png)
![[Diagram]](../../diagrams/20/5b575ed0c8129b5ecd1cededd65536d0.png)
![[Diagram]](../../diagrams/49/87fd1d9f656871dbfcaf27746d7e94fb.png)
![[Diagram]](../../diagrams/28/a6612deee71943726efd0a53a9babee3.png)
![[Diagram]](../../diagrams/2/599c438b21b342a10b3217acfa6c19cd.png)
![[Diagram]](../../diagrams/18/2e51ae4fe962acecf3dc9f207a897d1c.png)
![[Diagram]](../../diagrams/43/99ecca2c1daf8c59cb3bb9c93837dfb0.png)
![[Diagram]](../../diagrams/41/0bdd4ba4c0b4847f1c4f75247e1c86a2.png)
![[Diagram]](../../diagrams/8/83549781ce849715130f23771e268a97.png)
![[Diagram]](../../diagrams/9/bc1aeefc1920591ff4a0b9102af233bf.png)
![[Diagram]](../../diagrams/23/65c288d42c29feb8b946e944d0bd7e64.png)
![[Diagram]](../../diagrams/49/185902249fa0be3e009e1c89bd7920e1.png)
![[Diagram]](../../diagrams/44/c410f27c73af6aa2d808e10350f5b23b.png)
![[Diagram]](../../diagrams/13/9ce02b5c9fa2ec1d54c6f581b95de87b.png)
![[Diagram]](../../diagrams/21/7f4657b9767e3c66106778c31a13d4db.png)
![[Diagram]](../../diagrams/22/cb513df8d0d5b4554518cce3bba1e3fe.png)
![[Diagram]](../../diagrams/22/9b24e09f660fb85a6381ae5b0d414a75.png)
![[Diagram]](../../diagrams/18/a5e72eb9f901808fe8ae666d84a9ca11.png)
![[Diagram]](../../diagrams/29/44a3cdf15ac40061756069f3c378b284.png)
![[Diagram]](../../diagrams/41/a7498eb6eebe4bd51a99c84661bf2546.png)
![[Diagram]](../../diagrams/1/576fcdff9c54f101c300ef5dae90d445.png)
![[Diagram]](../../diagrams/17/637164d88dd384c5d753ac8e0ab5141c.png)
![[Diagram]](../../diagrams/39/a7fceada291f84f4c069c8a738b90632.png)
![[Diagram]](../../diagrams/44/110ebc7e67d83bd1c0a8463378fc2972.png)
![[Diagram]](../../diagrams/43/7ecd966c663ec3720ef746be369068b2.png)
![[Diagram]](../../diagrams/1/c6768fa2af1da698e83f45fe579b3de0.png)
![[Diagram]](../../diagrams/27/ac3916ccd95e9f2c06ad4a9c7ece8d3b.png)
![[Diagram]](../../diagrams/15/3c0d90732abe1805eeaaa0f752a4d1f3.png)
![[Diagram]](../../diagrams/36/32ee773953b98d5875c2554cda7c4b4a.png)
![[Diagram]](../../diagrams/32/54dc6f369f0bd1e9595d20bc05203391.png)
![[Diagram]](../../diagrams/3/8ab4f2163261f5dae4107a792e63ab10.png)
![[Diagram]](../../diagrams/51/ffc1d022b8e5bf6eadb9c84e066373a6.png)
![[Diagram]](../../diagrams/34/b94692207dce1c064760c9980d98544e.png)
![[Diagram]](../../diagrams/48/1a79e8e46688743e6b24a314017e83dd.png)
![[Diagram]](../../diagrams/28/77626bd4289f86ae3b051567301023c2.png)
![[Diagram]](../../diagrams/37/b8642a21ca15bacb3a3cfd6f1dc5e60d.png)
![[Diagram]](../../diagrams/23/4fe974566ac6463f4e3b8a521d19303b.png)
![[Diagram]](../../diagrams/2/79011ad5787b261d37266bc35db9670d.png)
![[Diagram]](../../diagrams/3/928b3c7e0043af76fff099dc33e584db.png)
![[Diagram]](../../diagrams/31/7ac1ba9a829dd56fe71178adda69df52.png)
![[Diagram]](../../diagrams/1/110bac8224410efdf20f26c03341c502.png)
![[Diagram]](../../diagrams/33/8dfc209484ed53048849fce1f6a18f28.png)
![[Diagram]](../../diagrams/42/c28d659b9e10ddf56f27db6502d7666e.png)
![[Diagram]](../../diagrams/6/055a594aa1e7178da4485cfb639cd4b2.png)
![[Diagram]](../../diagrams/43/af4713f82a8605af2b6f23aa7fc290ab.png)
![[Diagram]](../../diagrams/51/2856c431a23fc92a0bb7edb8577038ce.png)


![[ext]](http://gobase.org/games/pic/ki000013.gif) http://gobase.org/games/pic/ki000013.gif
http://gobase.org/games/pic/ki000013.gif![[ext]](http://www.geocities.com/wwwdrago/Images/ExportPosPreview.jpg) http://www.geocities.com/wwwdrago/Images/ExportPosPreview.jpg
http://www.geocities.com/wwwdrago/Images/ExportPosPreview.jpg
![[Diagram]](../../diagrams/5/bbf9109c43eccac72fa5cec8a29fa6e7.png)
![[Diagram]](../../diagrams/3/0b21b95fd55dd5b7c86e7589ecc8a626.png)
![[Diagram]](../../diagrams/28/67a964b9337e24969b67079d2a6cfe24.png)
![[Diagram]](../../diagrams/23/db965ab3af4bd8cf64dc638c840e4511.png)
![[Diagram]](../../diagrams/17/5b19bd916f3d330a41793d09c5fb0707.png)
![[Diagram]](../../diagrams/13/8240ebfd28a280b9422b73bd689d1823.png)
![[Diagram]](../../diagrams/43/98aa9b200425174e08edf9ae05c7edf5.png)
![[Diagram]](../../diagrams/10/72bcafc0bc17c797521ae6c6cd4cc5ab.png)
![[Diagram]](../../diagrams/33/551f222707e2b767ad1ecb36ed693cce.png)
![[Diagram]](../../diagrams/36/bff0f94c03779fd9aa78ef9f1ce61f76.png)
![[Diagram]](../../diagrams/9/7ea37986b4d85e86b4a7a5ebd4eef752.png)
![[Diagram]](../../diagrams/15/dbca512a0f72da6853bd89278ed61274.png)
![[Diagram]](../../diagrams/49/a413adf2652f96e8279799d562a3da2f.png)
![[Diagram]](../../diagrams/24/0def855a01a4a7f079618c8e3dca421e.png)
![[Diagram]](../../diagrams/43/681489612357a908ed85932835424ee0.png)
![[Diagram]](../../diagrams/14/f81fe779a225895df68bfd66cc3a9e7e.png)
![[Diagram]](../../diagrams/25/145c7348897932e5ae4aa73e18e979d6.png)
![[Diagram]](../../diagrams/27/0d919d75d236952c4e46f4ac407df6e9.png)
![[Diagram]](../../diagrams/11/fb1a8c8efecd6354178688d62a642770.png)
![[Diagram]](../../diagrams/17/3f668024e69fcf003ac67a0ba5b99fa7.png)
![[Diagram]](../../diagrams/42/51c02005d917e5eaddfe62215a37fa6b.png)
![[Diagram]](../../diagrams/27/9cfbe682519e8196afcb447d566b15b5.png)
![[Diagram]](../../diagrams/45/92e157887075749ae74a39ab46550690.png)
![[Diagram]](../../diagrams/6/d50353e093b3fc3499612e75c4481327.png)
![[Diagram]](../../diagrams/9/c5b7840f822e7d0d29e960cec17aebe8.png)
![[Diagram]](../../diagrams/43/6df1bb79d0ee64d29a7e4494df6aaafe.png)
![[Diagram]](../../diagrams/52/c3db2f96bfda62a192c43dc3d7b36535.png)
![[Diagram]](../../diagrams/5/cd25dc752c936e2f5bfcc32e58a9fe26.png)
 Version: RSS 1.0
Frequency: every other hour (suggested)
Validate:
Version: RSS 1.0
Frequency: every other hour (suggested)
Validate: 
![[Diagram]](../../diagrams/33/553fea61bb5d82d687d6a0b38ca83a45.png)
![[Diagram]](../../diagrams/42/18af7adecb617f569675b4245be4c10c.png)
![[Diagram]](../../diagrams/49/3db2816cc1c0010a0119789cd6fc7abb.png)
![[Diagram]](../../diagrams/35/00aef466f02cf3e67a87250d576bde45.png)
![[Diagram]](../../diagrams/40/482da0bfefb363719f0794d8ee43fed0.png)
![[Diagram]](../../diagrams/36/351771119ff5c2ab1221f0de9b89f9b2.png)
![[Diagram]](../../diagrams/44/4f14260b94aa70a4969a31439036f164.png)
![[Diagram]](../../diagrams/25/6a6c4111543c7311163c1dd27c270879.png)
![[Diagram]](../../diagrams/28/ecf6649eff49f332816fd13e026d8675.png)
![[Diagram]](../../diagrams/25/0c8442aa17ebb829bda3e5cd89d5063b.png)
![[Diagram]](../../diagrams/4/a275cdf4efa8227d8ace11a8beadd7d1.png)
![[Diagram]](../../diagrams/30/a3ecbc178358247c855cf4e001caa1ec.png)
 Small board go is go played on a board of size smaller than the standard 19x19
 ![[Diagram]](../../diagrams/40/343c0bce2ecc3f7fc558e93771d3a18b.png)
![[Diagram]](../../diagrams/26/cdf1b08279975b58a83253f27bbc6aae.png)
![[Diagram]](../../diagrams/27/7073e27cf018b212c7314be4e0be2176.png)
![[Diagram]](../../diagrams/19/97e8175ff7e25501efda756558a23b2c.png)
![[Diagram]](../../diagrams/52/88c9af86be6557acd20081c51fa04bd1.png)
![[Diagram]](../../diagrams/32/9ee7b94d2323a74bcee93b315312f265.png)
![[Diagram]](../../diagrams/40/026255d58cc40cfab348571716a65352.png)
![[Diagram]](../../diagrams/9/162ef3be2b9a3d91bd5b869aa0d1013d.png)
![[Diagram]](../../diagrams/4/ffcee25307e55c7ee4388901fb472c7a.png)
![[Diagram]](../../diagrams/22/177b88b6b60162a79a8ae2c2fa1eb0d8.png)
![[Diagram]](../../diagrams/22/bd98c644848c901697c83ca77cb9e29d.png)
![[Diagram]](../../diagrams/31/687e983fa1dccf30506cb9c1e82e7248.png)
![[Diagram]](../../diagrams/46/ff2606a4aec2ee3944475f3b356edb92.png)
![[Diagram]](../../diagrams/31/d46ef59e67abc5817efc7d64de828025.png)
![[Diagram]](../../diagrams/38/bf4506909a5bcaaf96f0d99ffc9ccbde.png)
![[Diagram]](../../diagrams/25/8ac6916ae37f6a46117dc29ded9867b5.png)
![[Diagram]](../../diagrams/30/e453c766254483ec51cf7c6da386499b.png)
![[Diagram]](../../diagrams/42/7b0151ef20027b246b76100e7609a4db.png)
![[Diagram]](../../diagrams/6/95cb26b479c0b350b0660a44ec17413f.png)
![[Diagram]](../../diagrams/35/547a7e68929eaaa2b5abb80bb8673a83.png)
![[Diagram]](../../diagrams/37/ce891cb5f6ac121013a7f11400383040.png)
![[Diagram]](../../diagrams/49/ed8505ec25a7dec94d84def5583319af.png)
![[Diagram]](../../diagrams/42/46b5bbb5a53ff407e218cff1e2ba6581.png)
![[Diagram]](../../diagrams/39/862943bab57d70ab2fc57cd44d46112d.png)
![[Diagram]](../../diagrams/39/92d3e552cc42fd58ae88c62e1646d9dd.png)
![[Diagram]](../../diagrams/38/cc2740feb94028ef982fb4e6a2ba2d9f.png)
![[Diagram]](../../diagrams/52/3a0a37f60b274b04a363a3fbb4a81015.png)
![[Diagram]](../../diagrams/17/6efc4f18258d453141cdeac66c8fdeda.png)
![[Diagram]](../../diagrams/19/13efd655b73b1429c3c5085215383262.png)
![[Diagram]](../../diagrams/17/026641e404ba46dc6603fa7860843791.png)
![[Diagram]](../../diagrams/4/31a9af8df83851c1e5574147570b2893.png)
![[Diagram]](../../diagrams/8/65bd095f99c207947bb4119152d4f99d.png)
![[Diagram]](../../diagrams/36/78134e11ee8d8d3f477a3d8fee63d33c.png)
![[Diagram]](../../diagrams/14/3b14e92ddb4bc4f6bbe5d3214a4c8edc.png)
![[Diagram]](../../diagrams/15/d01525227faa9124923ae2fb27be313d.png)
![[Diagram]](../../diagrams/35/85849283711cc58d2c966f6dac48ff96.png)
![[Diagram]](../../diagrams/22/75235f9578a26cf91a4c2a5e0466da90.png)
![[Diagram]](../../diagrams/28/056d8df2f8fad9667e9a25c5bb6b745f.png)
![[Diagram]](../../diagrams/12/6ff62384fff6f0192f3c2cc0598208b2.png)
![[Diagram]](../../diagrams/18/b523489bad0a1f965d9776cd15464acf.png)
![[Diagram]](../../diagrams/38/a934711d43c65d9594dad97bd44f74c3.png)
![[Diagram]](../../diagrams/18/f8d7b6afc2f6f75f0a5dcb795c8fc12c.png)
![[Diagram]](../../diagrams/27/10cdad4d1339412f695ff3cc5fbac414.png)
![[Diagram]](../../diagrams/22/8e46c139d86e922b280e0214496d827e.png)
![[Diagram]](../../diagrams/25/4730e70c69cd21848ce0067164bf495d.png)
![[Diagram]](../../diagrams/48/87e0c3fb8781896fea4c88c1ae0a388c.png)
![[Diagram]](../../diagrams/41/56d56e713aa80fb81ea37c1efe9d86c9.png)
![[Diagram]](../../diagrams/49/7e565beb3b9b85daf703d6f11216c2d4.png)
![[Diagram]](../../diagrams/52/a1b6eaa7e77946261a9dca2878a5f0f9.png)
![[Diagram]](../../diagrams/12/b62faacaefa0dc9ceaddbd88ef071534.png)


![[Diagram]](../../diagrams/9/0bf4052c8ff6e2c2c01364304d043363.png)
![[Diagram]](../../diagrams/46/1c576c0783395e8180cf0088c8ae9e93.png)
![[Diagram]](../../diagrams/3/0d5894f07e442df2d2a1bad30d6c70e2.png)
![[Diagram]](../../diagrams/32/b382603fc701c4d698c7d458092b2a40.png)
![[Diagram]](../../diagrams/47/bc9cdf7b22ef5986f0da222ef3b9e24e.png)
![[Diagram]](../../diagrams/16/868e499707452849322d2cf144173c03.png)
![[Diagram]](../../diagrams/42/acbe1fa3a3775fe3130c8f3841a73ce1.png)
![[Diagram]](../../diagrams/26/fc049c0d4fee4a82f4e77c08b0af6bfd.png)
![[Diagram]](../../diagrams/28/6487810d61626b289d8519a6997f8e55.png)
![[Diagram]](../../diagrams/7/d9194c8ff04eacde4e21af232ef1b234.png)
![[Diagram]](../../diagrams/51/18ff3a95389fccd96c1ff5f7e6eb0c2a.png)
![[Diagram]](../../diagrams/38/9fb96fb1a3955735cba783caaa9f1603.png)
![[Diagram]](../../diagrams/52/362e2744304e4f53dd6e42fea6ce0a91.png)
![[Diagram]](../../diagrams/11/195fef3c961aca339ea8d0322af3b255.png)
![[Diagram]](../../diagrams/45/bfb92cd4743cc04adf571a2a04c26803.png)
![[Diagram]](../../diagrams/51/36c944d28d52ceb8f342d4698e4000de.png)
![[Diagram]](../../diagrams/41/bc1d674d26eb178ff98f6c81e2b6c5d3.png)
![[Diagram]](../../diagrams/15/a150a929b64d9e27b024c51a12909b43.png)
![[Diagram]](../../diagrams/39/de04e059064e4f64cae2425fd01b9dfb.png)
![[Diagram]](../../diagrams/17/9c5bab7a0aac1e2c5a56f11661434286.png)
![[Diagram]](../../diagrams/51/0cc044537372ca5f894edb75d4e5b2aa.png)
![[Diagram]](../../diagrams/20/7cc7abbafd8e0834ff94089fe3b9432e.png)
![[Diagram]](../../diagrams/5/8be62f25df031a6eebac054e7188f893.png)
![[Diagram]](../../diagrams/19/3a9703298067a534aa59e0b2299f26b9.png)
![[Diagram]](../../diagrams/51/4978c93947ac05eaef03ba22c55a0c7c.png)
![[Diagram]](../../diagrams/43/7aca55873402b3750100e694d4c13aa2.png)
![[Diagram]](../../diagrams/26/09b1bc33f292bf2d77276b0f0a3d9f25.png)
![[Diagram]](../../diagrams/17/49b7943d1ea34ce43c7d425cb7dc899c.png)
![[Diagram]](../../diagrams/42/1412b1d6f2356c1d397e26a3608468ba.png)
![[Diagram]](../../diagrams/22/dc2a5a264491bb12bdae6181ab3bd5b6.png)
![[Diagram]](../../diagrams/34/13bc13bddfaa372b476a1f0eb479ba75.png)
![[Diagram]](../../diagrams/29/82c285112f3b9e7cc0a694de95a87c0f.png)
![[Diagram]](../../diagrams/27/6e751bf67855674a693177c4f67260a3.png)
![[Diagram]](../../diagrams/15/6beb0db3d2d0702d4f368e9fea1bf468.png)
![[Diagram]](../../diagrams/12/bc20b40839d3dd2af97a036aff0bc18c.png)
![[Diagram]](../../diagrams/34/562a45fbba1a816f94a1e1fca759df51.png)
![[Diagram]](../../diagrams/26/92600b670addf9c81cfa0d3a4f06515a.png)
![[Diagram]](../../diagrams/17/65c11f5b6d77b8ae0a03fc69a3f6038a.png)
![[Diagram]](../../diagrams/27/a3a5fb210597659219c3f99ab31b8270.png)
![[Diagram]](../../diagrams/31/df84848e96f59ca8c0ba0c2ee4764243.png)
![[Diagram]](../../diagrams/42/a1dc661252aa3e7049794fc7bf78997c.png)
![[Diagram]](../../diagrams/41/13f4a0fbcd9420f08208c8ff455c5e07.png)
![[Diagram]](../../diagrams/26/85c5ff205df8558dfeeea724ecc1b691.png)
![[Diagram]](../../diagrams/26/94ca13d277f7549db9d8149937f38a8c.png)
![[Diagram]](../../diagrams/52/0825bddcc387704ed74afccc6e8e0616.png)
![[Diagram]](../../diagrams/51/7c618f958cc5cb9b4e6d4cc1b77528a4.png)
![[Diagram]](../../diagrams/39/29b52c7045f0582e32656277a8837fb7.png)
![[Diagram]](../../diagrams/8/6ed834ea0dbfb88c168d38a22357f0a1.png)
![[Diagram]](../../diagrams/30/a1b6d2da01780ef455210bb0b0175d23.png)
![[Diagram]](../../diagrams/20/6eb6ae60473bb83c7c60b43b5a7436da.png)
![[Diagram]](../../diagrams/30/f9a70e3e9369d2b06711feeea16530a3.png)
![[Diagram]](../../diagrams/4/e20070b32468d3d48628b262b3a34e5e.png)
![[Diagram]](../../diagrams/25/be9c6613ce8516c6cfb5bbdec320c0a8.png)
![[Diagram]](../../diagrams/14/0e31306904c012196f2d13c69bc0b775.png)
![[Diagram]](../../diagrams/32/a7fe562b7e43153727cf305c08adc388.png)
![[Diagram]](../../diagrams/39/42ef7281c2bf899e1913fb225f984792.png)
![[Diagram]](../../diagrams/33/8566267c5b83764852c0ca7e07ee40cd.png)
![[Diagram]](../../diagrams/14/8bec956c428ea0d738cac5e1f0d05d96.png)
![[Diagram]](../../diagrams/24/c84873b7ba79d8c5d07a22b82959a76f.png)
![[Diagram]](../../diagrams/12/5eb360c28cf4d4b9ab9f41ac07475a1d.png)
![[Diagram]](../../diagrams/49/a10a2a102fe1906603838cc72a78f508.png)
![[Diagram]](../../diagrams/8/2ae6b2273b2366ec4a6a6edaf45675a1.png)
![[Diagram]](../../diagrams/2/574137729c766447419981bff937b8f9.png)
![[Diagram]](../../diagrams/28/75fd853b1da1174e4ae6018ffaf22fc8.png)
![[Diagram]](../../diagrams/18/c0b05121a9b3983dd9aa9093407bab5b.png)
![[Diagram]](../../diagrams/27/8156acb9dc0e37ac7a88d7f7f97b4c88.png)
![[Diagram]](../../diagrams/11/3fe42a05d40d14788a1071486684d10a.png)
![[Diagram]](../../diagrams/33/83d9ea56a089c51599330d3104d43cf5.png)
![[Diagram]](../../diagrams/35/3cdd4c9f43ffcccb5d0c394b0caf0098.png)
![[Diagram]](../../diagrams/50/ae9be24ae28c7ab95cc3f5570ae0c2cd.png)
![[Diagram]](../../diagrams/30/91adc959bdeef9f00dd6646b86e762c9.png)
![[Diagram]](../../diagrams/32/31ebeb0f3157faf2a7fd59954684e504.png)
![[Diagram]](../../diagrams/23/8ab9101e0482bc29db1aab97de11b2a5.png)
![[Diagram]](../../diagrams/35/f836d932badc36378face38d7b6f6cc5.png)
![[Diagram]](../../diagrams/25/21791c6cff538bae2964fff269ea7727.png)
![[Diagram]](../../diagrams/24/4d1be97249d025cc58f1b0a480b62e79.png)
![[Diagram]](../../diagrams/35/d633ea23b655ab74c7292cea97c8550e.png)
![[Diagram]](../../diagrams/33/cb139121796db6ceaccb4f7b15f5dc75.png)
![[Diagram]](../../diagrams/51/30adedc24027f31ab476887954eb31f6.png)
![[Diagram]](../../diagrams/25/363a0f0d563d0b88ecc86e3556ea27c3.png)
![[Diagram]](../../diagrams/11/f3415d1ca635495d43ea9c3781c81503.png)
![[Diagram]](../../diagrams/20/dcbd5ac6a520f402189ad1797b5fefdb.png)
![[Diagram]](../../diagrams/17/ef50c41f05a74fd760267bc85c6604fb.png)
![[Diagram]](../../diagrams/12/f71b297440dc88c09428757438ad1767.png)
![[Diagram]](../../diagrams/37/2e4e8c9d6a8dd4fce7c743d237158abc.png)
![[Diagram]](../../diagrams/48/0c03a92d5c874490845a888a500b6989.png)
![[Diagram]](../../diagrams/45/1737bd32b5e46293cabeea5b67552065.png)
![[Diagram]](../../diagrams/18/04752c108a60e13bed81a5f3fe637a62.png)
![[Diagram]](../../diagrams/15/b7c0a4eb525e42a6c84394da007072d3.png)
![[Diagram]](../../diagrams/47/9a23c6875496107422791ee9e23d2b20.png)
![[Diagram]](../../diagrams/27/a9dd220a00b61b69560ef320324e2ac1.png)
![[Diagram]](../../diagrams/40/2ef3f48b4f3750114cc791ded1146ffc.png)
![[Diagram]](../../diagrams/39/40bfbd520ec8ad246ebbbc004fededf9.png)
![[Diagram]](../../diagrams/51/59177134f0e66671ee215c08464b9dd6.png)
![[Diagram]](../../diagrams/3/7d132dfc5cff2ef53ce0798aa2112a4b.png)
![[Diagram]](../../diagrams/4/8c4d598f681019dbbde3a5b314f9db87.png)
![[Diagram]](../../diagrams/35/d988e6ef15fafde295eaa470e9ca8da3.png)
![[Diagram]](../../diagrams/19/856242ee0d3f526756e543a6aa2c6eb4.png)
![[Diagram]](../../diagrams/24/15d1576a2fb4377c1e1f358b88a017c2.png)
![[Diagram]](../../diagrams/4/5cf004fd724275e3120b68b732b36f64.png)
![[Diagram]](../../diagrams/51/40cbe934c6728b6ba414ff5b3fba421e.png)
![[Diagram]](../../diagrams/14/7bd6fadefb7ecdedc1e3c842cffb7c61.png)
![[Diagram]](../../diagrams/2/a3319e6f6dc43b3ac0548207c59b5d23.png)
![[Diagram]](../../diagrams/18/d91d0c371c081fca314c8b2bf5f2d934.png)
![[Diagram]](../../diagrams/46/671479f904e5431db9ea9002054b1620.png)
![[Diagram]](../../diagrams/44/c7488817b80da4f343790c659364a529.png)
![[Diagram]](../../diagrams/46/6d697892f19da0ba9e9a0bfe04024325.png)
![[Diagram]](../../diagrams/46/c072ced267839aa3154c22ce253ae6a2.png)
![[Diagram]](../../diagrams/2/8b2af0ca24c2f96ec1cdb9f172e8450f.png)
![[Diagram]](../../diagrams/9/a449ffb07ef03d70be986c497bd1c854.png)
![[Diagram]](../../diagrams/36/2a0b119c417ec31886e02214f2d81621.png)
![[Diagram]](../../diagrams/35/6c3058192686dcfa74ccfb3b88b7d540.png)
![[Diagram]](../../diagrams/34/40a4b982aa0e1f644badf58bf0c974d0.png)
![[Diagram]](../../diagrams/40/41f30ba6e95e4b67a262b7ed6837680f.png)
![[Diagram]](../../diagrams/48/20728c26e6cd6aa6873129dfc4c51c95.png)
![[Diagram]](../../diagrams/7/c317a7be8eb2eb96b7b89c4d7c74758c.png)
![[Diagram]](../../diagrams/11/428a7eb56f8f1150e05be158b787b9e0.png)
![[Diagram]](../../diagrams/51/650e97531c43ba488ca56bd823d44f5b.png)
![[Diagram]](../../diagrams/39/bbe3cf19fa46c702657b5eca5aeebb41.png)
![[Diagram]](../../diagrams/34/f3a6350fac7c66f1e428607891ecdf75.png)
![[Diagram]](../../diagrams/49/21bc366cc627ecb3b251c3c29a56b795.png)
![[Diagram]](../../diagrams/15/5a2ece33789f1957c3321122e96a830b.png)
![[Diagram]](../../diagrams/13/ba747fc14701ec5e34fc06e2cee96520.png)
![[Diagram]](../../diagrams/39/2c3d8b83f98c057ceb76ad71f0ddd39a.png)
![[Diagram]](../../diagrams/45/c5716d6683e4448fc859351ff16ed133.png)
![[Diagram]](../../diagrams/32/b1d1b511043c51bb0569965b32b24e19.png)
![[Diagram]](../../diagrams/11/26589b59a4e4585973e93bb4a3bee111.png)
![[Diagram]](../../diagrams/3/25aedb1b8a43f36e6c4514dcad3c3a99.png)
![[Diagram]](../../diagrams/48/2ec6419c28cdc39dea2e160e804b7942.png)
![[Diagram]](../../diagrams/16/e5e0e9509f0a0c2c91d68bf7cff760ec.png)
![[Diagram]](../../diagrams/7/4bcfc48232c7dca30351338bf2d450c3.png)
![[Diagram]](../../diagrams/48/e1c14e639530cf2a3ce158dd5c18bac5.png)
![[Diagram]](../../diagrams/31/b5551461db0129e6743b00cb70335859.png)
![[Diagram]](../../diagrams/30/37c0448591508bfae05eac2115f4781c.png)
![[Diagram]](../../diagrams/44/f4356a3b588023a777d4d2158453ceb1.png)
![[Diagram]](../../diagrams/41/f17489aa77b2ca5b97bd9e81c863e7f8.png)
![[Diagram]](../../diagrams/27/30e09ca303f170dbd54d7720cdfd0102.png)
![[Diagram]](../../diagrams/33/b95cefa343c901c1652ad5a342a0f4cd.png)
![[Diagram]](../../diagrams/5/2e939a2977a4534182e4c3185e6dbf2c.png)
![[Diagram]](../../diagrams/31/7e96963750d440a1db0d3604234fed5a.png)
![[Diagram]](../../diagrams/29/d9671f81cf9dc37ed0ae5dad05d27ca4.png)
![[Diagram]](../../diagrams/25/e04af0b8febecedfb956436c103a3d05.png)
![[Diagram]](../../diagrams/44/2f5558db0dff71264d9e71a8f569c86e.png)
![[Diagram]](../../diagrams/11/e06f83948bdef874e445160e84e91709.png)
![[Diagram]](../../diagrams/12/df5b1dc0a138e215c6812b66552d2697.png)
![[Diagram]](../../diagrams/30/54abd445af2a6891d27f0d5787d42fcc.png)
![[Diagram]](../../diagrams/42/faa7ed58433fab1b3f2b5b12c4721314.png)
![[Diagram]](../../diagrams/45/a752096f6fcbb2cba423c232283872da.png)
![[Diagram]](../../diagrams/16/65602df5ddf73f6b731b747664c91750.png)
![[Diagram]](../../diagrams/33/00a5c6706a777696ec443afd3bff5385.png)
![[Diagram]](../../diagrams/27/d61bc6e2b5e02418c04f62cbe55c8561.png)
![[Diagram]](../../diagrams/13/17e564178d0f3440366933a9058a8037.png)
![[Diagram]](../../diagrams/33/e213e04a89761a7173771c739f586cb1.png)
![[Diagram]](../../diagrams/27/370abb36e0e555be07c1727c212f1dcd.png)
![[Diagram]](../../diagrams/13/92c261ad5b65e80a0676e90580201283.png)
![[Diagram]](../../diagrams/46/d35fd29283b21328b344072a51add50a.png)
![[Diagram]](../../diagrams/42/b034a5f657357076daf5f7c116807ea2.png)
![[Diagram]](../../diagrams/28/48d04189be18468f76093d7ce512d7ed.png)
![[Diagram]](../../diagrams/20/8468ac64244c286c604497c8b3f3a242.png)
![[Diagram]](../../diagrams/29/17c68176d6a955b4cf7a74f7d9f623d7.png)
![[Diagram]](../../diagrams/49/e6adb2156c864ca7e9e456b083b10635.png)
![[Diagram]](../../diagrams/7/3182b6705c299c5ba74d337361a73723.png)
![[Diagram]](../../diagrams/50/06e4a42ff428b66b5c198608003c2962.png)
![[Diagram]](../../diagrams/27/6bf712c55af868e47450e078d0fb2b68.png)
![[Diagram]](../../diagrams/22/b43d02e4a968dc831cd2dc44816bca5b.png)
![[Diagram]](../../diagrams/52/1a59bc1def4389d16292b43a436cd1ee.png)
![[Diagram]](../../diagrams/10/a5e734539ef733336cfb4c5ad41d0c80.png)
![[Diagram]](../../diagrams/27/3779c0159223d6011ad13bf0d4dcc0f0.png)
![[Diagram]](../../diagrams/28/e2592ac668d6ab3c4d3ca59c2d77bf18.png)
![[Diagram]](../../diagrams/37/0d53ee1dd62edfebaab73c08564c6dbf.png)
![[Diagram]](../../diagrams/41/805809bdfb02c982ff9b3e93f62be29e.png)
![[Diagram]](../../diagrams/6/c47e59d230e571af8a895d486cf802e1.png)
![[Diagram]](../../diagrams/40/ae644c4e3379da8a8c1dd715865b3531.png)
![[Diagram]](../../diagrams/36/10075d30cc3570e11531bcecc1e28401.png)
![[Diagram]](../../diagrams/32/7cd93ed6c9c7da8279cad4eb63c1b813.png)
![[Diagram]](../../diagrams/50/ce551e786690d07176aaeb11ac2e725a.png)
![[Diagram]](../../diagrams/51/047952c8cb8f76439b518063c12decc1.png)
![[Diagram]](../../diagrams/46/78cda084b9f18869c5a4f49f186956a8.png)
![[Diagram]](../../diagrams/32/9a65dec89ffbbafb467acf6f267f5475.png)
![[Diagram]](../../diagrams/51/89803afe96d8e91ba0c42b86fad0ddc3.png)
![[Diagram]](../../diagrams/27/0c46526bd8a237bca930df6a5ccd0ef7.png)
![[Diagram]](../../diagrams/26/54c7600d578c1f781ea7c892e7fe28d8.png)
![[Diagram]](../../diagrams/15/c1e841ccb60ecf0b45b8ad6257ec2624.png)
![[Diagram]](../../diagrams/49/8027c75a8bfbf5ac8739db61f7270bd7.png)
![[Diagram]](../../diagrams/50/4fa1dc4fdac12a8834f8e81769e299bc.png)
![[Diagram]](../../diagrams/43/a01abe99fe28042642abdb54cf33b7bd.png)
![[Diagram]](../../diagrams/5/40c66632c468507f9d11e404f2aa790f.png)
![[Diagram]](../../diagrams/8/376ff27b27c7b1c5d36592403512aa1f.png)
![[Diagram]](../../diagrams/28/da5d4576890b4d987675fd7cac27f7f4.png)
![[Diagram]](../../diagrams/10/ff4f277efe9af9a3f1ab0f9e3432c0f3.png)
![[Diagram]](../../diagrams/40/9e3262ce91a33d30c20fdbd25a0821b2.png)
![[Diagram]](../../diagrams/31/c1d5dfc93e9debb309f1aaf95dc47daa.png)
![[Diagram]](../../diagrams/3/5e9805170714c56e69bbab6f1275020a.png)
![[Diagram]](../../diagrams/29/9868122e388a15835d65549a42ef718d.png)
![[Diagram]](../../diagrams/36/afb03735655c96ff2936df5641f8ce60.png)
![[Diagram]](../../diagrams/24/52692265c51dc673db610d7cc0ff15e7.png)
![[Diagram]](../../diagrams/40/2b7668e889c236229f2eb57ed8bac602.png)
![[Diagram]](../../diagrams/7/7c086d8584acf9aecd1502f1bcbae1be.png)
![[Diagram]](../../diagrams/0/1bc6f92bbabd83d49585a0e3102ab232.png)
![[Diagram]](../../diagrams/38/f1e3c42962a6147cabf59320218ac856.png)
![[Diagram]](../../diagrams/19/a9ebb66a2611642463ce5e38c7c3d399.png)
![[Diagram]](../../diagrams/27/cb9fad3f574ecd57489cd17e1f4fad9d.png)
![[Diagram]](../../diagrams/30/f7c129f913ea079cbf243694ac3b135f.png)
![[Diagram]](../../diagrams/3/3edde793251f68a01ada7528097e240c.png)
![[Diagram]](../../diagrams/2/53ee50fce9872cac38c6f2aaef20b89d.png)
![[Diagram]](../../diagrams/2/e1c35c85259f52bf9a19c711d413571c.png)
![[Diagram]](../../diagrams/32/f8f27aceec9cb4839d8520ff1081ba4c.png)
![[Diagram]](../../diagrams/35/9c30f8fcd3ecb887ba2e709e854da4f3.png)
![[Diagram]](../../diagrams/27/397591c34710802a94bed56e25323d41.png)
![[Diagram]](../../diagrams/20/965cc0d10f02fa76578e0cf2c14197c2.png)
![[Diagram]](../../diagrams/52/49f02637480ab7f6f90dc0934823f674.png)
![[Diagram]](../../diagrams/52/78f63922949fbd2868e9fb8c37c1cc04.png)
![[Diagram]](../../diagrams/24/e3d19e8eb95ea40bdade2752af45b008.png)
![[Diagram]](../../diagrams/31/1e1ef6ad618881fd1224ee2fbb2252cc.png)
![[Diagram]](../../diagrams/8/b03de2abb3f4096a383713991b702d12.png)
![[Diagram]](../../diagrams/42/0a4ebf1190cdaa9d1a0b105cdf14d27b.png)
![[Diagram]](../../diagrams/38/bf488a1d08c5ca0ce3d9e530aa1717c9.png)
![[Diagram]](../../diagrams/44/b2358c87d884ed326c4703a6e99626f8.png)
![[Diagram]](../../diagrams/33/bf9e36a723491ac3e72123a0d16b273c.png)
![[Diagram]](../../diagrams/22/598fa5ac9aff649739bcc39f14b58fb4.png)
![[Diagram]](../../diagrams/23/a90ffb9a4895df60f7188986c9ecef86.png)
![[Diagram]](../../diagrams/9/28b3699a6ecae7bc3d732a9b6d11e27f.png)
![[Diagram]](../../diagrams/6/979aea5fc21c6fd681ffc31aa7a3fd94.png)
![[Diagram]](../../diagrams/34/27809b6efa4001b4724c5773ddb5159a.png)
![[Diagram]](../../diagrams/27/697b533d29bede6b067d480a769e047d.png)
![[Diagram]](../../diagrams/30/560ace24395496ed7ba6e2a4a757986d.png)
![[Diagram]](../../diagrams/20/7e7e7c2624d0b99bbef00381d80e21a4.png)
![[Diagram]](../../diagrams/39/f781a81d650182c09b07f64d980a25eb.png)
![[Diagram]](../../diagrams/42/5f355572295a577ab4de73aa7d1fa5ff.png)
![[Diagram]](../../diagrams/17/b458f78d8fb93337c0a7a0822063ebc5.png)
![[Diagram]](../../diagrams/12/05acb2574e952fc515b4aa71b7d96407.png)
![[Diagram]](../../diagrams/10/ffd779efcce36ffca0c170cb5daa1fb2.png)
![[Diagram]](../../diagrams/47/3397217bb4b22364d5b6239022b27abe.png)
![[Diagram]](../../diagrams/39/cb454c6f880259cd7e54e59eda0a8484.png)
![[Diagram]](../../diagrams/45/6b1e540d026d1384265adab7dde27c41.png)
![[Diagram]](../../diagrams/31/091e2ff82461215ea96016712fa0c4f0.png)
![[Diagram]](../../diagrams/41/2c132e834d77fa6774d4f5de321a3769.png)
![[Diagram]](../../diagrams/6/87844d6157e112a5ed26c69482d71bc9.png)
![[Diagram]](../../diagrams/23/3e4f72648b1f850a4e107da80af8e756.png)
![[Diagram]](../../diagrams/52/3eb7dcc831083d9d842e0bedd1a06b60.png)
![[Diagram]](../../diagrams/50/3f866f1257f4c8cd5e59c86b81801d86.png)

![[Diagram]](../../diagrams/29/948c649efb7c9dbd4c91292b5530d404.png)
![[Diagram]](../../diagrams/50/9a04169fefb623f709c871c907948e38.png)
![[Diagram]](../../diagrams/7/a78f8730bcd2b15c1b80e6351ee214c9.png)
![[Diagram]](../../diagrams/22/5bc8ce4237a96681b35cbb9d6ff8adf8.png)
![[Diagram]](../../diagrams/28/c6fd38ce341cf90bfba847284398d038.png)
![[Diagram]](../../diagrams/47/66eaec034ea909d7d6ec18732ec320f1.png)
![[Diagram]](../../diagrams/8/c45820f995229b5a265fe1b02263f94b.png)
![[Diagram]](../../diagrams/11/97073e0796385b01878c257ad404ff66.png)
![[Diagram]](../../diagrams/49/b82b612d05bc315fdeb96c1964555e14.png)
![[Diagram]](../../diagrams/33/9b71bcbb3d98540f06e81c2554e05497.png)
![[Diagram]](../../diagrams/45/0d614fa1cf60ca81e31cd7a0f7198827.png)
![[Diagram]](../../diagrams/10/3a8a12b89bd73009b8b8cc903ffc19f9.png)
![[Diagram]](../../diagrams/4/a15455d262dec5d66bcdc07c0a328c4f.png)
![[Diagram]](../../diagrams/2/3e976f58c7632b5fb8cbee18fa788e74.png)
![[Diagram]](../../diagrams/42/bbcd3b297a6e4579953235fd2d228eba.png)
![[Diagram]](../../diagrams/13/9532346f119d6fb4e7ee4c18c668bbb2.png)
![[Diagram]](../../diagrams/24/8197b839dc3c6a8ca4842f75880760a8.png)
![[Diagram]](../../diagrams/2/eddd78718a744c3fa38ebc7cc92591b7.png)
![[Diagram]](../../diagrams/29/e06dc6393d837928050428f426bb8016.png)
![[Diagram]](../../diagrams/8/12dbb3030247b12ff7f2f9a97038aea7.png)
![[Diagram]](../../diagrams/38/4c88edeee83d753e366d6ec74abdea4c.png)
![[Diagram]](../../diagrams/23/8d071dd24c7a288962e0bf82195cafed.png)
![[Diagram]](../../diagrams/42/5f5798b228d8f81896bc48287660b40f.png)
![[Diagram]](../../diagrams/47/7c298a0496bd5c7ccc6367ffbdd2e06d.png)
![[Diagram]](../../diagrams/42/27174e330253b414db1b84fe2187b3c5.png)
![[Diagram]](../../diagrams/40/a8d1d52bac316bd41ffee0629d928578.png)
![[Diagram]](../../diagrams/35/e917d27ad5f278e7536fd7d1871fa16a.png)
![[Diagram]](../../diagrams/14/0a8237828c088f6ebe3cf0099f0abeb2.png)
![[Diagram]](../../diagrams/3/e837dea02e8be3c04bd9ff764be27e5d.png)
![[Diagram]](../../diagrams/3/86dece7d4e3bea3c4a0a375322716832.png)
![[Diagram]](../../diagrams/32/a36c0848add84f60c26226590bee1c26.png)
![[Diagram]](../../diagrams/2/bc2a021c62d490008c060e19c4eeed9c.png)
![[Diagram]](../../diagrams/11/6ff93a4df5639b586c86c0524a485b51.png)
![[Diagram]](../../diagrams/22/1b1f3c75da98694a6e7dd80b001b97dc.png)
![[Diagram]](../../diagrams/13/ddd02833a3f338e61cec880ae5e7b75d.png)
![[Diagram]](../../diagrams/5/7ff9d50d221c19844abe5f86106a61d7.png)
![[Diagram]](../../diagrams/18/9b1a163fbdcaf1f40bfedaec810d874c.png)
![[Diagram]](../../diagrams/33/2177b6b320cce3e4f3d04b2c17648c17.png)
![[Diagram]](../../diagrams/25/7b72c7af34561463f0659792318030f2.png)
![[Diagram]](../../diagrams/40/2859603af8deafda04c05bad11c7e7f3.png)
![[Diagram]](../../diagrams/10/b36040da64cda5d24c885c08745939dd.png)
![[Diagram]](../../diagrams/20/5d5d21b6fe424a8584a250e7448efbd3.png)
![[Diagram]](../../diagrams/25/4a434dce66d7589346ff65d95961c1cb.png)
![[Diagram]](../../diagrams/28/24a9d27faa95c93dc9fb495d9b273ef2.png)
![[Diagram]](../../diagrams/6/8990a4dbe8aafa435e106e152604cde9.png)
![[Diagram]](../../diagrams/50/ce9d559b8ee3429ed1dcabd650fb254b.png)
![[Diagram]](../../diagrams/43/239f7e710c9e2ca02b8c5f5385f2de9a.png)
![[Diagram]](../../diagrams/23/3f4c4d2157880dfa5f014fa2f664075d.png)
![[Diagram]](../../diagrams/50/2ca14ae2400adb93b52a79558ccdbba6.png)
![[Diagram]](../../diagrams/38/59786e0640d29e80962231303ba6ed0d.png)
![[Diagram]](../../diagrams/32/4e2a7a72cc2898bb825bb0fa93596fa1.png)
![[Diagram]](../../diagrams/18/cc4392422499437017f8b6cd50003d25.png)
![[Diagram]](../../diagrams/34/0fe3ba3370ac6feec9e382d2df9d978d.png)
![[Diagram]](../../diagrams/11/1756978113b05f5abcbcfc21158e7fd6.png)
![[Diagram]](../../diagrams/22/9797b98c7c95fc2781a53c1f24c03509.png)
![[Diagram]](../../diagrams/41/cd69d43e5e598280d470a1396886c103.png)
![[Diagram]](../../diagrams/16/4cc84779fa17d7060cc8cf2738555d23.png)
![[Diagram]](../../diagrams/31/3b8cd34aca47e66efc3913c3c9cc27ec.png)
![[Diagram]](../../diagrams/24/9764b377fb02e8efeca6b56f334472ac.png)
![[Diagram]](../../diagrams/32/9b062fe1353722e61c12ab04d74c5bee.png)
![[Diagram]](../../diagrams/36/02922fe5e45a7de9f2ca62d22d7f6828.png)
![[Diagram]](../../diagrams/35/74bfb856751b76488b8612c1cfa643ef.png)
![[Diagram]](../../diagrams/5/8b5bbb4f18a0af48fd61cdbf293f268a.png)
![[Diagram]](../../diagrams/24/ca338b31db3cd2f80afadcee84072779.png)
![[Diagram]](../../diagrams/31/8cddc24bb8047c532fca374e98fa40d5.png)
![[Diagram]](../../diagrams/6/5e0ba2cd273f46f22930bf730028ab20.png)
![[Diagram]](../../diagrams/38/1b8684551d7d938f33becd0cc3581509.png)
![[Diagram]](../../diagrams/11/fa6c1f6644eebe2656243da11753ba59.png)
![[Diagram]](../../diagrams/20/81350893b31a83dc9fde853bfa5028d7.png)
![[Diagram]](../../diagrams/38/d248f5b3dd23144cfd8ba656b5bf9431.png)
![[Diagram]](../../diagrams/44/ee612c05c28265d711156a7e10aac0c5.png)
![[Diagram]](../../diagrams/39/e8267272bcb439fcd99f79c60437ac3d.png)
![[Diagram]](../../diagrams/19/baf06115a5e153a23767044f14b87b54.png)
![[Diagram]](../../diagrams/28/6beba9f0967421083ba0f2873e77fc7e.png)
![[Diagram]](../../diagrams/50/2907de84dac88dc9093e6bd05c5f513d.png)
![[Diagram]](../../diagrams/43/6e960a749aa4a1a1153b8a26d6a07616.png)
![[Diagram]](../../diagrams/22/90eb3c6b9865051d8144b917e5ca5b82.png)
![[Diagram]](../../diagrams/42/c3bb3e85c1249246215dc767a041e6b3.png)
![[Diagram]](../../diagrams/41/9febdeb9b65c32c1798937a1123b240e.png)
![[Diagram]](../../diagrams/39/0ac7610b00280be282f8271a1b249865.png)
![[Diagram]](../../diagrams/1/fbd72a9e1954d4bdc44f425b43808a61.png)
![[Diagram]](../../diagrams/21/256f02b302055a8183f069a4442b7cad.png)
![[Diagram]](../../diagrams/8/a225b9c43ba6aa1557b66c4260fff955.png)
![[Diagram]](../../diagrams/45/92e9a9c2c9d7ddc3246e4c6fe398a754.png)
![[Diagram]](../../diagrams/50/99d85a1e149ad38269e2cfe324c01f42.png)
![[Diagram]](../../diagrams/3/23574b823202ac31a6131bac7c17418f.png)
![[Diagram]](../../diagrams/16/6d5736c321db6571bc7833a0f4f81ed7.png)
![[Diagram]](../../diagrams/41/e3b2f24251983d9952234ed4cc3d11a9.png)
![[Diagram]](../../diagrams/22/a7e56a721955c90db9d12259126a8727.png)
![[Diagram]](../../diagrams/1/4b5850a8fe09c6962b044cc73e241f5a.png)
![[Diagram]](../../diagrams/36/864bf886541191906198d9e5902d5270.png)
![[Diagram]](../../diagrams/40/25b52412fe4ccd59fb84bc11e5b19a88.png)
![[Diagram]](../../diagrams/49/983f12dc06f79544096b23d7b666936b.png)
![[Diagram]](../../diagrams/42/2b7a9ea4eeb4ff8c5f211255e27cf6f0.png)
![[Diagram]](../../diagrams/3/dad169a0978273f55ff0467d156ea556.png)
![[Diagram]](../../diagrams/9/120ba4c7a4052031265a635ad8af57ce.png)
![[Diagram]](../../diagrams/16/fa29468bf5285aa2dca6401ab4494b64.png)
![[Diagram]](../../diagrams/49/4d83c00d5b5a95516eea52389551fe9f.png)
![[Diagram]](../../diagrams/8/28a636376cdbe6793b9891c8176b8324.png)
![[Diagram]](../../diagrams/2/bb2904d4fba22f9e882ca0771385e4d7.png)
![[Diagram]](../../diagrams/45/c99c734c9d1796bf703aa90703e79dfe.png)
![[Diagram]](../../diagrams/20/c2674a61520612f15655bd929b3a6d6e.png)
![[Diagram]](../../diagrams/3/7f22da9c085c4749d8ec502d202ca545.png)
![[Diagram]](../../diagrams/50/b3c51da3e3739dec16532e8e97e51078.png)
![[Diagram]](../../diagrams/1/70de1c99b03dbd42c78acc841f6699dd.png)
![[Diagram]](../../diagrams/3/bf1fcf482ab58b7fb0137f71479f6128.png)
![[Diagram]](../../diagrams/14/130fc1bd7b9f0b77481bb121a1febe58.png)
![[Diagram]](../../diagrams/25/539fabc17f2a8e98133d8ed000ec1ddc.png)
![[Diagram]](../../diagrams/35/6107acfad4d87953384863814b0348ee.png)
![[Diagram]](../../diagrams/2/5959e1b6d70bb6a63fa881d28afbd684.png)
![[Diagram]](../../diagrams/19/7a1ece0a9f8f899c0fa28e3ee07ca959.png)
![[Diagram]](../../diagrams/44/b589d2d86c6789fbd37cfb582d6a95fb.png)
![[Diagram]](../../diagrams/25/9652da35cc27c7f7e1ec8ad67923086a.png)
![[Diagram]](../../diagrams/31/336fc6744ad99a381ee20d9c1fbbf625.png)
![[Diagram]](../../diagrams/17/b73bb159b62f0c6a60e3fbd2f50d0ae3.png)
![[Diagram]](../../diagrams/25/9131979b30a1dd1d5971020166669cf7.png)
![[Diagram]](../../diagrams/13/963be699fdf87c38c0f01b7ee9989078.png)
![[Diagram]](../../diagrams/33/9fe0f88a3639ac2c50d94f6d9ba1dba0.png)
![[Diagram]](../../diagrams/30/80c9ef86305e206b571c187c1604963b.png)
![[Diagram]](../../diagrams/17/c0fa58a34e79f1644ca612bb2132dc85.png)
![[Diagram]](../../diagrams/49/1a2f11715ca098a4386a71e88a2b3214.png)
![[Diagram]](../../diagrams/38/2278de13469bf3a5a20414015f13bf30.png)
![[Diagram]](../../diagrams/6/89211f37e94b9612b2e562c1ff89a18e.png)
![[Diagram]](../../diagrams/47/5099a14b8aa28ad1f05cf0e90aa63063.png)
![[Diagram]](../../diagrams/20/e8b43b122e97bb7dec50ff684125234b.png)
![[Diagram]](../../diagrams/40/2a3bcf9f5407fea155088771af62b9d9.png)
![[Diagram]](../../diagrams/31/834ff434e3d3a40bf8f289cbef3cdaf6.png)
![[Diagram]](../../diagrams/6/acd2615ce9dfc59f7583a03fd53cf6ec.png)
![[Diagram]](../../diagrams/3/8f7b398cf2f07566310712af9e541353.png)
![[Diagram]](../../diagrams/25/ee9accab7cfc728bffcd7baa87d07088.png)
![[Diagram]](../../diagrams/32/595c63d1998744991867bcbe76deb6f1.png)
![[Diagram]](../../diagrams/51/d3591aed9b222c57ad6f1494f9e224ca.png)
![[Diagram]](../../diagrams/39/2affcd9c8ac722a23a56a3f96fdcb5af.png)
![[Diagram]](../../diagrams/20/ede5c836c76dc9b39f0e2f9aa1489dfb.png)
![[Diagram]](../../diagrams/35/cc0a94e06bdbce05915e93b8c217d02f.png)
![[Diagram]](../../diagrams/3/1ef56fe1fd405eb6cb8aded1f66ca429.png)
![[Diagram]](../../diagrams/10/7c1c76eb1ff29ef9e6741a2adda6937b.png)
![[Diagram]](../../diagrams/0/440a813630d98084e68e17e01400737f.png)
![[Diagram]](../../diagrams/3/9d0ef1ac4796a18091d36a0d05d6fe09.png)
![[Diagram]](../../diagrams/30/e39b031a6c415bbdd31cdf6fb36a1c7d.png)
![[Diagram]](../../diagrams/27/1eba1fcfa8525ee441f34a638458ef11.png)
![[Diagram]](../../diagrams/1/ffeb0b121cc533964b85ca46b00aa1c4.png)
![[Diagram]](../../diagrams/52/615d2fd96929e2ba71f3409ea553ab58.png)
![[Diagram]](../../diagrams/13/d740ab4e85d931dc0afca9cd12705801.png)
![[Diagram]](../../diagrams/18/1cfd6db770a667882a3d714a476d786c.png)
![[Diagram]](../../diagrams/24/ab41b0911f670744b3cad5adad62defa.png)
![[Diagram]](../../diagrams/30/0a38ccb8701f75c7352cc9231c9489e2.png)
![[Diagram]](../../diagrams/50/b6ba3b69b76360186a998ca82e51f435.png)
![[Diagram]](../../diagrams/42/da1fb067b59641a89309427842c518c6.png)
![[Diagram]](../../diagrams/9/68350d5caafc8d9cdc29ec3ae1216f56.png)
![[Diagram]](../../diagrams/22/41063a304bc160fbe8c7bc2cd99db4c8.png)
![[Diagram]](../../diagrams/10/093a710fca6871139d10c495af6e3c16.png)
![[Diagram]](../../diagrams/18/86b2d18d4bc515e8575e194b2e5bad5f.png)
![[Diagram]](../../diagrams/35/a97a305e88f4fd8e46f8b91c9426312d.png)
![[Diagram]](../../diagrams/29/45158decc5af6b38eff43ddf356b0e4f.png)
![[Diagram]](../../diagrams/49/98eb6f74d785494a5ea673f74d6ea942.png)
![[Diagram]](../../diagrams/10/26a698e8608e5a0702366115628050a3.png)
![[Diagram]](../../diagrams/12/5be0919e46fa78662ab03ceda0c79330.png)
![[Diagram]](../../diagrams/27/288097502af659e661012f01a11eea2c.png)
![[Diagram]](../../diagrams/13/fe5073a8533ef720b43094db957cc191.png)
![[Diagram]](../../diagrams/48/2c02b638353d3c32d5440d693d40bc40.png)
![[Diagram]](../../diagrams/33/5e8978ce14251067b3719e85d68beb5f.png)
![[Diagram]](../../diagrams/39/43a129475c97ef96ebca3b01eb73f047.png)
![[Diagram]](../../diagrams/7/d55d32246d7dd4e1686db61465bdaeed.png)
![[Diagram]](../../diagrams/3/3e3763d5ed6c197775e75e753f920ac0.png)
![[Diagram]](../../diagrams/31/48b411255230adf3aa2896667c8fda00.png)
![[Diagram]](../../diagrams/48/f0ab6ccdd2de9c4d78507ae1a32ac258.png)
![[Diagram]](../../diagrams/4/d8c6a5ad05b034cfbae9f5964d514baf.png)
![[Diagram]](../../diagrams/17/19d8876f18fb026928cdf6164786c3bd.png)
![[Diagram]](../../diagrams/8/a48218f7ec091398d7e1c7f8e72322fd.png)
![[Diagram]](../../diagrams/19/a5b3120195576b3255e44379a0e9f7b0.png)
![[Diagram]](../../diagrams/16/1c29f79cfc6a9eae8eed85ad2e35ab9d.png)

![[Diagram]](../../diagrams/34/951e550b126e20140cea8467e5c132fa.png)
![[Diagram]](../../diagrams/47/d4e6bc4567f4464f2a63b76b0f9c47e7.png)
![[Diagram]](../../diagrams/17/50488e871de69ebffc31eb94ea6aef34.png)


![[Diagram]](../../diagrams/45/59a7ae6e725ea5f232b286099c7787ab.png)
![[Diagram]](../../diagrams/27/89c0e7175ebc412365c728c1268e3053.png)
![[Diagram]](../../diagrams/52/f75ee3c398f25e6064b89cc4d6c5ae70.png)
![[Diagram]](../../diagrams/31/f5ab9a79ce441ad313d2584f17c8d423.png)
![[Diagram]](../../diagrams/28/c16931581b0e5f1469c0e8d10a0ebde6.png)
![[Diagram]](../../diagrams/9/07ece0c19ef985f4dc4037f7e7665412.png)
![[Diagram]](../../diagrams/13/c4c3d9f1ff97d9b0e687e4ad05648093.png)
![[Diagram]](../../diagrams/31/b4cf223a95cc47bf54e4518672556a1b.png)
![[Diagram]](../../diagrams/52/a07c5e9c73ef6afdccd6ffcffa30a0f3.png)
![[Diagram]](../../diagrams/52/7991790b456aab3af272b7dad615bc45.png)
![[Diagram]](../../diagrams/13/9299da99123e367891ba4d29ebda8872.png)
![[Diagram]](../../diagrams/45/647382d58e7b8a69dec5c9e9d35f32e7.png)
![[Diagram]](../../diagrams/21/e9b0988edc1d783f6adde15e94b8bdd6.png)
![[Diagram]](../../diagrams/14/02e4b8a5d65a5939cbf9c1cfc37cffb2.png)
![[Diagram]](../../diagrams/7/882c02e2dab40b3cb09d0d226ac345e9.png)
![[Diagram]](../../diagrams/32/c0e7952bf58fc84f9c34e384dc2d7837.png)
![[Diagram]](../../diagrams/30/eefefff7d233de329ca84f1bd9d40e85.png)
![[Diagram]](../../diagrams/6/2f03dd0ee26a3ff6aa541df8ce4cfe65.png)
![[Diagram]](../../diagrams/21/e574346abcea1c518a0d7ea69e17788e.png)
![[Diagram]](../../diagrams/39/b07e34b5a8561d961e6649e0d28124bd.png)
![[Diagram]](../../diagrams/31/e1ea1ed5583882d4d8a79199611b12ec.png)
![[Diagram]](../../diagrams/13/fc74b4d23e222dded9818f4df15ef3c9.png)
![[Diagram]](../../diagrams/50/13db8fc6529ec1df89f50ae53627bd2f.png)
![[Diagram]](../../diagrams/52/b579948566cb440776f80159bceae424.png)
![[Diagram]](../../diagrams/10/ab50461602fb9a351d9afb62c80e347e.png)
![[Diagram]](../../diagrams/40/9e9100862e231419eee3f2cec9e3b321.png)
![[Diagram]](../../diagrams/32/2d135c840ed9f401735a1480790a950f.png)
![[Diagram]](../../diagrams/3/78f21cc0bf9a742750b06f8420149f03.png)
![[Diagram]](../../diagrams/50/e2a9597cefd9c2416479c15f9c0b7cf1.png)
![[Diagram]](../../diagrams/27/6677d2553991653f803f0d9e2daccd52.png)
![[Diagram]](../../diagrams/24/c45cc69f0618d1e7ab36b2d114284ef9.png)
![[Diagram]](../../diagrams/45/be0d12e43553ef721917df1535a3b6d4.png)
![[Diagram]](../../diagrams/25/99413b16f3c658055bdb9251237bb8df.png)
![[Diagram]](../../diagrams/25/896f05e83c4709d87922a03c8c852665.png)
![[Diagram]](../../diagrams/23/bc3246747ca4c7ae8da2ebc8fa6ce175.png)
![[Diagram]](../../diagrams/23/b826e2b405acbb4cf4bb59b236e1da52.png)
![[Diagram]](../../diagrams/46/57837a3d65f55780fdd16da718a3dfd0.png)
![[Diagram]](../../diagrams/23/8ca9326548e37d1d2e655dfaa4933e89.png)
![[Diagram]](../../diagrams/49/5298234ce1a888d87d58e89add49d914.png)
![[Diagram]](../../diagrams/45/66578c0b7b1ab0262db08ba10af2986b.png)
![[Diagram]](../../diagrams/50/77b37e218dc1200f60c359922613fb1c.png)
![[Diagram]](../../diagrams/47/6cdb6c45c4dc508aa7c7bc1cec33ba6d.png)
![[Diagram]](../../diagrams/35/32f8f1a520e440080e9745d32221f55c.png)
![[Diagram]](../../diagrams/33/b74d462bcd2ac3165a945e7235f7a7da.png)
![[Diagram]](../../diagrams/17/c08beb7d5ef01a3e729bfb9a56e91532.png)
![[Diagram]](../../diagrams/18/65f8adbf0fe61220cd4a817613d6b063.png)
![[Diagram]](../../diagrams/24/e56f0741ea31666ff08c27ceb7c269e5.png)
![[Diagram]](../../diagrams/44/4c64782516e2a80f14df1d9c03223229.png)
![[Diagram]](../../diagrams/49/f044fb3c34edf206e4b74125c6e9f6f7.png)
![[Diagram]](../../diagrams/29/e74f25823c24fa3795611a818a459c20.png)
![[Diagram]](../../diagrams/13/52b16a16380063ad91e9abfec3dad077.png)
![[Diagram]](../../diagrams/8/a7e2553057e0a52f908ec8a31eee68be.png)
![[Diagram]](../../diagrams/44/51041d5229580b0f6fbb5e55a85412e0.png)
![[Diagram]](../../diagrams/5/7f7a3e27e79266385bdfd50e6134aa1f.png)
![[Diagram]](../../diagrams/36/4401d2d0a40541f8d34e78d600b1d6c3.png)
![[Diagram]](../../diagrams/19/681448c341708d1bda66628523463baf.png)
![[Diagram]](../../diagrams/9/6e8eb840d45b0aa6783613df8763ad05.png)
![[Diagram]](../../diagrams/27/649558389e5913f34a9543001908c7bc.png)
![[Diagram]](../../diagrams/10/061b16fef008eebada4cedbe719cdfb8.png)
![[Diagram]](../../diagrams/36/656e152a30621120032e8c22dba60486.png)
![[Diagram]](../../diagrams/41/973f1965c9f0e795423570f27f93916a.png)
![[Diagram]](../../diagrams/43/e5dd7075c01ee0ca13468d870d5923c5.png)
![[Diagram]](../../diagrams/2/1dcabffef8e8ff8ab7acf952cc0d593d.png)
![[Diagram]](../../diagrams/16/78632c3ef21c480ab3d2a6afb3153eeb.png)
![[Diagram]](../../diagrams/29/70179f612e46a64730c33bd1aad54d22.png)
![[Diagram]](../../diagrams/18/10a078ef9f00a7bf6373dbd0ef84d8ca.png)
![[Diagram]](../../diagrams/46/601b6a7619f3d30175491516e6bbe090.png)
![[Diagram]](../../diagrams/27/136c6d1b873381cd2b95d6277d8a617c.png)
![[Diagram]](../../diagrams/51/bf2c902cc4f6f935cae7fac1dfaa25f2.png)
![[Diagram]](../../diagrams/23/809ef03da5072d2761286dbd6d713cbe.png)
![[Diagram]](../../diagrams/10/e4e894c64d4a092771209725bbb8be92.png)
![[Diagram]](../../diagrams/38/e7827e1461f241dcc7bb72357a3d208a.png)
![[Diagram]](../../diagrams/32/ebf2c26ccff4137d92c161d4c39d5fa8.png)
![[Diagram]](../../diagrams/19/8207058e2302905980364cc396c87477.png)
![[Diagram]](../../diagrams/45/60c0455ebbc28aad154807dc5b42e1ea.png)
![[Diagram]](../../diagrams/47/0736326ea858883e05f075f59df6fda0.png)
![[Diagram]](../../diagrams/51/181cc3bfb3f2bec047514bfb8b85298c.png)
![[Diagram]](../../diagrams/46/2b82f52fb03ff8f3694cacb92d3894cc.png)
![[Diagram]](../../diagrams/5/ceb7afe191609cf98d5c03b680a097f7.png)
![[Diagram]](../../diagrams/18/9b11936eb23e1360a6dca0834ff71311.png)
![[Diagram]](../../diagrams/30/2d8d09bffb4beab44dbd3152550185b4.png)
![[Diagram]](../../diagrams/27/23f1719452bca97d7c014d626c2d12aa.png)
![[Diagram]](../../diagrams/28/04a0d1297ee3d354d227f0a05a21108c.png)
![[Diagram]](../../diagrams/8/37ab9d5c95d9f6b14e60f6d1dd6e3d43.png)
![[Diagram]](../../diagrams/52/a5f58cbd2b693128300064d43af02d60.png)
![[Diagram]](../../diagrams/15/87b1ac0150c0d004a76a423452275d9d.png)
![[Diagram]](../../diagrams/10/22d5f6e97f119cd7ead1aa2ac8d0f01a.png)
![[Diagram]](../../diagrams/35/7b0b86e5e4969199eba5f1fe287d8845.png)
![[Diagram]](../../diagrams/23/2fecf7044c3bcb5e2ef1bbc9fb74b8cb.png)

![[Diagram]](../../diagrams/41/507b4fc4004f6eb255def5e885c2e767.png)
![[Diagram]](../../diagrams/49/ff58307e9bfef0890793735f3d004239.png)
![[Diagram]](../../diagrams/31/a6599d972f1083d9ecf9f098530fd5a3.png)
![[Diagram]](../../diagrams/52/39b7ae6344bb203153cf937bb0919d41.png)
![[Diagram]](../../diagrams/36/5e71a142287926baee1b33675e7d6530.png)
![[Diagram]](../../diagrams/42/d127a0ed30ebccbbec7f624acf456304.png)
![[Diagram]](../../diagrams/1/3fbdfeb2a641916b37bd08e8a3390fd2.png)
![[Diagram]](../../diagrams/13/1c627011e0472a6c20db265b9aa53260.png)
![[Diagram]](../../diagrams/4/96968909c7b373d815c2503e27d05319.png)
![[Diagram]](../../diagrams/26/550eefcf82e2363b10adf33519f9f408.png)
![[Diagram]](../../diagrams/47/28cc8168308aadd76b55211e54799110.png)
![[Diagram]](../../diagrams/51/b5ed9d164c2ad1e08de9ab562650460a.png)
![[Diagram]](../../diagrams/19/d9452a046fc2a3ab10f3a7ca4b956c12.png)
![[Diagram]](../../diagrams/7/0919a57501719d7289e4fbab1e5d865f.png)
![[Diagram]](../../diagrams/35/039bb9ca4976ab342bcfdb52329c2789.png)
![[Diagram]](../../diagrams/9/5d1256f314a2e7ffa4cf46e7044485e0.png)
![[Diagram]](../../diagrams/27/612a09d84c3bf38c1bf4a5932d24a0de.png)
![[Diagram]](../../diagrams/42/b10a81f0c448e9aac451de71cb28a07a.png)
![[Diagram]](../../diagrams/25/6e4c2468f0cbfe72672ee244205343b2.png)
![[Diagram]](../../diagrams/23/130737e3608b2f64c3874d27c2eecbfc.png)
![[Diagram]](../../diagrams/50/4a5df95541543f7821e6646450788663.png)
![[Diagram]](../../diagrams/5/eae6464e2d37773b38cc1ebf1f58a1fe.png)
![[Diagram]](../../diagrams/39/65b2646e8b3d7a2bd4114d0bcd4381e5.png)
![[Diagram]](../../diagrams/29/f76ff6f424260740e0f088935f28f179.png)
![[Diagram]](../../diagrams/18/5069f242f6992d8a1496dce437c9d5f7.png)
![[Diagram]](../../diagrams/46/5fd3a207bd26c4af1ea33ea3e8e1d235.png)
![[Diagram]](../../diagrams/52/00a6d003be03c751fd2f05e32065af7b.png)
![[Diagram]](../../diagrams/3/e094b88ae766e3fc4016374db4ea7a45.png)
![[Diagram]](../../diagrams/3/da22cbc8e71b9cc4490ae149bbb99ecb.png)
![[Diagram]](../../diagrams/17/95bba38207206118c73589a34e400e02.png)
![[Diagram]](../../diagrams/35/66dc61bf410e8535e1539ad53a1d9de0.png)
![[Diagram]](../../diagrams/20/bf392fa19ad12742c01303468d60f4ef.png)
![[Diagram]](../../diagrams/47/59e5ef0a3733b95814c9e5aa1672854a.png)
![[Diagram]](../../diagrams/4/f6ef46780f92282e5a3071080d543c5e.png)
![[Diagram]](../../diagrams/19/6031e96135fdaf6026c57b84783360de.png)
![[Diagram]](../../diagrams/17/b24c775caf1c510234ac4ae32bf496df.png)
![[Diagram]](../../diagrams/50/8165c82436294d02954ac8d35b6c1689.png)
![[Diagram]](../../diagrams/5/649d6bd39745cd58feb479da34318186.png)
![[Diagram]](../../diagrams/39/a18276b745598d46325153a6ce4d840d.png)
![[Diagram]](../../diagrams/39/2dc966f19ae210fc3a6f9f649a72422d.png)
![[Diagram]](../../diagrams/26/e7a89a9da4e3b31013408cd4e3fbf1ba.png)
![[Diagram]](../../diagrams/36/d572bf8ec829e2481a8b53d4a6811486.png)
![[Diagram]](../../diagrams/5/357b56795ceb41e312b329a837d640da.png)
![[Diagram]](../../diagrams/30/d92a8ce931268e3503fcbed68b11e2e1.png)
![[Diagram]](../../diagrams/33/17354041cfe8fa88c62c46e0c3f1e423.png)
![[Diagram]](../../diagrams/40/96c2c7a32fd9d1928d6e765ab6285711.png)
![[Diagram]](../../diagrams/16/fa95edfcfe735b99d4e1354fd3707b1d.png)
![[Diagram]](../../diagrams/19/6a1fe72d27ba1c3eecf80285a2646811.png)
![[Diagram]](../../diagrams/49/5f6e7cd43324026427d4c53c11b72405.png)
![[Diagram]](../../diagrams/18/b3a019d994c0b3f5b149c75305feb500.png)
![[Diagram]](../../diagrams/52/69ffaa3884b5704a41c8b312fe00bbc6.png)
![[Diagram]](../../diagrams/3/cbeaf068c806396713f3a207d66b8d61.png)
![[Diagram]](../../diagrams/31/9d5bd3c78507434404ea554c5f88bb53.png)
![[Diagram]](../../diagrams/20/ac5eb48967e075b3bbb9dc80f5c09f0b.png)
![[Diagram]](../../diagrams/16/f76de8dbed6511067e035046c5cbb430.png)
![[Diagram]](../../diagrams/46/b1a0b71b0b46bc114758a2d88d377700.png)
![[Diagram]](../../diagrams/48/8c43856aafdcc4721ae4b271c256fc18.png)
![[Diagram]](../../diagrams/24/f2af06bdb086e148d2eb821c53b4fc7c.png)
![[Diagram]](../../diagrams/47/7eb99d01cd88b52305ac1ab6d03db9f4.png)
![[Diagram]](../../diagrams/2/d7da83846f35377e4003627e107499bc.png)
![[Diagram]](../../diagrams/23/63dc3c52b0f0f99788ce37b46da23dec.png)
![[Diagram]](../../diagrams/2/65b61e1e45997720b8729f74159ff4ee.png)
![[Diagram]](../../diagrams/2/6ccb81c6441f66ce2fcf582fd8b2e24c.png)
![[Diagram]](../../diagrams/48/af01d3b0e64f7b595a9ece08e64d4ddf.png)
![[Diagram]](../../diagrams/33/7052c4a1aeb7bdd4688d2a0f359eacb6.png)
![[Diagram]](../../diagrams/37/6e8b76772ea722d28f645b17a458de78.png)
![[Diagram]](../../diagrams/32/e402fbc0a94c048feb0ede0acce697de.png)
![[Diagram]](../../diagrams/34/cb02c6113a5e5fdf6a2f689f3232f9dc.png)
![[Diagram]](../../diagrams/17/5e9dc33cfde8e0464bf42043d415eeef.png)
![[Diagram]](../../diagrams/24/66bcb09ec844b2882ff2343304fc2913.png)
![[Diagram]](../../diagrams/36/22027fb5865afc260c32da3bd1df7c30.png)
![[Diagram]](../../diagrams/2/47db48097ad34e469740ab890d0069da.png)
![[Diagram]](../../diagrams/52/10aefbdfc92a9daf4bf7b880ded8bfed.png)
![[Diagram]](../../diagrams/39/16b13b02cd30019d1e09423595b44bcf.png)
![[Diagram]](../../diagrams/43/079fff6a6f034de8743c99b8a42bda0c.png)
![[Diagram]](../../diagrams/23/d92d28621b19058f37db5aa238bed4ed.png)
![[Diagram]](../../diagrams/38/8f91a2c8322da636b99950301f56d606.png)
![[Diagram]](../../diagrams/10/c521cc2e89280ad44b5aa496e89d1d26.png)
![[Diagram]](../../diagrams/1/7b90a77647fcca92fdad1f842e1b113f.png)
![[Diagram]](../../diagrams/17/2f584abcca942ce5749d95654b352178.png)
![[Diagram]](../../diagrams/47/3ac908e10137080ffe96ab953c0168b7.png)
![[Diagram]](../../diagrams/21/ac9c1067f041eb6c6cfd736e584a05a5.png)
![[Diagram]](../../diagrams/26/fecab2b698f88034d7c4426bd3806e8b.png)
![[Diagram]](../../diagrams/46/fc3504db56bb19af379e96a6dd16cd4c.png)
![[Diagram]](../../diagrams/24/0eafa4cda52c07ed62e6a3c5923dbb53.png)
![[Diagram]](../../diagrams/0/3f4e4ee73bfae3274e767c431389ffb4.png)
![[Diagram]](../../diagrams/42/b9bd6463b9071d79853ae0beb8100d9b.png)
![[Diagram]](../../diagrams/37/8984a70d9960839dcf7362055428ddf9.png)
![[Diagram]](../../diagrams/7/599e226246ba9d7fb00f37b774451a4f.png)
![[Diagram]](../../diagrams/39/7f1e86f6faf80bcc42392884ea6c3922.png)
![[Diagram]](../../diagrams/33/475da1087909f6fe4c1021bbe9c740d8.png)
![[Diagram]](../../diagrams/35/66c22f62dcd8b274e3e06f84fb411af2.png)
![[Diagram]](../../diagrams/3/a48196965f656a8c4cbd5e2d4ef57c7f.png)
![[Diagram]](../../diagrams/9/d2a3e08eba03f9eaabf197a9b9c4c981.png)
![[Diagram]](../../diagrams/49/61254fd2272e8774b77c1476f44724a1.png)
![[Diagram]](../../diagrams/41/d89a61410742e6adbbac5b6341a96fcc.png)
![[Diagram]](../../diagrams/26/5e70198df026721377650e5d32765ab3.png)
![[Diagram]](../../diagrams/35/5dfc23a7277dee11ff2e1a78aad93e36.png)
![[Diagram]](../../diagrams/13/4d657a9939829083fc3f74e74738540c.png)
![[Diagram]](../../diagrams/1/d9da3f6a0e1507bd5c0fc42b982c1cea.png)
![[Diagram]](../../diagrams/41/2f83f6255ad14cb5de79247ad80cda57.png)
![[Diagram]](../../diagrams/40/d9b40e7e7a2f182793861476ec58afcd.png)
![[Diagram]](../../diagrams/46/8a324c861b32a3460dc772d2ff9802e5.png)
![[Diagram]](../../diagrams/25/217618b4ecf2e29b05373ddd7ac3051f.png)
![[Diagram]](../../diagrams/22/b820376031c8fbce5b5166818467c56f.png)
![[Diagram]](../../diagrams/32/88a019af0c9de192090bccd51e72cc31.png)
![[Diagram]](../../diagrams/48/9e0fae32ec336e1f7462a0ce2285e166.png)
![[Diagram]](../../diagrams/24/b4e2ddf862ed0062062960cd19834d4b.png)
![[Diagram]](../../diagrams/28/5ef8b1485cf248ab1a26ef02966303fb.png)
![[Diagram]](../../diagrams/47/86ae658a35027a90e43e5406244cd216.png)
![[Diagram]](../../diagrams/37/e2fc531f3df77f5febf45233e4e68c2f.png)
![[Diagram]](../../diagrams/34/672b6e1dc6c52911c4f0401d9425eee1.png)
![[Diagram]](../../diagrams/35/eb550eee41fceebfd1d5d833987fb253.png)
![[Diagram]](../../diagrams/40/643f912d267a535f15ce4213c69f83bd.png)
![[Diagram]](../../diagrams/6/051388186424c027a6eb5517c8f0e29e.png)
![[Diagram]](../../diagrams/42/d60c8e5a904ae9450a61eaec6ed0965c.png)
![[Diagram]](../../diagrams/3/12860f367bc476c3e64b568ef00f0713.png)
![[Diagram]](../../diagrams/8/66e163559d0071520cc1cb222e180b1e.png)
![[Diagram]](../../diagrams/23/b5ae1c298f3fe444fbc4686839b256ab.png)
![[Diagram]](../../diagrams/17/c906108163f87bd12e010b94bb07f6a4.png)
![[Diagram]](../../diagrams/7/383d18ef2669d378bda85e56dad9a0d0.png)
![[Diagram]](../../diagrams/46/a11cc0584be7728c8e9665727081ed38.png)
![[Diagram]](../../diagrams/43/58713650be93961344191b4c5a61096b.png)
![[Diagram]](../../diagrams/19/9f4a7b95d6e94efab820afc15ad23b94.png)
![[Diagram]](../../diagrams/19/c738933d16f2cccbfcfa88dff4a0a8e6.png)
![[Diagram]](../../diagrams/13/f5219d2cb48a14999f33fff4bf4c18a4.png)
![[Diagram]](../../diagrams/32/6ab87fd510c06099b618901acd98bfa3.png)
![[Diagram]](../../diagrams/0/9caf52f51fb396f216a5695c6c0b8873.png)
![[Diagram]](../../diagrams/4/a9ace286b13f07e89a417ddcba00712c.png)
![[Diagram]](../../diagrams/26/176dd2f37bac40c5571e6b2fb52664c1.png)
![[Diagram]](../../diagrams/36/3b31e3e3c6ed63966bde67378524e577.png)
![[Diagram]](../../diagrams/14/3bfac79aa1876952f56ec8864eb033d3.png)
![[Diagram]](../../diagrams/24/80bc60bb1635349afdae82ca263ef739.png)
![[Diagram]](../../diagrams/13/c44d636fbf3e59ea0ea1b24a022117b1.png)
![[Diagram]](../../diagrams/25/d1bd70c495fe66c975d07a9787526633.png)
![[Diagram]](../../diagrams/12/75949b1b78e9b989936f31228c937bb7.png)
![[Diagram]](../../diagrams/36/827090bfa563b09b63b66eea62002981.png)
![[Diagram]](../../diagrams/11/99e09617fd6fffc78d891897b4c6fb50.png)
![[Diagram]](../../diagrams/31/74863211be9ce3367e8d2cd4b9c9b018.png)
![[Diagram]](../../diagrams/34/95ef4447c1d61bb511ab6e27feaf298f.png)
![[Diagram]](../../diagrams/10/5bbf65ded6cda6e2667c481f1a546447.png)
![[Diagram]](../../diagrams/49/6bc15bf9416d5ade9dae88b4562487ed.png)
![[Diagram]](../../diagrams/38/650ce69d96e7b6640d0b07c1783e81dc.png)
![[Diagram]](../../diagrams/35/98e83411ece33bf235126aaac89927a8.png)
![[Diagram]](../../diagrams/47/4c3bd82d0b7cfa030a88e841776acea0.png)
![[Diagram]](../../diagrams/41/5fe2401580d6b4c2c5968cf92db06da0.png)
![[Diagram]](../../diagrams/46/50a128eb208d0287ba776cdd425f39c6.png)
![[ext]](http://kgs.kiseido.com/jsp/servlet/graph/shugyosha-en_US.png) http://kgs.kiseido.com/jsp/servlet/graph/shugyosha-en_US.png
http://kgs.kiseido.com/jsp/servlet/graph/shugyosha-en_US.png![[Diagram]](../../diagrams/40/5bc8a4deda0977d03a1fc2725d53a948.png)
![[Diagram]](../../diagrams/50/7ff775d3aed7f2f3b4f1c3905a59dca5.png)
![[Diagram]](../../diagrams/46/2f9a7334df1a48ab41e4dcd095930acb.png)
![[Diagram]](../../diagrams/38/c24698b6a9f2617f991517dbad86f8ce.png)
![[Diagram]](../../diagrams/6/65218773292f6c95b01ecab752dd04f8.png)
![[Diagram]](../../diagrams/21/c533449a49d760265e238354d7f9a3c6.png)
![[Diagram]](../../diagrams/15/3b9752b62ab621f98caf38cc022fe0f2.png)
![[Diagram]](../../diagrams/5/46caec87cc8335146d07fdabe5a9ec5a.png)
![[Diagram]](../../diagrams/21/18e275cd955755ebb966374952ff77e6.png)
![[Diagram]](../../diagrams/22/780c0077695fbbeabc120e30d8c7a1b9.png)
![[Diagram]](../../diagrams/51/68ee7e80303494395546ca60b72b3b26.png)
![[Diagram]](../../diagrams/31/fb4701b35d821c83deee84f4dec65d9c.png)
![[Diagram]](../../diagrams/31/f9e3f6fc6e851f9ffb9922ac9bf8da3f.png)
![[Diagram]](../../diagrams/7/91496b0834ef2c5f079cdf125f72884d.png)
![[Diagram]](../../diagrams/26/f814e9d4923af5e48614a520a42c1cba.png)
![[Diagram]](../../diagrams/46/d1975a04fff060f38f2aa476f4ae1b52.png)
![[Diagram]](../../diagrams/19/9f52f8ff3f066bc94a71b38dc219cb97.png)
![[Diagram]](../../diagrams/3/64c07f95d496cb8055c0ce243304bb1c.png)
![[Diagram]](../../diagrams/0/0b9403705907627dd70375b383eeb926.png)
![[Diagram]](../../diagrams/26/ee1c4d84829969da8b70cc325682fb14.png)
![[Diagram]](../../diagrams/48/81333e05873ec1c1b571938aaffed092.png)
![[Diagram]](../../diagrams/13/092acd9a6145d38911df288d6f87ad7b.png)
![[Diagram]](../../diagrams/8/ffa014d03e220fef7d9570d09e5209ab.png)
![[Diagram]](../../diagrams/23/8cecd9f538439905dda770d9bf676b37.png)
![[Diagram]](../../diagrams/24/2e5e8a0a02e91f32076094915ddbba55.png)
![[Diagram]](../../diagrams/4/18b8af4cdfa224a78d9d4b6934a4ad54.png)
![[Diagram]](../../diagrams/49/aa496c3e2834f7706032cd7cee8ddfba.png)

![[Diagram]](../../diagrams/48/08d692bf5efa6d0e8572556b41815988.png)
![[Diagram]](../../diagrams/22/ccb4f747dd777a3ca92157dc5a912aa9.png)
![[Diagram]](../../diagrams/3/62cf201bf845c61fd226ad85efc73a69.png)
![[Diagram]](../../diagrams/49/b60043296e168e7f2567fd1ce27305e2.png)
![[Diagram]](../../diagrams/33/696cde3a80711aa1153272b63a588cd5.png)
![[Diagram]](../../diagrams/24/ebfcd1d7d73c0ccbc138238ff2bb530f.png)
![[Diagram]](../../diagrams/0/1c808ac1d132a79d2fe41059f47fa3c6.png)
![[Diagram]](../../diagrams/7/3bb68afd983ab4b7f7f35b4a81b37ab8.png)
![[Diagram]](../../diagrams/6/202f853f3d30c2c88586addf000d30a3.png)
![[Diagram]](../../diagrams/27/60d5eccc284a51add84f8e80024d274f.png)
![[Diagram]](../../diagrams/24/65550dbd7d5338b12f58e2c995a18b01.png)
![[Diagram]](../../diagrams/43/c5ec04056f9005475ea9377e341a85cd.png)
![[Diagram]](../../diagrams/26/bad9aab4e035abbe05c8447c9dd74068.png)
![[Diagram]](../../diagrams/39/b6857b80084f2a82b6c0688395fdb505.png)
![[Diagram]](../../diagrams/35/7d75526cdc79dc571bc042174f403379.png)
![[Diagram]](../../diagrams/4/a0494c44e906fd49a4de1de306fa21e7.png)
![[Diagram]](../../diagrams/0/75a8241468036b389af6d15a869c09b3.png)
![[Diagram]](../../diagrams/50/ddd1c9c18f0415aacba196f38999ded5.png)
![[Diagram]](../../diagrams/32/650e83e89be3e1898af2cd8e7f80fa24.png)
![[Diagram]](../../diagrams/32/ca48dc277ec998db1943da59309b9d3d.png)
![[Diagram]](../../diagrams/14/70ff74bc236973015213ee47d28fa752.png)
![[Diagram]](../../diagrams/9/a9a1a75713d7651e83e5464ad4fb69c0.png)
![[Diagram]](../../diagrams/26/ae8ae423f52ba44f13ee038c4b6eb292.png)
![[Diagram]](../../diagrams/34/ebe69cc48901743ebf2029f1abca1f53.png)
![[Diagram]](../../diagrams/0/683163aff9a90e52448603fb0dae85e0.png)
![[Diagram]](../../diagrams/12/88802b445a806c7f6499a6f4782fa22b.png)
![[Diagram]](../../diagrams/27/aea14da7a6b4a02479ff5d62c58b94f2.png)
![[Diagram]](../../diagrams/22/f9953ba9b177c9b2bbc0315a0de2033c.png)
![[Diagram]](../../diagrams/46/f7553698c6571715955685763062f120.png)
![[Diagram]](../../diagrams/27/22520ad6c70df9f782c1789da9f6ae08.png)
![[Diagram]](../../diagrams/34/17b51f80117da65dc6a40ad42d200106.png)
![[Diagram]](../../diagrams/8/d75d792534bf846ff51d23021eb21717.png)
![[Diagram]](../../diagrams/20/a4d8bb19de1f952e98e630093571af7c.png)
![[Diagram]](../../diagrams/50/842f1e7ec3ddcc606918ffc3affb314b.png)
![[Diagram]](../../diagrams/18/c4ce9ccbaffac83e071b32dc29bd1ddc.png)
![[Diagram]](../../diagrams/9/6455df40ff80f09fb631b10c46f21095.png)
![[Diagram]](../../diagrams/5/9e8197c74d1d54371ef7f3993019c9f4.png)
![[Diagram]](../../diagrams/49/8362ccfa8540a92faa448ea6238feee1.png)
![[Diagram]](../../diagrams/14/de2890552e715ee4c17d14d167ae6b2c.png)
![[Diagram]](../../diagrams/39/734eaef09d94295572c473b30aa43afa.png)
![[Diagram]](../../diagrams/37/aa6dd0739e2d3bd242515a7be42fcf8f.png)
![[Diagram]](../../diagrams/17/d55633a270e563f2e81702e4ead364d3.png)
![[Diagram]](../../diagrams/17/5cf36b2e86f401b7288394adcae90eb8.png)
![[Diagram]](../../diagrams/37/2f392fb71ec4c95a918467a13206fe78.png)
![[Diagram]](../../diagrams/15/5febbd801ef82e31a5c265af82fb731c.png)
![[Diagram]](../../diagrams/33/37c18580911df549d2d6ce4f8f6417e8.png)
![[Diagram]](../../diagrams/46/367a8798b0eb4c0dc5e46ec930422a82.png)
![[Diagram]](../../diagrams/44/99af3d78616991b7dfddc16e4d1b1432.png)
![[Diagram]](../../diagrams/5/85dd36ded3623f9ec69fc21af0f0a6dd.png)
![[Diagram]](../../diagrams/47/245d65f69576c95eec7ee3dfed5185da.png)
![[Diagram]](../../diagrams/30/c666253a584bafa3e3c56487fdb4cf95.png)
![[Diagram]](../../diagrams/5/f39e37219f0459cc6d79794c6455a461.png)
![[Diagram]](../../diagrams/31/a9f2b65de2f4c58663f377b47e9ad173.png)
![[Diagram]](../../diagrams/12/1451f2b6f5778b9f4f4745a82da6e216.png)
![[Diagram]](../../diagrams/37/c8d85e06c1be04bd583eb0cb55a1e2f4.png)
![[Diagram]](../../diagrams/42/a787e1f1c8311a1de0bbef6c3cf07913.png)
![[Diagram]](../../diagrams/33/afb0bfec06074ea130c86bc0120495df.png)
![[Diagram]](../../diagrams/15/0368775edc7d8f75309eb945cf557f21.png)
![[Diagram]](../../diagrams/26/2bf7fb7ed77c18738a3e0cb59cbf9cf3.png)
![[Diagram]](../../diagrams/48/bde9cde350944301fbd73408ca17bbad.png)
![[Diagram]](../../diagrams/44/fd6bcdbaacc2b2b997f83ecf86f60f36.png)
![[Diagram]](../../diagrams/4/57d0e4f4e130e127c5b5f75cb24c770a.png)
![[Diagram]](../../diagrams/8/ccd66ce2be54d8bc1449da7ebcfbf352.png)
![[Diagram]](../../diagrams/3/5ce96a7a6d2990d15ef770e8c6ebae01.png)
![[Diagram]](../../diagrams/35/09bd5d3b0fadce118e6ea8951b43a909.png)
![[Diagram]](../../diagrams/0/5c95f341da3dc231ef94d7833174f2e8.png)
![[Diagram]](../../diagrams/38/cf8e12b73765aa646cd66af6a029b956.png)
![[Diagram]](../../diagrams/24/291f7e4b0e83980536fc56183c3d3807.png)
![[Diagram]](../../diagrams/1/0fc2d481f5331582c9aa89bfae918464.png)
![[Diagram]](../../diagrams/30/adf040cbd883576cc0a351f8b1afda7a.png)
![[Diagram]](../../diagrams/41/00efe16e2337d3352908896c361684fb.png)
![[Diagram]](../../diagrams/39/c1efd0a0d21beed94c9ad34f766da64c.png)
![[Diagram]](../../diagrams/27/7a8693a7e6db0746bcc76c150b985dbb.png)
![[Diagram]](../../diagrams/24/a34978debd2d1f176b4f7a30f553f305.png)
![[Diagram]](../../diagrams/35/a5f3872e86e6663e61d989a07689cace.png)
![[Diagram]](../../diagrams/6/dbb4b3b201d119eac1039c572168b030.png)
![[Diagram]](../../diagrams/12/dcbc64a5aaa372367b35097d0c4963a4.png)
![[Diagram]](../../diagrams/15/a1cb2e8525a7fd18add479fed41c6626.png)
![[Diagram]](../../diagrams/29/6c6af8ce89e543886eebc91c7c161725.png)
![[Diagram]](../../diagrams/33/3f090eb4e2a73d6024ac33a3e67efe52.png)
![[Diagram]](../../diagrams/15/665028870f78b45d661d5899cf18b85e.png)
![[Diagram]](../../diagrams/31/adc3a26e6cd54f5554e99ba3f826788c.png)
![[Diagram]](../../diagrams/4/821df9afbaa6d6bc49407349a59872d2.png)
![[Diagram]](../../diagrams/16/9819649f2991d0b0437db658214f6d06.png)
![[Diagram]](../../diagrams/34/d4072a0fc9423f59add7382b9a0b893c.png)
![[Diagram]](../../diagrams/29/026764958e756896d3f85f5d9de60f12.png)
![[Diagram]](../../diagrams/1/45a2ca4c4ab8844abbfc8511735289f9.png)
![[Diagram]](../../diagrams/23/03c5dbccbc2d1a1a20cb1b085834195d.png)
![[Diagram]](../../diagrams/45/24c5f66a8654ddeb087ec720d0bdfc59.png)
![[Diagram]](../../diagrams/33/556cfee71d5321248efa951142e8f6ea.png)
![[Diagram]](../../diagrams/50/7de9ec93f704f6698b4fc8a4d9bff893.png)
![[Diagram]](../../diagrams/16/fccc2b4fe233bf64c27b92dcdff70686.png)
![[Diagram]](../../diagrams/17/353b56336600991b80804154b068de6e.png)
![[Diagram]](../../diagrams/6/84872916db1e0e28657fca5f3b578f14.png)
![[Diagram]](../../diagrams/10/f73e8031865de82498f9978f0b3ddb9c.png)
![[Diagram]](../../diagrams/9/806ac4cee936378d4ca8f9a049bdc782.png)
![[Diagram]](../../diagrams/3/b681c0ad16e8b3ac20893e2aebb5ea08.png)
![[Diagram]](../../diagrams/8/e8495a2352be0f952ecfedd67c028ec1.png)
![[Diagram]](../../diagrams/12/c2ca5fc7c56b7ec1d8f79e10a67dfa38.png)
![[Diagram]](../../diagrams/12/77bbfc6cc4de5e156cdb3d3b5b762809.png)
![[Diagram]](../../diagrams/29/7be9cc44b86f2d866a483498fef64dbe.png)
![[Diagram]](../../diagrams/25/53d9131db4046432690a756d125bf7a1.png)
![[Diagram]](../../diagrams/22/0daff5dd003f224794e4626cd83f645b.png)
![[Diagram]](../../diagrams/37/66c9568048f79342cc780bcbaaab146a.png)
![[Diagram]](../../diagrams/11/426c5c77a1067b368470e0341a5a64cd.png)
![[Diagram]](../../diagrams/7/383a9f8ba0d2323271ec9d9bcd335c52.png)
![[Diagram]](../../diagrams/34/abbbcf22cd63243b22b9601c2bc92879.png)
![[Diagram]](../../diagrams/36/6c1625f82d8d62adee3799a5d66c5ad2.png)
![[Diagram]](../../diagrams/50/877bd0f3024503471d3db19d6d66f2ec.png)
![[Diagram]](../../diagrams/5/da341ba73f36b030351f2cc59e197368.png)
![[Diagram]](../../diagrams/40/f0c209a093012e85b7ae187f6fdcc54c.png)
![[Diagram]](../../diagrams/23/ff8f48149ddf17d1950cf7acb2b28c08.png)
![[Diagram]](../../diagrams/42/2b332e568d56f22ebd040dfb8ccf9592.png)
![[Diagram]](../../diagrams/36/ef6f7d53b5cbdee506753794877eafb1.png)
![[Diagram]](../../diagrams/11/8516859c6995d5e5a361c88cc54b3428.png)
![[Diagram]](../../diagrams/50/7ef441840b34879b9d444dfe966f83db.png)
![[Diagram]](../../diagrams/16/ec4e970e5bd78ac8b5b713adc1e293fe.png)
![[Diagram]](../../diagrams/17/b5de603c0a059bc77447bdf84d667ef7.png)
![[Diagram]](../../diagrams/3/3be04fb14747c5a72d0d16c80b89855e.png)
![[Diagram]](../../diagrams/49/a4de22ac40b450c042291b53e20abbcb.png)
![[Diagram]](../../diagrams/39/6a55c4bcca3c0b842104e438f2cc1591.png)
![[Diagram]](../../diagrams/51/d9cadd0d3e26df7a61da4090588eb4ab.png)
![[Diagram]](../../diagrams/30/13523529abaf5fc2519c97d818860fef.png)
![[Diagram]](../../diagrams/32/1bfce74f5aa82bcd1a8c767dfb79f943.png)
![[Diagram]](../../diagrams/27/998a56b7e1b14df00ddc60222a1826cb.png)
![[Diagram]](../../diagrams/3/6f00d51a6a97d7da0a81569d5e3a14a3.png)
![[Diagram]](../../diagrams/45/86e8f24f0ccb1d248b1bbfdefcac250d.png)
![[Diagram]](../../diagrams/29/2e21442943206de74881f733fdcf624a.png)
![[Diagram]](../../diagrams/46/5842340c81bdb17b032f2da1fe00dd9e.png)
![[Diagram]](../../diagrams/39/f11ef6cfbf4d780302912dcea5965b9b.png)
![[Diagram]](../../diagrams/17/5a422c84409b116de4dc20d561cc2f3c.png)
![[Diagram]](../../diagrams/37/acb817eeb7cd4a84e6a02ea82b45cba0.png)
![[Diagram]](../../diagrams/21/b246ecfd48f08f247067b8a7b6f9b66f.png)
![[Diagram]](../../diagrams/32/efada59b80d171d758c75d9467a747f5.png)
![[Diagram]](../../diagrams/26/812e30367bc421275853e1fcfdccfb61.png)
![[Diagram]](../../diagrams/36/5386ae91ae599db9ffaeb3c7ebd1d334.png)
![[Diagram]](../../diagrams/1/6c79f0c479e72226bf8696e24fced70d.png)
![[Diagram]](../../diagrams/24/11ffb88078c12eb6349a9f5c5dfe64e3.png)
![[Diagram]](../../diagrams/48/643f5b000252b82ffecdfe44ad2ce138.png)
![[Diagram]](../../diagrams/42/6b949fd7e0b2184a60e108b19c97bc76.png)
![[Diagram]](../../diagrams/17/ebebdeb304c18a39ffa62bae2cd64c51.png)
![[Diagram]](../../diagrams/47/104860218a1d89cdf1b8367c62269583.png)

![[Diagram]](../../diagrams/2/8ab69e51b19e296d6c94d89686c52dc0.png)
![[Diagram]](../../diagrams/9/4d3467a777775ead6d5bb00f5da6e0f1.png)
![[Diagram]](../../diagrams/26/6bc5457dcf9dd469e0a4e3c6858fe953.png)
![[Diagram]](../../diagrams/26/d914dbc57ca2912bd4340961923aa6c3.png)
![[Diagram]](../../diagrams/1/a3405d6bef675ffeb845ca30ddd75747.png)
![[Diagram]](../../diagrams/25/55bdb2f77c08c22a8a6c4b4c0492ceb3.png)
![[Diagram]](../../diagrams/41/83c16e6929f3f25bbc1b747eba546ee8.png)
![[Diagram]](../../diagrams/9/2e9382400b0c411915a44ee0078893d5.png)
![[Diagram]](../../diagrams/46/7917b5c79e066072f6165a99bd7c811b.png)
![[Diagram]](../../diagrams/24/fe5e5ae25b52eca9b44af2df36ba51d3.png)
![[Diagram]](../../diagrams/12/1bdf48482d758839a941aad028fe7be0.png)
![[Diagram]](../../diagrams/52/dfcabcc30328099b968f302b680e736d.png)
![[Diagram]](../../diagrams/12/8e352626012e3b0b799d68e7d10c1925.png)
![[Diagram]](../../diagrams/18/30f34ffc18288163c47b370662a6dedd.png)
![[Diagram]](../../diagrams/42/d0ac66398c656d8c7b289ab03d55a1a1.png)
![[Diagram]](../../diagrams/23/802f232c169393f266ca81cbd136f53c.png)
![[Diagram]](../../diagrams/18/b9002055e296c209a2b6c65f3ef6865e.png)
![[Diagram]](../../diagrams/36/274f52ee0f2af3d1796024b3e41a717e.png)
![[Diagram]](../../diagrams/47/5a33d925338290983a9a88e4ed8fc2ab.png)
![[Diagram]](../../diagrams/22/d5055a2062a868332b6c1f0a2c268a7d.png)
![[Diagram]](../../diagrams/29/a0c6047e255c4584d440f4c49320fcac.png)
![[Diagram]](../../diagrams/33/9b14448be51f478bfbd12116e8776bea.png)
![[Diagram]](../../diagrams/13/de36162133e532b2176199cf1e752147.png)
![[Diagram]](../../diagrams/30/ca08132dab7680388c296224466acd30.png)
![[Diagram]](../../diagrams/42/94bb3deff3a92290fdd97acf98236f63.png)
![[Diagram]](../../diagrams/13/2ca495e7d8096a51e86ec644096ea7b5.png)
![[Diagram]](../../diagrams/26/470357350c2f5bf75eeaaf01c99ba4c7.png)
![[Diagram]](../../diagrams/32/194a7221ffe5a04cc3ce57b2f3f30280.png)
![[Diagram]](../../diagrams/37/723f58f5e6f00cfa72339a27314e2b0d.png)
![[Diagram]](../../diagrams/14/a6d77b0b4634febdf9081919a7f0ee22.png)
![[Diagram]](../../diagrams/11/ff97e34e3a6300ded494eef43fff2595.png)
![[Diagram]](../../diagrams/17/a6ca72f5dbe61247882260026fb0f2bc.png)
![[Diagram]](../../diagrams/22/1cb856cffcc6bc3f7c0eaa90aedd9541.png)


![[Diagram]](../../diagrams/29/fc067ecbf99bc5e4ce2de0424382a7f7.png)
![[Diagram]](../../diagrams/9/e7881938ca1dbfa3ae3c769ad00c25f4.png)
![[Diagram]](../../diagrams/15/d0938cb41a86681e4092443d4ea20ed3.png)
![[Diagram]](../../diagrams/34/c71f8cc52c85d3bd98e6e5f8b53bb39c.png)
![[Diagram]](../../diagrams/50/85637d71ac5911047d9279191811edc7.png)
![[Diagram]](../../diagrams/41/c1b1aff621d1fb0c146c7efe193982e3.png)
![[Diagram]](../../diagrams/5/beab1c214f7e1d4bd2fe7421946d6bd8.png)
![[Diagram]](../../diagrams/48/35e538d3327daa4821a67c95ca3a3480.png)
![[Diagram]](../../diagrams/37/d2029810f1a5ce47fe6fd20fd6368f4a.png)
![[Diagram]](../../diagrams/34/654bc7a98907b715d431c3b71bdbfc2e.png)
![[Diagram]](../../diagrams/11/f061cd2020f4b3a89ac7649aaf328474.png)
![[Diagram]](../../diagrams/19/78ce607f94ce36654c4353f3551abed2.png)
![[Diagram]](../../diagrams/29/d8b66fa2219a2b264041ed56452aeb39.png)
![[Diagram]](../../diagrams/35/8347b49ecb1a7b80c39e8da9cf03c87e.png)
![[Diagram]](../../diagrams/10/fd0d024d4305af9299e624784e54fead.png)
![[Diagram]](../../diagrams/44/718fd3baccd1ad47e47952951acf7e53.png)
![[Diagram]](../../diagrams/11/01c02f836d8bce31da539067fd4f6001.png)
![[Diagram]](../../diagrams/37/769d42cbae18008190d219558980fbec.png)
![[Diagram]](../../diagrams/19/e1370be6c5a906a43217a907d85a426c.png)
![[Diagram]](../../diagrams/36/c980bd5bc8036a4e7834c2b00ac483e4.png)
![[Diagram]](../../diagrams/33/63683466846eacf811f9425339ada63b.png)
![[Diagram]](../../diagrams/0/a1e96bc8ef66f0083a72d13c1a832b1e.png)
![[Diagram]](../../diagrams/30/6ff61562ec195f277a07de58a0383b29.png)
![[Diagram]](../../diagrams/13/4b51500827dba4fce26dbe31c47696fb.png)
![[Diagram]](../../diagrams/18/e0068484663641e6719c56eb4f73d2de.png)
![[Diagram]](../../diagrams/24/1027e311db986b537c995bd1f0d45f0c.png)
![[Diagram]](../../diagrams/5/8a477e583818bf8e66df473860f08151.png)
![[Diagram]](../../diagrams/30/c8ad908545d57bb6da5f41b0612048f3.png)
![[Diagram]](../../diagrams/23/bd0ad3715b1ec8e808211fa716921ce0.png)
![[Diagram]](../../diagrams/17/b462cb3c912a057b369c42af0eaffec1.png)
![[Diagram]](../../diagrams/48/1fa24d3bf9cbd5ef96e7d901404893bd.png)

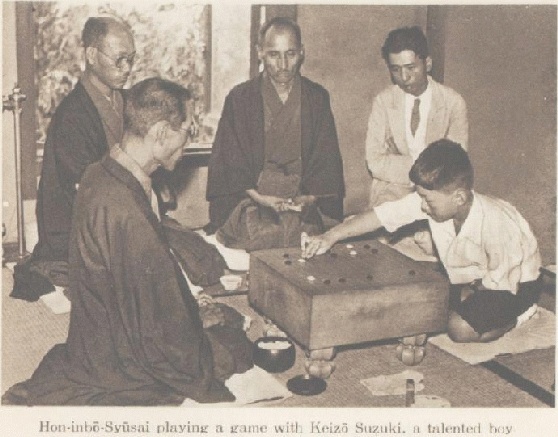

![[Diagram]](../../diagrams/15/b2cceefbe8a1d1a21c2e92628855fc71.png)
![[Diagram]](../../diagrams/13/7e17907ecbcbde835dbdac0c35d1dee6.png)
![[Diagram]](../../diagrams/43/31aea0b8c8b1e0695140e1aecc6aa9de.png)
![[Diagram]](../../diagrams/4/b3e57024c02ee74cf968c3cc1b1335d8.png)
![[Diagram]](../../diagrams/34/d673e6d4fc3146579e1419ae874b73d2.png)
![[Diagram]](../../diagrams/32/094eec998a344d7bcf1b9225f0c83dc9.png)
![[Diagram]](../../diagrams/52/75fbf1fe078e1390f344ab468aa7ff50.png)
![[Diagram]](../../diagrams/38/d7b10764b0f5f41e45e83d1d25ac42a6.png)
![[Diagram]](../../diagrams/21/ace348d20346de4ace848ab20bfff704.png)
![[Diagram]](../../diagrams/10/d720c897084f6a6ac74410f84fde50fc.png)
![[Diagram]](../../diagrams/35/57cfde600feb33197d6c6909ed3834f5.png)
![[Diagram]](../../diagrams/38/964e1373b821dac0962cd45ced9a0d7d.png)
![[Diagram]](../../diagrams/47/da31fa83831e9b749e0f413581a122cd.png)
![[Diagram]](../../diagrams/42/11a17e12e16bf5ccd9b012938c7b5ddf.png)
![[Diagram]](../../diagrams/20/17aa3e1ab28e948355edc9e3df2da8d8.png)
![[Diagram]](../../diagrams/28/e0e9257a2991df4a018685a49e57667e.png)
![[Diagram]](../../diagrams/30/f7f36f679ce0076a1ced15865006e646.png)
![[Diagram]](../../diagrams/48/a28fa2ce0a27f8c9655806bb7214031b.png)
![[Diagram]](../../diagrams/52/d864c48c992f79ad044933a0987e7683.png)
![[Diagram]](../../diagrams/18/5e3122d729b6bbbb71c3e42812506bf6.png)
![[Diagram]](../../diagrams/10/8eeb389604b939531d72740c5910f77c.png)
![[Diagram]](../../diagrams/19/786b8245b6365254f1a9f35bc66f9d61.png)
![[Diagram]](../../diagrams/43/a43b73f20d9afafda14992a04506caa2.png)
![[Diagram]](../../diagrams/52/5f1cd08e67afec0efa3e4235437d2e87.png)
![[Diagram]](../../diagrams/0/094ed508db5df4921fc9e07c45a57002.png)
![[Diagram]](../../diagrams/46/0ad59c6e14a9d17a02dd8ef05caebd8e.png)
![[Diagram]](../../diagrams/16/d51e94707fed2221944a6e1a641e218d.png)
![[Diagram]](../../diagrams/52/72d6a3d502d6e7c85396fdebef2d9af5.png)
![[Diagram]](../../diagrams/33/0f135c5e0be5d1414c9d7083c0dad793.png)
![[Diagram]](../../diagrams/49/3da802d95b30005eeaa464985bd92895.png)
![[Diagram]](../../diagrams/51/211fe146decd3e1d7a257c67dabc5f1e.png)
![[Diagram]](../../diagrams/51/104d6e949fe7131b28999f97b6ac8b38.png)
![[Diagram]](../../diagrams/2/7a0b3265aaea75cedd2cc08810ef0172.png)
![[Diagram]](../../diagrams/12/69b5e39c31041b845b442a2936219620.png)
![[Diagram]](../../diagrams/52/433b0d19ba362cc544ee42f5dffbd49e.png)
![[Diagram]](../../diagrams/32/7341a5e74ae1ce0a7eaf2eb29a5b0e0d.png)
![[Diagram]](../../diagrams/48/74eda3459c9cf89402c7db806c0a7804.png)
![[Diagram]](../../diagrams/47/07764378d25b353c8d1fe0667f93031e.png)
![[Diagram]](../../diagrams/11/36ed1c426ee11c5184caebe115b6e1e1.png)
![[Diagram]](../../diagrams/45/a6cb615ad9ab494c982cdd5108b2b251.png)
![[Diagram]](../../diagrams/49/59c8bf8b14c01ee6135a3728bb14d17e.png)
![[Diagram]](../../diagrams/30/92498a16e38c2b0672aa47ffeab45544.png)
![[Diagram]](../../diagrams/43/24e3b36ce9790fb53c0d72437f348ee9.png)
![[Diagram]](../../diagrams/14/7abbd61f696ae0fbd5dc88e2ec1044d5.png)
![[Diagram]](../../diagrams/9/76bf11fc7a80e652c24df7a651a8cde4.png)
![[Diagram]](../../diagrams/24/a8d921e55f5e6181c762375a7b1abebf.png)
![[Diagram]](../../diagrams/36/14b84fcec61b0ce9fd13d4f5ef3f8fc2.png)
![[Diagram]](../../diagrams/44/89b13b19f9758f26f3a1fa27912ce84a.png)
![[Diagram]](../../diagrams/26/1ce39aa17785e7bb22b31d0ba1d1aee1.png)
![[Diagram]](../../diagrams/37/fe05d3e05c5ff5979f5989736491ba6c.png)
![[Diagram]](../../diagrams/34/930e4a03523e9a8d244991e225c04947.png)
![[Diagram]](../../diagrams/34/e8ba0f8bc7b11c6253c39d64ec3d71fa.png)
![[Diagram]](../../diagrams/31/e9f60f3ce64829dccccd508a6309275b.png)
![[Diagram]](../../diagrams/29/1ad5d4f4990b1778d116d2482d67877c.png)
![[Diagram]](../../diagrams/7/86f493be3f0768a0bc9f8a0e3d4246a2.png)
![[Diagram]](../../diagrams/36/3a5019ea524987b1adda8188dcdd1322.png)
![[Diagram]](../../diagrams/50/9f8105f415e32150d0e92eaaa75173f9.png)
![[Diagram]](../../diagrams/12/902e39a7ba91c9e08f79e96fbbc05ae1.png)
![[Diagram]](../../diagrams/20/40ed3ae070a593a4ddc305629bf26b26.png)
![[Diagram]](../../diagrams/31/2e9671384f14c4552b410886d68d4d33.png)
![[Diagram]](../../diagrams/42/9325a73af8da78cffac640803b5037c5.png)
![[Diagram]](../../diagrams/6/4ce25f871b603e812dd1fbfc22498ca5.png)
![[Diagram]](../../diagrams/45/c2bc19028ee94215cb870b78d5230188.png)
![[Diagram]](../../diagrams/43/d8717bb5ac866d593be9c4fc142ba178.png)
![[Diagram]](../../diagrams/15/89f3bb565bb47bf80a1406f94228ceaf.png)
![[Diagram]](../../diagrams/24/8ec92fc5e68334a652314dbbae8fbae8.png)
![[Diagram]](../../diagrams/40/91856909038e14d80f92964a1ef428ce.png)
![[Diagram]](../../diagrams/51/1240aaf6945c5c952378e22cefa64501.png)
![[Diagram]](../../diagrams/46/1eecb5eb593774e123488ce69c0e52e2.png)
![[Diagram]](../../diagrams/46/93e7e052fd735c886755c3c7e71a71be.png)
![[Diagram]](../../diagrams/50/7f3854287f1ef722be3b5ba2598e00bf.png)
![[Diagram]](../../diagrams/2/891f93584f2e721eea4f5baac7a02b52.png)
![[Diagram]](../../diagrams/38/1d89bf553a9b1fbb9ef65e614697e388.png)
![[Diagram]](../../diagrams/24/ac03e02ef274959b71dcf80909232d35.png)
![[Diagram]](../../diagrams/42/03415dc5ea94053491f9ba698c950d52.png)
![[Diagram]](../../diagrams/15/d007975e355ae998b394da3a77ab852d.png)
![[Diagram]](../../diagrams/44/711662dcbca8760fab1db31e52e4e88b.png)
![[Diagram]](../../diagrams/19/ecd8b7d22c60df78a3c081d418e6f2c9.png)
![[Diagram]](../../diagrams/33/1fd973961b3280e3db6ab2f4d73ac8d4.png)
![[Diagram]](../../diagrams/30/064ee929e92d117698925d03d7368e6b.png)
![[Diagram]](../../diagrams/7/6cc322b47a50e0bbfd3e7215984920da.png)
![[Diagram]](../../diagrams/50/5a6f99956f1f61a6c5c233d84a713dd8.png)
![[Diagram]](../../diagrams/38/49eaa6e6e7c58e86270ffffa47bb3762.png)
![[Diagram]](../../diagrams/29/58b1adface9f64983ca9f84de5b11ae5.png)
![[Diagram]](../../diagrams/7/d7dd31c66a2a7928bc5d10a424dba36e.png)
![[Diagram]](../../diagrams/46/97e50cb58c387ad19010fbb2930707c0.png)
![[Diagram]](../../diagrams/49/9f952712b1cb593aa0ba60c36d581881.png)
![[Diagram]](../../diagrams/34/b30793d04df5fbf6991485f0d718fa37.png)
![[Diagram]](../../diagrams/9/20051e89f944c76c010edd319e211bb1.png)
![[Diagram]](../../diagrams/48/3b14cb0b517b743b99c0b21c8f84d842.png)
![[Diagram]](../../diagrams/38/9f42fcd95d2e224ef90bd8098873a3d9.png)
![[Diagram]](../../diagrams/16/9266e0579c9d42e7ec021708c3f0b980.png)
![[Diagram]](../../diagrams/5/1203a87e4bb027450fbb013961988079.png)
![[Diagram]](../../diagrams/32/c7a31f53e2cf485a1e8f01ef9561415c.png)
![[Diagram]](../../diagrams/47/c262717a1a5993609e45a52a68ec3762.png)
![[Diagram]](../../diagrams/47/feb3867624db269df4cf255e76813995.png)
![[Diagram]](../../diagrams/8/133ef11327d0a4154bd2033fb0b2bc5d.png)
![[Diagram]](../../diagrams/23/308b7a1be33af4bad44056ea76e4b95e.png)
![[Diagram]](../../diagrams/14/5b40e4ee09d19a205b6c66e3e082d53c.png)
![[Diagram]](../../diagrams/4/7ed39130193c4a99c5e1958c419f30a8.png)
![[Diagram]](../../diagrams/41/d8cdf073c6654f9c278ecad2a71bdecc.png)
![[Diagram]](../../diagrams/17/9ead35029d4b9958aee31c258a066ac5.png)
![[Diagram]](../../diagrams/38/0f70f51271fe9d79dfcf5ee956b656c0.png)
![[Diagram]](../../diagrams/9/877aa6e2a352450db693049880be1dfb.png)
![[Diagram]](../../diagrams/6/f94b0145f99d39b4bd965ab7dec76e51.png)
![[Diagram]](../../diagrams/47/a3372a96bf873c9bf62161ee128948c3.png)
![[Diagram]](../../diagrams/34/db13e422691f3dffb2b9a0c4c9191e47.png)
![[Diagram]](../../diagrams/42/a43230289baeaecea4c95eb7fa0c615a.png)
![[Diagram]](../../diagrams/29/ddda0e19e4377cdb30eb8606699eea4d.png)
![[Diagram]](../../diagrams/48/38311a95fea6aa2867e805c2a5ebd6bd.png)
![[Diagram]](../../diagrams/3/b35f23d3b7d54902bd0addc830b1694c.png)
![[Diagram]](../../diagrams/40/82f1527d24a800a8fcd02aea998d5e6f.png)
![[Diagram]](../../diagrams/3/38f6e895d62695bd28b438ec5039a893.png)
![[Diagram]](../../diagrams/24/99699daa406477a11149ed7fe13a2d54.png)
![[Diagram]](../../diagrams/23/842a980a1d2ddd34ac6ce4692017a1ee.png)
![[Diagram]](../../diagrams/23/87a242aa45813ded7e7d14a20d95752c.png)
![[Diagram]](../../diagrams/31/07df4ce9229b4d76951c50e7ddb7e3fd.png)
![[Diagram]](../../diagrams/10/e99e05187a66b7ef836afedd53069daa.png)
![[Diagram]](../../diagrams/43/7b262cee56046afbc91e6fd01b40508e.png)
![[Diagram]](../../diagrams/44/0b89523e0189b7935d4cad0644f7cd22.png)
![[Diagram]](../../diagrams/5/802e7d24c44aad6463b17e3bddefd7d7.png)
![[Diagram]](../../diagrams/10/27b814436155e9fcd891b1a27cc27fc0.png)
![[Diagram]](../../diagrams/34/ddd5fda750554ec3996f2930c8aa3e26.png)
![[Diagram]](../../diagrams/25/dee5bff61779a06a4175dfebd8df3a89.png)
![[Diagram]](../../diagrams/36/61bdfc96c369b83ab00525b6524ad2ad.png)
![[Diagram]](../../diagrams/29/35b7bfa591b023b15289307a99d05a33.png)
![[Diagram]](../../diagrams/10/a1608d2b56e1c4000f02bcb828f82874.png)
![[Diagram]](../../diagrams/38/399ecc7c2ce0acd4b6d51de49005279f.png)
![[Diagram]](../../diagrams/27/8ae9bac303e4f030b04c3cdd7636c02b.png)
![[Diagram]](../../diagrams/16/330fb6ecf13073a8a24e35eceecc450e.png)
![[Diagram]](../../diagrams/40/a83798505ad02f09a41b140597a05ea1.png)
![[Diagram]](../../diagrams/32/345c86bd8e10cd122eca968d5e24d178.png)
![[Diagram]](../../diagrams/21/02c845f5eb1747eff15c2c4c90f5ed5f.png)
![[Diagram]](../../diagrams/25/41b19c296165669d3a717a6c729f05a7.png)
![[Diagram]](../../diagrams/33/f9e46dfffea9cbfbb8e9430fb8db7d80.png)
![[Diagram]](../../diagrams/42/461f85a4c2688ffd2be7252535bcbc9c.png)
![[Diagram]](../../diagrams/35/1f37b44891784f88bf43007da7f13d0f.png)
![[Diagram]](../../diagrams/6/5b4b0a6e7f014bf0e1eddd03bc8e1fbc.png)
![[Diagram]](../../diagrams/39/c8d3510618e06014b20c1d8f9769ecb9.png)
![[Diagram]](../../diagrams/50/f5a800617b6d6a652fef18de20ff5e42.png)
![[Diagram]](../../diagrams/7/2937276118e5252c39175650555ed356.png)
![[Diagram]](../../diagrams/29/578534eb87197ba2f25e2676265b8973.png)
![[Diagram]](../../diagrams/38/57b9271398942cacea2f5a0368561380.png)
![[Diagram]](../../diagrams/1/f70e3cc120d5600651065e78221cdda3.png)
![[Diagram]](../../diagrams/15/5463fa88ba36a6f4ffb0fccd26764ed0.png)
![[Diagram]](../../diagrams/50/63964fba6ca7860c47183537acf46d26.png)
![[Diagram]](../../diagrams/38/3de78d245f52024423f3322f6df69922.png)
![[Diagram]](../../diagrams/0/52fa02433384cba2af78a8a349c9b3cb.png)
![[Diagram]](../../diagrams/29/8659fcc5de914b2a476063255795da58.png)
![[Diagram]](../../diagrams/51/eaefd03c36e80d98e6c88a4df4582fc2.png)
![[Diagram]](../../diagrams/25/7daba1dacedbe916e81cf854de7d4408.png)
![[Diagram]](../../diagrams/11/a55b3a05d96ceb06d3eeb34c6a713448.png)
![[Diagram]](../../diagrams/36/44029f70f007b6a88f8160d74f9a4324.png)
![[Diagram]](../../diagrams/9/449ef709f994dbb6f83656242b3c390d.png)
![[Diagram]](../../diagrams/18/6eb0017e74c7b6ddf308967f3111ed64.png)
![[Diagram]](../../diagrams/1/26760b2aec0d7b3f1c1150ac74c6e57e.png)
![[Diagram]](../../diagrams/0/f145ab626e444bc34f67bb083c8baa7a.png)
![[Diagram]](../../diagrams/21/525217138fc54a38d3bc0ed0866e664b.png)
![[Diagram]](../../diagrams/6/17d06b471ff162ae1740ae9189f49d93.png)
![[Diagram]](../../diagrams/0/5980d1042ed08ebad672dab538033900.png)
![[Diagram]](../../diagrams/8/a0450104b00f1273b12e15d35d3c8f96.png)
![[Diagram]](../../diagrams/50/dc6187dfd8ea2f2bd7a5c379b8f81646.png)
![[Diagram]](../../diagrams/36/a11666991314b12ebd5b23012ef73999.png)
![[Diagram]](../../diagrams/16/b92c32d905a0944f5c82322036fe2c65.png)
![[Diagram]](../../diagrams/24/3e38c342dcce98aa4c2da0177fc963fa.png)
![[Diagram]](../../diagrams/13/00a2a4328d2b7144a5878d39c4617bbf.png)
![[Diagram]](../../diagrams/23/820da0e507827c65433990a2167bcc72.png)
![[Diagram]](../../diagrams/40/03996a29f7e40562bb5d0549c40fd464.png)
![[Diagram]](../../diagrams/35/6a4123da35d0ae4ee8057a01b0d3e79f.png)
![[Diagram]](../../diagrams/41/4d803b54885a6e91424d1aca792efa16.png)
![[Diagram]](../../diagrams/24/1e90b3845bf8f0414661f425e50b0ef6.png)
![[Diagram]](../../diagrams/46/fe45d259bd488c9910f9b85842b13037.png)
![[Diagram]](../../diagrams/29/9e5cc217ff614cf4a03e4d94f44615ff.png)
![[Diagram]](../../diagrams/1/59ad39b485725042fe8e719b1d7c94d3.png)
![[Diagram]](../../diagrams/42/87357f43191a448c54547a5e1040230c.png)
![[Diagram]](../../diagrams/13/52f7abe07606e7e8092367599f830a0b.png)
![[Diagram]](../../diagrams/51/ed1108bef722040daa7c85538ce27207.png)
![[Diagram]](../../diagrams/50/5b45dd529622f3eac8a39e8ed42b3a07.png)
![[Diagram]](../../diagrams/6/f413d526fb65cdc990dadbd32cefc9ad.png)
![[Diagram]](../../diagrams/35/b6f5cf408502b4a56fde7ab5b78c59d4.png)
![[Diagram]](../../diagrams/25/aee0ac2ba86df6f3b0652c65e24bef16.png)
![[Diagram]](../../diagrams/22/c0e10d07c8ac8348cef4b22e428c9a35.png)
![[Diagram]](../../diagrams/17/6cffe6cf2686af25169bd03b5a94a87e.png)
![[Diagram]](../../diagrams/3/6f37ea2239a7869044383ca199ed0c5e.png)
![[Diagram]](../../diagrams/17/131854ea5a20dd63379dbc0d52e71124.png)
![[Diagram]](../../diagrams/23/b2feef652e1bf18304c194e52f4edd12.png)
![[Diagram]](../../diagrams/34/36b455a937274ca5d3570feabccfcca6.png)
![[Diagram]](../../diagrams/25/b0574044dbbbcdd1ef32021f34bae901.png)
![[Diagram]](../../diagrams/14/41a2353c5e3b74f7e30d83436fada740.png)
![[Diagram]](../../diagrams/32/a56b820ef9bd50e2560e81c83e4701b6.png)
![[Diagram]](../../diagrams/22/b9a85c44b0161890bca65c48b4245380.png)
![[Diagram]](../../diagrams/26/64b3434f02aa1abfc43f6a59e0c31cbc.png)
![[Diagram]](../../diagrams/34/9de550f98bd1940f7555b006dec8c626.png)
![[Diagram]](../../diagrams/35/90c96faf9ed72f7b91b99180a57dafc0.png)
![[Diagram]](../../diagrams/34/44e245cc0f79e3b778f5900be60123e6.png)
![[Diagram]](../../diagrams/1/b2b299a203e4d531a5424068e4665e1a.png)
![[Diagram]](../../diagrams/32/9650ae29ced0950c6648ddf8ad52fbae.png)
![[Diagram]](../../diagrams/38/16ba25c1cc19f47bfb7c20dbf61daf26.png)
![[Diagram]](../../diagrams/20/c4d5de7a7adcbc3eced206a278d5739a.png)
![[Diagram]](../../diagrams/29/e04257961bc8b4f2744dbf5c89528528.png)
![[Diagram]](../../diagrams/7/2a425e8629c6a9d2640abefd6e9cb916.png)
![[Diagram]](../../diagrams/34/66d5b13914b8c55d76eaf274b9f106eb.png)
![[Diagram]](../../diagrams/5/b727f6f74dd978c02a2c287749a8ddd1.png)
![[Diagram]](../../diagrams/42/cb38e2bc33969e59eb54bca3cc6f5d43.png)
![[Diagram]](../../diagrams/12/ac2c5393b1be62ede2192708f45d8d6b.png)
![[Diagram]](../../diagrams/48/bf0e77af27179920d7ed91c20be77e16.png)
![[Diagram]](../../diagrams/29/f673fa13f0954e4e306bd8a21e5d0be5.png)
![[Diagram]](../../diagrams/22/066bafaeaf892db3576ccb126afea011.png)
![[Diagram]](../../diagrams/33/2f0a6747da6cc2f44abb11ac6e69b3c5.png)
![[Diagram]](../../diagrams/29/6e07af7e64e472b21483e04af6f76a0c.png)
![[Diagram]](../../diagrams/33/fb30477d23c443c3869f1166b7893e8f.png)
![[Diagram]](../../diagrams/8/161dd57d8ce65a4b1c4f754f3439443c.png)
![[Diagram]](../../diagrams/22/19a56a6fbd85e933b22e7ac11dedbce8.png)
![[Diagram]](../../diagrams/51/fced241c8da6fe34e6c7983bbca7ac1a.png)
![[Diagram]](../../diagrams/28/5b73e6f34941b87690fc50f3f0db094a.png)
![[Diagram]](../../diagrams/5/573f12e8eb8d65f5339aeea1417081fa.png)
![[Diagram]](../../diagrams/40/4abec43122bd100fd58a385dff1781cd.png)
![[Diagram]](../../diagrams/18/942df3a977abb789b6edc64ea0700342.png)
![[Diagram]](../../diagrams/21/cefca3df67e393a8f7ddfdc614c56f26.png)
![[Diagram]](../../diagrams/17/717bc365242115fb8effe62d25c36183.png)
![[Diagram]](../../diagrams/8/3d4d6dc5bcb7550dd62c933be43f4864.png)
![[Diagram]](../../diagrams/15/64f3a84d77973dc2ab572bc1e80113c8.png)
![[Diagram]](../../diagrams/52/79d0cfba5c39200c8f9f7943b6542faf.png)
![[Diagram]](../../diagrams/0/7ade1e52a521f4e55c496fa35b342098.png)
![[Diagram]](../../diagrams/44/586163da486e58f50dbc94e39fcf818c.png)
![[Diagram]](../../diagrams/48/5f9e09494a3957f9bcf3d3e016506549.png)
![[Diagram]](../../diagrams/49/2354c82930c913118bb6b96abe3abc1f.png)
![[Diagram]](../../diagrams/16/f00ca1b7d770a6c2454bf32de1ddf863.png)
![[Diagram]](../../diagrams/23/9b6b25bc5458ed54b70e9868a3805405.png)
![[Diagram]](../../diagrams/38/74bfba821eaf871691d397a66d815d38.png)
![[Diagram]](../../diagrams/25/e0924daf70c292a43abe6cf17bc1f154.png)
![[Diagram]](../../diagrams/6/1f860a256655d384f98be21083bf0cdc.png)
![[Diagram]](../../diagrams/41/6f38c71044a24ff497e388d23cf226b0.png)
![[Diagram]](../../diagrams/28/9c50f7ab2d1105195a1611d9943596c8.png)
![[Diagram]](../../diagrams/40/957f23dc72bcea602dd71a4be15ac281.png)
![[Diagram]](../../diagrams/4/6747e0fb55b5b1398e2078b7dd070c9c.png)
![[Diagram]](../../diagrams/35/00fbba10e00195128a266ba8ac16bc0b.png)
![[Diagram]](../../diagrams/40/8152a13e2091ad1830baab79ce962c3a.png)
![[Diagram]](../../diagrams/24/a32b33e55fb5f7e298bff9594270d8a3.png)
![[Diagram]](../../diagrams/18/b42bf0d70cc07467d2e9267449dc186e.png)
![[Diagram]](../../diagrams/48/177e3150b42d6eba4ed86af32d159e7b.png)
![[Diagram]](../../diagrams/6/298189a247156ef0a9d0dd914de58690.png)
![[Diagram]](../../diagrams/48/d8eff44cdb147b7d642f4596884fdf9c.png)
![[Diagram]](../../diagrams/45/cd9490dd4a4b47e7142ed2ae662d34f9.png)
![[Diagram]](../../diagrams/6/966cd9ac18d9b2ece05463e47f7254b9.png)
![[Diagram]](../../diagrams/42/5187f1b16b33eddf53b5828e51d7482f.png)
![[Diagram]](../../diagrams/38/1618b1b01733d8c3fa50e87d2f68f95f.png)
![[Diagram]](../../diagrams/1/7b7076b5315a99aaf21301575f6d19b6.png)
![[Diagram]](../../diagrams/42/5eb4829cc2d8fb5debfc390fe1e5e915.png)
![[Diagram]](../../diagrams/26/4adde91ed6a49b39394421d673dbf21a.png)
![[Diagram]](../../diagrams/37/3e66a52511714ecb35b4a062f05f9c20.png)
![[Diagram]](../../diagrams/15/458c93d09a2867f7c0ab7e19d4279f19.png)
![[Diagram]](../../diagrams/27/7ae5b8bac016e96434a5833b0a61ccb5.png)
![[Diagram]](../../diagrams/35/697d2959dd59d7848936472cae176106.png)
![[Diagram]](../../diagrams/11/352164f4f9b5bc2dc2b5cf8b362a7298.png)
![[Diagram]](../../diagrams/11/d129178f7426b97a7394123606ca1f75.png)
![[Diagram]](../../diagrams/46/f483ed16f4cc35a98e4f4350aec36539.png)
![[Diagram]](../../diagrams/32/0d5acf327c765bbc244d92aab7499dcf.png)

![[Diagram]](../../diagrams/24/f00fc00ee39320b754e70a5409dd66b4.png)
![[Diagram]](../../diagrams/48/d32aa1d339b4b4658e6f0f765efb7d1f.png)
![[Diagram]](../../diagrams/5/4241232ebecea40e59fcc05c1af04438.png)
![[Diagram]](../../diagrams/3/35e5b12dce11faa2b3bd0fedf8c47eac.png)
![[Diagram]](../../diagrams/36/4a0556dfecd79e4e578c90eaf2f26496.png)
![[Diagram]](../../diagrams/46/ab2932c900e85fe751e055a3d2fb8b37.png)
![[Diagram]](../../diagrams/24/7e3b3d291e39761a904fd81f56e20be8.png)
![[Diagram]](../../diagrams/43/97aeeca8c682c3febb69b23ea1ff42bc.png)
![[Diagram]](../../diagrams/26/7027e9a3022cee8f9825e8791061914e.png)
![[Diagram]](../../diagrams/47/85c0651f6ffa0a9194929a0d028c0ab8.png)
![[Diagram]](../../diagrams/41/3eec7ccb82cd6b8ea09a142fad35bf36.png)
![[Diagram]](../../diagrams/24/f93b96262d6556f402aadeaa8935a4f5.png)
![[Diagram]](../../diagrams/31/6aeb132db4193881b19e1247ab5aed06.png)
![[Diagram]](../../diagrams/47/a02f8576389ac07cc593bfd4f5df2fc3.png)
![[Diagram]](../../diagrams/46/740d888abf391007c48ffdf694bd4f80.png)

![[Diagram]](../../diagrams/13/ad171718e17a273a54d2a5e5df3f0a44.png)
![[Diagram]](../../diagrams/43/28675d9b64e5e1fff8159f8b8e764de2.png)
![[Diagram]](../../diagrams/48/315f4c5764808aad6587357cd873cc22.png)
![[Diagram]](../../diagrams/44/893a8ffec006ca9736f35ea63c7af3c5.png)
![[Diagram]](../../diagrams/13/5314799c9336ebc5e324fccab9058dbb.png)
![[Diagram]](../../diagrams/49/32d6bc71acdc5a778a28761dd3138ac9.png)
![[Diagram]](../../diagrams/39/b2a9a168f4137f4b513dbbb4ad5139e2.png)


![[Diagram]](../../diagrams/35/b3cdff655c68bca38e76848bbfc60bdb.png)
![[Diagram]](../../diagrams/4/72a103378c817414291d6b9febda2d1b.png)
![[Diagram]](../../diagrams/40/60c333a815934958be86b52364253bf3.png)
![[Diagram]](../../diagrams/8/50517d92cf7a90adbb1248411a8da687.png)
![[Diagram]](../../diagrams/26/86bdd6e75f171b54a05c5354ff9d683d.png)
![[Diagram]](../../diagrams/39/195437bc551457571738f16513a737a4.png)

![[Diagram]](../../diagrams/6/b3fd3bf597c498f8eadbbfe7dd87a96b.png)
![[Diagram]](../../diagrams/43/23b588e05c07a1063a34ba5d388f6749.png)
![[Diagram]](../../diagrams/37/2b340e3c347623f7a65841ccaa345595.png)

![[Diagram]](../../diagrams/35/4e7088477d19d543fed88aaa6a223db0.png)
![[Diagram]](../../diagrams/32/e2b791518143a9be43431470999b5a9d.png)
![[Diagram]](../../diagrams/48/87047e9bd1dc6c40d7753aaa74092b31.png)


![[Diagram]](../../diagrams/48/5adbbf95dd980732400425b60ccbb036.png)
![[Diagram]](../../diagrams/38/1e8f8023f09651f0c030f74b44064057.png)
![[Diagram]](../../diagrams/0/d7c95999f1235683a78cd388e315188c.png)
![[Diagram]](../../diagrams/4/50fe16cc9a90131a348e0a729828e2bb.png)
 29-30. Oct 2006: 德国哥儿, 第6届哥们杯围棋邀请赛.


![[Diagram]](../../diagrams/12/f303c9796f8a0179ccff9c7d4984c9fe.png)
![[Diagram]](../../diagrams/29/b0885f9ae5a2e8b096c64fa99b97519b.png)
![[Diagram]](../../diagrams/30/769d406fcdf55c39a19d91353dbae5b8.png)
![[Diagram]](../../diagrams/5/5e2f45eea8ca6d1db8916fefee4991fa.png)
![[Diagram]](../../diagrams/36/6ec2b2f76280658363ee448bf042105e.png)
![[Diagram]](../../diagrams/43/a8bd85947d4556cf973e1e3c6bb82687.png)
![[Diagram]](../../diagrams/47/9d824a8880c11987c1688591bb06ee1b.png)
![[Diagram]](../../diagrams/3/9be8fcded417da15c9e04f2077760078.png)
![[Diagram]](../../diagrams/49/2b9a73d74d43ce7c2ecd41cfc4c06bf9.png)
![[Diagram]](../../diagrams/28/ccca63deb383a84136725434f0e76eaf.png)
![[Diagram]](../../diagrams/40/e254db002a62edffe0edf89570e0c918.png)
![[Diagram]](../../diagrams/52/eb552a8c4ca3243939d8cde18db79f2c.png)
![[Diagram]](../../diagrams/37/ef4c377a585317bb4da3723beb54d700.png)
![[Diagram]](../../diagrams/27/345c4fc3f00633c587bdbc52d1451738.png)
![[Diagram]](../../diagrams/10/ba843d8b845022abf3003b53c4d31545.png)
![[Diagram]](../../diagrams/36/6beb9699f1017acdd79b9e3e45d24606.png)
![[Diagram]](../../diagrams/17/7e235fd64943549b4fb672a84528a139.png)
![[Diagram]](../../diagrams/42/e5b29b8c0d957bc32e638bd3b84c4a52.png)
![[Diagram]](../../diagrams/26/0bef07aaec1955cdbc5f2fcadbac05b3.png)
![[Diagram]](../../diagrams/30/45dd1d4c67483eb0920fcede1e2d9c5f.png)
![[Diagram]](../../diagrams/20/4604c161ec2e85c1967785dd3b1ea40f.png)
![[Diagram]](../../diagrams/10/ec61cafaf7b305bf4ad0799893dd26f7.png)
![[ext]](http://www.topoftheflops.nl/recensies/Images/men_behind_the_sun.jpg) http://www.topoftheflops.nl/recensies/Images/men_behind_the_sun.jpg
http://www.topoftheflops.nl/recensies/Images/men_behind_the_sun.jpg![[ext]](http://www.dvdmaniacs.net/Captures/CapturesJ-P/Men_Behind_the_Sun/menbehindthesundvdth.jpg) http://www.dvdmaniacs.net/Captures/CapturesJ-P/Men_Behind_the_Sun/menbehindthesundvdth.jpg
http://www.dvdmaniacs.net/Captures/CapturesJ-P/Men_Behind_the_Sun/menbehindthesundvdth.jpg![[ext]](http://www.cinefilevideo.com/images/content/men_behind_the_sun.jpg) http://www.cinefilevideo.com/images/content/men_behind_the_sun.jpg
http://www.cinefilevideo.com/images/content/men_behind_the_sun.jpg![[ext]](http://www.dvdmaniacs.net/Captures/CapturesJ-P/Men_Behind_the_Sun/Men4.jpg) http://www.dvdmaniacs.net/Captures/CapturesJ-P/Men_Behind_the_Sun/Men4.jpg
http://www.dvdmaniacs.net/Captures/CapturesJ-P/Men_Behind_the_Sun/Men4.jpg![[ext]](http://images.mytv365.com/upimages/media/20043156165767149.jpg) http://images.mytv365.com/upimages/media/20043156165767149.jpg
http://images.mytv365.com/upimages/media/20043156165767149.jpg![[ext]](http://www.cavd.com/images/sellsheet/men_behind_the_sun.jpg) http://www.cavd.com/images/sellsheet/men_behind_the_sun.jpg
http://www.cavd.com/images/sellsheet/men_behind_the_sun.jpg![[ext]](http://www.vujer.com/material/filmer/Men%20behind%20the%20sun.jpg) http://www.vujer.com/material/filmer/Men%20behind%20the%20sun.jpg
http://www.vujer.com/material/filmer/Men%20behind%20the%20sun.jpg![[ext]](http://www.dvdmaniacs.net/Captures/CapturesJ-P/Men_Behind_the_Sun/Men3.jpg) http://www.dvdmaniacs.net/Captures/CapturesJ-P/Men_Behind_the_Sun/Men3.jpg
http://www.dvdmaniacs.net/Captures/CapturesJ-P/Men_Behind_the_Sun/Men3.jpg![[ext]](http://www.filmfreaks.nl/media/screenshots/men%20behind%20the%20sun%201%20screenshot%204.jpg) http://www.filmfreaks.nl/media/screenshots/men%20behind%20the%20sun%201%20screenshot%204.jpg
http://www.filmfreaks.nl/media/screenshots/men%20behind%20the%20sun%201%20screenshot%204.jpg![[ext]](http://www.heroic-cinema.com/goldenshadows/images/MEN_BEHIND_THE_SUN__3.jpg) http://www.heroic-cinema.com/goldenshadows/images/MEN_BEHIND_THE_SUN__3.jpg
http://www.heroic-cinema.com/goldenshadows/images/MEN_BEHIND_THE_SUN__3.jpg![[ext]](http://www.filmfreaks.nl/media/screenshots/men%20behind%20the%20sun%201%20screenshot%203.jpg) http://www.filmfreaks.nl/media/screenshots/men%20behind%20the%20sun%201%20screenshot%203.jpg
http://www.filmfreaks.nl/media/screenshots/men%20behind%20the%20sun%201%20screenshot%203.jpg![[ext]](http://www.heroic-cinema.com/goldenshadows/images/MEN_BEHIND_THE_SUN_10.jpg) http://www.heroic-cinema.com/goldenshadows/images/MEN_BEHIND_THE_SUN_10.jpg
http://www.heroic-cinema.com/goldenshadows/images/MEN_BEHIND_THE_SUN_10.jpg![[ext]](http://www.ohmygore.com/reviews/film_men_behind_the_sun/t_08.jpg) http://www.ohmygore.com/reviews/film_men_behind_the_sun/t_08.jpg
http://www.ohmygore.com/reviews/film_men_behind_the_sun/t_08.jpg![[ext]](http://www.ohmygore.com/reviews/film_men_behind_the_sun/t_11.jpg) http://www.ohmygore.com/reviews/film_men_behind_the_sun/t_11.jpg
http://www.ohmygore.com/reviews/film_men_behind_the_sun/t_11.jpg![[Diagram]](../../diagrams/13/254249dcc0235129fb7c61d37cbda883.png)
![[Diagram]](../../diagrams/7/bb112b5074fe7af10089c0f3bc99fc37.png)
![[Diagram]](../../diagrams/22/68d4ce0fdb16b5af514a385ceb74f217.png)


![[Diagram]](../../diagrams/41/0eb3de85025e4047db95a7ed68c123f1.png)
![[Diagram]](../../diagrams/22/b0b8e1a2f500c1354691ea0941c65a9e.png)
![[Diagram]](../../diagrams/10/0553090059282a27515334bdcafdadc4.png)
![[Diagram]](../../diagrams/32/cfb54a2e83bc810c9f1e2b07a00a62bc.png)
![[Diagram]](../../diagrams/20/98037c6379261cda8a6ab4e1fa4de9af.png)
![[Diagram]](../../diagrams/47/f4e2042d2ba9ba5b82c8fd490892c3c2.png)
![[Diagram]](../../diagrams/51/68a221e923980d4f8ff794e2c0fcde9d.png)
![[Diagram]](../../diagrams/10/2fae288eeb50a7745e59ec97b4eaf6e8.png)
![[Diagram]](../../diagrams/32/0d62deff97a2f99e52cc54c6eba261d5.png)
![[Diagram]](../../diagrams/10/733e12b48fbb8e81a1f35f53f701eb1f.png)
![[Diagram]](../../diagrams/26/42b08c1c4c034c24fea4552823b94126.png)
![[Diagram]](../../diagrams/6/746c29468a316cb66b80beea98af8081.png)
![[Diagram]](../../diagrams/18/1eb3613d3fc0c71e78217f68081ea466.png)
![[Diagram]](../../diagrams/49/c75260c1536a84dc0262862312581315.png)
![[Diagram]](../../diagrams/19/3e3846711a1163877bb90bc55540f06c.png)
![[Diagram]](../../diagrams/38/9cde420599ef78c8fcaf6b972bc200ef.png)
![[Diagram]](../../diagrams/24/31eb4415ea0a73caef9d94c4e996cec6.png)
![[Diagram]](../../diagrams/28/08835173df1e52010b8e087f351e64a1.png)
![[Diagram]](../../diagrams/20/166e3932169d5658ca6979a7387bb61a.png)
![[Diagram]](../../diagrams/12/955569f2c164049920e0509c815261f9.png)
![[Diagram]](../../diagrams/51/51f49cf89fbcfee3bc3c0407747e317b.png)
![[Diagram]](../../diagrams/32/02b4af59c0ed426c1d66f8f73183bb15.png)
![[Diagram]](../../diagrams/38/1ed5b7b3fa09e60bba2bfa27d3fefb3c.png)
![[Diagram]](../../diagrams/20/3df15d2e3d094cbd340c927cbc72642f.png)
![[Diagram]](../../diagrams/7/955c3fa64b460ae9a7ce968ca398cb32.png)
![[Diagram]](../../diagrams/24/0823b660fbdd553f0c0a2820ff6ac1b4.png)
![[Diagram]](../../diagrams/45/b49f60b3e65739cfcd60bf62c7232dfe.png)
![[Diagram]](../../diagrams/41/cad61c84d927a1efcd2302fa92b862f3.png)
![[Diagram]](../../diagrams/35/3dc655cbfb54cf076502aa034bb5a10a.png)
![[Diagram]](../../diagrams/1/b03946beed268c5e0d695a6dabe0d0cb.png)
![[Diagram]](../../diagrams/17/0ceb14ecd0356a4e8583a0e86019d041.png)
![[Diagram]](../../diagrams/44/00e9fb78d5008cc8b180ec0b1bb4d9d4.png)
![[Diagram]](../../diagrams/45/728d9773f3b81f26a592b91f3bd7c3c9.png)
![[Diagram]](../../diagrams/31/18748e1fd47b309129c62554bef4496b.png)
![[Diagram]](../../diagrams/24/39aa598a247219abc0c5aa20d9f8d845.png)
![[Diagram]](../../diagrams/18/e4e82300405084737806951326ae18b9.png)
![[Diagram]](../../diagrams/27/f8b426df0dcb96bf67acc8fac30239a1.png)
![[Diagram]](../../diagrams/22/baf3b09288bbd66b35d0cbafe35848d4.png)
![[Diagram]](../../diagrams/20/67df452c93255ca186f807bfff3840a2.png)
![[Diagram]](../../diagrams/9/442ea279aeb0d2e17e74441b6b0bc288.png)
![[Diagram]](../../diagrams/30/8dd58a98bab002759c897925705746d8.png)
![[Diagram]](../../diagrams/36/85a2f2ec8d3986b16b6d81a5cf2a6fef.png)
![[Diagram]](../../diagrams/52/6cd7819dcd5c69de63f9777a94b0de6b.png)
![[Diagram]](../../diagrams/24/e06246a017f2f7edd420191dbdd0d4f3.png)
![[Diagram]](../../diagrams/4/24874ebfd834c9e6a855a2fffcef31c1.png)
![[Diagram]](../../diagrams/17/d86162ab80c203c91b89b7a85b18a7a2.png)
![[Diagram]](../../diagrams/52/ae2b2f05b6d19f1d457b9098ee216bc5.png)
![[Diagram]](../../diagrams/52/e09e491058ee2148a58cd88d998feb28.png)
![[Diagram]](../../diagrams/17/b92201d0f28387a53e2408c3cb186b08.png)
![[Diagram]](../../diagrams/45/5e7e50902dd97662d984a7268cf58705.png)
![[Diagram]](../../diagrams/19/c6c98745e3cfd47ebab6f27f3a20c5a8.png)
![[Diagram]](../../diagrams/7/db04117891e0dc624e8321a46fc7b9e5.png)
![[Diagram]](../../diagrams/50/2f06cfcc5ffa860bb08e2b8c710e0a7b.png)
![[Diagram]](../../diagrams/44/3912de89c1d7b2320fa328df5b6be9ca.png)
![[Diagram]](../../diagrams/44/cd10992ceddaefc99bc90eba6a8bbbb5.png)
![[Diagram]](../../diagrams/9/a1e3e7c451a62627e84e10627daec940.png)
![[Diagram]](../../diagrams/51/8ea4b03b07644ea82e136ab88bff4c1d.png)
![[Diagram]](../../diagrams/9/bf2329ecfacb6b6bc4bdfee8060d47ce.png)
![[Diagram]](../../diagrams/26/99715e26a140b23732b64cec87acec3a.png)
![[Diagram]](../../diagrams/11/22bc04e852c280a550b03d7f75d84cce.png)
![[Diagram]](../../diagrams/10/a123ffc0065da126d1a64cf28b833c5f.png)
![[Diagram]](../../diagrams/24/2c043bbd32784e536fe2d71faf9f3a44.png)
![[Diagram]](../../diagrams/22/cfc061163059b1b7d39189d6006955a3.png)
![[Diagram]](../../diagrams/2/5305c541a551d17b28d722117ba72700.png)
![[Diagram]](../../diagrams/19/015607c03abab2733fdb7ed016258997.png)
![[Diagram]](../../diagrams/38/63a96eecfb641d18d8e0a31dabd96d7b.png)
![[Diagram]](../../diagrams/18/324e6a4d440226bcda2b65a77db26eba.png)
![[Diagram]](../../diagrams/37/aee68c1a0bc74eb2ef65910b62650c63.png)
![[Diagram]](../../diagrams/27/506de49f93cf2b8fdf261493d5649353.png)
![[Diagram]](../../diagrams/12/ce858bb398572d9f5602e1657663785e.png)
![[Diagram]](../../diagrams/29/aa7eeb9cdb8662a7cbec8f1cfe78e50e.png)
![[Diagram]](../../diagrams/5/04b6c136fed3b53008bd6a10e007399b.png)
![[Diagram]](../../diagrams/35/2230fc0cd7b879234395baa1dcde8008.png)
![[Diagram]](../../diagrams/45/19b8d12c63ff6f087348b9192da2b122.png)
![[Diagram]](../../diagrams/52/0e99d2db12773ce81214773bbec8cbf8.png)
![[Diagram]](../../diagrams/0/85641de97cdd5c4b10d53cca5b4ef13f.png)
![[Diagram]](../../diagrams/51/ca3932f13c6184375cb26cfec13061d3.png)
![[Diagram]](../../diagrams/19/934015ffdac2d48a952d229405b18f3e.png)
![[Diagram]](../../diagrams/40/61b0ebbfce4f099377c2baa9553729e1.png)
![[Diagram]](../../diagrams/32/dce2db98ee146bb0c8cf18ba5614b26b.png)
![[Diagram]](../../diagrams/6/6099476fd8b04fcab9e2ca1a95960a38.png)
![[Diagram]](../../diagrams/39/1f4d683b716eb6f3a7ade1432748a05b.png)
![[Diagram]](../../diagrams/52/d6216caa3f5d7abe073703c3688df358.png)
![[Diagram]](../../diagrams/24/83564efd5b246251c92c60a04acb491f.png)
![[Diagram]](../../diagrams/29/a68fc0961804a1f29ca6ef62bafa9a61.png)
![[Diagram]](../../diagrams/25/2259945dc49fc01f6f6a30a9c9da2e8d.png)
![[Diagram]](../../diagrams/6/4c175da6615d39dc41cbae800ea8616c.png)
![[Diagram]](../../diagrams/31/31f8d710d4b1bb5706f348a55152a204.png)
![[Diagram]](../../diagrams/25/473a589a13462acc6d0f0adb6a044404.png)
![[Diagram]](../../diagrams/18/3be7ef9362c5eaad540756e91da4086c.png)
![[Diagram]](../../diagrams/14/d36bf9217bf704a2e05c83061eaa5d70.png)
![[Diagram]](../../diagrams/32/474cf1c38388c57889776c57a31acda9.png)
![[Diagram]](../../diagrams/52/720dfe131ca8def74082c41c08557e68.png)
![[Diagram]](../../diagrams/37/b15ecb732353b19ac0febe912d9cd294.png)
![[Diagram]](../../diagrams/13/82a0e967591a8ed5f8fca318c935c91d.png)
![[Diagram]](../../diagrams/6/21531b5cd0b970723a19ee703c57c60e.png)
![[Diagram]](../../diagrams/9/91fea55ca8e716adb1d81cae2f25e00a.png)
![[Diagram]](../../diagrams/32/d07667f7606c68a608551ae61adac0b6.png)
![[Diagram]](../../diagrams/39/5596c929276ac8774945655ec216bc58.png)
![[Diagram]](../../diagrams/32/6efb84d61b56192fda489f0b6eb63bb2.png)
![[Diagram]](../../diagrams/28/2051331761429b4a6578858fa9c54a03.png)
![[Diagram]](../../diagrams/48/ac987b2d3e11c3e3ccfeadb5785095a1.png)
![[Diagram]](../../diagrams/30/65418fb878b644fde7621cb7e06f2509.png)
![[Diagram]](../../diagrams/20/f7d6d1ee37b686792453ca0e1700e919.png)
![[Diagram]](../../diagrams/48/981d7876c9a9d2e92d204916416161ff.png)
![[Diagram]](../../diagrams/44/39bd9d623c227dcf2ef798de0dc348c1.png)
![[Diagram]](../../diagrams/20/4a3d9ad4609f0ddb436b638f857f305c.png)
![[Diagram]](../../diagrams/45/e52919812dbf7b26433b9afb0fb5de10.png)
![[Diagram]](../../diagrams/32/709326ce75a5a9c0c2cf76f9e96c4450.png)
![[Diagram]](../../diagrams/24/e67ed1f77e11f16a2cae735a9c21a5d5.png)
![[Diagram]](../../diagrams/34/995559bcc62542e43f561c09e923cd81.png)
![[Diagram]](../../diagrams/29/fabcc138a1e6dc9e6578043e007b7582.png)
![[Diagram]](../../diagrams/25/9ce86af1c8d218afee54967d3401d0ed.png)
![[Diagram]](../../diagrams/28/370beb5d4bec837e2814f6cecf40747f.png)
![[Diagram]](../../diagrams/16/934cb63341de47775e462b1aee866bf0.png)
![[Diagram]](../../diagrams/18/0a7f29461304bcd5ba45ffc5c857e2d1.png)
![[Diagram]](../../diagrams/32/b5450f24e1275b8d3a86d4a0a841962a.png)
![[Diagram]](../../diagrams/25/a95e8482fbe05dcfe1c6d553587195ef.png)
![[Diagram]](../../diagrams/20/e6688b4a0d724ca6931ad41747fa6fb2.png)
![[Diagram]](../../diagrams/23/258618186428e98e5c3859f788770d5b.png)
![[Diagram]](../../diagrams/43/976f03df3ac7d32730d26720b620dd5d.png)
![[Diagram]](../../diagrams/52/46ae0ddfbc784613212edbf8475ef8f2.png)
![[Diagram]](../../diagrams/33/0dde1e01acc1876c96efa153fd356a86.png)
![[Diagram]](../../diagrams/5/ed76987c144ca89d0eccb99a1dd5de18.png)
![[Diagram]](../../diagrams/14/587189b73a78dfa024e418046fd87b73.png)
![[Diagram]](../../diagrams/2/fda2ae6be533146a2acae0d0dfb1ba40.png)
![[Diagram]](../../diagrams/42/4b846f5659f6abba18463713623d770b.png)
![[Diagram]](../../diagrams/51/5f8ec0684964a94487ac1b944daba5b6.png)
![[Diagram]](../../diagrams/7/08af304ad79bd4c91328ebe4e773cafa.png)
![[Diagram]](../../diagrams/46/813d9a002f34e822d21e985931da9066.png)
![[Diagram]](../../diagrams/28/41e9832a251993b84c9fbd87e3b08a78.png)
![[Diagram]](../../diagrams/10/2f7bdbab6c072ed952325b0667684898.png)
![[Diagram]](../../diagrams/11/878018f725da40043c69090e61d8fbba.png)
![[Diagram]](../../diagrams/12/3b17879114733423daa6d2c380b8d7b4.png)
![[Diagram]](../../diagrams/17/8e4ade48889f9525bc71828f2a40bfb1.png)
![[Diagram]](../../diagrams/2/e239047f1767799ebebb03e10a8e3da9.png)
![[Diagram]](../../diagrams/33/b68a13049007300100bce486ff47ec55.png)
![[Diagram]](../../diagrams/13/8e85a49e2e3cc59b897de3d1cefba3be.png)
![[Diagram]](../../diagrams/37/dc2d650297a564b9903a8a01607785ca.png)
![[Diagram]](../../diagrams/38/af59868d684aeb6348193800cf3da9ef.png)
![[Diagram]](../../diagrams/40/7a3c52941562d035abeaba81313f8ecf.png)
![[Diagram]](../../diagrams/45/352b3860316c328d02fa14420aa7f7cd.png)
![[Diagram]](../../diagrams/1/ca7d007c8a5c2674359b55c0cd8098a7.png)
![[Diagram]](../../diagrams/18/61cfaf91d1c8912c792dbeca6034a880.png)
![[Diagram]](../../diagrams/33/a34f83a70c4d3530ea10445b5b30a47d.png)
![[Diagram]](../../diagrams/21/747a9d952bc5b4c3703a226956e635fb.png)
![[Diagram]](../../diagrams/37/2b211cfe02533a9703bcf4d42f199313.png)
![[Diagram]](../../diagrams/25/76e69c742f12b8ef1d7df84238a30d5f.png)
![[Diagram]](../../diagrams/12/dcb9dd217d6ea9bad83c00738da345ba.png)
![[Diagram]](../../diagrams/16/882eb0236f9016d27d5e35eb5cdb9007.png)
![[Diagram]](../../diagrams/1/0ebe5be7cbc3dc50affd945bd7ff8983.png)
![[Diagram]](../../diagrams/43/b7f87c694e32fc208a438cc95e69377a.png)
![[Diagram]](../../diagrams/35/4390942623b1ac86b388cef9e2a9c485.png)
![[Diagram]](../../diagrams/21/6fac49b089003ecbbb4a5e2b57fec90a.png)
![[Diagram]](../../diagrams/32/fb7ca148137927dc51d6e705ad9ecb89.png)
![[Diagram]](../../diagrams/3/bd63493d292daa05c440861c38394c39.png)
![[Diagram]](../../diagrams/9/b364202f336a4e588bc6521f5862fc89.png)
![[Diagram]](../../diagrams/24/b8109d5d582cea1e5401ebf06a9a632b.png)
![[Diagram]](../../diagrams/21/a2da13b987b32fc5c3cd88dc135d2ca3.png)
![[Diagram]](../../diagrams/17/9a01a80d27c8dab15c3064c0cf802ea5.png)
![[Diagram]](../../diagrams/46/f59f595cd8dc6d7f38f77834d1571322.png)
![[Diagram]](../../diagrams/14/94d06e63e28f1f7e0ba810b0738a73a7.png)
![[Diagram]](../../diagrams/35/58a670bddbc7604fb7d64bf5ef8608dd.png)
![[Diagram]](../../diagrams/8/5441d2f9c07e2736818ebaa03ac36426.png)
![[Diagram]](../../diagrams/49/af8a75ffea2bd4633096f07d558a9eaf.png)
![[Diagram]](../../diagrams/32/2f6b1f116c7878a23270eb3897b3d4de.png)
![[Diagram]](../../diagrams/11/3723adf519c0a76168b87cdc98fb6368.png)
![[Diagram]](../../diagrams/40/ecd9bddd0a1ad6739b05931d844e2f69.png)
![[Diagram]](../../diagrams/42/ee2034d429edc76532dfc386a95005ea.png)
![[Diagram]](../../diagrams/25/397b0c2ba414d7363a8e1bd68a08bf61.png)
![[Diagram]](../../diagrams/29/9a7179ed956fb51807a6c7e4e7e0e477.png)
![[Diagram]](../../diagrams/43/dc87e888db53d5e2aa80d7be8b944f87.png)
![[Diagram]](../../diagrams/7/eccfe240367cefcfd3374c702fb3c40b.png)
![[Diagram]](../../diagrams/12/660a8f6f94db5ef65c016b83f8915aa6.png)
![[Diagram]](../../diagrams/25/50a50d9d77ce4d21fd855f098d64251d.png)
![[Diagram]](../../diagrams/24/8e5df688e9697af4c9aa997255057e08.png)
![[Diagram]](../../diagrams/38/76cbeaddb568365dfd104c17466ba118.png)
![[Diagram]](../../diagrams/47/08a8d59fbcf783fb67735d25c0ecb052.png)
![[Diagram]](../../diagrams/9/2cc4c6348bc182b178fa3065a9210fef.png)
![[Diagram]](../../diagrams/14/19369f6cf0700a0dc220aca40f1acc57.png)
![[Diagram]](../../diagrams/38/67cd0e113a5a25432fb1a2001e9c831c.png)
![[Diagram]](../../diagrams/20/a1cd1d3c8ad112ccd4815ed7ab3baa17.png)
![[Diagram]](../../diagrams/15/1e0a5d67340b25d98a0d55966b779247.png)
![[Diagram]](../../diagrams/37/2e8b3959b9c1aa101c94f259750193af.png)
![[Diagram]](../../diagrams/38/fa854779033bdb141d7dd05f98a0a33e.png)
![[Diagram]](../../diagrams/12/dc98d29d5e2a70e680dff615ebb9ccbf.png)
![[Diagram]](../../diagrams/7/30176d003499e1fedeeab31ba6f45140.png)
![[Diagram]](../../diagrams/31/8c61e7ad822653eb70d5b2351f5e42d6.png)

![[Diagram]](../../diagrams/49/00046ab0616d4ac5e510d1db0fd1378e.png)
![[Diagram]](../../diagrams/10/c987c2e90ee3a923835309dee6b97e15.png)
![[Diagram]](../../diagrams/16/3c1a91a14a76933f96c9ff35b06cf267.png)
![[Diagram]](../../diagrams/16/03db88fc7c212819f3a086a93b412a7f.png)
![[Diagram]](../../diagrams/28/78ce17eba4cf1351200a6454cf392952.png)
![[Diagram]](../../diagrams/2/466cf243056746941c6910096cdb08a4.png)
![[Diagram]](../../diagrams/25/0b2047767e0bcf34bd8f192403cdfc0e.png)
![[Diagram]](../../diagrams/5/29bf3ba16adf64e2b2f3c7b28bb7633d.png)
![[Diagram]](../../diagrams/30/0579c683bfe9f704f793d08da11d6ee9.png)
![[Diagram]](../../diagrams/45/7a089c4f942f44f0510a58f9ccfe3dcc.png)
![[Diagram]](../../diagrams/6/58510e02454c3446758434ca0ed3962b.png)
![[Diagram]](../../diagrams/2/f686894844b579bab5ddc192b947cb90.png)
![[Diagram]](../../diagrams/39/e6dfc6cfd50bce0145fe48a7f8e3a923.png)
![[Diagram]](../../diagrams/22/3ac54ceda6fc4fc47c1b0313593f310a.png)
![[Diagram]](../../diagrams/15/10d2dd0446b04a5c7fbebc1a9ba5d595.png)
![[Diagram]](../../diagrams/32/282a0d052a79639aaebb79c5cc28d038.png)
![[Diagram]](../../diagrams/14/88c2a72b7ac479826804a5766cc32427.png)
![[Diagram]](../../diagrams/35/4800fe0f883d4b83598bffd77c297e3c.png)
![[Diagram]](../../diagrams/24/02dc086eb9c7002aad043a17b9238ec0.png)
![[Diagram]](../../diagrams/26/577179fca45294d639f02f43ab3dc3f3.png)
![[Diagram]](../../diagrams/19/09baaf39f25dd9603b63fbd03abf0464.png)
![[Diagram]](../../diagrams/21/6d8e49d1fe53ce68234eba299517c7f6.png)
![[Diagram]](../../diagrams/52/5421d179380edf34d9b94cfd045126f8.png)
![[Diagram]](../../diagrams/7/47242097eceba4f241e43cd6f95718f4.png)
![[Diagram]](../../diagrams/30/d4d60af3fcb71183805e51b5e29929d9.png)
![[Diagram]](../../diagrams/18/913132de5fa5425edf47bb59413918f1.png)
![[Diagram]](../../diagrams/50/5be9c8c3207fb7d46860678eed00dec2.png)
![[Diagram]](../../diagrams/23/e8643b108df597c7ca42e3ea46bd6c5e.png)
![[Diagram]](../../diagrams/33/174d41a752c9290cbd782c89f238f343.png)
![[Diagram]](../../diagrams/43/96e9c6a9db6e31d2c2632dd91cc04d19.png)
![[Diagram]](../../diagrams/52/b191dba387887c28117ee51a2cf9a25a.png)
![[Diagram]](../../diagrams/28/b59e86fcce34b19ffb518a5320dec336.png)
![[Diagram]](../../diagrams/30/e9b076a29484d6c36118ee5d8cfc2b9b.png)
![[Diagram]](../../diagrams/43/cab80cb32c2c87a7ded493169ecf8051.png)
![[Diagram]](../../diagrams/10/14308345b0c708d15d7f0e14a89542cd.png)
![[Diagram]](../../diagrams/7/f935af8a871507f3f03283d07b0be939.png)
![[Diagram]](../../diagrams/49/87662738295cbd8b79634e52b7583ab1.png)
![[Diagram]](../../diagrams/4/3733b2c692cf5c3148df225072af6aa0.png)
![[Diagram]](../../diagrams/0/5a3609dd0a24abc61107c03e40a5ad4c.png)
![[Diagram]](../../diagrams/9/808a09bdf868ee8fb95d0f3b84e94c42.png)
![[Diagram]](../../diagrams/51/fbfcc08456f26913040bc0495fe51135.png)
![[Diagram]](../../diagrams/17/41465d829f041bfbb1638a31ed3a8157.png)
![[Diagram]](../../diagrams/24/38195b84cdcf8b43403044e6d25881b2.png)
![[Diagram]](../../diagrams/0/6ea503b0d777116f4cee2345ea054bdd.png)
![[Diagram]](../../diagrams/33/9d70af16c5414d60966a05cbfad2ae14.png)
![[Diagram]](../../diagrams/2/55e7a6fbd62cb0e4698b197fd1f32b34.png)
![[Diagram]](../../diagrams/37/b79781a14dd061e1de3cb80d700b9605.png)
![[Diagram]](../../diagrams/23/735fe4ccb4fe5bbeb688ac26699c5f92.png)
![[Diagram]](../../diagrams/26/b163fad274c270f0ced5e149e09ce66b.png)
![[Diagram]](../../diagrams/51/d49abe57a9de2f34226035a8252bd936.png)
![[Diagram]](../../diagrams/11/40d1815f7a91fbfd1bcac59226a2ea1c.png)
![[Diagram]](../../diagrams/11/3242ab6c53ceeace95e078ba4d8fa0ca.png)
![[Diagram]](../../diagrams/36/ecad8811cb40759bd5e12748895f680f.png)
![[Diagram]](../../diagrams/0/a5db0cb3da17a06f33cd29640e84e33f.png)
![[Diagram]](../../diagrams/23/42aed1140a009f1fa1b79e46027f56ba.png)
![[Diagram]](../../diagrams/3/5c7c3cb31133c39f708a15a9bf0379a3.png)
![[Diagram]](../../diagrams/24/53c2b82b2475dcc91c2944a289f260d7.png)
![[Diagram]](../../diagrams/16/23f4d3266157dee31bd4a21b4f01c9df.png)
![[Diagram]](../../diagrams/40/cdddcd1bfe2e43dac6bab2ff39c72b59.png)
![[Diagram]](../../diagrams/26/68ae710b8022700011f4aeab16678db6.png)
![[Diagram]](../../diagrams/21/c6273a9d4d12d5d52fcb09674fd4f7d1.png)
![[Diagram]](../../diagrams/27/55c081129b58cb1a1e2f4cbec4989aba.png)
![[Diagram]](../../diagrams/27/a4cfc047749f84f80642e208d1a6afb1.png)
![[Diagram]](../../diagrams/47/c3e1bc847557506a768b351b5b13209a.png)
![[Diagram]](../../diagrams/4/c0e0419881b4e522ec677e7dac833914.png)
![[Diagram]](../../diagrams/49/a3965bd24bd0462756f3c4d42a0a98a9.png)
![[Diagram]](../../diagrams/19/df83fe5c6a65b14c1ecb86eed7f43262.png)
![[Diagram]](../../diagrams/5/fe037f916e0fd6d8df708091b011bec7.png)
![[Diagram]](../../diagrams/10/13262dbc7c27913f5fa25b7ea0cd5d6a.png)
![[Diagram]](../../diagrams/52/dc373cb39c407b4a61e5b5dbd3d8a73e.png)
![[Diagram]](../../diagrams/38/7bfeecefe35b7c8dcbbf53c7a85515b3.png)
![[Diagram]](../../diagrams/46/ab127e22ec075c649ff1579852ef803c.png)
![[Diagram]](../../diagrams/7/2aeda795d60bd73505cae97ece03b402.png)
![[Diagram]](../../diagrams/51/5c21ca3d61fccfa317c53aceb855138a.png)
![[Diagram]](../../diagrams/6/177909968749a588160328d0490be59b.png)
![[Diagram]](../../diagrams/0/fca00c13d039afa668326f839a7ad2b7.png)
![[Diagram]](../../diagrams/9/5465193d9782c03b07b0912b1b8f8ff6.png)
![[Diagram]](../../diagrams/26/20cd754dc8a817a40fa2034937b0a9ac.png)
![[Diagram]](../../diagrams/8/24d74069090d0a29a5639a00e71e3262.png)

![[Diagram]](../../diagrams/27/fc9141ae4ab9089fd8d712d67a973137.png)
![[Diagram]](../../diagrams/29/c01d53748c6443a62ddf123bc16de072.png)

![[Diagram]](../../diagrams/24/17e8f9a76fc0650f941da47eb70d5b46.png)
![[Diagram]](../../diagrams/8/f1e5b3687e2948606f9ff47804d7c7a4.png)
![[Diagram]](../../diagrams/35/1cbd8e32286a766d3a692f26cacf2fc3.png)
![[Diagram]](../../diagrams/36/afe736035fff9fef08b93165640678f3.png)
![[Diagram]](../../diagrams/45/fe24dde5e3d5f6bf0651f15ab28024fb.png)
![[Diagram]](../../diagrams/26/5413cc1396dc09194357f6028bfa9c38.png)
![[Diagram]](../../diagrams/33/87d3325cb8b721d9ee51396e022b9ec6.png)
![[Diagram]](../../diagrams/51/a1eed1deeab0f45afa2f0dbb052d8615.png)
![[Diagram]](../../diagrams/8/cca6d2392f11405059fc11a9633c8aa2.png)
![[Diagram]](../../diagrams/0/ee5ee66856b31c18057e2a900961d940.png)
![[Diagram]](../../diagrams/7/ddcb18a478297b9195b9acdfed9bb279.png)
![[Diagram]](../../diagrams/32/f4d503bff21b0ae4bdbe991453c2f899.png)
![[Diagram]](../../diagrams/50/3a4aac394f2cd508792bc4ab9e68c635.png)
![[Diagram]](../../diagrams/31/8b3e931242981eb747ab82f2ab891a23.png)
![[Diagram]](../../diagrams/5/f7364cda30ff459de7c3925b2424742b.png)
![[Diagram]](../../diagrams/18/56ec8816b7bd93736c8c84a57ce84ed9.png)
![[Diagram]](../../diagrams/33/9877eafe4688c1d4631cee7d33801b78.png)
![[Diagram]](../../diagrams/21/047a5b204acebb65413d7db885c03601.png)
![[Diagram]](../../diagrams/49/e14bb8eef5fdbb913f84c635dcdf7f5b.png)
![[Diagram]](../../diagrams/2/7bae29b70a81fc2bd3c211f055cd931f.png)
![[Diagram]](../../diagrams/21/d45e072e20817b2095e322855ce8677d.png)
![[Diagram]](../../diagrams/5/131b7b96c8d8d04d61bcc5fcf47dc319.png)
![[Diagram]](../../diagrams/44/4e73d02098d04bb7a7bddf6f6449333f.png)
![[Diagram]](../../diagrams/12/58170284079e78c761d41615b16c940b.png)
![[Diagram]](../../diagrams/24/60466df63589b22fcb74e148ffd8742b.png)
![[Diagram]](../../diagrams/50/fd5c4d728d72f1b131b0a2f339966da6.png)
![[Diagram]](../../diagrams/28/d2ab63fb3d94e95ced2005d0b7130869.png)
![[Diagram]](../../diagrams/26/d13d61afd66b4b0a2e125da432df53a2.png)
![[Diagram]](../../diagrams/19/10eace531239c3ae8af4722fd1e565d8.png)
![[Diagram]](../../diagrams/28/5dffd712eea803ec3d086d9497064985.png)
![[Diagram]](../../diagrams/21/b14b538f5d9567ce2c84c3a01f74a6db.png)
![[Diagram]](../../diagrams/27/b21f724f2736d34f1a56e7279a36bf4b.png)
![[Diagram]](../../diagrams/47/c39afb23ac92d95d5e623e9ef021e6a3.png)
![[Diagram]](../../diagrams/50/909d5e1aebbab38adbaa9354e412a785.png)
![[Diagram]](../../diagrams/39/ced1d227be776365aa8401aab2fabd7e.png)
![[Diagram]](../../diagrams/46/0173de2f3b461099a69307bba2a2570a.png)
![[Diagram]](../../diagrams/52/aabd291e4b79ca1fe16c9a7bda1d4c48.png)
![[Diagram]](../../diagrams/1/0326c94c8808295925ff22ec817f1e47.png)
![[Diagram]](../../diagrams/36/636005a18546a186ea9ced4aa7de2c5d.png)
![[Diagram]](../../diagrams/45/a414da583d73b338fa9788368c8a1efb.png)
![[Diagram]](../../diagrams/12/e76b9e2b36de88d0702e9e102451a42d.png)
![[Diagram]](../../diagrams/25/c15c5410df0d724122b0e4cf27950edc.png)
![[Diagram]](../../diagrams/19/89abfd22f4bf63a0559b23bccdeb1908.png)
![[Diagram]](../../diagrams/45/c42cfc553b08d495d615d68e63284cc8.png)
![[Diagram]](../../diagrams/8/7185c6ac094412bc67d5a91763fa89ca.png)
![[Diagram]](../../diagrams/37/5da13695cbf5e000cfa5738724b861c9.png)
![[Diagram]](../../diagrams/24/ace35cfbb35455194c93322289b257eb.png)
![[Diagram]](../../diagrams/37/c5b5d601eab0d7c9b04ee2390d4cd971.png)
![[Diagram]](../../diagrams/21/4765165edae1714554885643f36fa7c1.png)
![[Diagram]](../../diagrams/17/c100b250cdb71843a627c44ee3edca03.png)
![[Diagram]](../../diagrams/12/fa470ee0dd1d74248095f293df619581.png)
![[Diagram]](../../diagrams/8/f51fe92260c5335df8c211bb8f2e8767.png)
![[Diagram]](../../diagrams/3/cda0dd92a1e040d2d5821564d8a81c16.png)
![[Diagram]](../../diagrams/24/8070ff8097fc81927e98cb3be3012a5f.png)
![[Diagram]](../../diagrams/4/b13616f75c0f61e8b93690d1c72cbd8e.png)
![[Diagram]](../../diagrams/5/4f018d50d3c2164bc5ef818e6e142e78.png)
![[Diagram]](../../diagrams/3/e7d3c11902aefb6485a842d54dc3b7ef.png)
![[Diagram]](../../diagrams/44/0cfb4223ac6753ad93ab7f12f0e1c305.png)
![[Diagram]](../../diagrams/2/cfe175923601eb91849ccff6591081d4.png)
![[Diagram]](../../diagrams/36/737cbe62e960f732e729b5e875796e49.png)
![[Diagram]](../../diagrams/14/b2b6fbbbc855fdcf1315d6ff285e0446.png)
![[Diagram]](../../diagrams/2/3b9ad6b01da06e3708c2baa600d10c9e.png)
![[Diagram]](../../diagrams/23/765af9019b1bde0b89536f03d9c8e113.png)
![[Diagram]](../../diagrams/26/0f8014596346550fa3aef92ceed7d492.png)
![[Diagram]](../../diagrams/31/fffa99498119a39a15bc527bc04f463e.png)
![[Diagram]](../../diagrams/6/2313214e6c18225fcbc5de2521ddbe79.png)
![[Diagram]](../../diagrams/13/f598c81b88c2bfa362e17da94d139ed8.png)
![[Diagram]](../../diagrams/9/e9b568ca8f334a3f53b67d64fb9c4a94.png)
![[Diagram]](../../diagrams/6/181fb9f86c71081e3e176ff1eeddc5c7.png)
![[Diagram]](../../diagrams/51/423e7283417f6f7c9f91968ab9a7c43d.png)
![[Diagram]](../../diagrams/29/eaa5fa88abf9f87d56e1e6096986eb9f.png)
![[Diagram]](../../diagrams/1/faa564a53bd338a3519f832a9bddb37d.png)
![[Diagram]](../../diagrams/28/8f150699c34bdd02c4393eaf465305d6.png)
![[Diagram]](../../diagrams/15/cf2ca050f02dfaff83b3c6c6069eaab8.png)
![[Diagram]](../../diagrams/32/4315a7a3b6816d7c8ba6b1578df6a645.png)
![[Diagram]](../../diagrams/30/fbc17c2cb65257116daaea9a2e6e67fb.png)
![[Diagram]](../../diagrams/1/c7de22af9ea483b84ecca4c674e1a5f6.png)
![[Diagram]](../../diagrams/9/d3cddac056a4c44b4b6e25ac81332f61.png)
![[Diagram]](../../diagrams/10/efb226320f90fc3d1df80bdc8b4bd688.png)
![[Diagram]](../../diagrams/29/0a27aea227cee06d96326114d34a73fd.png)
![[Diagram]](../../diagrams/38/0ae9ab4d7e7063b981a266a148db819b.png)
![[Diagram]](../../diagrams/45/fb9f09efb612033157601eb7505fb585.png)
![[Diagram]](../../diagrams/20/e9024869fb5647c8b579862c55db23a5.png)
![[Diagram]](../../diagrams/50/7b36faacaef03f3c757ff37261bf9816.png)
![[Diagram]](../../diagrams/0/16afc1d2c12904a29afc1b615a40a382.png)
![[Diagram]](../../diagrams/15/10e0791be34ccb50a1525a6724bc7f52.png)
![[Diagram]](../../diagrams/31/71c66da1253b0c221986fc6c5dc9bbb0.png)
![[Diagram]](../../diagrams/51/8c57e02982de9d15432bf151af87637d.png)
![[Diagram]](../../diagrams/28/c9d1d07e450664181acdbc76d1db0b8c.png)
![[Diagram]](../../diagrams/21/bb38dffd85f40aad80380e372253eabe.png)
![[Diagram]](../../diagrams/15/dd8e88bf2f645d9d335ffe29c4dc14bf.png)
![[Diagram]](../../diagrams/47/ddce352bf3efab6f29959efb5098cb78.png)
![[Diagram]](../../diagrams/2/6a19d28190b6311b59242a9cf44d2e84.png)
![[Diagram]](../../diagrams/25/8624b1fbf08ad084581de99424b69b9b.png)
![[Diagram]](../../diagrams/6/8ae185aeab7ce67355e22fa46efedac4.png)
![[Diagram]](../../diagrams/0/11bac6754c6a8dc9e53ca2bd6d6eb4a8.png)
![[Diagram]](../../diagrams/8/5f92a2cb7ddfa31fcdea82da40f9e7b7.png)
![[Diagram]](../../diagrams/0/beef92d9f75113ff7aa619b737155673.png)
![[Diagram]](../../diagrams/18/d14be518a794d8a349ea34bb8434f967.png)
![[Diagram]](../../diagrams/37/ca28b69545a3c790d972ea32928f03bd.png)
![[Diagram]](../../diagrams/12/cf7a7a6e15fa77106fb9ee28f9762448.png)
![[Diagram]](../../diagrams/10/884f6b9af455f410bcff64dc6194ff8f.png)
![[Diagram]](../../diagrams/20/5b5c18a342eee0796b8ccb70075c7c95.png)
![[Diagram]](../../diagrams/47/835fcdd4250f5970582ab06a962246bd.png)
![[Diagram]](../../diagrams/37/29a87be7d9a97e163b2d1869ace42ebc.png)
![[Diagram]](../../diagrams/40/c65e0aa6b4602775e2920b9b9dc704fc.png)
![[Diagram]](../../diagrams/22/f41c06685e1f10b6410ef3b302ed500e.png)
![[Diagram]](../../diagrams/38/715eeeed5b00559a84bccec7aeebd5b1.png)
![[Diagram]](../../diagrams/52/c2108edd045c66d956549cf1b431ac43.png)
![[Diagram]](../../diagrams/49/d700946876c889b39a75374f2f5e31a8.png)
![[Diagram]](../../diagrams/29/2f901896ab95e2e2f4cc4e88e8ad18ec.png)
![[Diagram]](../../diagrams/47/69ca88704371e0b5ca211f54c0b481a1.png)
![[Diagram]](../../diagrams/10/dddfebef6acc45bc6b27fb3c667e4773.png)
![[Diagram]](../../diagrams/31/10ecda639fcc668d9e26b9b00e63216c.png)
![[Diagram]](../../diagrams/29/9505e280e97bf4f9b5ab14b274a7c5fd.png)
![[Diagram]](../../diagrams/20/d69ac74f3533732c05dbbaf68d6be1f0.png)
![[Diagram]](../../diagrams/29/9449ba3b674a651edd5569c636ab267d.png)
![[Diagram]](../../diagrams/44/a1b1c557b08bc0b76199779fbc51a52d.png)
![[Diagram]](../../diagrams/8/26ca3fc16d003c94de94be8882c3e565.png)
![[Diagram]](../../diagrams/43/f2c0dc9981f875e5964e52b8a4c62c8c.png)
![[Diagram]](../../diagrams/25/f67e1603311136bdb646234b9e8d4491.png)
![[Diagram]](../../diagrams/22/81ca4e6bf015f441f4e79ceadb15eebb.png)
![[Diagram]](../../diagrams/1/fe8e1b7b5d6dc2da1f757c2f9588c1af.png)
![[Diagram]](../../diagrams/34/fa70088064b3096172471a6e17fd5de0.png)
![[Diagram]](../../diagrams/3/0b10b84372268f8892a2cd680f195a78.png)
![[Diagram]](../../diagrams/36/862423db6763089d134e632913efcca8.png)
![[Diagram]](../../diagrams/8/d688fd31ae7cbbc5128182c8d11e59e4.png)
![[Diagram]](../../diagrams/14/c9c1b22dbfa38ca3bb9e542a7eed0777.png)
![[Diagram]](../../diagrams/43/3b15c210109cf8c31b459ad11edb9920.png)
![[Diagram]](../../diagrams/37/f877330a84ce8b0c0622da8316d9d3d4.png)
![[Diagram]](../../diagrams/30/7d97f64813bf57b29c06023a0dd40d71.png)
![[Diagram]](../../diagrams/27/74bd88a027b0408834e939e49cdb10c4.png)
![[Diagram]](../../diagrams/52/1706d87b9c4bded5480b87edfcba5b57.png)
![[Diagram]](../../diagrams/7/b3ed6d9e3f5c882072faa3a389a5ff3b.png)
![[Diagram]](../../diagrams/23/12fa409618d475c2de4f66d8666d29e4.png)
![[Diagram]](../../diagrams/47/8170e992700d30127832adc28e590ebe.png)
![[Diagram]](../../diagrams/19/39cc8c3384b0afbd5fcb607eea8a60ed.png)
![[Diagram]](../../diagrams/46/c6d3f960d297799a141b748c035a7d32.png)
![[Diagram]](../../diagrams/15/efb48672386b4734e4994f009995575b.png)
![[Diagram]](../../diagrams/20/94ed8227a1689a6c57d88a5b15020586.png)
![[Diagram]](../../diagrams/11/f58a6402568360c40cfc1a564a7ad43b.png)
![[Diagram]](../../diagrams/44/a27da3107e8d022a051320f278db8f7a.png)
![[Diagram]](../../diagrams/3/2a61961b0068f7750729236aa183bb0f.png)
![[Diagram]](../../diagrams/48/eb4145e99329e82505f69679c3168543.png)
![[Diagram]](../../diagrams/49/f2c359ebfbcfea0c606d9a9ea7d6a660.png)
![[Diagram]](../../diagrams/44/c2647bf070017b9dbbcac8f397cdcfcd.png)
![[Diagram]](../../diagrams/30/a6d4611600ecd2067a46be126a877286.png)
![[Diagram]](../../diagrams/2/602f658b057e1e76bc917b37506d90aa.png)
![[Diagram]](../../diagrams/52/5814f44863b448422b489c2f412c0116.png)
![[Diagram]](../../diagrams/0/6a109a6b9329ea6eb316830ffdcf5015.png)
![[Diagram]](../../diagrams/12/51252da81ac332db0deda4d5eefd134d.png)
![[Diagram]](../../diagrams/51/e48d4f9554a9ee2e1dccfc71f8d7c4d8.png)
![[Diagram]](../../diagrams/39/93cdc3452eb07f649813afcd99f20f6d.png)
![[Diagram]](../../diagrams/38/8b991745827a8750b769d491ad0792ed.png)
![[Diagram]](../../diagrams/43/8218c8c7a3be8c439857eeca051fb779.png)
![[Diagram]](../../diagrams/50/a2e5c025985645bbfbf47525d282f6a3.png)
![[Diagram]](../../diagrams/37/bc2c16baffaa389a8d56697def15fb07.png)
![[Diagram]](../../diagrams/41/3358d00d4395e5206af40cb7d05bee70.png)
![[Diagram]](../../diagrams/32/700caa3b8ae7451780338309f3060588.png)
![[Diagram]](../../diagrams/35/e68eb0a3fb2603ef2b7d372953d0e9a5.png)
![[Diagram]](../../diagrams/48/97119bd623215f59a09dadc91953f6bb.png)
![[Diagram]](../../diagrams/46/3b565566b1bb52f3da1eac8c397b5cb7.png)
![[Diagram]](../../diagrams/43/0c346db4ff58824602fd5364463ea235.png)
![[Diagram]](../../diagrams/24/2d617ffe3ac4bffed2d3ddc801b56f1f.png)
![[Diagram]](../../diagrams/36/8f780617cbec486543f5003d9d1732d0.png)
![[Diagram]](../../diagrams/17/835a79e87c927fbb60c2c728c3253721.png)
![[Diagram]](../../diagrams/19/109583905c878543ee364f4c6b01a220.png)
![[Diagram]](../../diagrams/10/21c4c55893fd582b62983c07aa255b0a.png)
![[Diagram]](../../diagrams/43/e17d1cda1b900bfc7e4b7f8e0463f522.png)
![[Diagram]](../../diagrams/44/9fae0c160d0c56017229c28b84b50e61.png)
![[Diagram]](../../diagrams/52/e8de473853d649d15e7179edb986933f.png)
![[Diagram]](../../diagrams/24/24b0ab8c856d4ed6131ab89230aa938a.png)
![[Diagram]](../../diagrams/42/fbdc31b9ea6913af52dbc146fc5ea1f5.png)
![[Diagram]](../../diagrams/32/15303689d0be64b8f627dfda5d3a37e5.png)
![[Diagram]](../../diagrams/2/75e1137592079742b14661d855a2685a.png)
![[Diagram]](../../diagrams/7/def54ae9bec149cf6a647850e4f73519.png)
![[Diagram]](../../diagrams/32/e620ebff059df593c8290b33d06edc29.png)
![[Diagram]](../../diagrams/40/a7dfd1ae3ed8ea266fd47c145b7a8ff7.png)
![[Diagram]](../../diagrams/51/3ad3ee2fde625e263466140f02bc254f.png)
![[Diagram]](../../diagrams/12/9251f40b56cdf8e587e991f7583989e9.png)
![[Diagram]](../../diagrams/30/ca7f002e22cf2b137569464cac0a7da3.png)
![[Diagram]](../../diagrams/1/e15c649c189983154c788a8346c77b55.png)
![[Diagram]](../../diagrams/2/485c9cc3027f5096a41364285cc02f32.png)
![[Diagram]](../../diagrams/5/40a753cfbf43e81e2e6ba114164edb8a.png)
![[Diagram]](../../diagrams/19/5b6faef3f2e89d0ae8d3aa166025cde8.png)
![[Diagram]](../../diagrams/41/dee244ccd8da84e9cd7073171d53e3b1.png)
![[Diagram]](../../diagrams/12/558ee9059552b475e654688760fdf726.png)
![[Diagram]](../../diagrams/13/9fbdaa0c8ce7093a7c9aeab43ae830a9.png)
![[Diagram]](../../diagrams/1/0e277e34c397ab72282b4c3cce9ea21c.png)
![[Diagram]](../../diagrams/44/a9f7b5ca289b9d308d30d070027bbab1.png)
![[Diagram]](../../diagrams/25/65c1747bf3a8ea437f0387812bead218.png)
![[Diagram]](../../diagrams/5/c913bea5f63d37c8a80ef9375cf81e4f.png)
![[Diagram]](../../diagrams/9/9f4ad72d4550b752edef62283ea3a1d2.png)
![[Diagram]](../../diagrams/26/c48491755fe10b18a6efc2c7b7d0a37e.png)
![[Diagram]](../../diagrams/18/8b9f801e604e10fc62144487fd165bd5.png)
![[Diagram]](../../diagrams/7/3a96b731ce0cc6e6c55e355d05ec162a.png)
![[Diagram]](../../diagrams/33/f094bf4719970bc1ffc589d325da45ab.png)
![[Diagram]](../../diagrams/32/8c1a95f5851e224e3a812f8d3ca9fc6e.png)
![[Diagram]](../../diagrams/25/192241beb9a983e7b3019ce05590f4dc.png)
![[Diagram]](../../diagrams/23/9ee9f60020308b4c7bd46c75dd5f950d.png)
![[Diagram]](../../diagrams/24/25d9e3da55b1349f6598c9d249cdfd53.png)
![[Diagram]](../../diagrams/19/55721aa8dc5e2b61cc4b231418167669.png)
![[Diagram]](../../diagrams/47/1780285d50dad8560ea74353a5b703cc.png)
![[Diagram]](../../diagrams/44/f8e7bf92015afecf1f87357abe06e9b5.png)
![[Diagram]](../../diagrams/43/bb4e12ddd7c206f3cf0554e075553deb.png)
![[Diagram]](../../diagrams/47/063c2437c1130df0003c4612f152117a.png)
![[Diagram]](../../diagrams/10/d5478dadad4304739b35f186b61f0a72.png)
![[Diagram]](../../diagrams/50/330fb81ac741d32520e528178644bd29.png)
![[Diagram]](../../diagrams/32/187a7490080c9ad1aa591e86cd832941.png)
![[Diagram]](../../diagrams/46/72ca2b665693abc1aa3304523f6cb9b4.png)
![[Diagram]](../../diagrams/19/dcdcd0c3d8edea6631370fa0a9d5061e.png)
![[Diagram]](../../diagrams/31/8e13e2da19673cf0acdf445a1a47acfe.png)
![[Diagram]](../../diagrams/6/d58ff37868c67fa72fb7ed8a96d4c443.png)
![[Diagram]](../../diagrams/44/2c8dec307198f9c2c8cb8a917aff7412.png)
![[Diagram]](../../diagrams/39/7e021fbd3d6cc27d00c2f20b69919649.png)
![[Diagram]](../../diagrams/23/260a806690a93abe4e1417380bb76315.png)
![[Diagram]](../../diagrams/22/7994e91e3f4fd67854c589e08bbdcd9a.png)
![[Diagram]](../../diagrams/43/cc6f681850d48a26bfab9a015ba2bb4b.png)
![[Diagram]](../../diagrams/27/9414b6c54e7585d6674c8e79b9e5c1fc.png)
![[Diagram]](../../diagrams/20/fc4648de3e2e529e5d25c46886b5989a.png)
![[Diagram]](../../diagrams/48/abf52ad7cfae66a92450ab8b3ff7710e.png)
![[Diagram]](../../diagrams/32/c6966aa4526f827792eaa0ece2d8d292.png)
![[Diagram]](../../diagrams/35/3bece1c1ed747875641916d838f49f96.png)
![[Diagram]](../../diagrams/42/0bd74a269130a5b17978259befcfe873.png)
![[Diagram]](../../diagrams/46/2d6ed61a488678d75a6f869dbf1ba4cf.png)
![[Diagram]](../../diagrams/3/3e7f960a6de91c46c7db474dd8e6dc22.png)
![[Diagram]](../../diagrams/52/cd8855affcd71491bd6d8bb3654856c2.png)
![[Diagram]](../../diagrams/2/46c2db5b83bae0505effab5d8be698b7.png)
![[Diagram]](../../diagrams/27/1ab94625e7dff8cd114af262937c8c96.png)
![[Diagram]](../../diagrams/13/db295fc799198e579d2da237073f4fad.png)
![[Diagram]](../../diagrams/24/99943e387728698d93af1bc990fe75c7.png)
![[Diagram]](../../diagrams/10/674af98809fabc684aafd1f465ce642d.png)
![[Diagram]](../../diagrams/15/8c2c06ef004a5718b45a3b682a221f1d.png)
![[Diagram]](../../diagrams/17/5dea4ac2ca854acb574caab9c7813138.png)
![[Diagram]](../../diagrams/40/e719d41c53a40e3df252e2766b408a3d.png)
![[Diagram]](../../diagrams/19/3dedc25581f62b61eb9809750b1389c8.png)
![[Diagram]](../../diagrams/33/e607eae6779e53594b29f4b8d7b6fcc4.png)
![[Diagram]](../../diagrams/19/73175cf758b1c9897bc3cc7583351c6a.png)
![[Diagram]](../../diagrams/44/d3e352f74acc44a1cdd821edcd0d31f2.png)
![[Diagram]](../../diagrams/5/a5030626e0f5a6b000acfbd04179b5ba.png)
![[Diagram]](../../diagrams/21/a537d17556eeba19c051919e66aaedb1.png)
![[Diagram]](../../diagrams/37/3f488070c5628cfcff4aed3106c49cc6.png)
![[Diagram]](../../diagrams/12/b04e27f2fe98ba123ac4712716f9ecf8.png)
![[Diagram]](../../diagrams/17/c3c4f9493bd77e71db1267a5b77f08bd.png)
![[Diagram]](../../diagrams/44/b82cc5538a594b00456298f162d25bc1.png)
![[Diagram]](../../diagrams/49/f43d995b3399b95b5e7c8b6d00523955.png)
![[Diagram]](../../diagrams/29/05c896d8d06951f6e39fbd08649ed20d.png)
![[Diagram]](../../diagrams/3/741617e364897de29d2e49736814c400.png)
![[Diagram]](../../diagrams/28/6454de20aa97e5f63568e973f34be895.png)
![[Diagram]](../../diagrams/43/cc5324153371cbd60f6540f513c2ec09.png)
![[Diagram]](../../diagrams/15/5d0e3f2545a59e6bfdb6c182a70af191.png)
![[Diagram]](../../diagrams/22/ed4a98bd73ecdf7ed3ac3467817118b1.png)
![[Diagram]](../../diagrams/29/8ab83e340f2aa81ef68cfbd8cd05ac7a.png)
![[Diagram]](../../diagrams/5/2af83046c7761c3dfce8121da0f3512f.png)
![[Diagram]](../../diagrams/36/80ebf739cc7bc050a6fce980f0125f79.png)

![[Diagram]](../../diagrams/41/3f2ad05c8fbb4fbc7ce0bf9aa860225c.png)
![[Diagram]](../../diagrams/36/34d920558afbd4018575ca474cb33e73.png)
![[Diagram]](../../diagrams/33/8babed640085c8afa9188be6267922bb.png)
![[Diagram]](../../diagrams/20/48e5bbf85d5042dc72b3f954374392fa.png)
![[Diagram]](../../diagrams/6/94c55cded5fa459254859c45356faabe.png)
![[Diagram]](../../diagrams/50/7c5b10626803e4d1b4d5c390c410ddf4.png)
![[Diagram]](../../diagrams/41/fa9705e9122f20a1a71b680d48712322.png)
![[Diagram]](../../diagrams/9/235bd7f5ebcc917395d6e4c5912497b2.png)
![[Diagram]](../../diagrams/6/fa39093fa4113fdb78fe816e9735d3ed.png)
![[Diagram]](../../diagrams/13/edb49009db8b19aaa1461851b0720b18.png)
![[Diagram]](../../diagrams/21/fb2caf756cfdb25c4794df2a1e9e110d.png)
![[Diagram]](../../diagrams/8/b83530602f5b7c44c387201cff8f8d4b.png)
![[Diagram]](../../diagrams/7/6801abfb7d45466c9d5d25cc89a64e55.png)
![[Diagram]](../../diagrams/23/b131edb7668bbe18b660e31942fd59ad.png)
![[Diagram]](../../diagrams/0/8f25e75088275a9bc04b9d6dbefd8a2c.png)
![[Diagram]](../../diagrams/50/3ceeb4fc1b47556b7e350c33b471621e.png)
![[Diagram]](../../diagrams/8/23322163b3ceb72f96cb3929427098b5.png)

![[Diagram]](../../diagrams/48/4af402c8f7881c3e5db180d2b2b5eed0.png)
![[Diagram]](../../diagrams/1/03b8e19463fe84f69ac66f1d02b3d8cc.png)
![[Diagram]](../../diagrams/18/3828fe31c3373f35d6f03dd5156f593d.png)
![[Diagram]](../../diagrams/49/bf3ec004a88065d429349cdf7515faa1.png)
![[Diagram]](../../diagrams/38/0640c302d77b2f636682f4c41059b37a.png)
![[Diagram]](../../diagrams/3/acbe95ef24e34f868b46134f5670d0de.png)
![[Diagram]](../../diagrams/14/fc3b3b02c169a2e2d69af2a7d93c5205.png)
![[Diagram]](../../diagrams/39/3293dfd8353fdca41dac1c777e1d77d2.png)
![[Diagram]](../../diagrams/41/cc6a4cbda44c3349adbc12aa7d9c7ee6.png)
![[Diagram]](../../diagrams/51/75a7b2b0b6890ff714b977d3cf804d7e.png)
![[Diagram]](../../diagrams/36/4349d944e05879c62a53194b7a8b1cec.png)
![[Diagram]](../../diagrams/15/fb73853ddbd270f26e7c97e33898695c.png)
![[Diagram]](../../diagrams/49/219f7785085d8b911b40b496f9510ad6.png)
![[Diagram]](../../diagrams/0/7533aa238d2a7981d9c839e88c8043aa.png)
![[Diagram]](../../diagrams/44/88e9dad39aec9578e0672f63d097ef5f.png)
![[Diagram]](../../diagrams/43/2699fb30c67a6b092a2147dc85631287.png)
![[Diagram]](../../diagrams/16/7937c401e29431b316102e2bd6667729.png)
![[Diagram]](../../diagrams/4/004d2dc4ce94ba2bf44b2c85acbc0a4f.png)
![[Diagram]](../../diagrams/50/a324ac3c7b74db03b469c38235b7752e.png)
![[Diagram]](../../diagrams/48/333135c822feb69aca8bd2236c7af277.png)
![[Diagram]](../../diagrams/29/d10edb4445cac8a1ac114afba6bc3fc2.png)
![[Diagram]](../../diagrams/36/c47ff282e7ca0de6175d53b0f2ea3771.png)
![[Diagram]](../../diagrams/50/b4152523673d7ee5b4446f98e6b78731.png)
![[Diagram]](../../diagrams/24/622251605fee56850b51635643cf3213.png)
![[Diagram]](../../diagrams/52/9ed9b4e9c1e6c2ebf0a4f902f3a7c21e.png)
![[Diagram]](../../diagrams/33/fdaebf3badcd2d58282a50d56e2df4aa.png)
![[Diagram]](../../diagrams/45/2f9e8d07a2040f5319a65068fc712fe7.png)
![[Diagram]](../../diagrams/31/71e598c1661de5d7195d3913d3aa0b0e.png)
![[Diagram]](../../diagrams/22/babace7819639fe3e7e71a56c0f50ca4.png)
![[Diagram]](../../diagrams/36/cc6bff23f8dbad23901b34f95262158d.png)
![[Diagram]](../../diagrams/2/e91e430f16eaaa2fd7117cbf72abe378.png)
![[Diagram]](../../diagrams/36/b3f3e51690558e6de13f5f16ef99025a.png)
![[Diagram]](../../diagrams/34/edd702b3d5bf2207b4a8c52a7645c292.png)
![[Diagram]](../../diagrams/8/7aa55f099f747f0bcb106df174c1a4f2.png)
![[Diagram]](../../diagrams/52/d3e43c9eaa63b191546ebae7d41a67d7.png)
![[Diagram]](../../diagrams/23/c91d28c9f878794d910caf8947aeee1a.png)
![[Diagram]](../../diagrams/18/9127ca85476a0d7e9c7a8d6a56a2db75.png)
![[Diagram]](../../diagrams/48/5f7e63c07f95ff725983e35ea26deee3.png)
![[Diagram]](../../diagrams/38/1c07ed1a53d88902f3d097d07a414e39.png)
![[Diagram]](../../diagrams/45/7ea8e68da8c777a4ed2abc0b3876d7db.png)
![[Diagram]](../../diagrams/16/87a2afee865c62ce0c61e1ad40a3ed19.png)
![[Diagram]](../../diagrams/43/d70c0be6b0dbd3520882093cf363b6ac.png)
![[Diagram]](../../diagrams/27/92f3eba556b9955ce533a6a1950de586.png)
![[Diagram]](../../diagrams/22/08449f96fb7a25cdd93863494150623e.png)
![[Diagram]](../../diagrams/25/e1b9f2d5f4e7062f2ca11d47f96b7e49.png)
![[Diagram]](../../diagrams/20/ffd4860a643d32014c3ed7ce140d5b3f.png)
![[Diagram]](../../diagrams/0/bb2c07bd562ead7bdb88f274dad9e44b.png)
![[Diagram]](../../diagrams/37/cb006d43b28ad0203d1d400ebda523b3.png)
![[Diagram]](../../diagrams/15/e70aa94c589263e47008effac9165270.png)
![[Diagram]](../../diagrams/19/2ebce4efbb841950f758db2a5881280a.png)
![[Diagram]](../../diagrams/52/f323e110e950f5bca2a9e9921c30ffb1.png)
![[Diagram]](../../diagrams/7/b04cf12671780eb6de780c9df72a8279.png)
![[Diagram]](../../diagrams/34/cff7f900d98f6193d55a0e3e898b2d15.png)
![[Diagram]](../../diagrams/38/9ec8353599a9b714fcf92228784f1047.png)
![[Diagram]](../../diagrams/34/03c6aaaa01d45a33dd31ace26bebeb7c.png)
![[Diagram]](../../diagrams/28/596b14899cf199362dd89994eb925c26.png)
![[Diagram]](../../diagrams/47/ee50679417b8ccbb36557738587293af.png)
![[Diagram]](../../diagrams/23/80b342e3b353aebc66f7d3cd948a8cc8.png)
![[Diagram]](../../diagrams/15/11905824d8527816c8dc311fad197ad1.png)
![[Diagram]](../../diagrams/15/dd4801cfe0fba4a60b855b67ba068f6e.png)
![[Diagram]](../../diagrams/24/bedfcf3d9edd0f0bc97d86f5148a0b27.png)
![[Diagram]](../../diagrams/26/3f76abf714531b2554f30e1024724a93.png)
![[Diagram]](../../diagrams/7/1437ad7f68959b00bf1faf2550c637e2.png)
![[Diagram]](../../diagrams/29/2886acef0678eef7badb7be5d9a58f59.png)
![[Diagram]](../../diagrams/8/f61739c129db9867059a0772e85117e7.png)
![[Diagram]](../../diagrams/26/3a4f1b27c3e78340270716a3c8675afd.png)
![[Diagram]](../../diagrams/36/c96f4d3a3f4167851f826bf3fa1208a4.png)
![[Diagram]](../../diagrams/11/1e1aa0dea8b95919ffad8339904d9c8b.png)
![[Diagram]](../../diagrams/50/a95cd18db4e05f433de5ac744a8631db.png)
![[Diagram]](../../diagrams/12/7b007d501eeec10ac595cc5d26a3ed52.png)
![[Diagram]](../../diagrams/6/8b8ae5c3490b07014f4d5654eb2a7380.png)
![[Diagram]](../../diagrams/51/44cb2f1868beb02c5ee0d596458c190b.png)
![[Diagram]](../../diagrams/6/9548bba26c9d215ba33ab6f01f7cc64a.png)
![[Diagram]](../../diagrams/6/e4caf6c87622bfff05256610a4e9defa.png)
![[Diagram]](../../diagrams/46/83ea1df6d78ddbbc0a9853b1743a6db1.png)
![[Diagram]](../../diagrams/11/bfd1ce5ec08b05b91cee7dbb66f89990.png)
![[Diagram]](../../diagrams/31/8972ee8c4f8fd02c5721f23b0decd1e5.png)
![[Diagram]](../../diagrams/22/e725208bd94d5b52d663f9d3ad133c05.png)
![[Diagram]](../../diagrams/43/e369a071227b176056d3fbfac8ea1673.png)
![[Diagram]](../../diagrams/45/998a5859b9a913a03bba1bb70c99e074.png)
![[Diagram]](../../diagrams/12/532c9ba050daf4a3ce382345dafc4a65.png)
![[Diagram]](../../diagrams/16/810fa620511961ba77606633e740a81c.png)
![[Diagram]](../../diagrams/42/872cac03ed54b50ef1be50767aaed667.png)
![[Diagram]](../../diagrams/40/6e08e067b0811e0b8489fbafc7ef595c.png)
![[Diagram]](../../diagrams/41/2b8553d6deab35da2a217c8578c92913.png)
![[Diagram]](../../diagrams/12/69cf219c44e1af4b91d2a410e2eeb31a.png)
![[Diagram]](../../diagrams/17/9bce1153291d2184f089160dc944ee93.png)
![[Diagram]](../../diagrams/40/9edf6bdfb649e7e178cbee8e6069a104.png)
![[Diagram]](../../diagrams/10/0bb97dc8a6c1a34d64f5e293edc95b6d.png)
![[Diagram]](../../diagrams/14/61fed3d9abd33a1af84a45b89f46c157.png)
![[Diagram]](../../diagrams/16/b7ae3be62ba35ae00eb098444236a37c.png)
![[Diagram]](../../diagrams/49/0872738d183d00148950925f93dc814a.png)
![[Diagram]](../../diagrams/44/e354c81e535b6bc9d57ab04b665281eb.png)
![[Diagram]](../../diagrams/15/92312798b811be1f25c6b4d5d55398ab.png)
![[Diagram]](../../diagrams/38/0bd4c6d829d8ce42f831af08b12f5075.png)
![[Diagram]](../../diagrams/32/1a6d77489a5ef3a807be75e8aa972a36.png)
![[Diagram]](../../diagrams/13/cf0a691bd76998a71aad7857a60b5e2e.png)
![[Diagram]](../../diagrams/13/5d13c6c077ec6a1afb8cb7e2fedb34e1.png)
![[Diagram]](../../diagrams/44/4235c61d337e6c4d80669ead933fb405.png)
![[Diagram]](../../diagrams/49/bda47464428e3eb99c2cab3674639bff.png)
![[Diagram]](../../diagrams/38/d997565ffab3e20799cedb43af476ffa.png)
![[Diagram]](../../diagrams/32/a3ea9b37c940e72a2d914eaad099baf2.png)
![[Diagram]](../../diagrams/27/28978cea10a1a44ecdf575aa04e2b8f7.png)
![[Diagram]](../../diagrams/50/2fd31b42e703a1670f50f4285525ec46.png)
![[Diagram]](../../diagrams/25/7897bb063b47de80e118308237305639.png)
![[Diagram]](../../diagrams/19/604978f6bf4a756cd4b72be40a2fa318.png)
![[Diagram]](../../diagrams/35/d2f44bcc75c0a7db3bcdfadab9fa2330.png)
![[Diagram]](../../diagrams/0/620bd5d48f84d6f8fd304129fa877a69.png)
![[Diagram]](../../diagrams/14/d549c2b906b3cab07bb2c76c3f25de4a.png)
![[Diagram]](../../diagrams/45/343fe3e0cccc47237aaedd85b9744d53.png)
![[Diagram]](../../diagrams/31/5af853280fa7285eac825cc7de6eca77.png)
![[Diagram]](../../diagrams/30/c9aab049091a1c646ead1c2f6c103fb1.png)
![[Diagram]](../../diagrams/41/d623918b0f11699de903317bb4d80816.png)
![[Diagram]](../../diagrams/27/6e013b7773c0ee857a744262a9d94462.png)
![[Diagram]](../../diagrams/25/c88bf3699ea170d7e070722cd3245f15.png)
![[Diagram]](../../diagrams/14/78acebe4c51029a3cefb6c695da503f7.png)
![[Diagram]](../../diagrams/8/6b3215808ff33c10471f2c4369b264e4.png)
![[Diagram]](../../diagrams/47/0331974164c6e211277f21d93b092a8c.png)


![[Diagram]](../../diagrams/38/1859a3f0f91050728f5bf4d2c350bded.png)
![[Diagram]](../../diagrams/52/3c7e4bc1e37555001809d56c4f06e0c2.png)
![[Diagram]](../../diagrams/42/e8688b95cda46cf17cf1b89f8c9c3fca.png)
![[Diagram]](../../diagrams/14/1c10c05ab3857135f8c28c9df36fa5ae.png)
![[Diagram]](../../diagrams/31/32ba3dc4140e71c07b4f07416dc0f1ee.png)
![[Diagram]](../../diagrams/35/29a95f670f825faff2f61265e2c17cbb.png)
![[Diagram]](../../diagrams/39/67724642b317c4c80b015413ca7c4a1e.png)
![[Diagram]](../../diagrams/41/39ee24ca5c9979b25dff61551f43092d.png)
![[Diagram]](../../diagrams/51/c0bdcf29b39e3e1061c6761706f29888.png)
![[Diagram]](../../diagrams/41/d2bd3cb721cfef317b7113ddd2cb8db4.png)
![[Diagram]](../../diagrams/50/4673eaed509739d00f56399e533a487e.png)
![[Diagram]](../../diagrams/27/deea0bbd6188800618a596500473e40e.png)
![[Diagram]](../../diagrams/4/454ef3999c078437de1523f91e35588f.png)
![[Diagram]](../../diagrams/45/52e1e4d7c310bcf644e0ea4184b5a760.png)
![[Diagram]](../../diagrams/35/1c5df11aab939d825840ebb3b5a3defd.png)
![[Diagram]](../../diagrams/42/1000e9435f8c185a2d8e8efdbf5d8da0.png)
![[Diagram]](../../diagrams/21/409727284eb868c191d581ccd20ba371.png)
![[Diagram]](../../diagrams/36/118f13986b0dc8f37f9701e3a7235d71.png)
![[Diagram]](../../diagrams/47/96d11468fa64dfad048a3166cf707f22.png)
![[Diagram]](../../diagrams/7/39d1de872940df25c62e23e1806324ba.png)
![[Diagram]](../../diagrams/36/91dce1258a043351d5836c5428650a7d.png)
![[Diagram]](../../diagrams/2/d8f3e4af4aa64bed499ae52925faee93.png)
![[Diagram]](../../diagrams/45/4df4ce524d1fabcda60e31d76bf4bafa.png)
![[Diagram]](../../diagrams/28/cc73cfae3c1effa6444c33422f02c4fb.png)
![[Diagram]](../../diagrams/50/12ae7171715a8390993586b2ff80ea4c.png)
![[Diagram]](../../diagrams/12/353d0a7ce6901bf41dd9b8d95a22c1a4.png)
![[Diagram]](../../diagrams/13/27e7baf4cbc8636a8d9c00913ddec25f.png)
![[Diagram]](../../diagrams/12/ffdaaa14bfd7a8ed07c8118f2b374724.png)
![[Diagram]](../../diagrams/40/0e2b637c04865d351308cee97fbfb487.png)
![[Diagram]](../../diagrams/47/0b8c1183ca9c061bbd47dfc669d9ca56.png)
![[Diagram]](../../diagrams/48/fb6681313cf4ac3574c3388f4e4a655e.png)
![[Diagram]](../../diagrams/7/55d4af5f88a791732f9f82c88f64e42a.png)
![[Diagram]](../../diagrams/37/3a636dc98a7a149400747a8d2b6467b1.png)
![[Diagram]](../../diagrams/24/23a3f823b4497a6a1d4ace244884baa0.png)
![[Diagram]](../../diagrams/15/1702b1b2b508a6b9624eae9b48665d98.png)
![[Diagram]](../../diagrams/1/b215d99fd198bbe98fd4fe6e6a35dc0d.png)
![[Diagram]](../../diagrams/24/3c4c452e88f14510d830fad211455cfd.png)
![[Diagram]](../../diagrams/6/b6e7a1c920ea26d350d7abeba131a2e4.png)
![[Diagram]](../../diagrams/16/0cc8a1009cd0af684e27b7996ac0f449.png)
![[Diagram]](../../diagrams/24/7e39848936f5f9940164e9618eea32b4.png)
![[Diagram]](../../diagrams/2/118ee0076017364f1c2f399d664a2cc4.png)
![[Diagram]](../../diagrams/52/ecbb80133258174a395b0336a5a322a9.png)
![[Diagram]](../../diagrams/26/585834904721b5fbc60e9eb39a3d27a3.png)
![[Diagram]](../../diagrams/18/864f76096678c6fcc069be6f0358432e.png)
![[Diagram]](../../diagrams/48/3d4391d35d380c5238aa3b3ab78408f0.png)
![[Diagram]](../../diagrams/41/3a728e31dabad27714040f1ee729972b.png)
![[Diagram]](../../diagrams/22/bce3a1b66b6e64bd9f54b5dc6aae055f.png)
![[Diagram]](../../diagrams/18/541acc13d838fb61033d5eeb258fe568.png)
![[Diagram]](../../diagrams/42/c8a313e4c114a0156b7c125b7beb0b16.png)
![[Diagram]](../../diagrams/33/575751c488827622d7491067282bfada.png)
![[Diagram]](../../diagrams/30/ac88c45eade29b6314c4ba210786a3b6.png)
![[Diagram]](../../diagrams/43/3693729ef8eb0544a52507b944be7a5c.png)
![[Diagram]](../../diagrams/6/8f603811dffe46ea5a9b2d9f90ca4add.png)
![[Diagram]](../../diagrams/41/8d2f38db7dc80ce42df564ff7b458a10.png)
![[Diagram]](../../diagrams/49/18bfae4a24384c2568fb23294ad1dbf3.png)
![[Diagram]](../../diagrams/46/69e3b6a00eeb49a384b1d4983c312c02.png)
![[Diagram]](../../diagrams/41/1f287aa0fe76ba9efe3eae3c41c589fc.png)
![[Diagram]](../../diagrams/32/ba3f0d18ea18d78bbf48228511cc6165.png)
![[Diagram]](../../diagrams/30/afbb8ead5bb9e70eb0fb762dfe4a3cdb.png)
![[Diagram]](../../diagrams/32/7eea383847f41d1a12e21acb05a64ac1.png)
![[Diagram]](../../diagrams/18/c8ea24425dce028e59c9bb7fe11cd0dd.png)
![[Diagram]](../../diagrams/23/5fb52f5d391c74cc54b39a2bca8bccc3.png)
![[Diagram]](../../diagrams/52/26013ccf53a56314bc47f9cfa95d9df7.png)
![[Diagram]](../../diagrams/19/da7be1676cb1bf92bf579386c7adbefd.png)
![[Diagram]](../../diagrams/52/2b1a2fdea3a321e248d8c86837a216e3.png)
![[Diagram]](../../diagrams/28/36bbf77dfa513f233e46e95273dd60a6.png)
![[Diagram]](../../diagrams/9/2ce57ea71dafbef7c4d7da606f94f4a2.png)
![[Diagram]](../../diagrams/41/f1473e63f5bab6bb22ca809b469a90af.png)
![[Diagram]](../../diagrams/38/806369d06999b304e962599ad84d2a3a.png)
![[Diagram]](../../diagrams/38/f44a32f4aaa7332a5a6b6931ef2cb1e6.png)
![[Diagram]](../../diagrams/46/f1986a6d6bbdb36d352edf3ddcc573c5.png)
![[Diagram]](../../diagrams/22/2a9fcbf953135aea84a5e15c4db85c0b.png)
![[Diagram]](../../diagrams/23/fa95086d3432f9ae514ce4f51becff35.png)
![[Diagram]](../../diagrams/28/be58682d757a35345babddf313cab5c5.png)
![[Diagram]](../../diagrams/14/b5adec462a164309c6fcee504e0ad64a.png)
![[Diagram]](../../diagrams/32/c2f87d0e7dcf9831773ce5f629224b93.png)
![[Diagram]](../../diagrams/16/e852bf4ec88715826b51af85a1731709.png)

![[ext]](http://www.neostone.co.kr/baduk_news/images2/wulin1.jpg) http://www.neostone.co.kr/baduk_news/images2/wulin1.jpg
http://www.neostone.co.kr/baduk_news/images2/wulin1.jpg![[ext]](http://www.neostone.co.kr/baduk_news/images2/wulin2.jpg) http://www.neostone.co.kr/baduk_news/images2/wulin2.jpg
http://www.neostone.co.kr/baduk_news/images2/wulin2.jpg![[ext]](http://www.neostone.co.kr/baduk_news/images2/wulin3.jpg) http://www.neostone.co.kr/baduk_news/images2/wulin3.jpg
http://www.neostone.co.kr/baduk_news/images2/wulin3.jpg![[ext]](http://image2.sina.com.cn/ty/o/2003-09-22/1_6-12-44-258_20030922104216.jpg) http://image2.sina.com.cn/ty/o/2003-09-22/1_6-12-44-258_20030922104216.jpg
http://image2.sina.com.cn/ty/o/2003-09-22/1_6-12-44-258_20030922104216.jpg

![[Diagram]](../../diagrams/17/15ea4822a6225fa544e3dd88f5070efe.png)
![[Diagram]](../../diagrams/25/66bfe78165bcc5ac02f019fb184a3c65.png)
![[Diagram]](../../diagrams/4/e9f8f48a4603821ba8ac324f8cf42689.png)
![[Diagram]](../../diagrams/39/74aa7e76529fa70803674431ab363d83.png)
![[Diagram]](../../diagrams/40/367d5d3e7fb9f07817faa410fc0104fa.png)
![[Diagram]](../../diagrams/31/dca40c96bb398fe5e717e57dd9ed2a60.png)
![[Diagram]](../../diagrams/41/a6390ccdbfb3823e648b058e85df7d9a.png)
![[Diagram]](../../diagrams/20/87c21a5b72148ff733449f0ea975267d.png)
![[Diagram]](../../diagrams/18/e66ce0cc4adeda70fb99d13051542fe4.png)
![[Diagram]](../../diagrams/14/3f5f689267af81e6553a73f4ce5de0d0.png)
![[Diagram]](../../diagrams/0/1b7d0e3a6301785eae61897247d8e7b0.png)
![[Diagram]](../../diagrams/37/35ab25558088b2dab6002bf504c4b6cc.png)
![[Diagram]](../../diagrams/15/0477a039df8acb60a7ad9797c29a211a.png)
![[Diagram]](../../diagrams/36/03e3bfd3556449366567e39a64733f01.png)
![[Diagram]](../../diagrams/1/cb20a60dc1f4a9232a4503cdbaf72ca3.png)
![[Diagram]](../../diagrams/6/904381d9b0a204054b6572d0d2e5cfde.png)
![[Diagram]](../../diagrams/48/2fffab04054c40995ac0c0de3f3e34fa.png)
![[Diagram]](../../diagrams/9/1d872142324aeeb5c7bc655d6a849345.png)
![[Diagram]](../../diagrams/39/cd1cdf599493e797561bfaf1722786c7.png)
![[Diagram]](../../diagrams/12/31f32c003b654ac97ced04908a74b539.png)
![[Diagram]](../../diagrams/34/171a44755da076caaadf09d70bb00df3.png)
![[Diagram]](../../diagrams/48/199de0ac6347694023126cb6296141e7.png)
![[Diagram]](../../diagrams/28/349264b00a01258db6f277906c7c755d.png)
![[Diagram]](../../diagrams/15/bbc03c325fdadcfb562c2b89d84e3dc8.png)
![[Diagram]](../../diagrams/50/a3dd46396b0e7cca1bfd1b1bdb474cd4.png)
![[Diagram]](../../diagrams/46/181b664111cd666020d181423c3fce97.png)
![[Diagram]](../../diagrams/11/1e2cf3ab91768374d6f6cba79b5034cd.png)
![[Diagram]](../../diagrams/8/21d6c5473227de5d7df7d5e60a2f8c7f.png)
![[Diagram]](../../diagrams/4/01183c719cffb715c6c6587106024994.png)
![[Diagram]](../../diagrams/0/6e3e3b51932c0525dc8fc9b73d1b7e7f.png)
![[Diagram]](../../diagrams/0/0894007e9dddf65c173a045760870cb7.png)
![[Diagram]](../../diagrams/28/4012a0b17a3594c882994b754e6f3635.png)
![[Diagram]](../../diagrams/26/57a65c15b5e0d7cb85dd81b51285fbfc.png)
![[Diagram]](../../diagrams/49/bf91154f2f3d83a48aa1b94b8af21938.png)

![[Diagram]](../../diagrams/36/98a2ef3656d3405b2353025f11f59456.png)
![[Diagram]](../../diagrams/38/2099f9301d99486258beab6c54143dde.png)
![[Diagram]](../../diagrams/48/c8d15609ec1f9b690250bbdcfbe0e04c.png)
![[Diagram]](../../diagrams/2/ad0eedb2e18d4d3a11a84943b3d7fd15.png)
![[Diagram]](../../diagrams/35/d2c651e6c4d341ee8bf61f24363ee261.png)
![[Diagram]](../../diagrams/23/25560f465d9b267255385516970bc5ec.png)
![[Diagram]](../../diagrams/25/7fb1eb05bb30b2bbb0192309dcfbcbdf.png)
![[Diagram]](../../diagrams/51/fb50246e0281266cd1dab31173ce8b1f.png)
![[Diagram]](../../diagrams/26/60d06ec7f5c10f8a695bc385fa2d1bce.png)
![[Diagram]](../../diagrams/0/3f1d1ffb24e76ff944160e58061834e5.png)
![[Diagram]](../../diagrams/34/45579ab2e269b548cf1e41e8f8a286f3.png)
![[Diagram]](../../diagrams/12/5cdeb7a9906628f63184e3e1d5b54f30.png)
![[Diagram]](../../diagrams/6/e2b84136d4705712465ca622c2b3e772.png)
![[Diagram]](../../diagrams/42/b50b7f73940aae07a67f104253b0eb4a.png)
![[Diagram]](../../diagrams/43/86bd49a0e5b552124a203536b5874453.png)
![[Diagram]](../../diagrams/8/4e1c60d95bf55105a9ecf0be57e0388c.png)
![[Diagram]](../../diagrams/7/1088b1403df672bd30edab45b41d7d28.png)
![[Diagram]](../../diagrams/38/0129ccb49a32a391c2444511d2c60374.png)
![[Diagram]](../../diagrams/27/5db4f7d7002272104bc674badde1f550.png)
![[Diagram]](../../diagrams/27/a3f6fe9fc25fef2b00eedf05c4da4392.png)
![[Diagram]](../../diagrams/5/c668134a96fddcabf7e2af56eebde2f4.png)
![[Diagram]](../../diagrams/29/52f5eb084e43e21aec60bd0cee37bdca.png)
![[Diagram]](../../diagrams/12/809d35ba5129e15d1b34464a4ebb7120.png)
![[Diagram]](../../diagrams/0/13deacf654d0d1a00665f28d7141b0ed.png)
![[Diagram]](../../diagrams/35/e3713523a5899984c38e06e335729b19.png)
![[Diagram]](../../diagrams/18/09dbd7c39e4cd1ebeade797059cb7fee.png)
![[Diagram]](../../diagrams/25/6b4bc173233be741042411cf5f50235e.png)
![[Diagram]](../../diagrams/13/b9f3ae9c8348b3f8d75a36ff613e9b02.png)
![[Diagram]](../../diagrams/9/00faae2b88a02616a08f8d0fe4d51f41.png)
![[Diagram]](../../diagrams/7/f21b8572bbe18e62d7ecc60b24cce401.png)
![[Diagram]](../../diagrams/46/30e12c7380be7d97b6c8fa0398861e60.png)
![[Diagram]](../../diagrams/22/dc910c425770906c6fa1924f9119650d.png)
![[Diagram]](../../diagrams/39/55fc02c8c4f9c2e9dd010eb29d4178bd.png)
![[Diagram]](../../diagrams/35/681b2c95921a753dacf76d8cb09cc855.png)
![[Diagram]](../../diagrams/24/eafaea7f54b40021c5e3b54d803219fb.png)
![[Diagram]](../../diagrams/23/f8f8aeb2d83874325d8e63343e53229f.png)
![[Diagram]](../../diagrams/13/9580da554f00c522116f851a93c331c3.png)
![[Diagram]](../../diagrams/28/f58d10656e2f2e7c9b81caeb51030267.png)
![[Diagram]](../../diagrams/32/2f2f1ee38b180e342056b59f75376f63.png)
![[Diagram]](../../diagrams/51/f02c93447d50767aac83743975788d21.png)
![[Diagram]](../../diagrams/26/3474a764a5e1bd89ac16cc755fa13016.png)
![[Diagram]](../../diagrams/33/9dff2c2b7fa8fcde11410c1c9967d368.png)
![[Diagram]](../../diagrams/20/adba1b770a24d8b3082c78e7d1389a7e.png)
![[Diagram]](../../diagrams/21/d5875d0d42819740b3320a1010ad99a7.png)
![[Diagram]](../../diagrams/32/d765e82f902b305772f40c7b79c7979c.png)
![[Diagram]](../../diagrams/44/3c19e41f0a0c5a13dd0716ef9ec9a061.png)
![[Diagram]](../../diagrams/44/50065cd555cba84f8ca95e40fdbdf5f9.png)
![[Diagram]](../../diagrams/11/9e93833b25a94b9887dfd80ffb7de4b7.png)
![[Diagram]](../../diagrams/2/2ea17e064d5e7a3f79e229416d24b16a.png)
![[Diagram]](../../diagrams/51/fcb4d622853bfa2c5d0ab2d1c9d276eb.png)
![[Diagram]](../../diagrams/23/039719c1553bf52d5374db8eb4010c4e.png)
![[Diagram]](../../diagrams/30/6f179bfcd0a41a6149d0eb75378c60ec.png)
![[Diagram]](../../diagrams/32/a591a66709e9a71341d4f99c04d30b70.png)
![[Diagram]](../../diagrams/23/4b9af3fe6296ef680f190eddaa1468dc.png)
![[Diagram]](../../diagrams/50/a4756c863adeea988002dc655933a294.png)
![[Diagram]](../../diagrams/7/c14ec8088208c7e3489035293cc8ef75.png)
![[Diagram]](../../diagrams/27/1d096650a799a80551ef6915eccab70e.png)
![[Diagram]](../../diagrams/28/5f0bcdef4bb7058b611fcedede9b8c1f.png)
![[Diagram]](../../diagrams/8/41c97830c23b85aee536bdd34275ea11.png)
![[Diagram]](../../diagrams/48/dedc668a8b11c83e0f7ce14597cc7b42.png)
![[Diagram]](../../diagrams/20/57cdb8e52f7a7011e8b3bfb683d9e3d2.png)
![[Diagram]](../../diagrams/46/83a861ed68fc5f34a7c736cc13828edf.png)
![[Diagram]](../../diagrams/14/65d0d69b626ffccf6b8a7097a074ee23.png)
![[Diagram]](../../diagrams/14/16d40d203c39d72e45b73c1100d0fdb1.png)
![[Diagram]](../../diagrams/1/de9b5dbd38c67e8159b11a4f3909b3e2.png)
![[Diagram]](../../diagrams/52/a7ec8418e4befcb40bd539c542a54abe.png)
![[Diagram]](../../diagrams/44/7fb3e3ec801142ab0e3c1f886effeea0.png)
![[Diagram]](../../diagrams/16/4bbc02981677c2a469984e82f8ababde.png)
![[Diagram]](../../diagrams/13/8fcefe2306e1c98832f8a58ad92ad0a6.png)
![[Diagram]](../../diagrams/23/e229abc3c31b30773760524dc25142c5.png)
![[Diagram]](../../diagrams/1/6546c822dada345a229a6c6186aa60b8.png)
![[Diagram]](../../diagrams/37/309e8dc541822b78bcb3c108b07e8ce5.png)
![[Diagram]](../../diagrams/25/fa84f895febcbebd9b349cd5a446ab8b.png)
![[Diagram]](../../diagrams/7/83c977c2adcf747702122c0cf57ed59b.png)
![[Diagram]](../../diagrams/27/33938351a9ccb750d74d53fef2daad84.png)
![[Diagram]](../../diagrams/9/426b2323c0040ef60d8d2715a4307702.png)
![[Diagram]](../../diagrams/51/4bbe669a0daf91f012e949e15cd8dff1.png)
![[Diagram]](../../diagrams/48/94a5529bf2e45638e090417432b72d71.png)
![[Diagram]](../../diagrams/49/50b6944c1c14533af213dbab1676ffb1.png)
![[Diagram]](../../diagrams/39/1e218955ffacbcc8b83541cc4b77dae6.png)
![[Diagram]](../../diagrams/3/e7493b5e14d26f00278f72c4feba2eda.png)
![[Diagram]](../../diagrams/31/dffd71cc901d45be06a7d541c1695c23.png)
![[Diagram]](../../diagrams/34/a8a407ba6d51ad33eb2632d09b75a8fe.png)
![[Diagram]](../../diagrams/19/03840c6bcf45c77e3a5cf503f335561b.png)
![[Diagram]](../../diagrams/13/29f50b1e5bac114666621c10f8773266.png)
![[Diagram]](../../diagrams/5/360d3f480ac58789b8fc71d60ac800ad.png)
![[Diagram]](../../diagrams/43/dff19c2adaa3fe04f38207a247daf296.png)
![[Diagram]](../../diagrams/45/3874ae88773ba1e57781e095eae09f7b.png)
![[Diagram]](../../diagrams/22/00f4de02b5dd3f41db315188428624a0.png)
![[Diagram]](../../diagrams/40/b9868c2a46ef15bad2078f431c423f73.png)
![[Diagram]](../../diagrams/46/4a680c25c2fdfc45001d0f806c76aab9.png)
![[Diagram]](../../diagrams/27/7b4c1dd2d4d9ba5a5951c62e1e70ff10.png)
![[Diagram]](../../diagrams/26/1314b423cd3e50b5510ac495d7cb9c0d.png)
![[Diagram]](../../diagrams/16/0ab2e400fa73e268c37b79f60ab80f73.png)
![[Diagram]](../../diagrams/47/b4465c9d773a5721917afaebf3fe77fa.png)
![[Diagram]](../../diagrams/7/36f80f545ada80eed97f4c69ef8088bc.png)
![[Diagram]](../../diagrams/41/16459c4b20daaf809bb02bbe1ab62859.png)
![[Diagram]](../../diagrams/36/a12f9293e23e9fcad27b6c2069b0c834.png)
![[Diagram]](../../diagrams/28/17c64aabaae0690699081f3136c88b02.png)
![[Diagram]](../../diagrams/50/6bd1a251223223a32af1915fb9e413f5.png)
![[Diagram]](../../diagrams/11/40a02af02951e3f6727290f1425e0c27.png)
![[Diagram]](../../diagrams/5/fcb2ec7bce0b375b468bb05ed5fa43b0.png)
![[Diagram]](../../diagrams/39/2ba6fcb74fcdb85c3f945118e87d0d01.png)
![[Diagram]](../../diagrams/12/d64df12192930f6a465542632c4387a5.png)
![[Diagram]](../../diagrams/16/336d4a6311f314ccd4904efbbb9e42e5.png)
![[Diagram]](../../diagrams/16/428470623c3b315b358a48b3066664fd.png)
![[Diagram]](../../diagrams/12/90d50e8980bc9d8dfe379b24eb501d8d.png)
![[Diagram]](../../diagrams/51/87e20b96cfda57a7f39cbda1ddb35aeb.png)
![[Diagram]](../../diagrams/12/ae852c675437a0b3abd1eded2ec3a43c.png)
![[Diagram]](../../diagrams/6/5bd23ca2f2a203122a45c21237e034d1.png)
![[Diagram]](../../diagrams/27/c414fff31948b31ac394863274d7de7e.png)
![[Diagram]](../../diagrams/9/25b677163af23245fb0be948b67ecb4c.png)
![[Diagram]](../../diagrams/12/f317e275f0c71d4b9a07595bcc3e67bc.png)
![[Diagram]](../../diagrams/18/c9cc9bd23e2e47390e6dc5975bfe85a1.png)

![[Diagram]](../../diagrams/50/7025d61f80ffcfcfa3435198ef6f3b81.png)
![[Diagram]](../../diagrams/42/cc2e759f217608f79b5da567235a5fa8.png)
![[Diagram]](../../diagrams/49/b3d3746cfa443900c3084eac1ab34aed.png)
![[Diagram]](../../diagrams/0/899975466266583b76d9f7ae734d6ecf.png)
![[Diagram]](../../diagrams/16/e7a21904e87953aef690e86c4c8757d5.png)
![[Diagram]](../../diagrams/47/9bb73c317545ddfa6da1fe450a3c1f56.png)
![[Diagram]](../../diagrams/17/4c69186f0147b3816b9fadfb1380a302.png)
![[Diagram]](../../diagrams/13/39f199d16f8c575ea41136d72aad4e04.png)
![[Diagram]](../../diagrams/52/79fed639fec52ae3874dcc3fb4dc4d05.png)
![[Diagram]](../../diagrams/36/d3f67e3996515d5ffe3673561024d0a8.png)
![[Diagram]](../../diagrams/37/3b4a7ccdd3bbdbfe3df3e1eb28d45dbe.png)
![[Diagram]](../../diagrams/32/cb6a0456b6869a4fc5d64231f58924ee.png)
![[Diagram]](../../diagrams/23/f9bed388998b858b8768582f39e2ff82.png)
![[Diagram]](../../diagrams/32/c49cc60e681691a8f614322f9d5ea3f1.png)
![[Diagram]](../../diagrams/8/e44dd74499bd1d41b01154f2667ea2f6.png)
![[Diagram]](../../diagrams/7/7283bb5ead12c624717ffa9d47a39f44.png)
![[Diagram]](../../diagrams/5/8576f176ba60a4328edf9aa4262b01ab.png)
![[Diagram]](../../diagrams/51/590ca18285fb845b4cb821ee71e15a66.png)
![[Diagram]](../../diagrams/50/1b726220e8e5f28b16e0aa9eb6a0f852.png)
![[Diagram]](../../diagrams/45/8ef58787c4271fa54504c9212c3fb716.png)
![[Diagram]](../../diagrams/8/98ac9a98b024c6911a4be06c5cb878bc.png)
![[Diagram]](../../diagrams/8/e38e0b28b12ffe5dae5f9b11bb3b9735.png)
![[Diagram]](../../diagrams/6/cc118472ebbb377bde32f0340233fa76.png)
![[Diagram]](../../diagrams/21/328618917b816ed6a0a4c73c76d38f09.png)
![[Diagram]](../../diagrams/36/5833c8e4a0f453529a06f48d9219c29b.png)
![[Diagram]](../../diagrams/18/7b58f07fa5de747a1b2c094487565898.png)
![[Diagram]](../../diagrams/33/606ac24db3acbcc536727e49803b7bdd.png)
![[Diagram]](../../diagrams/15/bb4fe0021eb313ec8ed9c845e207d005.png)
![[Diagram]](../../diagrams/37/93d2bca4af39ca7fe313d5be9621265d.png)
![[Diagram]](../../diagrams/42/ded994a6b8b6cc2286bec41eafb3aed9.png)
![[Diagram]](../../diagrams/7/c3a6500d5d0ee26cad417c751c938fa8.png)
![[Diagram]](../../diagrams/38/a67d602c9c7f667f2ca45d1fa4bd2bb5.png)
![[Diagram]](../../diagrams/26/ac3ecb001c09ecba8f48320e3da0508b.png)
![[Diagram]](../../diagrams/21/bec67226b2cfc9c4a88ac346473eb9fb.png)
![[Diagram]](../../diagrams/31/59c33e0aac6d44aeeb81b4a9a5694191.png)
![[Diagram]](../../diagrams/52/9c6f1d829a43eac8cf7b363b1a77afa1.png)
![[Diagram]](../../diagrams/7/1db4e0268c9c4c52450f4ac1cafaf3b2.png)
![[Diagram]](../../diagrams/39/01603885cfffe53bb3f2becee7cc39dc.png)
![[Diagram]](../../diagrams/38/d140c06c9b422189d27002095a6fd469.png)
![[Diagram]](../../diagrams/47/fe6d5827c0cda3210ac9f7ef25a21080.png)
![[Diagram]](../../diagrams/49/2c2eaf9e744aab15b6b772ab73e9bf73.png)
![[Diagram]](../../diagrams/20/9d87445e66c8b249c048685ee53c964c.png)
![[Diagram]](../../diagrams/52/4c74318f3b1c19e0faa5420e54efcbbd.png)
![[Diagram]](../../diagrams/36/9632ec2389c36b3598ef02fb1061a1fa.png)
![[Diagram]](../../diagrams/26/33ff2aa12ad22b6a59b1a279b9aa14fd.png)
![[Diagram]](../../diagrams/30/d330e42365907f794780a9c6f95186cc.png)
![[Diagram]](../../diagrams/0/0de2cd5457841bfc6fcc4cd78589b225.png)
![[Diagram]](../../diagrams/1/65371077f061b7a8470d135dfd9bace5.png)
![[Diagram]](../../diagrams/2/4f314735c4578b3625f32dce1eedb65a.png)
![[Diagram]](../../diagrams/30/902d061c8196b2d6e80086d1dcabeb99.png)
![[Diagram]](../../diagrams/13/ca58f6907d1defbfc0d6f9b036326dad.png)
![[Diagram]](../../diagrams/14/5605b6df508e42c709be42d8638b80ea.png)
![[Diagram]](../../diagrams/5/e14863422a98bc9cbcd96a08a68d0e8a.png)
![[Diagram]](../../diagrams/21/ed76787b96436090bd04d4b8ccb7b9b5.png)
![[Diagram]](../../diagrams/4/39a0e9c4c563656198c46c72fc520f5e.png)
![[Diagram]](../../diagrams/3/7c97597630e731b82310dd11ce43f19a.png)
![[Diagram]](../../diagrams/41/65c7e837bc3d00c89d81161c4a706b32.png)
![[Diagram]](../../diagrams/52/dad469ed34d1fb10719914baa8c30600.png)
![[Diagram]](../../diagrams/29/910bed75681f5e58d588e23d4e20966e.png)
![[Diagram]](../../diagrams/10/ac964a2bac0507db1c1787b1c57c08c6.png)
![[Diagram]](../../diagrams/15/b134464f0406bb500f16670a6696a4ba.png)
![[Diagram]](../../diagrams/46/d0b285af26d604a6cae3ae38973d56e1.png)
![[Diagram]](../../diagrams/6/1d557f3e08eded68317c9a145a1cd6d5.png)
![[Diagram]](../../diagrams/29/0dc286696b10593ddfa3ee81a5252ebb.png)
![[Diagram]](../../diagrams/4/139b9cf148a8e095a34c83f9b5e6f590.png)
![[Diagram]](../../diagrams/47/7ee71420be288d5d8a9c660d34aed73c.png)
![[Diagram]](../../diagrams/9/6d5fba757972438a9b1bdd96aa8e69b4.png)
![[Diagram]](../../diagrams/39/395eaafd42fdcf8236eccef6840c16c1.png)
![[Diagram]](../../diagrams/48/6811083cb5479ad16c951e07d6437aab.png)
![[Diagram]](../../diagrams/52/cb6986f6c47cf0e094f9dd3f14776aa3.png)
![[Diagram]](../../diagrams/17/e45687ff06615357120e950740151de7.png)
![[Diagram]](../../diagrams/44/d9cb4b3a65bb70b747e98458eb8ed077.png)
![[Diagram]](../../diagrams/28/3d96891c033bb0f814e0ef30a158c964.png)
![[Diagram]](../../diagrams/23/c4aed97138401c2090af59af00c63276.png)
![[Diagram]](../../diagrams/9/e7768c4811dabf401499651cee4f8307.png)
![[Diagram]](../../diagrams/46/c4c5498c560a7b7aa48c8468e220c34a.png)
![[Diagram]](../../diagrams/2/5ecc5a86d0925e1ac022f5ab7cdeb2e9.png)
![[Diagram]](../../diagrams/33/8807d73e012a775c216a79f59d25234b.png)
![[Diagram]](../../diagrams/9/a5108dd0d15f926dcf78fa26fbfd4413.png)
![[Diagram]](../../diagrams/39/01cc0ecce580c3eef772a923b2ce6d97.png)
![[Diagram]](../../diagrams/36/e8d7f21e0b65904d57a4c0dbfe442c20.png)
![[Diagram]](../../diagrams/31/ffd93812f144a32e050a70c8ff889667.png)
![[Diagram]](../../diagrams/18/41d7106bc4839a00a7ecc7c7b6acaaaa.png)
![[Diagram]](../../diagrams/47/b302dbf0ba667ffbc066c7916de89bc4.png)
![[Diagram]](../../diagrams/16/38f99c284eb526b3d3a347f9b8cd9875.png)
![[Diagram]](../../diagrams/2/307032fd1bd1040c34e1cc2bbaf2bd72.png)
![[Diagram]](../../diagrams/19/3fb077e8f7494e70ea72eeb75b63e93a.png)
![[Diagram]](../../diagrams/9/80cdf88b69a1b611d7ad5433ff3061f8.png)
![[Diagram]](../../diagrams/47/5a7f3a0ed9a088fa16636830da6903fb.png)
![[Diagram]](../../diagrams/23/23d408ca0bc876dd7c5df7f706825d4c.png)
![[Diagram]](../../diagrams/42/48ef2b0f364cbbdca322d5207459b51b.png)
![[Diagram]](../../diagrams/27/c3a55b3cb1af95c64392730a9834f538.png)
![[Diagram]](../../diagrams/30/48b739038394be2231fae6a7aefbd6f6.png)
![[Diagram]](../../diagrams/39/e69060e94bdb3302673d7c340180ae41.png)
![[Diagram]](../../diagrams/44/d1161e723cdf3045da437f2f141b6c04.png)
![[Diagram]](../../diagrams/23/1bdd48f28d6a23b05d5405d30909d3c3.png)
![[Diagram]](../../diagrams/22/d64c645199a7d99c7f5f4b74c69ecc46.png)
![[Diagram]](../../diagrams/22/7f6e1d9f282c94a3708a994b3499fead.png)


![[Diagram]](../../diagrams/22/18cacad9421bf87d903f5ec1b78695cd.png)
![[Diagram]](../../diagrams/9/448efd82e460549c1c7adae0199af320.png)
![[Diagram]](../../diagrams/41/296f8f8f85cd5cefbfba88bf0bb95fb1.png)
![[Diagram]](../../diagrams/6/10aa0f6d863df1745deeda8ad746d7c9.png)
![[Diagram]](../../diagrams/10/33897c056e3574c94c89645ecdb3f953.png)
![[Diagram]](../../diagrams/2/1cdc2c2ba7b01dce794ccfe29473ea77.png)
![[Diagram]](../../diagrams/40/e181778669907253a25786dc14b7986b.png)
![[Diagram]](../../diagrams/43/eb49d05cd43fe476b46757276361307f.png)


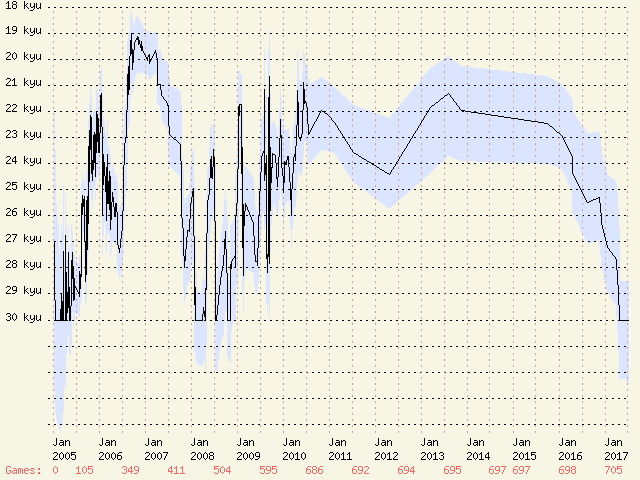
![[Diagram]](../../diagrams/45/461bd025a2a3548016fb26ce1b783c10.png)
![[Diagram]](../../diagrams/20/064a5770c501f9c59fbca37c63d8237d.png)
![[Diagram]](../../diagrams/21/9c096350268b36b4a9fd5a824ef8de55.png)
![[Diagram]](../../diagrams/44/11c8af9a0a260fc865eab31541ca4fc7.png)
![[Diagram]](../../diagrams/37/2651a3f246c1232c63ab146b4448aaa2.png)
![[Diagram]](../../diagrams/51/c9d22db9eadc28019b12ad23cef9c3ec.png)
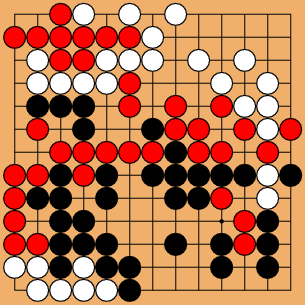
![[Diagram]](../../diagrams/42/7c8fb2d926f7ee7d1199da040350deca.png)
![[Diagram]](../../diagrams/27/cbf80dbaed53c35fabbec5d711e2e2fe.png)
![[Diagram]](../../diagrams/20/8d5f531d332604cc9dc21c77961e677c.png)
![[Diagram]](../../diagrams/26/bf41e9ce27df4d7dbb5f605a7b414cd4.png)
![[Diagram]](../../diagrams/42/ab634afeb1b17b0a12d4a5d84cc89edc.png)
![[Diagram]](../../diagrams/24/154198555e086b0433a4dbd74a9d6e52.png)
![[Diagram]](../../diagrams/44/9697c2bcc32264f55d43bea760fff5c3.png)
![[Diagram]](../../diagrams/18/04d9eb82831f8c3ad4248059bfb6cb5d.png)
![[Diagram]](../../diagrams/1/c722dab7244ab67fbb55ffa69e5d8881.png)
![[Diagram]](../../diagrams/51/5df7ed7f72c1aee2b7cb7faf3ca4b013.png)
![[Diagram]](../../diagrams/27/96783de9b47caee04ed23b7238f43e4c.png)
![[Diagram]](../../diagrams/28/c172528cf9a41ed6599288f2dcb1c3d4.png)
![[Diagram]](../../diagrams/28/2f72bf68134dccff53931df346d8c74b.png)
![[Diagram]](../../diagrams/12/f6dfcd1116f2259adfc98f353d57224e.png)
![[Diagram]](../../diagrams/26/88236881476177d96c1146a27260d56f.png)
![[Diagram]](../../diagrams/9/3d90bb4c72196c9640fdc6567370a80a.png)
![[Diagram]](../../diagrams/33/70e46dc232be59b700a61e957374eb7e.png)
![[Diagram]](../../diagrams/13/2c804e7b45a048a554b43d9be9534d64.png)
![[Diagram]](../../diagrams/42/64d4871b508397d43fe117560f342b94.png)
![[Diagram]](../../diagrams/49/9aee0790e99ee2f2a1dd2a19f95a254e.png)
![[Diagram]](../../diagrams/8/4b4cdd32c54d8c4d4acf48feaef0d4e2.png)
![[Diagram]](../../diagrams/7/be892758c2c56db50cc0fa1a384088c2.png)
![[Diagram]](../../diagrams/4/f3dcb0e9ed15c64cd95811aaf30568b0.png)
![[Diagram]](../../diagrams/11/b2909e268c377a80137f37ad088d8175.png)
![[Diagram]](../../diagrams/0/895d1f8f0e59ab88c1423a8f0a17e758.png)
![[Diagram]](../../diagrams/49/a521c4b5951d18bb7da492bb55d23eb7.png)
![[Diagram]](../../diagrams/50/a10288f54bce7594447192eabac845f7.png)
![[Diagram]](../../diagrams/52/f92b4a2b7c62a3357e07e1e3fa00b20e.png)
![[Diagram]](../../diagrams/25/7187d5f9d8570ca6fbfbca497e8e04ce.png)
![[Diagram]](../../diagrams/23/da268b4640ebc41890eb76a58d30ce1c.png)
![[Diagram]](../../diagrams/40/a8b7f3ae6a08a6045e30d1061fd39acd.png)
![[Diagram]](../../diagrams/13/59f1316f79d50bc8a76f88063d77860a.png)
![[Diagram]](../../diagrams/21/a55aebaa0d498e3bb46de9fdf634be39.png)
![[Diagram]](../../diagrams/27/b679bbb09e249781baa7c5c7d48522b6.png)
![[Diagram]](../../diagrams/43/c5cf687461ebf62a87dde691da8c8324.png)
![[Diagram]](../../diagrams/30/01b82a82199b23274a8976ee7b59bd6f.png)
![[Diagram]](../../diagrams/1/f9f469f4250cac2630f4353206772cbe.png)
![[Diagram]](../../diagrams/33/5050b8eefd393bac737f393efca78c7c.png)
![[Diagram]](../../diagrams/8/229b8555733feb764698e27c9fcfa47c.png)
![[Diagram]](../../diagrams/15/2c7b6a6c3cc0d6350602b9700ab1986e.png)
![[Diagram]](../../diagrams/31/acdbba65962ffea1d3242f53b0db9dbc.png)
![[Diagram]](../../diagrams/38/9cb9fbe0a5f07adaeba35ef64974998a.png)
![[Diagram]](../../diagrams/11/e46fa1adce1317953bde02c0c9303765.png)
![[Diagram]](../../diagrams/47/776d2ef20ad0ccf3a465ab332a900cfb.png)
![[Diagram]](../../diagrams/41/e29febaa5928302cc9dcd52c8ddf5d1b.png)
![[Diagram]](../../diagrams/18/b1cfe3dd2e76840f66bae0112d2b1ea4.png)
![[Diagram]](../../diagrams/17/e638ce93ba0eb58ed5a3b55b77695b53.png)
![[Diagram]](../../diagrams/43/f0db83fdb0923cca1d2a5ecd4cb592a5.png)
![[Diagram]](../../diagrams/1/ad77bdb8a89b4b9399b96eef4d858c17.png)
![[Diagram]](../../diagrams/4/9f58b1325ddbbf7d536d69eed66934ed.png)
![[Diagram]](../../diagrams/2/77aee4e9e5c1050cf6336658593d4eaa.png)
![[Diagram]](../../diagrams/27/a558194a766c3034567c8de0732d4425.png)
![[Diagram]](../../diagrams/47/a7bed482e5214635bb27468789759f12.png)
![[Diagram]](../../diagrams/40/dd17efb230e62809a010400d2bdb2506.png)
![[Diagram]](../../diagrams/5/12e6cf4915b39dddfcf506909337bd6a.png)
![[Diagram]](../../diagrams/18/22c6785263a8d757f481372ddd3c23fa.png)
![[Diagram]](../../diagrams/26/00ffe353cfbcc2534a99893224c58ba4.png)
![[Diagram]](../../diagrams/39/5ace39c4a057f6566f5054d6243ae095.png)
![[Diagram]](../../diagrams/21/eabbf8c9afe4b73a22c9e2cfe869ad8f.png)
![[Diagram]](../../diagrams/28/0e96e80bcc51985a30856bf3a33ca071.png)
![[Diagram]](../../diagrams/1/7b0b6c8b45ae6b4dc56309643e6ad459.png)
![[Diagram]](../../diagrams/9/99a252754b17d4c2fd870385ad06970a.png)
![[Diagram]](../../diagrams/34/476fed46df46f8fa262f7de9a079c75a.png)
![[Diagram]](../../diagrams/26/756083ce1056ef0c34b8bf1bc424297b.png)
![[Diagram]](../../diagrams/31/76db675de15e43f194478cae1ad34826.png)
![[Diagram]](../../diagrams/28/6b71e9a5936dcb1922b6153ab3607cdb.png)
![[Diagram]](../../diagrams/35/4fdda05ac1d992b9d2e7d7fa8f783974.png)
![[Diagram]](../../diagrams/7/c43669cb76b4ef488647ce1c43eb8d00.png)
![[Diagram]](../../diagrams/49/4bb29d7d39b2b9998259ca74abb50a63.png)
![[Diagram]](../../diagrams/33/f399f2735fbb0b9cbfa5587b7052604f.png)
![[Diagram]](../../diagrams/34/668c3515817ed7d05e149604ec52d16c.png)
![[Diagram]](../../diagrams/8/3a79a6d692c1ba2ecb03db7713b910ff.png)
![[Diagram]](../../diagrams/45/3497b3e660f0f1415f1d27b86637868d.png)
![[Diagram]](../../diagrams/44/9dc323e7580114f82a1da7d6e07651f4.png)
![[Diagram]](../../diagrams/29/702a09c252e5500452249445ef24a421.png)
![[Diagram]](../../diagrams/21/f7d8839e21b60ccda55f34902eff6b98.png)
![[Diagram]](../../diagrams/17/818a5d7630d0e153195079c43fb04b98.png)
![[Diagram]](../../diagrams/13/d9b73258744eb9cec13fae265fad3db5.png)
![[Diagram]](../../diagrams/25/65404f24ac724baa69d1fb202a0053dc.png)
![[Diagram]](../../diagrams/41/981fa6afaa94abfdeac5313fcf652ad5.png)
![[Diagram]](../../diagrams/41/deb002ce2388d9922bc450228e2bc546.png)
![[Diagram]](../../diagrams/25/42d1e168d31ff28cd7ff33def9ea6493.png)
![[Diagram]](../../diagrams/39/a1ef1f665639ba8ed836941e410d6c25.png)
![[Diagram]](../../diagrams/15/7f5441ab3f4d2695b605721d822157fb.png)
![[Diagram]](../../diagrams/10/cfa120b741c5527b2484e3ff17c33dcf.png)
![[Diagram]](../../diagrams/10/6fb7e76138da2e87e745206ad1a12fd2.png)
![[Diagram]](../../diagrams/39/524b8de9696ab8210cee4c0d39323e58.png)
![[Diagram]](../../diagrams/27/5b347c925918762eb52a9623559211ac.png)
![[Diagram]](../../diagrams/44/15acdc990a1dffa910306af3e0c0f9b0.png)
![[Diagram]](../../diagrams/39/8be3200a8f40a32b8caae12216a89dca.png)
![[Diagram]](../../diagrams/22/3d7d6c251ae190137d6ad29555fd037f.png)
![[Diagram]](../../diagrams/34/a4a05daa3c47cc3b5b03f4e54326de1f.png)
![[Diagram]](../../diagrams/28/edc3ef7b643ede11f4b5afc90285824e.png)
![[Diagram]](../../diagrams/7/9ffb35b6100c538dbae34cf53f08cc02.png)
![[Diagram]](../../diagrams/42/27e0fbc0061bb65c12396745b4c849ea.png)
![[Diagram]](../../diagrams/19/ef0deea1cd3a0a74a870d82a70981274.png)
![[Diagram]](../../diagrams/51/afcb3fa1d5def50415e81ad3c9cfd463.png)
![[Diagram]](../../diagrams/31/8b556332fec3554afa7a430262581116.png)
![[Diagram]](../../diagrams/18/9af4a531743ba6809d84e12b61ae63ae.png)
![[Diagram]](../../diagrams/43/faea3232e8dd4f76ce36bc8ad3ac573c.png)
![[Diagram]](../../diagrams/44/fa1b7e1d698bbaac3e295dddd285dda9.png)
![[Diagram]](../../diagrams/10/27d28f405f0dd502d870f309e3cdbbdc.png)
![[Diagram]](../../diagrams/12/b5dcde14538db380fc0d43cdb1173382.png)
![[Diagram]](../../diagrams/39/e864d7c759a1308a2601a30637de34a3.png)
![[Diagram]](../../diagrams/43/cf747387c48f86e8442a62165ed1e65e.png)
![[Diagram]](../../diagrams/9/315e56e1d4c4460611dec199ce642fb9.png)

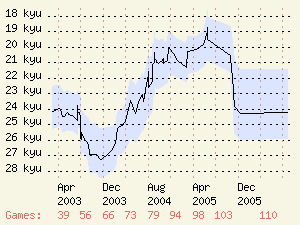
![[Diagram]](../../diagrams/13/2fda1b3bde1655520eefb6def10f5c40.png)
![[Diagram]](../../diagrams/32/e4eaf99f641ca62ff068694e8630f526.png)
![[Diagram]](../../diagrams/22/6798a4fe147d00c37c5310ea144843a6.png)


![[Diagram]](../../diagrams/16/8ab44e68764765c8db928060c5dc7bc4.png)
![[Diagram]](../../diagrams/4/638a1f6889573aea2be1edd1e3f43f2e.png)
![[Diagram]](../../diagrams/41/04a34a563d725cc627065f5e6ff8d422.png)
![[Diagram]](../../diagrams/20/1b610a1786c166713e8db4ad23e0e467.png)
![[Diagram]](../../diagrams/40/e475f3886aaaa0d8e3e4b11b347716ef.png)
![[Diagram]](../../diagrams/32/700bb0696c9829380f92c1a6526c2ab8.png)
![[Diagram]](../../diagrams/21/bb86159a8a58f28301369457689da4cb.png)
![[Diagram]](../../diagrams/27/93a05c97372b8821b5c5bc996f0a88ea.png)
![[Diagram]](../../diagrams/42/1bc585e2d75b9f4212bf04882a43a14b.png)
![[Diagram]](../../diagrams/30/484f4667e7393d657b4c4c80ec7d7a9b.png)
![[Diagram]](../../diagrams/26/791db9aac4893e652a6cbb24dec74c59.png)
![[Diagram]](../../diagrams/45/9d7838f5bd09c8bc33202d5739c38630.png)
![[Diagram]](../../diagrams/9/94e24865b7a14abf6e1bb498d0a20a8a.png)
![[Diagram]](../../diagrams/3/ad48f4423077a819ccf1ca3707350119.png)

![[Diagram]](../../diagrams/17/4f6d9c402f819243df25ec70c2f56378.png)
![[Diagram]](../../diagrams/17/36bfecf70e3ff53dfb65a017c5d52688.png)
![[Diagram]](../../diagrams/16/7b7dbd1ccf98ec4ffe4e000ed8104ddf.png)
![[Diagram]](../../diagrams/7/1d95fcf2dfb8071f1a85eefbd9d5e9b0.png)
![[Diagram]](../../diagrams/41/98acfc76260a6e252712cb449a7f4dd5.png)
![[Diagram]](../../diagrams/38/4476b67fb469dfccb4808e209978872e.png)
![[Diagram]](../../diagrams/36/0cf96deded486a508b5ee5a64654de0d.png)
![[Diagram]](../../diagrams/17/e0e95d5fc735588a0ee3fee2092f8db1.png)
![[Diagram]](../../diagrams/39/18cff5955ea603de2c4e101e7f0a4589.png)
![[Diagram]](../../diagrams/4/0e0b170c8944cf66f147ae2adaa38f2f.png)
![[Diagram]](../../diagrams/7/be0973c46ac8e845856f4fa404c645aa.png)
![[Diagram]](../../diagrams/45/619f77db3b651e799f70a5f4787db59c.png)
![[Diagram]](../../diagrams/42/996c5f5236fa45bba30c51027fd9f2ed.png)
![[Diagram]](../../diagrams/25/138207d3681f0c1682846f2dcc45e4cb.png)
![[Diagram]](../../diagrams/41/b399aa265706537cb38405c8e0054eff.png)
![[Diagram]](../../diagrams/20/6c61bf071fb612057c4ff31d9e0e9e7b.png)
![[Diagram]](../../diagrams/32/a4e9e485a52f67baec2af7f88b6a63e3.png)
![[Diagram]](../../diagrams/31/8419a725271990f982ca916677bb2491.png)
![[Diagram]](../../diagrams/7/140cc6d57fea6ab3593ef8a93c1ddbb2.png)
![[Diagram]](../../diagrams/11/1e30ca85eefd80f65385ff0177e504af.png)
![[Diagram]](../../diagrams/52/14297f1a46bc671ed17c7fe2606b9877.png)
![[Diagram]](../../diagrams/5/2a204b557143bd567ce76162b5d41ec1.png)
![[Diagram]](../../diagrams/22/622e3a24b424e6ecf6388b6515396b13.png)
![[Diagram]](../../diagrams/6/2752cdf7911528918e5d673e9192b616.png)
![[Diagram]](../../diagrams/47/30b96d57af95a41d8aff73bcb5fe29b1.png)
![[Diagram]](../../diagrams/27/3b67c7ba2719ac128714d642e10a31cb.png)
![[Diagram]](../../diagrams/8/45d69e24f92bc6696c51f81b39ad15e1.png)
![[Diagram]](../../diagrams/19/c006697d11d3c908bde98cf40a8358f8.png)
![[Diagram]](../../diagrams/49/c404c8d6062f2c018a06773d08a69291.png)
![[Diagram]](../../diagrams/38/29895db890870efc6481243e6fde0578.png)
![[Diagram]](../../diagrams/16/bdf7fbf11b695b39d2a05bc8a54eb684.png)
![[Diagram]](../../diagrams/44/6ef12d037dd5d63bbb06bb86a8694afe.png)
![[Diagram]](../../diagrams/45/010f0329ccd58b357ce0b4c99acfcaba.png)
![[Diagram]](../../diagrams/38/b5c87b7ba1d40e9bbbd9de218158cbb5.png)
![[Diagram]](../../diagrams/1/aa15fdfc097251b8c95201f180ed156b.png)
![[Diagram]](../../diagrams/24/393e7ad927df661acac1cb96206f4900.png)
![[Diagram]](../../diagrams/19/6ea3ec2721ee3e0a626aa56171b4abcb.png)
![[Diagram]](../../diagrams/13/a3f7670271dd350d72bee61258ea82d6.png)
![[Diagram]](../../diagrams/3/74c8d52155fbc3285c8fc8b50273abe5.png)
![[Diagram]](../../diagrams/36/1ec0aaf80e5c12ae80aa7d10b82a2f0a.png)
![[Diagram]](../../diagrams/52/ddeef9a36bc69f5fa472a6533059c104.png)
![[Diagram]](../../diagrams/4/ed46748fcb34d85ee657861097779821.png)
![[Diagram]](../../diagrams/29/6f2414fc99be7dddb7a72aa610a7e645.png)
![[Diagram]](../../diagrams/39/8bf2effbc353bf73c1b4b5a8383bc3c4.png)
![[Diagram]](../../diagrams/50/3fca12f62c898dc2ee35db9901ba97be.png)
![[Diagram]](../../diagrams/18/fff7257ee7f917e1e5f46aa345f8749f.png)
![[Diagram]](../../diagrams/16/32cb1f205797dfbe82722dab43f8ee5b.png)

![[Diagram]](../../diagrams/29/4a8657d7bf1f1fd1eba973d86db33233.png)
![[Diagram]](../../diagrams/51/73404f6ad4690c189b3d40a6190c1341.png)

![[Diagram]](../../diagrams/38/684135c72764b879749646351331fe5e.png)
![[Diagram]](../../diagrams/15/ef8e622e651d211188deddedecb36fb6.png)
![[Diagram]](../../diagrams/7/2522bb90b73225ee41375b1af9c64adc.png)
![[Diagram]](../../diagrams/17/37eaa76b87830771734723e333d48652.png)
![[Diagram]](../../diagrams/5/ed48e1ba8ced7c8d9cf4e3aab1e3f877.png)
![[Diagram]](../../diagrams/27/78b04ab74da34614ccbdd79d7d90bdb6.png)
![[Diagram]](../../diagrams/32/6ae64cf39324c4ce8afd95b2f1c665ec.png)
![[Diagram]](../../diagrams/28/eabbc51d53c82468e3a2bed76ac3fd56.png)
![[Diagram]](../../diagrams/22/5ba7c6d1261f741e96322594eefb7333.png)
![[Diagram]](../../diagrams/8/4fe20809ebb90353b3d5d8721fd7df66.png)
![[Diagram]](../../diagrams/24/e4deee074237a515bf49eeaf91a88326.png)
![[Diagram]](../../diagrams/25/1e305388d083585d6e829e6542916c3f.png)
![[Diagram]](../../diagrams/40/b23481bd35b7efd15b6955b391d4d9d9.png)
![[Diagram]](../../diagrams/16/38390aabbd31ae5b8ed79a87fcaf9e5d.png)
![[Diagram]](../../diagrams/38/3b961056590ce61fd9cdb2865121a71d.png)
![[Diagram]](../../diagrams/11/6c7614a59a128db59cf5248e4b3aa5b2.png)
![[Diagram]](../../diagrams/18/be652f605a8915f8553aaf546240037e.png)
![[Diagram]](../../diagrams/14/3ed34cd01e4704b3ca3e07cf070aa87c.png)
![[Diagram]](../../diagrams/0/d14812ba5aa1b0808b5707ef115aa743.png)
![[Diagram]](../../diagrams/32/52328c64d73798972d1d3629630fb1ce.png)
![[Diagram]](../../diagrams/29/0f261fa12127e510f87cb8a24e4faf0b.png)
![[Diagram]](../../diagrams/21/79ab48f975ad37fb3d81294ea9552fd6.png)
![[Diagram]](../../diagrams/49/cc95238ca2ff7134f9d9bdc6cf315f70.png)
![[Diagram]](../../diagrams/6/233210110db5a6f64f31923a20879e34.png)
![[Diagram]](../../diagrams/52/d51a86390f5d4190c232bfae9bce234e.png)
![[Diagram]](../../diagrams/16/e74587d95d0e0124e43f9fe3db2ff97d.png)
![[Diagram]](../../diagrams/37/dbdb1aec3b7e3b2bca8e8faf0ed45a3b.png)
![[Diagram]](../../diagrams/8/fa9169010f58450990c653de41c388f4.png)
![[Diagram]](../../diagrams/14/c59ea6444d1dc957663bd095c20764b3.png)
![[Diagram]](../../diagrams/21/432f72371a566d27551e42267e3ae109.png)

![[Diagram]](../../diagrams/32/827a86472fb7a8e195d8236dd0b0d5cb.png)
![[Diagram]](../../diagrams/51/a4336824427af12dfeb7e32f16de285f.png)
![[Diagram]](../../diagrams/22/cd9c88ac1236c0ed8ec42873d8362ab6.png)
![[Diagram]](../../diagrams/29/a957c9a39c7dcebd40cc67809ae31a29.png)
![[Diagram]](../../diagrams/18/b0905628862528f84a1f3eff770ea6e2.png)
![[Diagram]](../../diagrams/48/db2c58e26a012f4ce51d3a9cefff5b34.png)
![[Diagram]](../../diagrams/35/621a048384c74116248c41b365b44284.png)

![[Diagram]](../../diagrams/50/79947c45ab83527bd3f3a7751161ad1e.png)
![[Diagram]](../../diagrams/28/9002614ac0871cb0a1473f2d7d67d583.png)
![[Diagram]](../../diagrams/37/d6d8949220f7b58990433b91ca69b97c.png)
![[Diagram]](../../diagrams/18/a3569d874a9843e9491c8c930862cbe6.png)
![[Diagram]](../../diagrams/29/14ec3b518e304889dc4960188917ffff.png)
![[Diagram]](../../diagrams/0/b865db48363e19bbb3cdd02826c65442.png)
![[Diagram]](../../diagrams/24/6ee4acb76c528afa3e83e3cd8b840d31.png)
![[Diagram]](../../diagrams/46/399c5b091da17acd9f35b6b31df951bd.png)
![[Diagram]](../../diagrams/6/a21b4d3f340e080db8e9e2833b1575db.png)
![[Diagram]](../../diagrams/28/51dc904a28cdbd27c7def98c886d3e9f.png)
![[Diagram]](../../diagrams/12/2b93ccbba03edd1c845ad33a911c781d.png)
![[Diagram]](../../diagrams/48/f0a720ce6bf88a796b508d14492bbea4.png)
![[Diagram]](../../diagrams/7/7477164506008fa400d43ac0540b96c8.png)
![[Diagram]](../../diagrams/29/5e6bbdde2eb97e115a399deb602f0d3c.png)
![[Diagram]](../../diagrams/40/20db6c783d5efd4a0e9cefa9eef2041c.png)
![[Diagram]](../../diagrams/27/c4e1a6d0879927eb78eeeda85b5835cc.png)
![[Diagram]](../../diagrams/51/35d9a4e8e3f2efca98652d17aa7cb56b.png)
![[Diagram]](../../diagrams/3/7fce52cede71123632651fb6102ad027.png)
![[Diagram]](../../diagrams/36/594ebe342800b39a3a33039a0cb540fa.png)
![[Diagram]](../../diagrams/24/adf078e51fd17e9e5081ec877210499d.png)
![[Diagram]](../../diagrams/35/205d25b3718cac68a4c9f30e940cc53b.png)
![[ext]](http://home.comcast.net/~moonphantom/ebay/pillow1.jpg) http://home.comcast.net/~moonphantom/ebay/pillow1.jpg
http://home.comcast.net/~moonphantom/ebay/pillow1.jpg![[ext]](http://home.comcast.net/~moonphantom/ebay/pillow2.jpg) http://home.comcast.net/~moonphantom/ebay/pillow2.jpg
http://home.comcast.net/~moonphantom/ebay/pillow2.jpg![[ext]](http://home.comcast.net/~moonphantom/ebay/pillow3.jpg) http://home.comcast.net/~moonphantom/ebay/pillow3.jpg
http://home.comcast.net/~moonphantom/ebay/pillow3.jpg![[Diagram]](../../diagrams/36/619fdff5de142ffb9c41e3a5e7d05087.png)
![[Diagram]](../../diagrams/33/d7dc55b1cba0ba313d6df525204219ce.png)
![[Diagram]](../../diagrams/29/ead91af3aee116411400dd59324b7ccd.png)
![[Diagram]](../../diagrams/1/0a9cfbbfad196394d860dac93abe2619.png)
![[Diagram]](../../diagrams/18/33b37ed71a34f0dd81cb31cb057bf22c.png)
![[Diagram]](../../diagrams/25/14c1abb0f06f2ba11c3cf2b604f3a373.png)
![[Diagram]](../../diagrams/13/1fb45a0a3140e01fa8dd8cbdcef3da53.png)
![[Diagram]](../../diagrams/0/a71e5288467c3cfba57864297dd9b8b7.png)
![[Diagram]](../../diagrams/40/4d32654e24b512180403c9d330d05668.png)
![[Diagram]](../../diagrams/20/879e84e30e8303883cbb53de7fe49e41.png)
![[Diagram]](../../diagrams/17/86800f59d8d995cac1ab3113c7fc4286.png)
![[Diagram]](../../diagrams/37/4a5be7bf6be6f18e42b2c4b8cbe8f9d8.png)
![[Diagram]](../../diagrams/43/204c0c631460ecc1e4964eda2c9f050f.png)
![[Diagram]](../../diagrams/51/e70d5fb91c21e73952f43654f3839940.png)
![[Diagram]](../../diagrams/10/e82aa48aee567131dcd936328b0c5ea0.png)
![[Diagram]](../../diagrams/35/ec890538789ebcad7bcb4c3a1f09b234.png)
![[Diagram]](../../diagrams/21/4f83d5f945e81294fc36cb975527e0a4.png)
![[Diagram]](../../diagrams/12/385a4ddf735c40d480eb044e020ec08c.png)
![[Diagram]](../../diagrams/26/b3211c0ff704356dc3e200a7d30fd3c6.png)
![[Diagram]](../../diagrams/28/5d1d534e4090e4044884420976997eb7.png)
![[Diagram]](../../diagrams/0/da2fa26b964c7955e72684921eca81ab.png)
![[Diagram]](../../diagrams/27/75e3731f6c22e37c2ef409c5349c860d.png)
![[Diagram]](../../diagrams/21/c760211379515ef52db476bf346ffc42.png)
![[Diagram]](../../diagrams/27/fa773a94f20bc3a937e60ce65c7438dc.png)
![[Diagram]](../../diagrams/26/c2f50d45d9c4d9e1aebf6498ca54e9c4.png)
![[Diagram]](../../diagrams/25/4f10d451e102c9a1f0b29edb7d074197.png)
![[Diagram]](../../diagrams/32/761cbcb0b3f6de4353646431b8b505ed.png)
![[Diagram]](../../diagrams/14/a6ba068215c90f3845986e383125c8cb.png)
![[Diagram]](../../diagrams/30/731edab8db1c5ca69108bde1895903da.png)
![[Diagram]](../../diagrams/51/e21cf8c6665628c39bd70af34ecbfa14.png)
![[Diagram]](../../diagrams/18/95e887d73c583eebd86587ca615a428b.png)
![[Diagram]](../../diagrams/45/dc926203c7956dcc2f24162dc6ee36be.png)
![[Diagram]](../../diagrams/0/ad2dfb13a63cae1b580c44d66e9c7724.png)
![[Diagram]](../../diagrams/26/04ffadfb7b65662b5d55c70b467cc15d.png)
![[Diagram]](../../diagrams/26/cc1e6bd0f6ea0b0a7b66e2765f438fbc.png)
![[Diagram]](../../diagrams/8/7daec0e93dc2e1b750c2a16a2fc6b9c5.png)
![[Diagram]](../../diagrams/21/a2b6d748f92220e6e181c5548df18f72.png)
![[Diagram]](../../diagrams/34/acec2740aeda4acedf5fc5c2eb794ccf.png)
![[Diagram]](../../diagrams/50/5f48325058ea1e8d4d60ad968af1ccf3.png)
![[Diagram]](../../diagrams/40/f9651ccf6a61b4457fb77ffd04e8819e.png)
![[Diagram]](../../diagrams/4/bd5613a8a9d5980056bf3687af005a1f.png)
![[Diagram]](../../diagrams/7/585dda621fbadba97efb0d299a278b19.png)
![[Diagram]](../../diagrams/46/1cb211c4da72f75ee9d1c975208ef601.png)
![[Diagram]](../../diagrams/12/47f9673b65e6dd6a024d4073866126d4.png)
![[Diagram]](../../diagrams/37/1883c99460a747f215b39afc37ee079e.png)
![[Diagram]](../../diagrams/3/2a3d40bb09006f76cde43e070105df8a.png)
![[Diagram]](../../diagrams/14/aae7117a7a545e43013720fcfca093d3.png)
![[Diagram]](../../diagrams/14/a6466337c0093e8d5478d71f6cede7b8.png)
![[Diagram]](../../diagrams/7/527912319ddf93c159db50b8334efc26.png)
![[Diagram]](../../diagrams/52/845f931af6b11040e04758b49ab2aa5b.png)
![[Diagram]](../../diagrams/25/2fb99b669bcf09414ccb3be74491ca8a.png)
![[Diagram]](../../diagrams/41/5c0c5c3af19f13673ebc01404418e6d1.png)
![[Diagram]](../../diagrams/52/dd33b1baae7a4b9b61241c51f3ab5b26.png)
![[Diagram]](../../diagrams/36/55d5781266785fe55ee86017efe09458.png)
![[Diagram]](../../diagrams/39/e379d8fd7cb923f1d3d93b0540b9fcba.png)
![[Diagram]](../../diagrams/40/4adf60ee2387a3f15a6658d9008ac38c.png)
![[Diagram]](../../diagrams/3/ef68fa26bae5dcbbbf69d74a1d87b542.png)
![[Diagram]](../../diagrams/52/ffadea2718ee9a6550873cc8589e8857.png)
![[Diagram]](../../diagrams/37/f7621f225c0636b1f3c4b75e69e9011a.png)
![[Diagram]](../../diagrams/48/0aaad33642aba8aebf7821f901bfddf4.png)
![[Diagram]](../../diagrams/43/507f382f66f693d57fc4fef3106535d7.png)
![[Diagram]](../../diagrams/29/b3eecae0b534c03d545252b8d8d72d3c.png)
![[Diagram]](../../diagrams/16/04437c0cdd47de500d4c1b6aef322fa8.png)
![[Diagram]](../../diagrams/30/2e77607fb088e978c06906b796cab3ce.png)
![[Diagram]](../../diagrams/20/784d1db82c884e94466e3cd00a8498dd.png)
![[Diagram]](../../diagrams/7/a8d6563e07029fa9337fb2a02ee7adeb.png)
![[Diagram]](../../diagrams/1/f8b260fc10be60b3b0f3eac8a3164972.png)
![[Diagram]](../../diagrams/8/57181ae753342fe9036d680959c9fe72.png)
![[Diagram]](../../diagrams/28/99509562aef23de4e932d025e07643af.png)
![[Diagram]](../../diagrams/26/8961d516214b9f7dbcd13b8b1d8a8af8.png)
![[Diagram]](../../diagrams/42/ea46f52fe10c21290fec33ec6fd14334.png)
![[Diagram]](../../diagrams/23/b78d061d9a538bf75ebad7cfa6dceadf.png)
![[Diagram]](../../diagrams/39/278aac70b320e00c2bd9e051323471e3.png)
![[Diagram]](../../diagrams/50/859fe18837d5787d40d6f4abe90e7480.png)
![[Diagram]](../../diagrams/31/e692aa329e6db6a0685ea6c2eb11b1ba.png)
![[Diagram]](../../diagrams/41/78ed17a7dbca5c54d8c75a2e811fe8d9.png)
![[Diagram]](../../diagrams/36/76987627d0e6c72daba71b7b5645a768.png)
![[Diagram]](../../diagrams/50/5b2cbdca82b88c3d80e697dae386a419.png)
![[Diagram]](../../diagrams/7/fd060a60c547a407340366a5deaab422.png)
![[Diagram]](../../diagrams/17/c8d30cb09be4285ceccbfce83a62411f.png)
![[Diagram]](../../diagrams/23/b26468bc5ee456d0284cb22245ea6d38.png)
![[Diagram]](../../diagrams/27/6bcbc8d2cf6527e28df9047698e69779.png)
![[Diagram]](../../diagrams/44/0534af0f564b903da4a86ef8bdc045f6.png)
![[Diagram]](../../diagrams/17/aaaa54738d0546ab7731d3c7afa1bb2c.png)
![[Diagram]](../../diagrams/34/583b6ba9f4ae0e1de879a6edccecb864.png)
![[Diagram]](../../diagrams/25/b0dfdd765291369d7987c9b17637fffa.png)
![[Diagram]](../../diagrams/22/5c05168d8bc52236a48dde01bcf80157.png)
![[Diagram]](../../diagrams/38/eed71335958b470ede37cfd83073b129.png)
![[Diagram]](../../diagrams/27/79a675e448de77afe0425b1899d04e6b.png)
![[Diagram]](../../diagrams/40/1857a260ac6cd848d321e7aa2f1a584a.png)
![[Diagram]](../../diagrams/30/0fdeef882ee3876a0886899ede4ecfdf.png)
![[Diagram]](../../diagrams/49/080508044e3fd8e475a2f63a82614579.png)
![[Diagram]](../../diagrams/6/9053761ce55891291bd1b9ff89d17e4a.png)
![[Diagram]](../../diagrams/20/ec89a45179ad75b47b9408c2623ca378.png)
![[Diagram]](../../diagrams/9/9a9d2f90facde758ac47d96078780c76.png)
![[Diagram]](../../diagrams/38/6ce060ae4894866a664a53158e992d04.png)
![[Diagram]](../../diagrams/51/72815585f3db43c8d1502c98745feeb3.png)
![[Diagram]](../../diagrams/39/008c27eb98cce56571fab856ddbac1c1.png)
![[Diagram]](../../diagrams/25/29811083c45213dd6af2686780bf11d8.png)
![[Diagram]](../../diagrams/4/9960da16f8f163c465cb2598994c4873.png)
![[Diagram]](../../diagrams/52/48fe6e4dadaea193dcacd179ca523030.png)
![[Diagram]](../../diagrams/43/a6bb390ab43b6971704afe05b8072626.png)
![[Diagram]](../../diagrams/33/c00629f7e6f6f5e1e2910aeb9c522f07.png)
![[Diagram]](../../diagrams/39/8bd93d4d7650f583d2fd9ec3bf9f95c0.png)
![[Diagram]](../../diagrams/7/46d7d856e3a4d9a4d1adf5ec7d0bc942.png)
![[Diagram]](../../diagrams/31/2eb35f15eb782fbecee97f03e1474a31.png)
![[Diagram]](../../diagrams/11/862e9b424e9a5373f2920b7a679d7916.png)
![[Diagram]](../../diagrams/19/089f87b7aa314d9972cdfd9d72e0e9ce.png)
![[Diagram]](../../diagrams/35/ebdfa2f4a88c1f4521a69701473f44e2.png)
![[Diagram]](../../diagrams/12/8a1f8f727ba94c7f81994503615c6337.png)
![[Diagram]](../../diagrams/3/680dc397da3ed32a2422a70fa29c12bd.png)
![[Diagram]](../../diagrams/47/4e1f8e371ebca1abc98d6a906a885e06.png)
![[Diagram]](../../diagrams/31/34b943372fa788062a13eb010979e6f5.png)
![[Diagram]](../../diagrams/18/d81ef85b0f6f997073f0ac7f8fd0b402.png)
![[ext]](http://www.wayofgo.com/bookjacket.jpg) http://www.wayofgo.com/bookjacket.jpg
http://www.wayofgo.com/bookjacket.jpg![[Diagram]](../../diagrams/26/23524b80004dfcaffada934ee1d19dca.png)
![[Diagram]](../../diagrams/38/9daa90865ea3f5d50e9e0e0f7e4fb1c6.png)
![[Diagram]](../../diagrams/12/57ae8c50938d8740b10fa56c78dfd6ca.png)
![[Diagram]](../../diagrams/9/f375a1a83d4d0386ed87561239d0605e.png)
![[Diagram]](../../diagrams/35/ac8c23a9a01ab272cbd2e0b0bc25b0ae.png)
![[Diagram]](../../diagrams/2/0cd3a6bd24f5030645ad26e117687a2d.png)
![[Diagram]](../../diagrams/40/f92165b74a8cf44aceb23293fa0ba92f.png)
![[Diagram]](../../diagrams/9/20c49f7047dcadf099a69d126ba31468.png)
![[Diagram]](../../diagrams/5/adc9fa0a509b8364899b0332e07547a4.png)
![[Diagram]](../../diagrams/41/a828e97c5379712c847cc53d004972cf.png)


![[Diagram]](../../diagrams/52/bf79c87ac5ab59c7fb59e1fe70de9718.png)
![[Diagram]](../../diagrams/27/0d85534d97a3a7ab6d81ed8ca50b4f11.png)
![[Diagram]](../../diagrams/6/2216ef453aff64a648e7218698a0a313.png)
![[Diagram]](../../diagrams/20/d70d8c3cc8de7e329096d5448ca816ff.png)
![[Diagram]](../../diagrams/26/a248597d2b29844734dc848f69640bc6.png)
![[Diagram]](../../diagrams/36/f827aab9d9dc71465881b0ea4e4b7fbf.png)
![[Diagram]](../../diagrams/49/04b05faf06ba8fe9a697561978c1fcc2.png)
![[Diagram]](../../diagrams/39/c799e62791f100a2267e3b08c722a851.png)
![[Diagram]](../../diagrams/9/683d7d36bdb2103c25e2dcf963f723fa.png)

![[Diagram]](../../diagrams/33/9b3f983f8c0c57b655bc7daa3ddbf967.png)
![[Diagram]](../../diagrams/5/0899f91d5bf711b6503b060568ba1ec2.png)
![[Diagram]](../../diagrams/15/8da435c3c7fdf93e15958e6d437c8691.png)
![[Diagram]](../../diagrams/15/0f2e17c4d935d6d4c9bbbfbcde866d90.png)
![[Diagram]](../../diagrams/31/e34ec7e7c9e66f1b6de01ccbe36c8eb4.png)
![[Diagram]](../../diagrams/13/30b4fd46fdf8077f1ae51a423fbc81d1.png)
![[Diagram]](../../diagrams/7/cb9e75edddbc71e7012cae073979dd03.png)
![[Diagram]](../../diagrams/4/f1fbb56c24b0529f21a29f7ef0de6a55.png)
![[Diagram]](../../diagrams/1/dea74b5f935900a01337bea0d8b0a00c.png)
![[Diagram]](../../diagrams/44/2c78b11229f06e648e7cfdc53ef5bf77.png)
![[Diagram]](../../diagrams/48/55064cd29d66bd6f2bb87a7e4aeffbb5.png)
![[Diagram]](../../diagrams/38/b065723b63163a9f8ff3023fc0a6cd8e.png)
![[Diagram]](../../diagrams/26/e186bcdfcd06792928cc33ad46e8ef9e.png)
![[Diagram]](../../diagrams/35/a98e9c7d6925cad53498450dd28889c2.png)
![[Diagram]](../../diagrams/1/0cca9924985b68a4bcad43abea15eb35.png)
![[Diagram]](../../diagrams/12/949f85c6259d03d7b7a96f621c9024e1.png)
![[Diagram]](../../diagrams/11/04bce8e613349e507873344447d58184.png)
![[Diagram]](../../diagrams/7/25a1dbfc7aedc1fd7658740cef845d74.png)
![[Diagram]](../../diagrams/30/51cc15b33290f73e25f041e14aa5c49f.png)
![[Diagram]](../../diagrams/40/23f9eb96e9e036fd7cd1b0399c472365.png)
![[Diagram]](../../diagrams/44/0dacfb88bc0a281b08639b1c85e2acdf.png)
![[Diagram]](../../diagrams/9/132bd880de5b854248c102aa7af10a59.png)
![[Diagram]](../../diagrams/45/b903bb6681d42e8d39623b7719a6d06c.png)
![[Diagram]](../../diagrams/52/432d8e4e1d1b40b7990e07ade1396285.png)
![[Diagram]](../../diagrams/25/efb4ad5556e2478d0ace7027e6015de2.png)
![[Diagram]](../../diagrams/2/146778450539063c6bdb47f06c8dd041.png)
![[Diagram]](../../diagrams/45/760718c23bb048ea622bac30d8de503d.png)
![[Diagram]](../../diagrams/25/21c03db0e001bc3501d0dfc393fb3c6e.png)
![[Diagram]](../../diagrams/7/7960e9de4a0238f7b52cacbd1f3e8562.png)
![[Diagram]](../../diagrams/39/eaa4434983ee4cf4b67a8d68fba9b1ee.png)
![[Diagram]](../../diagrams/37/2905056ac28a06d249251268e466f68e.png)
![[Diagram]](../../diagrams/21/0fe86c09e2abb669ff783fd755805d6f.png)
![[Diagram]](../../diagrams/30/55f13aec255e02be7a764d3fa3bd9bbe.png)
![[Diagram]](../../diagrams/3/a0bd66e395667b520e45f2c3376d9c0f.png)
![[Diagram]](../../diagrams/3/e77e1ea560182ad06977d3e387632a1b.png)
![[Diagram]](../../diagrams/47/6c5193b23c42ddd1422031ea80189d44.png)
![[Diagram]](../../diagrams/5/aa54111e16f28371cc221102a79fd095.png)
![[Diagram]](../../diagrams/19/6862232b3415a1011aacfc8bbecc68b0.png)
![[Diagram]](../../diagrams/42/492a31bba34ca788db9aa755012655c2.png)
![[Diagram]](../../diagrams/23/92a0e074aabf931d5e480e87b38058c9.png)
![[Diagram]](../../diagrams/24/11de0a255cbd94c47b4a75eddc59b9bf.png)
![[Diagram]](../../diagrams/11/2e45e31765360de57c2daea8ceb933ad.png)
![[Diagram]](../../diagrams/0/6a5a1b3bcf8eb697792494a73946eeed.png)
![[Diagram]](../../diagrams/38/569f91253b1669f26eee026856628104.png)
![[Diagram]](../../diagrams/51/6948c6addfd622d3390c00abd0c52e1e.png)
![[Diagram]](../../diagrams/51/2a57b5b202c453d15e6006d1461c6cf7.png)
![[Diagram]](../../diagrams/51/20c4a3446f058202f4620bead3ccf911.png)
![[Diagram]](../../diagrams/26/7fe9e794c8cecd7d10e42754264f6b5b.png)
![[Diagram]](../../diagrams/22/3050b67e5816904da8a37f234a133e8f.png)
![[Diagram]](../../diagrams/50/2b5884999fb9ed69391cc37d2a0cac40.png)
![[Diagram]](../../diagrams/23/3a1f2fa8135ac5bb911f5f8432247f72.png)
![[Diagram]](../../diagrams/1/f9f82fa6bc5189efb5e647786bc6b902.png)
![[Diagram]](../../diagrams/31/fda2b094eb37716f705cdcc79eb290c3.png)
![[Diagram]](../../diagrams/36/25dde93b3f245281bb548367acc30127.png)
![[Diagram]](../../diagrams/25/1ba74916c987034cc2afe2c69187786b.png)
![[Diagram]](../../diagrams/50/87d97be9378abc262a091ab69d785305.png)
![[Diagram]](../../diagrams/1/1c9602259fd4b3e20ece638171bc08b9.png)
![[Diagram]](../../diagrams/18/bd895386ad9b3072466dc90cb9327615.png)
![[Diagram]](../../diagrams/50/e6e02c60dd785e2015fd093a1d959d2b.png)
![[Diagram]](../../diagrams/52/963e0ac21c4ca4a279514154168778e7.png)
![[Diagram]](../../diagrams/6/fc107509d73b794b5efaebf65f0ec09f.png)
![[Diagram]](../../diagrams/5/677ee195aea52f96ee93afaa66ef3070.png)
![[Diagram]](../../diagrams/30/e66acb1496fdf16429a18a646d32b0d8.png)
![[Diagram]](../../diagrams/13/1adf1908fe2388f72f5da925d4388a68.png)
![[Diagram]](../../diagrams/43/f3fa3f6681bfcdd2e128289745ad77a6.png)
![[Diagram]](../../diagrams/29/44d713301dcfd108fab8080bec10503e.png)
![[Diagram]](../../diagrams/45/e129e9fcf9bc1ea3c4fc08294ceb7174.png)
![[Diagram]](../../diagrams/17/56694968ef6fde97aa2e2d4c38db00c2.png)
![[Diagram]](../../diagrams/18/5d5c8670483eae722b562319f354eff6.png)
![[Diagram]](../../diagrams/35/e7f0b8a1a1e95e905cdc2217675a90cf.png)
![[Diagram]](../../diagrams/45/b1f9345e1a28a2e02133d48376944392.png)
![[Diagram]](../../diagrams/39/1fa28ddb87b2f69a289dd6bc44e1fa7c.png)
![[Diagram]](../../diagrams/36/5b6465b5e11187e69aab92244e7c3ca9.png)
![[Diagram]](../../diagrams/0/bc3d3d5f3cf39bba037ec61e045dc634.png)
![[Diagram]](../../diagrams/45/89f2cd6c6b61c9231599ccae07d78a86.png)
![[Diagram]](../../diagrams/29/325b0dbf52130f961f8b3ffd032bdf65.png)
![[Diagram]](../../diagrams/47/30238b3054b681b1718a660de482b311.png)
![[Diagram]](../../diagrams/30/9e26092f4b2e0735275b204e198bfad5.png)
![[Diagram]](../../diagrams/42/6344bf96d8b2fcfc0d0f21d363d636e7.png)
![[Diagram]](../../diagrams/35/5af98aa47ab85c6245a1cc2552912517.png)
![[Diagram]](../../diagrams/34/1505fa2b688d67aa376d34de783e73a5.png)
![[Diagram]](../../diagrams/22/936995a6b528437c9dfc183b4d5c8ee3.png)
![[Diagram]](../../diagrams/4/a06e49a4ae1a49a8afb4ecab7eb7dff9.png)
![[Diagram]](../../diagrams/24/f4524c8557c63ab12658a2b8197f1ef0.png)
![[Diagram]](../../diagrams/24/459f1b59a371dbb01cc364e1fbb583cc.png)
![[Diagram]](../../diagrams/22/bd661361c92ed796763f83b93931066f.png)
![[Diagram]](../../diagrams/22/166d248459a030ccbfecdf3d2d6ae393.png)
![[Diagram]](../../diagrams/32/2c930505313094bb6a39d1b3fd352469.png)
![[Diagram]](../../diagrams/38/005a8719611b0eca073a203a2943ea7c.png)
![[Diagram]](../../diagrams/27/bc5537ce3d8b2c133213c2379b36601b.png)
![[Diagram]](../../diagrams/43/ab9d1ef874fbfe3899d3f6b335c71b22.png)
![[Diagram]](../../diagrams/52/6300dde2e932c72458db786ce8e240a5.png)
![[Diagram]](../../diagrams/51/2b8cb2a5b7f6128096a061e24a1f2c2e.png)
![[Diagram]](../../diagrams/45/251063a7a3f4a11182ce243b8c6253d4.png)
![[Diagram]](../../diagrams/33/a9258dbef95be4296977a06646ef841f.png)
![[Diagram]](../../diagrams/31/183896bff3b975a186bae9bff9c7fc3d.png)
![[Diagram]](../../diagrams/26/3e43989973a88ff6d28f42af03d8393f.png)
![[Diagram]](../../diagrams/16/8379735e2139a98408d03caa7b8e166e.png)
![[Diagram]](../../diagrams/2/3d4ab315ce11ca2eb13a7c126ea950b6.png)
![[Diagram]](../../diagrams/51/c8ac31ade3ffaf61a3a27fd947f31856.png)
![[Diagram]](../../diagrams/44/6646b50b00325861c2204d886a3e0b0e.png)
![[Diagram]](../../diagrams/26/8586f546c6188b5cc182063e8ca373b5.png)
![[Diagram]](../../diagrams/27/2494ab5c782ae6b3c834ff921ac43b9e.png)
![[Diagram]](../../diagrams/31/4d47039f0731e584db086517c9a63302.png)
![[Diagram]](../../diagrams/30/997fd979f16396baf405ea4e7027aa98.png)
![[Diagram]](../../diagrams/35/a6816269131416a868b20823f59f07ab.png)
![[Diagram]](../../diagrams/47/bf30b123eab98757f48e792c88963412.png)
![[Diagram]](../../diagrams/6/340f9d5b2ab2d4688687e99d8344ff38.png)
![[Diagram]](../../diagrams/52/f69a16a87fcb729a5e54d45e90ed2a9a.png)
![[Diagram]](../../diagrams/19/a215a4c3701889f1a857858e15d13323.png)
![[Diagram]](../../diagrams/26/b599ba9a99d40048603b0d580aa22efd.png)
![[Diagram]](../../diagrams/28/09eceb04ec801f42a6b3742f47865680.png)
![[Diagram]](../../diagrams/48/45a52a8b7982554e47f85bd5129d0c64.png)
![[Diagram]](../../diagrams/12/403165bfd0a9cc0ba0d8d20eff8f6df7.png)
![[Diagram]](../../diagrams/27/3192ad9f1dc4e04e607118b9327eea8a.png)
![[Diagram]](../../diagrams/16/896b020d23e7ec55db048bb19570131c.png)
![[Diagram]](../../diagrams/31/86ac8554ca0dfa13bd8b0be52e115fff.png)
![[Diagram]](../../diagrams/50/be0c93439413465ad49879c245b98f28.png)
![[Diagram]](../../diagrams/44/4de7a35e7b5d53c87025f9e656c0607c.png)
![[Diagram]](../../diagrams/2/d81912ec194767599f38c0428e3a50b7.png)
![[Diagram]](../../diagrams/0/5f0cb3ab8c1ab9e4922a3991fd343cff.png)
![[Diagram]](../../diagrams/44/0662d06b59264d9c06e944904a07c28b.png)
![[Diagram]](../../diagrams/11/95a7875613d26d94f3785a591b5c7a10.png)
![[Diagram]](../../diagrams/20/5d6e45e217c024257194dc430aa50cbf.png)
![[Diagram]](../../diagrams/51/855035ed165951ba1c834af62e99d22c.png)
![[Diagram]](../../diagrams/42/1461b0bea84d6be204950edbe5c7d7e9.png)
![[Diagram]](../../diagrams/18/f4ddb49182e26598cc3357dabe0f0b6c.png)
![[Diagram]](../../diagrams/19/b07f51f65135e19be068f291970862a7.png)
![[Diagram]](../../diagrams/7/a72130deff463cabd8c3ef495c727d61.png)
![[Diagram]](../../diagrams/51/afaa1abad68c46d2e9358517bdebb739.png)
![[Diagram]](../../diagrams/38/f1411b8ad76f3b59cf246e2bed2d374f.png)
![[Diagram]](../../diagrams/29/1ef2e0a35e097d7682f741683e1b11fb.png)
![[Diagram]](../../diagrams/2/83b85739eae0ae90b289eede176d2b3e.png)
![[Diagram]](../../diagrams/23/25f9571767586bd76e63f2262df62892.png)
![[Diagram]](../../diagrams/52/6de37944c1de8c9253c7158e87c58ff3.png)
![[Diagram]](../../diagrams/48/7a09fffcd9f45aa0ed8b74f17d8146e3.png)
![[Diagram]](../../diagrams/14/9b789cd31e1527e99154ca73c792d73e.png)
![[Diagram]](../../diagrams/9/ea6de12d684f5e55682e66819b4a5f0e.png)
![[Diagram]](../../diagrams/51/b200460ecb5f6f87c5959783ece81811.png)
![[Diagram]](../../diagrams/10/3e82f8771e50fb2306340df34e636134.png)
![[Diagram]](../../diagrams/27/9a0e1c139500b0c810b7e1245b5921a4.png)
![[Diagram]](../../diagrams/32/eb596b856581b24a6e593a6d586d70a1.png)
![[Diagram]](../../diagrams/4/37d6cb0ff48820191293c7d260c16940.png)
![[Diagram]](../../diagrams/13/a97b82b9a19f7ba8bae7a1d3f1ffaca0.png)
![[Diagram]](../../diagrams/44/de9d752d124655066376d38feee29f41.png)
![[Diagram]](../../diagrams/44/ef63bf7fa91acc7bded9b387ff627fed.png)
![[Diagram]](../../diagrams/19/b5b2b7718b139281d2e12bbd4db76df5.png)
![[Diagram]](../../diagrams/22/2ebe860c53585f7bb5a4e2f202cd60aa.png)
![[Diagram]](../../diagrams/10/62e2441dbcbf8879a9aa261e05d325c4.png)
![[Diagram]](../../diagrams/32/ad57501e4597b8a53bbf6cf2a91750e8.png)
![[Diagram]](../../diagrams/40/1413c972a15407c0af1cf5c9db823065.png)
![[Diagram]](../../diagrams/37/e5a7f0e84bb7e1760da0fb0720cf3475.png)
![[Diagram]](../../diagrams/48/896611649e53fdd79f3959efd2ed82da.png)
![[Diagram]](../../diagrams/16/fe02728080ebd7a000cdd2496bdd3f48.png)
![[Diagram]](../../diagrams/10/5c5ffbe87ced9a1eb4d0e5064a3f494b.png)
![[Diagram]](../../diagrams/47/4e2a5044d110bd5e901d7d33e45be78c.png)
![[Diagram]](../../diagrams/9/670d2f6ef5294611428f6d601ae89c8b.png)
![[Diagram]](../../diagrams/44/7a84cfdc18a76a1e366775f9281f67ec.png)
![[Diagram]](../../diagrams/36/6d766c7a1e4cc4542f481b00b97e3328.png)
![[Diagram]](../../diagrams/32/7388f22d7a1a080c765ebc12be1fdd6d.png)
![[Diagram]](../../diagrams/18/90a45a5cc6d21096b5c19e0c7529b4aa.png)
![[Diagram]](../../diagrams/37/f4f678e31e027c0cbfc7e3c22a3c867f.png)
![[Diagram]](../../diagrams/47/237005a3bedf866200f0cf300a332f96.png)
![[Diagram]](../../diagrams/42/f70f8f1a2fa76c4395b818b402ae468d.png)
![[Diagram]](../../diagrams/40/daf6e24f2b87fd80a27b728493e9c735.png)
![[Diagram]](../../diagrams/50/4f06a8e556e366db302523febdb6059b.png)
![[Diagram]](../../diagrams/10/2fe9a990fbec635543bb26ec4ca84155.png)
![[Diagram]](../../diagrams/40/355a7814dab40452018dbff1ab890b5f.png)
![[Diagram]](../../diagrams/28/6ef9e8f321ef4c4f9a860abc49730a0d.png)
![[Diagram]](../../diagrams/43/2ee4f6f4777c0a15968f25586f525f59.png)
![[Diagram]](../../diagrams/9/6d59f40c4b9b654ac6def593637c57ff.png)
![[Diagram]](../../diagrams/8/23ad44ce6a8dfacb65ddcfea8060a493.png)
![[Diagram]](../../diagrams/1/861073db030b19bf6d8520034221fb17.png)
![[Diagram]](../../diagrams/33/477aaadf523bdc21a5ab64c176bdd0a8.png)
![[Diagram]](../../diagrams/43/6c618f5341bf24e21c2a6edfe382dd14.png)
![[Diagram]](../../diagrams/19/6a5fde7ee2a162cd46b4737a04862313.png)
![[Diagram]](../../diagrams/46/905091f927e410c851659b9ef5be7b68.png)
![[Diagram]](../../diagrams/24/f7fa78d398326d127dd79e3157742129.png)
![[Diagram]](../../diagrams/8/bce913e3aac9844e3a739dc2f8f7e13e.png)
![[Diagram]](../../diagrams/8/52608b8a89c2321cd991c2a1e3c85595.png)
![[Diagram]](../../diagrams/10/0c3d6d2710f5534889326f17ce93ccae.png)
![[Diagram]](../../diagrams/42/65f1df7f0827698802a1e9d8187f5327.png)
![[Diagram]](../../diagrams/42/f796d371126ba06cb36f6d0699343c86.png)
![[Diagram]](../../diagrams/39/1162b8d008f9f59d723dbb9f8f899f9d.png)
![[Diagram]](../../diagrams/31/f7e3bc4ba0d3a8cbeeb21f925027034b.png)
![[Diagram]](../../diagrams/40/8394d472bcd9ffb671f351f87ed7888a.png)
![[Diagram]](../../diagrams/44/78808977a75e0441c6a158fcfac55c30.png)
![[Diagram]](../../diagrams/28/75251fbe6f09b44a544f6f10f194b662.png)
![[Diagram]](../../diagrams/19/f04e9b01747194f851e0145f7967bd07.png)
![[Diagram]](../../diagrams/39/f86a2abb637a172e20212d2e05d67552.png)
![[Diagram]](../../diagrams/34/9c27c5fc7f9852999e1df3b7b2e66fb4.png)
![[Diagram]](../../diagrams/32/86b5892a1b3c00b6a41d8b15a49e35a2.png)
![[Diagram]](../../diagrams/26/e62710a5711f85fc0f0c4525064ded32.png)
![[Diagram]](../../diagrams/36/66360adfae864ba3496cb9703e302b2f.png)
![[Diagram]](../../diagrams/9/621382ee4c137b323f7ae4000efedfd2.png)
![[Diagram]](../../diagrams/52/3f464c3118a0ea28dfd62a7953e2ffd0.png)
![[Diagram]](../../diagrams/3/e9d887d5802a137d96da8ba72a26559e.png)
![[Diagram]](../../diagrams/29/c6b56f628610ee907d4df79a78a447ac.png)
![[Diagram]](../../diagrams/15/9e9bb64520122ae412fd4264c48a6e68.png)
![[Diagram]](../../diagrams/42/81072f82c0d54e4782412e5bb2cee1b2.png)
![[Diagram]](../../diagrams/36/7faf916d4314ac6740b984217a02f0d0.png)
![[Diagram]](../../diagrams/36/ac171a2da5b123192974b460c4d0a3ed.png)
![[Diagram]](../../diagrams/8/485bc49db46dc263efdd6de7a14ae100.png)
![[Diagram]](../../diagrams/17/a218c2f0ffd671df6d67959ad82394de.png)
![[Diagram]](../../diagrams/29/21cd69c19b8554a56fa7d0f05fec01f3.png)
![[Diagram]](../../diagrams/3/7cccb7d71c3c8e19b44143ee3b632023.png)
![[Diagram]](../../diagrams/13/5b8fe07f543075f9727621d3f9a8f90e.png)
![[Diagram]](../../diagrams/17/16c326b24ccab05dc447107966692d55.png)
![[Diagram]](../../diagrams/46/544f577e13539a045082973fd83dd34c.png)
![[Diagram]](../../diagrams/49/a9f799090ad44d67d466954dcf10e80c.png)
![[Diagram]](../../diagrams/42/ccbd640d4719000bbf5b033e532a3451.png)
![[Diagram]](../../diagrams/16/c3a0323ee1587419270c8d3050bc89f0.png)
![[Diagram]](../../diagrams/37/bd84da28d3c76b44871fc8e9e0dc9f4d.png)
![[Diagram]](../../diagrams/11/fb7aab9bca354b11bd9e0a4c4c1fdab1.png)
![[Diagram]](../../diagrams/12/9adc844bc16c50779fd1a26e14c90e0f.png)
![[Diagram]](../../diagrams/29/36b136fd879315d30fe7c310b8d80657.png)
![[Diagram]](../../diagrams/16/27cbecbd663a484d731b0d4813179394.png)
![[Diagram]](../../diagrams/52/ae403f901138243cdbbc1e7d3a0b23d2.png)
![[Diagram]](../../diagrams/52/fb039dde1d493fafe5d575d7d3a702d6.png)
![[Diagram]](../../diagrams/6/3942354040ffa466cf85abdfe356560a.png)
![[Diagram]](../../diagrams/14/47480f91ef6adfe1fd0973ec651c5a84.png)
![[Diagram]](../../diagrams/39/ed96cfe271104f69cae0501f073b4a8e.png)
![[Diagram]](../../diagrams/44/a657a93010d9de22aa7cc22871aa6bcc.png)
![[Diagram]](../../diagrams/32/a2c098a0a144d7844af76b1d5075ee17.png)
![[Diagram]](../../diagrams/23/aa0bf857de3327d4569df11dea20606b.png)
![[Diagram]](../../diagrams/23/53cea6f66f70671eeaa3d5ddefac3f31.png)
![[Diagram]](../../diagrams/21/686b5637f5f9241c690bb054bd8e45f0.png)
![[Diagram]](../../diagrams/17/2fe9250dfb46ca78fa2213690642fbcd.png)
![[Diagram]](../../diagrams/18/7a52293422df8574ff775cf363fd9e3b.png)
![[Diagram]](../../diagrams/31/1422bd362f8a264abefa4062d0fdb677.png)
![[Diagram]](../../diagrams/0/d47407a6b990a1ea14637565f1f7dbae.png)
![[Diagram]](../../diagrams/23/d6f05405fe15dbecd4605304dcf43ff4.png)
![[Diagram]](../../diagrams/17/6edef65218ecd6f57f72132372400f96.png)
![[Diagram]](../../diagrams/17/5f4fb9b2970a318fbaeae8249db25b26.png)
![[Diagram]](../../diagrams/15/d5e7a0c215182871edc821e5f2b3c4a4.png)
![[Diagram]](../../diagrams/35/a6a61e3641cbb5c7d8763d42ac5aaada.png)
![[Diagram]](../../diagrams/19/573d1fc5617074fe1355a2a6d1264243.png)
![[Diagram]](../../diagrams/0/1ac7e475399a926fcbb4d5ad8139082b.png)
![[Diagram]](../../diagrams/1/718fa7bbc90b9e18bdd9baffa7ebdeaf.png)
![[Diagram]](../../diagrams/17/052442d2accdc51cb2518b6d02534a40.png)
![[Diagram]](../../diagrams/7/67288bb9d3468ff683cc69fe598e644d.png)
![[Diagram]](../../diagrams/49/ff62935f860b73e72e8d9f0f3d4f49ce.png)
![[Diagram]](../../diagrams/4/128c4530b595aedb3ed31510cc00d979.png)
![[Diagram]](../../diagrams/49/239c64aed2ba24f4deb1a27b937149b2.png)
![[Diagram]](../../diagrams/34/f18900d7239960c99cdac03c34869589.png)
![[Diagram]](../../diagrams/11/dfb11ae2a4ad76744b7c0c84eb53fb6a.png)
![[Diagram]](../../diagrams/25/db224c579f16e45afa71b0bacc313a1f.png)
![[Diagram]](../../diagrams/9/9e24bcb21a0a4dfc9d4ce45e7b5e4bd4.png)
![[Diagram]](../../diagrams/10/06b329ca921d00e1541075be28d5a370.png)
![[Diagram]](../../diagrams/16/0c8ce0ab6fe23f2dc0ee4ccee667bba1.png)
![[Diagram]](../../diagrams/30/fd4a6648a601d3bc9e1813ea3082d7ba.png)
![[Diagram]](../../diagrams/0/7e71dd479c95b6e9f719a064f515fb56.png)
![[Diagram]](../../diagrams/24/45c4f0f0a693d2c72fbd265ed942d5fd.png)
![[Diagram]](../../diagrams/14/7f7a9410a1b8954402f1b6616da14f7e.png)
![[Diagram]](../../diagrams/39/b68ec505f2d89b01877fd24a95459185.png)
![[Diagram]](../../diagrams/25/c9c960c07abfe5f632dbddcacb2e86cb.png)
![[Diagram]](../../diagrams/52/e922f765bd173aea306b304aca7a8f4a.png)
![[Diagram]](../../diagrams/42/949351b055b7a0e616a4db1326c12649.png)
![[Diagram]](../../diagrams/9/702e1c1467576188ce7047796e545f9d.png)
![[Diagram]](../../diagrams/18/c46acb194131132d5742a0798aac70ee.png)
![[Diagram]](../../diagrams/14/2a8f4abd74a044acb2fa5ec5a1e199ac.png)
![[Diagram]](../../diagrams/12/8a1b20dc6a139a358b267cf5de0bd3f3.png)
![[Diagram]](../../diagrams/13/91025669d01138a60575d853df5c9199.png)
![[Diagram]](../../diagrams/4/1961f55c62ad6a2f9fc11f64f4ca8639.png)
![[Diagram]](../../diagrams/47/b898e1fef939769813289b88b6e684b0.png)
![[Diagram]](../../diagrams/1/6a4b7013db7c55b61e4a1ffca0a113d1.png)
![[Diagram]](../../diagrams/38/b1936cd6d24419c52fbe5cd96e5af891.png)
![[Diagram]](../../diagrams/38/1789880ae5c1aaf04522ae1ade705c80.png)
![[Diagram]](../../diagrams/21/d3a1b8cf38cf8ff6d638ef9a7c671d43.png)
![[Diagram]](../../diagrams/2/fba316f3563bf20a40203379082b8cb2.png)
![[Diagram]](../../diagrams/20/e4bad8694a7cc3abecabad6e50e52b81.png)
![[Diagram]](../../diagrams/38/aaed0bb1be59057334a8be55fef21a9e.png)
![[Diagram]](../../diagrams/45/08f562c4d87885d96f5267cc6a035365.png)
![[Diagram]](../../diagrams/35/c4843fd834fe9004b1cb3a86b61ec40d.png)
![[Diagram]](../../diagrams/23/2ce03d80e3155aca4254ada19b4d7034.png)
![[Diagram]](../../diagrams/45/5434b729cf8b276277f8ed3e522e06d4.png)
![[Diagram]](../../diagrams/6/c872b2dcafca8c4c10c453616448f0ba.png)
![[Diagram]](../../diagrams/35/0a0ee0aaae815bd978ad613f213ed848.png)
![[Diagram]](../../diagrams/38/8f4cd975c6606b5dce36cc827e0525d7.png)
![[Diagram]](../../diagrams/38/6bda1305c8ff47d702cc8088ec71f82f.png)
![[Diagram]](../../diagrams/37/9100a9e04e1b1da104a4c491ca738ce3.png)
![[Diagram]](../../diagrams/23/49a1a2e1b7df9c4dafe96277e32da24b.png)
![[Diagram]](../../diagrams/42/b6d04f76a695e1d60601cf8e3cc810a8.png)
![[Diagram]](../../diagrams/10/a639704b88d43d985d222bf88184253f.png)
![[Diagram]](../../diagrams/32/377e8d16c07a1a23fa0acb79ca4a860d.png)
![[Diagram]](../../diagrams/50/287d1d6121f1da9b19846eda0854489b.png)
![[Diagram]](../../diagrams/46/8fa9fb2b40963168d51fc03e8ac65cb0.png)
![[Diagram]](../../diagrams/8/72b5931e6623cd46e0481655810b56ea.png)
![[Diagram]](../../diagrams/49/48d97ac3669975b7770368dc9ffec119.png)
![[Diagram]](../../diagrams/19/0f06da7d662c52bdab6efbeca4feecec.png)
![[Diagram]](../../diagrams/32/79369b602c86f066bddc9a899bd68e7f.png)
![[Diagram]](../../diagrams/39/a5148531833e0429d5933445396ede59.png)
![[Diagram]](../../diagrams/9/d7a3df4dd2156044c08e2020b970a1f7.png)
![[Diagram]](../../diagrams/19/6e0c032059f3c57c4358797659ce9b08.png)
![[Diagram]](../../diagrams/4/40e66422c46e6f7536f712c91fb7dc33.png)
![[Diagram]](../../diagrams/42/45b3fd5d60dd6d107b350f0ed5f85cb6.png)
![[Diagram]](../../diagrams/20/963f35213b0c565dc3fce6b671039efd.png)
![[Diagram]](../../diagrams/38/fb460c70af211322c2c15a4de96e3f3d.png)
![[Diagram]](../../diagrams/8/31c3f16a583e9acbd941a4c95dcb444e.png)
![[Diagram]](../../diagrams/26/0d78883cc536a6e5f175034ca900efa3.png)
![[Diagram]](../../diagrams/4/37c7cc218cf08bb5163f064a9741d680.png)
![[Diagram]](../../diagrams/12/1568302415f0171fb5cda34b0854e319.png)
![[Diagram]](../../diagrams/30/08aff8ef93ced61a468315082fad36aa.png)
![[Diagram]](../../diagrams/27/03a2eaf6c21f19177a49530746744c4e.png)
![[Diagram]](../../diagrams/26/297617340bd2a35080794995299bdc96.png)
![[Diagram]](../../diagrams/25/3afcb4b0cb125c91a0abe61d06ff4a1e.png)
![[Diagram]](../../diagrams/6/c379f88ebe95b12e41a08d25a1952ce6.png)
![[Diagram]](../../diagrams/29/fa01de5ab761eb22f0f39e202a03624c.png)
![[Diagram]](../../diagrams/27/f820a9c1f5fc72aa9956f8a248cf8b67.png)
![[Diagram]](../../diagrams/18/c2e8ced3d479c59824dff57b588e11d4.png)
![[Diagram]](../../diagrams/39/600afabd9de0bcf3384eecb037c6fd88.png)
![[Diagram]](../../diagrams/0/81b9e11aaf2ffda7b8be6b74a78087ce.png)
![[Diagram]](../../diagrams/10/9f6f4393e8d9a8fcfe66e26d55f6293c.png)
![[Diagram]](../../diagrams/36/19a4c76103ca66b7dec00fe137302bfa.png)
![[Diagram]](../../diagrams/49/0ae378116b1e89a1ac05e4dd4ad6ddcb.png)
![[Diagram]](../../diagrams/12/b6592bcfefe2014af547a4b44fa22113.png)
![[Diagram]](../../diagrams/23/664ae3f8015fdd44bb1e9440997a8714.png)
![[Diagram]](../../diagrams/39/b49f020948a23888e7d6e47446f6353b.png)
![[Diagram]](../../diagrams/15/fe7d79e73d0f82ec66c9bd7cc28a7b8f.png)
![[Diagram]](../../diagrams/12/ed8b7127348d926cb220d739d7a33b1a.png)
![[Diagram]](../../diagrams/51/bdeea3c91bb8d8ab4d0f6cf83a96f35a.png)
![[Diagram]](../../diagrams/31/842a3dd59ae5c12d330e79bf46d1de14.png)
![[Diagram]](../../diagrams/8/5157ab13a8c1a3eb0aae0e096e08ce46.png)
![[Diagram]](../../diagrams/30/2a463a419ebd5c569af7d885f2657e6c.png)
![[Diagram]](../../diagrams/42/1faf7da4f4476c3ef9df5803edf971ee.png)
![[Diagram]](../../diagrams/3/f9aaf7f45ad05ebef550f69f24311f38.png)
![[Diagram]](../../diagrams/25/006e1efb2099db5a0baae798ed758274.png)
![[Diagram]](../../diagrams/7/ac359988aece0d61351daecb9eccdd0b.png)
![[Diagram]](../../diagrams/21/fa0730df9b8c05c1d43b0891ae017ac4.png)
![[Diagram]](../../diagrams/36/d40df535d57152c21ac5824935585693.png)
![[Diagram]](../../diagrams/49/2aeb0c3684ba4d1b6f355584fdb86aae.png)
![[Diagram]](../../diagrams/45/ed8e2b32bb9212c65ee29b797d632dc9.png)
![[Diagram]](../../diagrams/16/99a9d3b07d7a6c850d7cf0af3f9be200.png)
![[Diagram]](../../diagrams/40/9ead6b6eaa72eade32d520d960f9fa6b.png)
![[Diagram]](../../diagrams/8/4552c81216274ef611a12894a0b459a5.png)
![[Diagram]](../../diagrams/31/5e71ccd79a9b659f8da16207f08fb76a.png)
![[Diagram]](../../diagrams/21/ad71b134882baa5d0c00ea087176a91d.png)
![[Diagram]](../../diagrams/30/a1f627cf4f330b3c3aa4f27263fca0aa.png)
![[Diagram]](../../diagrams/47/21406256cadcf0416dce704113bf5cc2.png)
![[Diagram]](../../diagrams/40/2b3e97ace2a7cf0cb87c13da38ef8e6f.png)
![[Diagram]](../../diagrams/28/a79334e059c8067991cfd248fd080d0d.png)
![[Diagram]](../../diagrams/35/5bf185c294536bb2f7cc399e1af20dfc.png)
![[Diagram]](../../diagrams/31/25b5548ca9044828534b7cb5d207f6af.png)
![[Diagram]](../../diagrams/35/6e3b8ffbff0ee47018927da39265cbe3.png)
![[Diagram]](../../diagrams/8/839b8f9f6161ef49c61e1710818e7fe1.png)
![[Diagram]](../../diagrams/22/0e9c9260fa55b65351f83bf4cfb37de5.png)
![[Diagram]](../../diagrams/22/bc03554056eea730eafcaa2647e42b35.png)
![[Diagram]](../../diagrams/24/9de3b155ae8abca01ae8034659e709be.png)
![[Diagram]](../../diagrams/3/d80f7d2e01defa01f34286c83d911dcb.png)
![[Diagram]](../../diagrams/28/e68b764baeec488ef11f823b168419cd.png)
![[Diagram]](../../diagrams/46/18a692fb869ad02ed87cf54502214e54.png)
![[Diagram]](../../diagrams/29/7af6e2bc5cd01e8da5fe7c072fbd1d2c.png)
![[Diagram]](../../diagrams/37/84b619d4a9836d986cd89fddd00f9c05.png)
![[Diagram]](../../diagrams/22/60f016f188ad316e9ec77c59cdebe8a4.png)
![[Diagram]](../../diagrams/21/d95ed9a4749dcf9e2ecaf9ce5d1e4588.png)
![[Diagram]](../../diagrams/37/99fbab792d0f6c7736d2c4d3552ceb25.png)
![[Diagram]](../../diagrams/24/d5f7bd09b9ddb262d7d85a738c4b67bb.png)
![[Diagram]](../../diagrams/19/9bad918f058d45b3f3a2a74af2cbe8e4.png)
![[Diagram]](../../diagrams/46/d49d47ff0bc7659651f96c63c1f3f0e2.png)
![[Diagram]](../../diagrams/45/d8f609859d4e2da83565b69e01c0f7cf.png)
![[Diagram]](../../diagrams/12/c39a2c595f7e9a6c264b2ce584e3caec.png)
![[Diagram]](../../diagrams/8/ea0463c656ca8fd4ce994681ee3c42ec.png)
![[Diagram]](../../diagrams/51/3af6ce834bed1171318367ed795cd938.png)
![[Diagram]](../../diagrams/47/7484727c9ef0f09b82654987e81b8269.png)
![[Diagram]](../../diagrams/46/96a4c1981f8a8936b44aa1fed5485b16.png)
![[Diagram]](../../diagrams/0/2f6a03d9d780e5c7245fc8b47a5a312f.png)
![[Diagram]](../../diagrams/52/c9889b571ead154a961043260f1d8092.png)
![[Diagram]](../../diagrams/44/423f937dd76cc86c97ffda9b0896dba3.png)
![[Diagram]](../../diagrams/1/b34895790a7fcee058a9c10995bdb7e9.png)
![[Diagram]](../../diagrams/5/c2dd17e7ab3ce0e7b5b2c94109936265.png)
![[Diagram]](../../diagrams/30/5d49a54598b0f89c0ca3c465679a3e8b.png)
![[Diagram]](../../diagrams/7/5ade28f2ae1198eb093da39990f0003c.png)
![[Diagram]](../../diagrams/46/6afc20da07d1daab7d227f3b45f2d939.png)
![[Diagram]](../../diagrams/20/3ac3c5109de87928ba3328f54d924bad.png)
![[Diagram]](../../diagrams/11/0b4e87238a0f5c37608b3df1e5b08a90.png)
![[Diagram]](../../diagrams/26/2ebb6ca06d53ff3cc70222681dc7b9fd.png)
![[Diagram]](../../diagrams/31/4a2fd9f6757a9aa1ea6e27b4e419418f.png)
![[Diagram]](../../diagrams/45/83f762e43260cae73cefc4727539958f.png)
![[Diagram]](../../diagrams/2/05390c4ff880646722450749ae0059d0.png)
![[Diagram]](../../diagrams/8/0b84e36159c97356e6135fb82f9ad56f.png)
![[Diagram]](../../diagrams/52/ca5cfb0b17878f6df50098d674f9c1ce.png)
![[Diagram]](../../diagrams/35/af90a91084360964bf18b746c55e92de.png)
![[Diagram]](../../diagrams/3/95db9fd31fcf39d0798802443998eda1.png)
![[Diagram]](../../diagrams/46/f9714db74351ca6533a100589366d933.png)
![[Diagram]](../../diagrams/41/605884477a772c9cc03ae05e91c4e99f.png)
![[Diagram]](../../diagrams/43/cf12481a65408d77f16362dcbb8a56af.png)
![[Diagram]](../../diagrams/9/48dafeec4e6ff624f56d2bc4b6604218.png)
![[Diagram]](../../diagrams/46/ae96bc3809305f82c14487a63281eb33.png)
![[Diagram]](../../diagrams/25/fcd8fc470d77a85bcd9ad8cc36c4e2bb.png)
![[Diagram]](../../diagrams/12/3a2188e938b5dcf33d59722fa6ae45f7.png)
![[Diagram]](../../diagrams/12/b780fd581a59b6c0d6f560889d4c136d.png)
![[Diagram]](../../diagrams/45/db9b3b558060a06c45d6e2954bde535e.png)
![[Diagram]](../../diagrams/19/448d98f7c58b78efb2e901148f7f904a.png)
![[Diagram]](../../diagrams/21/0c53d9e79a87edda348b72856eb8e84b.png)
![[Diagram]](../../diagrams/18/f01aa12ec70ad6ce9e305ae5d7ef1003.png)
![[Diagram]](../../diagrams/19/db0c6c9e92c87e5a7e3221c8062793a2.png)
![[Diagram]](../../diagrams/37/023ec9d6f21bd2b79aca21964b84c7d4.png)
![[Diagram]](../../diagrams/14/8e1d78c55c84fbbe5d8003ffb7a63d7d.png)
![[Diagram]](../../diagrams/29/96e71f22efd511408cea3d2ed9b27b8b.png)
![[Diagram]](../../diagrams/19/94a26f4e2c73a6e19fc41d98f800dcec.png)
![[Diagram]](../../diagrams/18/2e9ea0bbabbf10ddaffd1635e1530a62.png)
![[Diagram]](../../diagrams/3/521217560460e8df66e9d177e26dcba7.png)
![[Diagram]](../../diagrams/14/3955b3063ffa23cdcea72b3f17c8d848.png)
![[Diagram]](../../diagrams/30/e5ca4ab12fb6bacbebb196240753f9b3.png)
![[Diagram]](../../diagrams/5/d40cd6d2a4dd1da58c91b9e799be8e0a.png)
![[Diagram]](../../diagrams/27/6b2a5851492f05d1325f2e5527d4b3ad.png)
![[Diagram]](../../diagrams/22/fb94078adc4d8394602d09034a7ba3ce.png)
![[Diagram]](../../diagrams/39/33eae13660e440553e521063d81547de.png)
![[Diagram]](../../diagrams/19/bca162a819beb70ac3c5b94235d84c52.png)
![[Diagram]](../../diagrams/45/809e0434d6f8fcc378d50ef04dddc966.png)
![[Diagram]](../../diagrams/6/c1ea7b765cce81bdb3457609623c40fe.png)
![[Diagram]](../../diagrams/18/d865d78d5b6b9e03303c8940bf269707.png)
![[Diagram]](../../diagrams/37/3ecc77220817df302fa17172abe2f36d.png)
![[Diagram]](../../diagrams/24/e8f95dac112bfcd145f37aa704a0ff5b.png)
![[Diagram]](../../diagrams/11/fb3c08e4713c2a0386f8c7017f4af74f.png)
![[Diagram]](../../diagrams/17/4fbda0ef3f0831e3a9f8d3666c6c02f4.png)
![[Diagram]](../../diagrams/26/d651e26cd8e0bd8c90abcc6c38ded0ad.png)
![[Diagram]](../../diagrams/42/419e386431e8b94fd7f670807f83439d.png)
![[Diagram]](../../diagrams/45/947ee3bf531625f82084d47b256b7b3f.png)
![[Diagram]](../../diagrams/6/a56e475c300ab210681ad226f6c06f15.png)
![[Diagram]](../../diagrams/0/1524eb101853ac8ca1c82476c769898f.png)
![[Diagram]](../../diagrams/28/15a3197f8e15d107c38213bf78ad4c53.png)
![[Diagram]](../../diagrams/2/864eae1afb6ac2c3be11b3576970d7db.png)
![[Diagram]](../../diagrams/29/e7f70e940e8da033c5d166a1ff2debc0.png)
![[Diagram]](../../diagrams/20/c2d15b675c86f5b6cad88e9d410e41fd.png)
![[Diagram]](../../diagrams/48/2d9a35842ba61b927fce8c048d93360d.png)
![[Diagram]](../../diagrams/48/00598a236dda7ab425e0678f55cad53d.png)
![[Diagram]](../../diagrams/11/02a7889634dea3ebca61a869b81f3d1c.png)
![[Diagram]](../../diagrams/50/251337ab2eb6a61e09eae6ecfeb9b12a.png)
![[Diagram]](../../diagrams/27/9c11478c4f1fb47dc8f23ab89ab61899.png)
![[Diagram]](../../diagrams/32/462cd8dc447e402f97426b69cce53c0f.png)
![[Diagram]](../../diagrams/3/62a880fd3b511ed09e257dae308293cc.png)
![[Diagram]](../../diagrams/44/c4470cb6f2436457291fe09dbbc1f24b.png)
![[Diagram]](../../diagrams/30/07f9d8e31ba334d82d78903b73917e5e.png)
![[Diagram]](../../diagrams/24/3ab77453c4fdfeb8ec692291fd101858.png)
![[Diagram]](../../diagrams/27/7619b96b2905fca4ab8696b3fc6c473c.png)
![[Diagram]](../../diagrams/50/be3c1cef4be5c42d16a6caf0f4421a8c.png)
![[Diagram]](../../diagrams/2/e2388997423eea06cbf4280fc73459c3.png)
![[Diagram]](../../diagrams/46/ba91e31bae59c78428bd6d073ddb8601.png)
![[Diagram]](../../diagrams/28/f045aba7480586c96963691f475a007b.png)
![[Diagram]](../../diagrams/23/62d0ddf8aa4ccd751547466dd1801f52.png)
![[Diagram]](../../diagrams/26/805e48a6e3607a61b0419bff9b3bf3e1.png)
![[Diagram]](../../diagrams/13/e494b0c182bbb43124e2588db70e8ca5.png)
![[Diagram]](../../diagrams/41/0673af6bf8400b46079fd377038da734.png)
![[Diagram]](../../diagrams/36/916da34b04659eaae27f22b21c29997a.png)
![[Diagram]](../../diagrams/31/1356e5e801052979505e2f0d1e66d7fc.png)
![[Diagram]](../../diagrams/35/a4fbbe7371af0901b1c62d4a555c4f28.png)
![[Diagram]](../../diagrams/5/4683bfe653d4f1929b569a82fe355002.png)
![[Diagram]](../../diagrams/27/f7f97898ce391651f60b135636b071df.png)
![[Diagram]](../../diagrams/42/37091f147846f1083bd96deed5ad2036.png)
![[Diagram]](../../diagrams/7/038b2437e1ed7a7601f45add44bc4cd0.png)
![[Diagram]](../../diagrams/40/7a3b26969b9e5e983fa179db5f5c9ee6.png)
![[Diagram]](../../diagrams/50/0036b7b872235040b44df64eda7126c0.png)
![[Diagram]](../../diagrams/48/d7e724a4847f72a7b304a6755fe7b678.png)
![[Diagram]](../../diagrams/32/207169ca31c420df77389769e5f35307.png)
![[Diagram]](../../diagrams/35/d0a489ac5ff74bce79512a3a2444754c.png)
![[Diagram]](../../diagrams/23/366b275f8e2c4f8c2c0cd8a61fa88727.png)
![[Diagram]](../../diagrams/32/af5345f3e74d1523e6b90a0cabed10d7.png)
![[Diagram]](../../diagrams/50/9df1456b567b9081c1a98f77c55e7909.png)
![[Diagram]](../../diagrams/29/7237db3fcd69802b5746457a3982e26e.png)
![[Diagram]](../../diagrams/24/effe36cb692a652a2eed9628dd369ad4.png)
![[Diagram]](../../diagrams/37/b892a3ec0ab59298bb6b17f46305f032.png)
![[Diagram]](../../diagrams/13/54dc416c93db1ee60c3390d3aee02f8e.png)
![[Diagram]](../../diagrams/4/2139e3b51b03c857d7bc32ff16988c83.png)
![[Diagram]](../../diagrams/26/500de1af3abd8a87a71082b9d5baab32.png)
![[Diagram]](../../diagrams/44/e97bdf3cc5909c13abd9d61542fc5a0f.png)
![[Diagram]](../../diagrams/11/1dbe6cba431c76ad606af944502fc03c.png)
![[Diagram]](../../diagrams/29/cbf2cb6fbc2ad0e4ba586d7b1fb96e89.png)
![[Diagram]](../../diagrams/20/f96b96759eae838b7a788e803492b782.png)
![[Diagram]](../../diagrams/9/cce31eeba784f1ac2f68292c3eb6f860.png)
![[Diagram]](../../diagrams/12/496bf7a896fbbf37b6ac02b87c009f7f.png)
![[Diagram]](../../diagrams/23/3c1134f8f7a86c5f1f2d6203540bb907.png)
![[Diagram]](../../diagrams/34/ffdeddcb93befdcfdfad5e451dbae112.png)
![[Diagram]](../../diagrams/48/a2f69d361a4ca9c6c392c5b1e7b3418a.png)
![[Diagram]](../../diagrams/4/674186a8216a4d748a4606951f432c09.png)
![[Diagram]](../../diagrams/34/b709570ddd7a8ed89e1bc75ef8f2e1c4.png)
![[Diagram]](../../diagrams/34/65a2faedf9448df0b045695f2f76fcdf.png)
![[Diagram]](../../diagrams/19/f724655b31c27c02bbcb9966e7ad0a4a.png)
![[Diagram]](../../diagrams/12/cd0e9631bc0a1c700fa9e5a9708a0d98.png)
![[Diagram]](../../diagrams/45/dfc1026a8a6cb7a1330abedc025b6314.png)
![[Diagram]](../../diagrams/50/78342d9918cae2b7d0078d73a4ad199e.png)
![[Diagram]](../../diagrams/20/4c1f2aed9a70f488a76fa7a7bb2defe2.png)
![[Diagram]](../../diagrams/32/259063b6c77e216997fe33433780275d.png)
![[Diagram]](../../diagrams/6/4470a1afe07ceaff47cc5473cece6288.png)
![[Diagram]](../../diagrams/40/8b2d6e202dbdf605126ff92bf5e10b59.png)
![[Diagram]](../../diagrams/0/6536500bf02ae47f8aafa56ca88dc58e.png)
![[Diagram]](../../diagrams/25/e093cbc6b3d66fc1aeb875369be62433.png)
![[Diagram]](../../diagrams/49/c9b0328ab48b6aaf7a9066fbcb867dfb.png)
![[Diagram]](../../diagrams/41/0e89dddf7d0d3636d5abe6544ba0b602.png)
![[Diagram]](../../diagrams/22/1daa51ebdedcf5e76ac3333868f4d75c.png)
![[Diagram]](../../diagrams/4/d5435d500ecbbe0ca78a525083a52877.png)
![[Diagram]](../../diagrams/23/f711632ab973bea42416cf2ba94925b7.png)
![[Diagram]](../../diagrams/26/464b72f59c3c9dcdf15f14165d797c6f.png)
![[Diagram]](../../diagrams/32/72ee8dd35186ef10e88669e29d11720a.png)
![[Diagram]](../../diagrams/2/bd5ee8e989b46430d764526f10019c55.png)
![[Diagram]](../../diagrams/48/d81db99820f0b5c9bb81e1f0d48af0c2.png)
![[Diagram]](../../diagrams/38/6e74bac781a5e2f8b5ddf1e28738a3b0.png)
![[Diagram]](../../diagrams/42/fc251a6c09f948834f29c41865a5906f.png)
![[Diagram]](../../diagrams/39/d6487d2c1367fc68ca570ec84189126e.png)
![[Diagram]](../../diagrams/35/da6eb4ab901b5d6645f8dc5fbad2ce45.png)
![[Diagram]](../../diagrams/13/0fc10817a3848fdc27f7278498673904.png)
![[Diagram]](../../diagrams/35/81603ec384f98063016358e97ef412d3.png)
![[Diagram]](../../diagrams/1/ce6a2244075f720f9cc8c5034c5b4737.png)
![[Diagram]](../../diagrams/35/a3f959ca1c800f8daeef3c4c12e409e9.png)
![[Diagram]](../../diagrams/29/670a626950b92d71e6a744b40e669b6d.png)
![[Diagram]](../../diagrams/41/a1f09f8d9d479ed3aa88e13ad23ad560.png)
![[Diagram]](../../diagrams/21/6683e989cd42d223c06499547034dd5e.png)
![[Diagram]](../../diagrams/46/b63b250e392d42ee18c6caa4047e3ac3.png)
![[Diagram]](../../diagrams/10/fb19d5001760a24f07509eef10cf8ea7.png)
![[Diagram]](../../diagrams/44/1feea48dfe73b1e0e3b8e9a31f111110.png)
![[Diagram]](../../diagrams/36/462e14c86786f007a365c78fd8a06945.png)
![[Diagram]](../../diagrams/33/a319c8dc58627e3cdb4985df6df0cce7.png)
![[Diagram]](../../diagrams/35/dfa498818c18adc68946412db97d9373.png)
![[Diagram]](../../diagrams/20/13fe5595dd722368d509c5dd420076e7.png)
![[Diagram]](../../diagrams/36/21f23177db438a22f63c345f0486f66f.png)
![[Diagram]](../../diagrams/35/73ad9c1ffc1afade9f853dbf3ef56df3.png)
![[Diagram]](../../diagrams/3/5b476c303a94fae2991d5ffb404862af.png)
![[Diagram]](../../diagrams/22/711fed572e2c960a873bd6cdaa03c71d.png)
![[Diagram]](../../diagrams/21/adaf3258b6e42839bb67d7715c0448f6.png)
![[Diagram]](../../diagrams/46/37c68de060c08ffdfe366862902ddafe.png)
![[Diagram]](../../diagrams/46/1246d2da2092f48f7d0f5f61d11b2440.png)
![[Diagram]](../../diagrams/49/4c08c49cff81673e44bf5d84c7a8c34c.png)
![[Diagram]](../../diagrams/3/8e58a0606c7ac3a19594e444c4b33c74.png)
![[Diagram]](../../diagrams/18/2f587a1111ffe744b3200e3d250911a7.png)
![[Diagram]](../../diagrams/46/8e2d6f7e996f5763caf21e5d11b819fb.png)
![[Diagram]](../../diagrams/2/dacd846b5977bb9c060484cea5178d06.png)
![[Diagram]](../../diagrams/28/1709764781a196af95c0f3c67e043f2c.png)
![[Diagram]](../../diagrams/36/14ce0bc4051eafa6cd4255b6e584af80.png)
![[Diagram]](../../diagrams/23/a4e3cafcb31e6c7d444cefbe977ce228.png)
![[Diagram]](../../diagrams/46/df689f085709657724c89e452fbca99e.png)
![[Diagram]](../../diagrams/12/d2ac81c17b89259b35fae906d6ec7eb8.png)
![[Diagram]](../../diagrams/40/cccdb97434724865f104ee9a121a3efe.png)
![[Diagram]](../../diagrams/26/7cde21f8a56e5d96a2929e9527f1d6aa.png)
![[Diagram]](../../diagrams/30/e641f2a05983d826ede0feb11360e830.png)
![[Diagram]](../../diagrams/40/8cfdaef3f2bc9b8f80dfee1d6eae7669.png)
![[Diagram]](../../diagrams/16/6d14bad0bf83337cafc552de9470e3e1.png)
![[Diagram]](../../diagrams/18/7b428848bd351f358e21698535d98cf7.png)
![[Diagram]](../../diagrams/3/67ab44c256a965e9b83cf4e0fe66d417.png)
![[Diagram]](../../diagrams/48/9b8ce3f592c0bcfbecfac722b7c156a1.png)
![[Diagram]](../../diagrams/31/9a79ac2cde93fdd4f7dbe0c3c08afa05.png)
![[Diagram]](../../diagrams/12/16934b655d913e51d7498c99c03a91d0.png)
![[Diagram]](../../diagrams/36/21b74b5bb7e35ac7e90701261c1cc1af.png)
![[Diagram]](../../diagrams/33/b461c2ad80a2e95752a3d64e0f6fab11.png)
![[Diagram]](../../diagrams/18/46fec0857299c6a05eaf60f84897edb8.png)
![[Diagram]](../../diagrams/51/4717dfa1dd2117d9937ec74aeea35fec.png)
![[Diagram]](../../diagrams/42/ae2e1c28085fe918b2033b0b24540327.png)
![[Diagram]](../../diagrams/3/fb77a2aa34eb4f63904768d6cd441b56.png)
![[Diagram]](../../diagrams/19/80ed34aa3d58a959aebb766b9f1f089a.png)
![[Diagram]](../../diagrams/9/43103f49790ceb1cd317b2a2429756e8.png)
![[Diagram]](../../diagrams/22/7aa384c6319d87edbeff1e6166e1c185.png)
![[Diagram]](../../diagrams/43/9739dab7bf81156375288aecd799edc0.png)
![[Diagram]](../../diagrams/8/6f08427bc089a841f5262625defb8241.png)
![[Diagram]](../../diagrams/46/d37d81f7d8c46e2da2d2126c736534dd.png)
![[Diagram]](../../diagrams/19/b1ee727458c8a0e46fa5c88bc05bfcfe.png)
![[Diagram]](../../diagrams/44/5ed71f683b36866b84d807ad81919c70.png)
![[Diagram]](../../diagrams/40/0e5ac1099135dc0bb4370dc3590747b0.png)
![[Diagram]](../../diagrams/22/05ca7f3ef3caa5718db14ee2aced015f.png)
![[Diagram]](../../diagrams/23/efcfb36332e18b03c6aea86a7dc98b2a.png)
![[Diagram]](../../diagrams/5/eebb5a0364f36cef26b621813c549e86.png)
![[Diagram]](../../diagrams/16/89d01518ed6eb86652aaccd92f1afeb0.png)
![[Diagram]](../../diagrams/25/78941f9eb900be41359567dd0c776676.png)
![[Diagram]](../../diagrams/41/e17633ec7c9025911e1325e17a1813da.png)
![[Diagram]](../../diagrams/16/87ded603f5a62dd7cf3a152ad3424f06.png)
![[Diagram]](../../diagrams/41/489e8dfc1f889a4ad75f0648ddf9e824.png)
![[Diagram]](../../diagrams/35/65d38cde59470773a466467ab6d2e713.png)
![[Diagram]](../../diagrams/28/a1f947fd5bd1dbeeece67e60f34efdf8.png)
![[Diagram]](../../diagrams/33/0efee33bdde6344536def3ae339b4657.png)
![[Diagram]](../../diagrams/52/27a21fe4ace3c2e7760620d024e8534f.png)
![[Diagram]](../../diagrams/24/c3c4b51e1cbdcecfb67287f53b2fd286.png)
![[Diagram]](../../diagrams/27/cadab541949fbd435e16641730629d45.png)
![[Diagram]](../../diagrams/2/71e68ce7db98a3129ff3a9799972535a.png)
![[Diagram]](../../diagrams/1/d5ae5afe9a1fd6cfa383129d5c6e0482.png)
![[Diagram]](../../diagrams/5/487d2c3c79d7ac15b9d4462a67ab7c89.png)
![[Diagram]](../../diagrams/52/dcc0b8b4be1d132b8869bf021f3959e4.png)
![[Diagram]](../../diagrams/49/1dd4eb866152e06f5397096cc93ca3b6.png)
![[Diagram]](../../diagrams/35/aed7a9e1794ffea3c1cdd976d85f8df4.png)
![[Diagram]](../../diagrams/20/6541c52f124908e3270c4de5f08bee63.png)
![[Diagram]](../../diagrams/20/922641fdb8ff39e8e42774181e627501.png)
![[Diagram]](../../diagrams/42/4a5af9a95a63f81c6344152d1a68800d.png)
![[Diagram]](../../diagrams/3/ac3660abd35e38e2947f24db165dd151.png)
![[Diagram]](../../diagrams/22/c884c7f0f1dbc4134e3247ce07e9e225.png)
![[Diagram]](../../diagrams/27/b975289d8f0f97b6f9b46dbde02553bd.png)
![[Diagram]](../../diagrams/44/d59601a262bdeb6c49a07aa3049b353b.png)
![[Diagram]](../../diagrams/2/53e9f16fbb3916948ca8d5fd0affe693.png)
![[Diagram]](../../diagrams/35/70cc6250e6b1800dc6e1a6cbbf577fee.png)
![[Diagram]](../../diagrams/19/3b044f8322698c439e24c27ca1346693.png)
![[Diagram]](../../diagrams/44/e41320c1225c6966eeba7890ef8c1ea4.png)
![[Diagram]](../../diagrams/23/5fe37f0537fcaaa25d675321092fab75.png)
![[Diagram]](../../diagrams/31/9eb8dbb295113babe4c787ef60372462.png)
![[Diagram]](../../diagrams/17/51016134da219c99ddef1cab112af7be.png)
![[Diagram]](../../diagrams/9/04e2b343c8bfd35b2c659e613e6e19ab.png)
![[Diagram]](../../diagrams/42/f140589e85507a63e4b64d7fa9b7ac5a.png)
![[Diagram]](../../diagrams/39/a5983f1590213694ec3e48b76f2a81b5.png)
![[Diagram]](../../diagrams/6/b47e29dd83994811ce362c2cad33afd4.png)
![[Diagram]](../../diagrams/12/3424eed4ef658d89051863f94bf02939.png)
![[Diagram]](../../diagrams/4/e325b11eddcc985b6b7a7e3732245356.png)
![[Diagram]](../../diagrams/40/280607cfb8f4ca5b2e820a6afdb190db.png)
![[Diagram]](../../diagrams/12/cc998b6c617f7a8500c16a81169f0d45.png)
![[Diagram]](../../diagrams/0/37a7766e296c40922504c8d95c1f702f.png)
![[Diagram]](../../diagrams/46/080d2d49867d19a628418a19650bee1e.png)
![[Diagram]](../../diagrams/45/ee6a1243338c91b7f4cefca043c1a323.png)
![[Diagram]](../../diagrams/1/0716cdef66e620e6559ad89f37a57f86.png)
![[Diagram]](../../diagrams/30/2c8b15d7c9fcb1a1dff00dc5f3659ea0.png)
![[Diagram]](../../diagrams/10/05d14c2be8fe155f154b68d7fd8e476a.png)
![[Diagram]](../../diagrams/36/a62cf3e5f2b21645eafbde11de64344b.png)
![[Diagram]](../../diagrams/25/e6d1e603f7c54a1178f8ba3a2038bdab.png)
![[Diagram]](../../diagrams/15/6b5a9dfbf4d8254cb3b204a0b89e2237.png)
![[Diagram]](../../diagrams/47/b9d7ce81fa3c31e110b02cacb9fd4b76.png)
![[Diagram]](../../diagrams/14/7d5123bdfb5caeed9cda88bb704f20a7.png)
![[Diagram]](../../diagrams/6/e90de391e92ee3d7c09f6a83dc9b2fa2.png)
![[Diagram]](../../diagrams/34/80fa48fd74f1f1b5405f94a1d15da65b.png)
![[Diagram]](../../diagrams/12/e534004cd49677dc39e21af216172669.png)
![[Diagram]](../../diagrams/50/e7fcae0dabbf6a9f91a01b3b9d1f50c3.png)
![[Diagram]](../../diagrams/23/516c530f9176678cee0a7e9914fd5b17.png)
![[Diagram]](../../diagrams/13/124b25077dd2604186e9fec4838b3c51.png)
![[Diagram]](../../diagrams/7/c0a46916c74692712ee383f600a1a30a.png)
![[Diagram]](../../diagrams/7/da22d63e423bef770bf88505f56a3b70.png)
![[Diagram]](../../diagrams/11/a78c31fdfd653f0649ef61751708e375.png)
![[Diagram]](../../diagrams/48/79ab46cab8e81776e30fb97ec20cc4b9.png)
![[Diagram]](../../diagrams/48/55b85e539821ac4693a5116ced98a527.png)
![[Diagram]](../../diagrams/35/c38902430ef2b38adcb351decb1ba600.png)
![[Diagram]](../../diagrams/11/5327de4683408d4e754a5e665c08ae38.png)
![[Diagram]](../../diagrams/33/df98ae59dc97ece15e902a21a1e73331.png)
![[Diagram]](../../diagrams/9/bbbfdfb82927c9acbd9d0481c2ea9f60.png)
![[Diagram]](../../diagrams/8/09114c4fa6d6d0177c49be8717b5a301.png)
![[Diagram]](../../diagrams/24/8e39c4472252962c469482529b352f9f.png)
![[Diagram]](../../diagrams/51/71a1e9a6273b0bb7d4d1688f2afe7e02.png)
![[Diagram]](../../diagrams/19/2be369aa66d09b3f1f5de8b35d15bbab.png)
![[Diagram]](../../diagrams/20/c0d985f841a61c9683a69351217d0597.png)
![[Diagram]](../../diagrams/21/41271153254e2a793a16db423ae483a5.png)
![[Diagram]](../../diagrams/20/7b4a714214941b134b681e3bdd046252.png)
![[Diagram]](../../diagrams/2/aae6974db48137fe0bb84c933df0abfb.png)
![[Diagram]](../../diagrams/21/f2a5da9afacd0ac54cd21c5c1eba84c2.png)
![[Diagram]](../../diagrams/23/4eb3aeccabb23f39e38acd11421fc1a1.png)
![[Diagram]](../../diagrams/8/b211f31aa3845bdc36effe070e0207a5.png)
![[Diagram]](../../diagrams/17/9be7f30b9ef18a2d82ecdf77d997ed5e.png)
![[Diagram]](../../diagrams/50/d10dfa4199df4c28b26f73d44527a4ba.png)
![[Diagram]](../../diagrams/17/c8baf922111ba9200991b6dc8d4d32e4.png)
![[Diagram]](../../diagrams/9/0cf079aa42b629f637b947ab05f063b9.png)
![[Diagram]](../../diagrams/36/217316415aadc58e8dc00d22a00b9009.png)
![[Diagram]](../../diagrams/10/c690143adff0d7acdfc822a9dc94267d.png)
![[Diagram]](../../diagrams/48/749d2cb0535a92799c13d9861a565690.png)
![[Diagram]](../../diagrams/50/64eeca4acb3c05374af6064f05184cd8.png)
![[Diagram]](../../diagrams/2/b01c9e700d11db04b30f50de3b90076d.png)
![[Diagram]](../../diagrams/8/01f49b754c981eb5dbdc1ff11bc2029d.png)
![[Diagram]](../../diagrams/39/a769dccb0c6ec47afe12c174db759724.png)
![[Diagram]](../../diagrams/6/b9fc5f3f90bd13b11280f26c0778b2aa.png)
![[Diagram]](../../diagrams/29/91101c2369ff54236fa0337d850b55b6.png)
![[Diagram]](../../diagrams/30/bbef1924540d470b473bc82cefc884d2.png)
![[Diagram]](../../diagrams/12/737f292cfa725bb5ba4495485105d780.png)
![[Diagram]](../../diagrams/40/7a1287539c1e85428a78a115ec93d158.png)
![[Diagram]](../../diagrams/34/ddca98babf4c6549f6ca9e052d9008fa.png)
![[Diagram]](../../diagrams/43/20ae992f2c611f8954b5d6987888ebec.png)
![[Diagram]](../../diagrams/23/bba528a6ab49734b89c6f98f1e15a3ab.png)
![[Diagram]](../../diagrams/11/618cabac606f4077a873210aa948a683.png)
![[Diagram]](../../diagrams/21/cac8352eb534f41c50dcb106cce1a4ff.png)
![[Diagram]](../../diagrams/32/3be921923455592210335ae3f1ac2b65.png)
![[Diagram]](../../diagrams/18/1f21129860a6c186c27f8b69e37c2bf5.png)
![[Diagram]](../../diagrams/37/457bac64a238df96b70b02e1c8dce8aa.png)
![[Diagram]](../../diagrams/46/3aaa14f19061ea8421d5d324723508bd.png)
![[Diagram]](../../diagrams/28/5d6312ce4646be94a66b9c0d61c753f0.png)
![[Diagram]](../../diagrams/30/5cd887805dbe3a5c1c9945b349f2ba69.png)
![[Diagram]](../../diagrams/52/0d9bf98c2d374e75adbcaeb5659e4a62.png)
![[Diagram]](../../diagrams/12/9510750aea68935af77e86bcc61536f1.png)
![[Diagram]](../../diagrams/0/8120dbbcb69e894dc9e32fe0127a4e70.png)
![[Diagram]](../../diagrams/40/5cc2202b2376dbd99ad02b40a6e9bf29.png)

![[Diagram]](../../diagrams/31/737805efeafd2ef0a977ab8fa6e9e6a0.png)
![[Diagram]](../../diagrams/1/4d4d83983d2f5e2fd03a4ae3c536f33e.png)
![[Diagram]](../../diagrams/36/74d74af8302bd2ee47e04a653c571a99.png)
![[Diagram]](../../diagrams/33/08344c9d197b23eea341352a81bb62c5.png)
![[Diagram]](../../diagrams/20/4dad75a0e6731ac2bc3fb6a8e72411ca.png)
![[Diagram]](../../diagrams/11/ac41a9ac9a684785a99a18cb59fb7dc9.png)
![[Diagram]](../../diagrams/44/e5e4af5e479f753d5c4822cfac075394.png)
![[Diagram]](../../diagrams/48/08341cc504ddb4b01ed6f9925a7d9999.png)
![[Diagram]](../../diagrams/41/3649eb9a74713133ec961dc5210d6ee2.png)
![[Diagram]](../../diagrams/10/092f4722932bf37f84d8d040177f8a7d.png)
![[Diagram]](../../diagrams/5/87b38597f13f69e09ad4efd5d71dc9ca.png)
![[Diagram]](../../diagrams/8/1e45c7dc75969f1544a1d37d8de58c39.png)
![[Diagram]](../../diagrams/46/6b56eb8420ebc4e9d92b57952712c4c3.png)
![[Diagram]](../../diagrams/6/1ab7f28fc4460f0ac539dca41ecc8ab4.png)
![[Diagram]](../../diagrams/51/7011cc6c7e825ca8b3cd0dd352af6229.png)
![[Diagram]](../../diagrams/7/ec15a2f2c318582c894253ee2c48a979.png)

 (picture of early version of the client)
![[Diagram]](../../diagrams/16/86a93fe1ebfe022a1490d86d6fd8774a.png)
![[Diagram]](../../diagrams/20/df4fe77e5826e94154d75fe8e1a4d3e4.png)
![[Diagram]](../../diagrams/2/43c35336c007682d4e959df10c014fc2.png)
![[Diagram]](../../diagrams/16/6775acf9be9ec5920a82381ecd094594.png)
 (picture of T1)
 (early version of T1: when you place a bridge on the board, exactly 9 other bridges are made impossible (plus the one bridge you are placing on the board=10 bridges)
![[Diagram]](../../diagrams/16/cc5bdfc6ce3b93e31718cc059b2e45c4.png)
![[Diagram]](../../diagrams/46/573106218f317eccd9e0b942e67faadc.png)
![[Diagram]](../../diagrams/6/71dd529a4c1847ce567d4e285a72abd1.png)
![[Diagram]](../../diagrams/16/83dd78991b3f82ece80e005a3486873f.png)
![[Diagram]](../../diagrams/52/8d43281180e45aa15a668ddd5f8af7ac.png)
![[Diagram]](../../diagrams/26/afcca61e07b2b2b95287b0b2cdebcb5a.png)
![[Diagram]](../../diagrams/31/cb7eb1f9df3c514918f16fd5c8d10dc4.png)
![[Diagram]](../../diagrams/39/9fd8e39acb9f211a2b9f17915f74ec91.png)
![[Diagram]](../../diagrams/22/35af3794710a9b28f7bad36d9d2b80df.png)
![[Diagram]](../../diagrams/36/79a4b84debdc4854d70298ecef82aadb.png)
![[Diagram]](../../diagrams/30/0399157d6d265136a247cdba995af64b.png)
![[Diagram]](../../diagrams/45/b60c748c5053bd6706745c0a15adbca2.png)
![[Diagram]](../../diagrams/23/196029d617c1263d9c801c3f23b58439.png)
![[Diagram]](../../diagrams/1/2be09d5afac9c01b3d32f7330fc2c5cd.png)
![[Diagram]](../../diagrams/35/2afa35df20fd6e8a813de781cfb3fad1.png)
![[Diagram]](../../diagrams/43/8b126a72359ed54fe4d3a262484d5292.png)
![[Diagram]](../../diagrams/13/4788b725af2267a7136fe55b85881ed7.png)
![[Diagram]](../../diagrams/52/f52fd2d96c603b3c90dbe95b66769c08.png)
![[Diagram]](../../diagrams/13/1e9733093f97aa2430ded642e46dcb0c.png)
![[Diagram]](../../diagrams/12/dd06cb4c83ae25a102ad2c0c316ccb5a.png)
![[Diagram]](../../diagrams/3/279f87f83895ac22e8bb4c0e7fcb9977.png)
![[Diagram]](../../diagrams/48/a6be60323a4cff51970ec62602a1424e.png)
![[Diagram]](../../diagrams/27/0061cd84e3a730672b5b6b46eb3c889c.png)
![[Diagram]](../../diagrams/18/3b357aab5164b1934e77d4b3e9834210.png)
![[Diagram]](../../diagrams/8/0302c86bca4c43c1b174b77637389437.png)
![[Diagram]](../../diagrams/1/cb9cd3f1e8f9f761d6ca72fcdfb97097.png)
![[Diagram]](../../diagrams/10/5959b10293411a87a376b9390a3b0350.png)
![[Diagram]](../../diagrams/34/e6bffdb60d9f30f2ce360985b7f7bedc.png)
![[Diagram]](../../diagrams/25/03226beff1c48e222ab59f855b462e62.png)
![[Diagram]](../../diagrams/36/1d2299381a10edf83492cf3da7a274e1.png)
![[Diagram]](../../diagrams/7/648d0dc8e5acb68b1a7ad4d442b63da9.png)
![[Diagram]](../../diagrams/11/599c0b685c442d23dc9521944def509b.png)
![[Diagram]](../../diagrams/0/22c4ee0161f441af046449c069b9d629.png)
![[Diagram]](../../diagrams/17/9532257239978330ff2b857a3f12dcc4.png)
![[Diagram]](../../diagrams/2/a0a03e6d8b403eefefb068604dcb411f.png)
![[Diagram]](../../diagrams/22/bdb6f363e88e91a979326ac341140eb2.png)
![[Diagram]](../../diagrams/22/a583b26d7206e6ef0f5e34a17d6cd2ea.png)
![[Diagram]](../../diagrams/9/8c11c5498ae581b41c02aa25e451289e.png)
![[Diagram]](../../diagrams/18/5c252edbec3557d2f1957d86b130f4a3.png)
![[Diagram]](../../diagrams/13/c3ab8242c0be468e323600bb9a956eca.png)
![[Diagram]](../../diagrams/4/a869de97cf80e18e964b1f96b6a8349c.png)
![[Diagram]](../../diagrams/15/80d62e56bab645183686e1ce85116e65.png)
![[Diagram]](../../diagrams/0/c791f92932a7d386e94b5a94219c9c59.png)
![[Diagram]](../../diagrams/31/65b8e079cba25b5ffc7177c777456d92.png)
![[Diagram]](../../diagrams/50/9a77173ef2567c03fab629c01a3e6482.png)
![[Diagram]](../../diagrams/44/cb5e3e0f00bddb24ad99a916fa3b1b52.png)
![[Diagram]](../../diagrams/45/3da150caff75d78339891c5900894722.png)
![[Diagram]](../../diagrams/37/8561bba1e996e22fb2064c3c38d9b8a7.png)
![[Diagram]](../../diagrams/18/6b7d676b6aa52ba04353637dd560cf21.png)
![[Diagram]](../../diagrams/39/05ca6dcd6b300875b3f91db942f6874b.png)
![[Diagram]](../../diagrams/2/296787d7adbf47c63b22eaadb3be466c.png)
![[Diagram]](../../diagrams/26/0a5aeaa3c33f03aa093c9a0417ee26c6.png)
![[Diagram]](../../diagrams/9/32c883e291922a18d515f5e4338749c5.png)
![[Diagram]](../../diagrams/51/c78f3c970e493b5a1ebb08a2f46b2462.png)
![[Diagram]](../../diagrams/15/7abcfe05d6f5361df0bc0c409cac3583.png)
![[Diagram]](../../diagrams/5/5d08b835995f34e6bf02401c071a75f2.png)
![[Diagram]](../../diagrams/15/736e3757592b9d1f47b21e6955948359.png)
![[Diagram]](../../diagrams/27/c0f91f6b9510bbb373e8f1e04b0b88d5.png)
![[Diagram]](../../diagrams/48/6e57a7b4d82a7e66257ee6fed977e6e2.png)
![[Diagram]](../../diagrams/7/5687bcf1fad449280dca90bfe4d3cd78.png)
![[Diagram]](../../diagrams/40/cf7ad407d1ff9bdd336b1b042eeb080d.png)
![[Diagram]](../../diagrams/5/c3ee1aff73cc0780528bfc0b48c25548.png)
![[Diagram]](../../diagrams/15/e3cce30e6a531454d0a2be69617b8dda.png)
![[Diagram]](../../diagrams/3/e6072f5daaa8fcad76119f64d33797a7.png)
![[Diagram]](../../diagrams/2/84bb7947ebeb77f8b90756999710e64b.png)
![[Diagram]](../../diagrams/11/6074ecb0621f3f2c3e810e172519bf64.png)
![[Diagram]](../../diagrams/12/1188d120473b4e16908b27e0ac02dadd.png)
![[Diagram]](../../diagrams/24/f0f8c19088828c1a9716c935c3b1f2b4.png)
![[Diagram]](../../diagrams/5/a922fe630a97fad2b3f4917453a11073.png)
![[Diagram]](../../diagrams/42/50a4be00b301173dcacd77756f19b8c7.png)
![[Diagram]](../../diagrams/4/77702be0733e0c35e5c314045bcc73cf.png)
![[Diagram]](../../diagrams/30/2a6cb23a246735ff6e2e5354f68ac836.png)
![[Diagram]](../../diagrams/48/5f3b0180c308fb4b936dccb872de657a.png)
![[Diagram]](../../diagrams/4/86596b610acbd1ba05885c512e2ca5f1.png)
![[Diagram]](../../diagrams/25/d7b8f38ba4d7feee90854d76254ae58a.png)
![[Diagram]](../../diagrams/39/914fe198717ffe05a2f75b18ba38a510.png)
![[Diagram]](../../diagrams/7/57b9d01167cb3171e4f4e84f448b79ec.png)
![[Diagram]](../../diagrams/37/b1bf6b8c97493c0c7420ae206f25eb35.png)
![[Diagram]](../../diagrams/47/7d1cb5f89f9d6c905da8e313f40c34d3.png)
![[Diagram]](../../diagrams/33/f668f189cfb2d6612d9bdee2b0904316.png)
![[Diagram]](../../diagrams/40/af6a80974c941cb8bb2c9b709fd03edc.png)
![[Diagram]](../../diagrams/37/f2165648d125a7ca46eae8ef97b33bc4.png)
![[Diagram]](../../diagrams/11/15c73974e8044dc464ea68f7a2d6b023.png)
![[Diagram]](../../diagrams/8/0024086ab527161e0ced8d3c77970b4c.png)
![[Diagram]](../../diagrams/43/617b19144b99bc6362749f7e53896a25.png)
![[Diagram]](../../diagrams/29/0383e11a1797b35a62aed52d66491f19.png)
![[Diagram]](../../diagrams/44/037bb6a0d2d0b7e42ad70e98b8d27c96.png)
![[Diagram]](../../diagrams/19/c392ad3f19823567519c7fc24ffa4147.png)
![[Diagram]](../../diagrams/9/168bd79550b7b82dab3ec6cf2bece88a.png)
![[Diagram]](../../diagrams/20/1fe97684d39a251095b3c9d5c0734e3a.png)
![[Diagram]](../../diagrams/50/cdec50646f855b6d6aaa5e45ab04ef1b.png)
![[Diagram]](../../diagrams/45/1329b2f2c0733f7c03673bfb37bc3107.png)
![[Diagram]](../../diagrams/28/4559ab92a901c86349adaf3cd6ca2569.png)
![[Diagram]](../../diagrams/17/5b5795c265faa3b43e7af013c8cecee7.png)
![[Diagram]](../../diagrams/19/e72b246b9f365361e1b14dab38f383ad.png)
![[Diagram]](../../diagrams/5/801e0b9758b9af66d46e93d4c9ffee35.png)
![[Diagram]](../../diagrams/52/5f58b88020b28e68054d20a4930c5b5c.png)
![[Diagram]](../../diagrams/33/9073bdabfaebceb2601919c15e21bd0e.png)
![[Diagram]](../../diagrams/49/f6a1ca957399eb5e771c615fb7ad7104.png)
![[Diagram]](../../diagrams/38/6e30188a48d1e3ae836a5ac14031846b.png)
![[Diagram]](../../diagrams/20/c10827f0330daa6675ffc48ba02ea33e.png)
![[Diagram]](../../diagrams/37/3977d7b06127bccd317c4f176601e61d.png)
![[Diagram]](../../diagrams/24/d9671cbf63ab58e74558adf8a1870e10.png)
![[Diagram]](../../diagrams/34/681d457f9696c9bd8454a078fd756454.png)
![[Diagram]](../../diagrams/12/04c349874f34a9255cb61e9392cb7fe6.png)
![[Diagram]](../../diagrams/36/b06a4194e5ba28acb41199e4cc85eaba.png)
![[Diagram]](../../diagrams/14/ac97751de1e4c7a31373848c0682edcd.png)
![[Diagram]](../../diagrams/6/3c3236af5edc30e2836dfa56173830a6.png)
![[Diagram]](../../diagrams/7/53a29594c4a70ee8e66e5812bc1dc107.png)
![[Diagram]](../../diagrams/34/d0bec732621a35a4ce669a93611532e0.png)
![[Diagram]](../../diagrams/6/e1362314e4baedc1bd8081b9b5aa9846.png)
![[Diagram]](../../diagrams/3/8662bb4aec9f2a111566f7ea901d4bde.png)
![[Diagram]](../../diagrams/43/df88d98178a97be0f18f076f41800661.png)
![[Diagram]](../../diagrams/48/b4c92aced37e292e18a72509465a3d92.png)
![[Diagram]](../../diagrams/42/c3469bc9242dd4cfdf7c83a046a36c0b.png)
![[Diagram]](../../diagrams/45/b812fceab54cb5c59d703b5bbe677016.png)
![[Diagram]](../../diagrams/24/882e93ae74f1f312f09610226e2161fe.png)
![[Diagram]](../../diagrams/23/5df1ccd4669b4a21716768208822f7ab.png)
![[Diagram]](../../diagrams/4/252eb68be425384113ca87ad13fa2b8d.png)
![[Diagram]](../../diagrams/2/771aa590007dbc22894f791e9b098184.png)
![[Diagram]](../../diagrams/34/23742c7a869239e9c54e254c851eb3ca.png)
![[Diagram]](../../diagrams/24/427230b2a8dfdb4e2559df503d0f6f11.png)
![[Diagram]](../../diagrams/10/565da6cc8c91756273b97fb751e4a902.png)
![[Diagram]](../../diagrams/24/1120aba7b360ab07cd58b290c5a2d35a.png)
![[Diagram]](../../diagrams/6/4e54f8c4e32a0c5bc4e0cfb6a8d20645.png)
![[Diagram]](../../diagrams/36/edaf800bfa29405e3084c3a448450071.png)
![[Diagram]](../../diagrams/5/0b7220198817e914f906ba5ea7bb620d.png)
![[Diagram]](../../diagrams/24/ea206d1bdb3dece4e68365ae7ca84a5a.png)
![[Diagram]](../../diagrams/20/55c8fda1e74ea2c87c73248c55c1a90b.png)
![[Diagram]](../../diagrams/52/4495e9b00ee1223b7911b4926217d28c.png)
![[Diagram]](../../diagrams/35/09409d5a7b2d7b2a3806fa79be5375a1.png)
![[Diagram]](../../diagrams/38/d5bd99e25e4e7fdf162d067497cdc17f.png)
![[Diagram]](../../diagrams/51/7b16f787c2b20db2e2cd127abadf9782.png)
![[Diagram]](../../diagrams/21/dcdaf9a1acc3a5891eafd06034d92300.png)
![[Diagram]](../../diagrams/21/8102c6c7d0e9985b4db638f74ef1c82f.png)
![[Diagram]](../../diagrams/17/42c39d666a487b04e37210603a0b86b1.png)
![[Diagram]](../../diagrams/29/5f555cac6fb53d3006a93850ce62abea.png)
![[Diagram]](../../diagrams/21/6cdc39cc571becc52f7f7e389331790a.png)
![[Diagram]](../../diagrams/41/a008cc751198784ed4dc84c1eece621f.png)
![[Diagram]](../../diagrams/29/67d4220dec101827ae1a2aea734eb439.png)
![[Diagram]](../../diagrams/39/df983872b3d3522a634093b3a7a57e0d.png)
![[Diagram]](../../diagrams/8/42bbae725bd91177a3eeb267a895e2ac.png)
![[Diagram]](../../diagrams/47/6a26caecac70e1bfd0900822bea190e3.png)
![[Diagram]](../../diagrams/5/f08e9f371807e11673c962133b255a92.png)
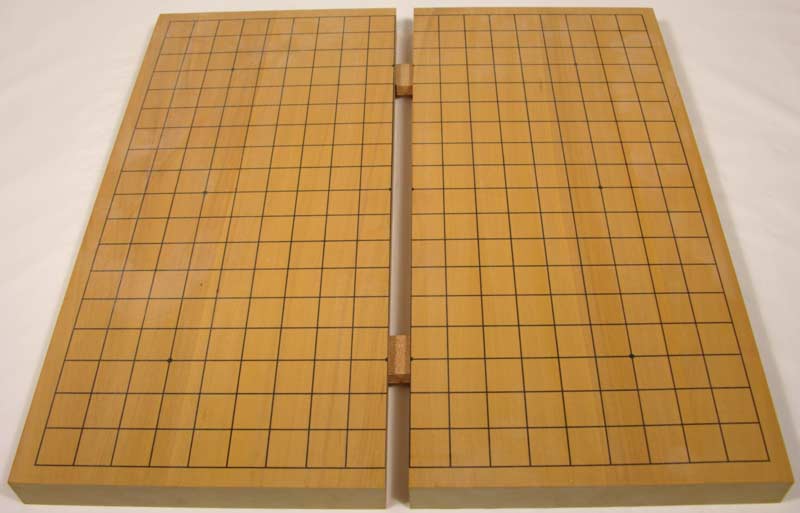 Slotted
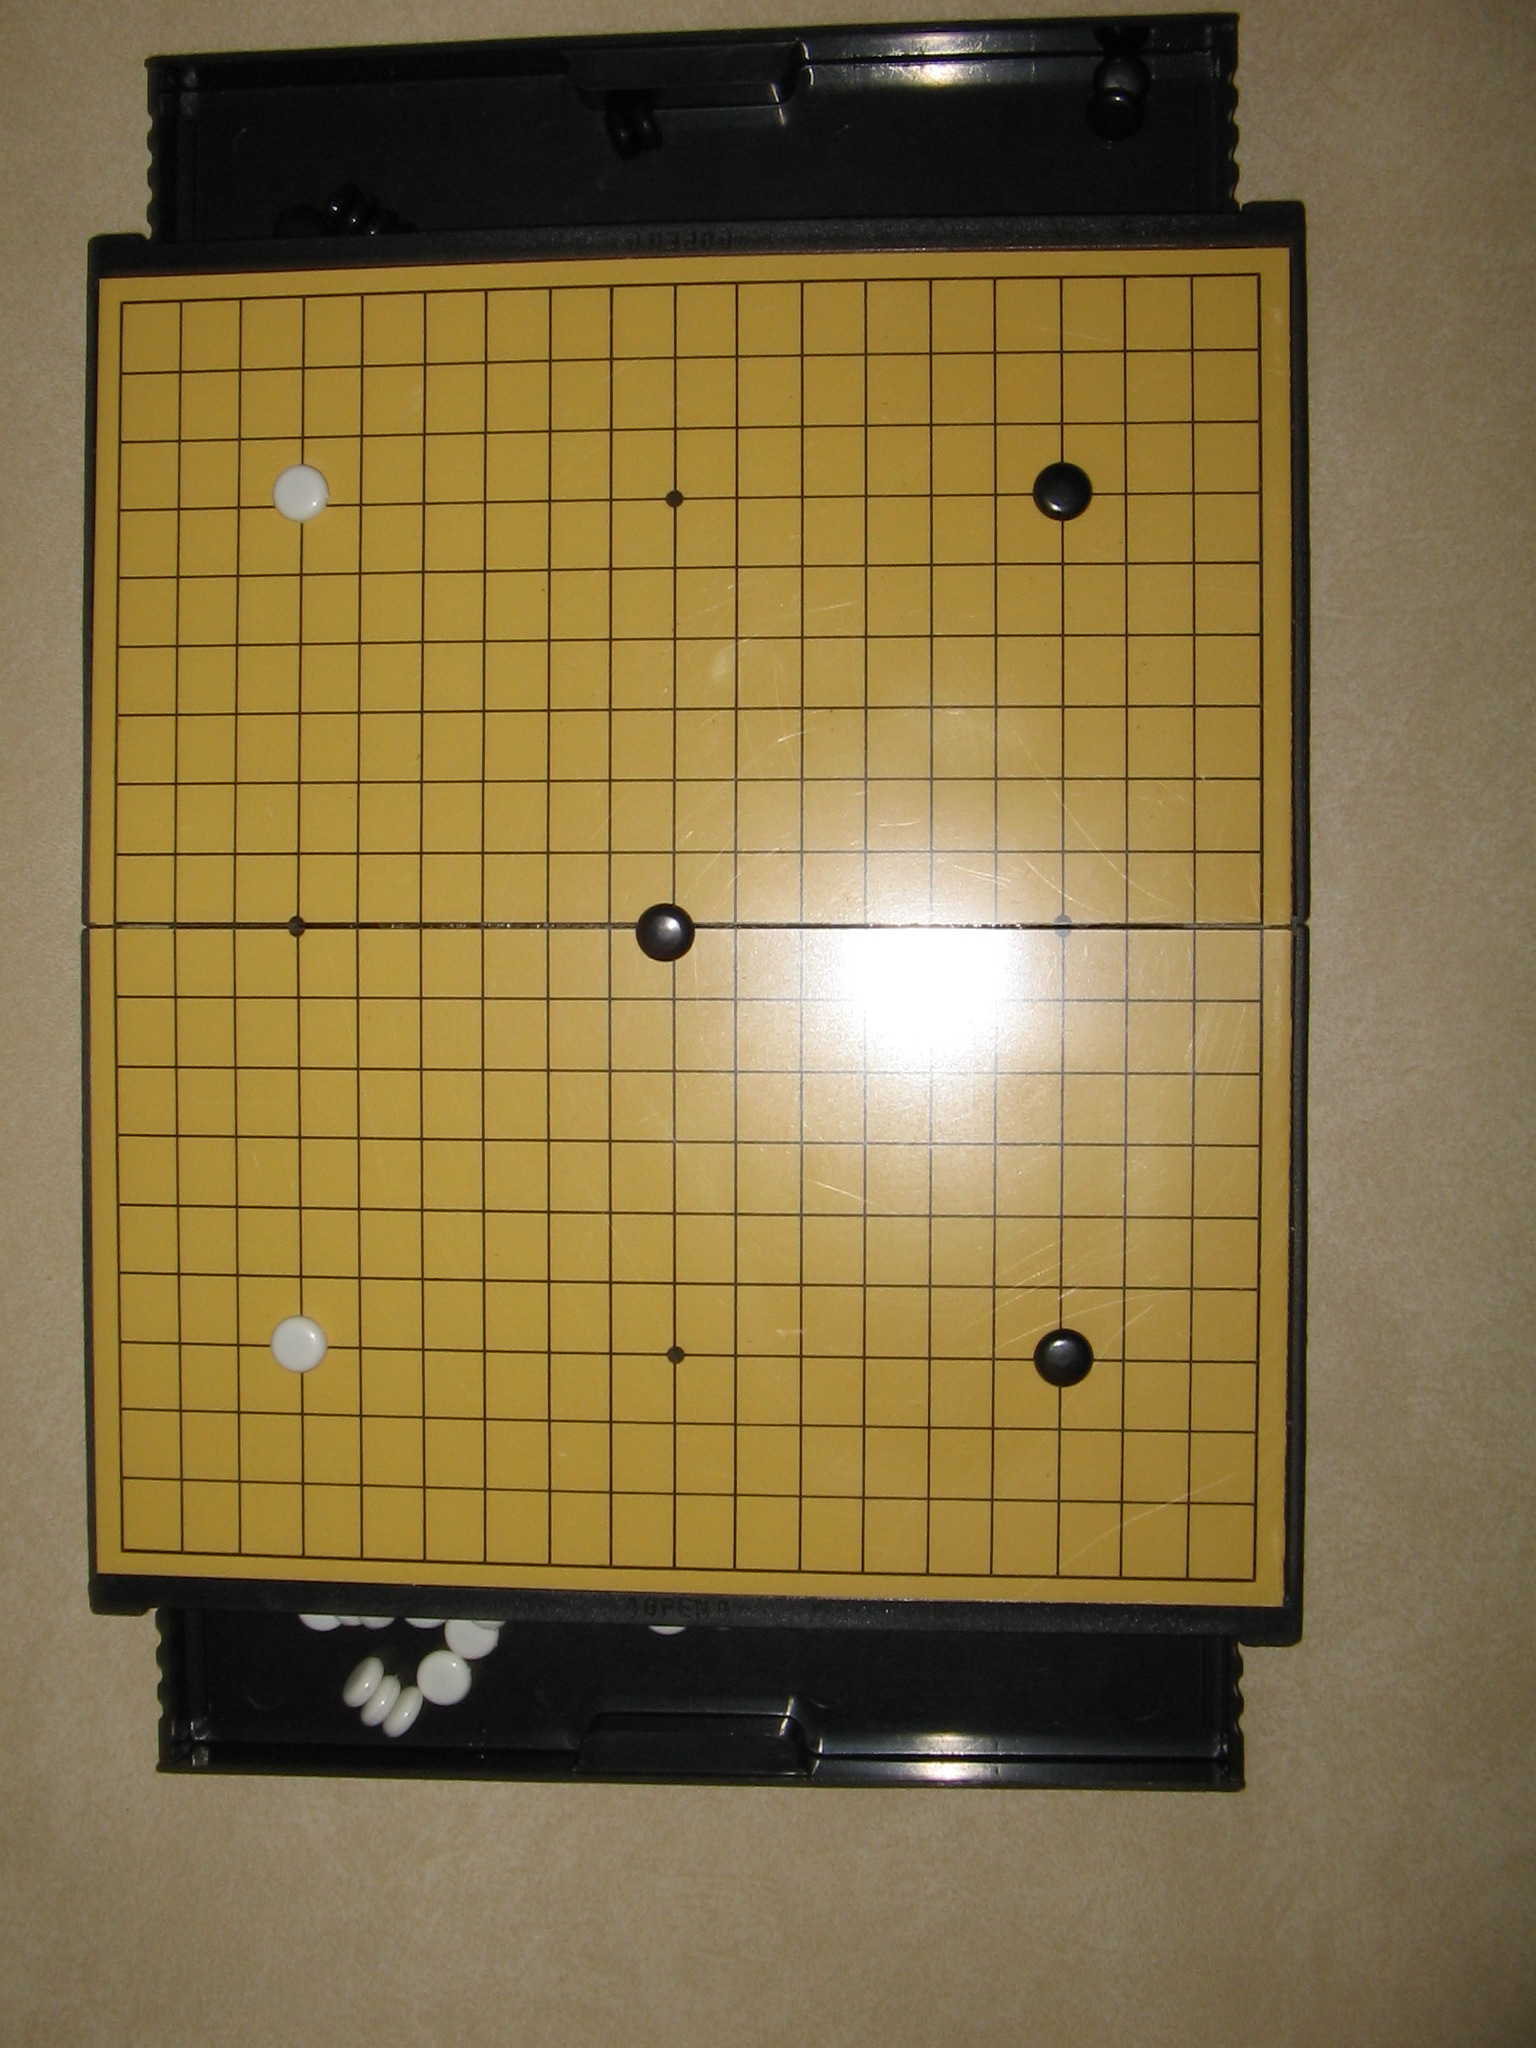
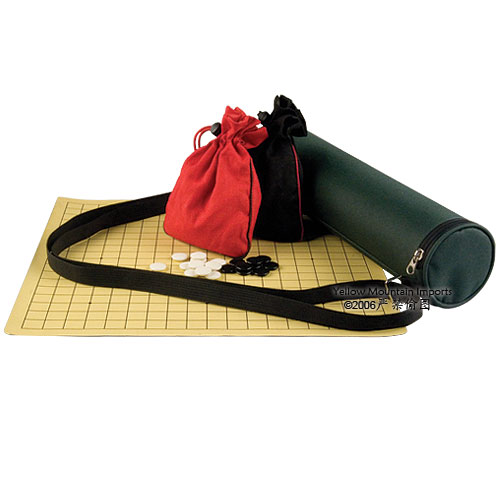
![[Diagram]](../../diagrams/28/d8f571e1a456d163a2d25285e2704331.png)
![[Diagram]](../../diagrams/50/74c22f76dd66d63d619a7779cd924a4f.png)
![[Diagram]](../../diagrams/20/aed36678758e9f5dbd1cad7605f10deb.png)
![[Diagram]](../../diagrams/0/34a8eb959dd3a1efe6cb89439a0cc105.png)
![[Diagram]](../../diagrams/26/4b80f2a11b3e5853fb55d18f4eeaa7fc.png)
![[Diagram]](../../diagrams/9/d9f393af23dc053822ae7b10e9e7c2e3.png)
![[Diagram]](../../diagrams/31/4ef938044a67849bbba69ac95862fc57.png)
![[Diagram]](../../diagrams/35/699b50a387fc50f6f4fb9597a829d5fe.png)


 (link broken?).
![[Diagram]](../../diagrams/15/4d8093523663e1d9a5a806777e09d9b0.png)
![[Diagram]](../../diagrams/42/00e7973e5a536a655b190ef2faecad7c.png)
![[Diagram]](../../diagrams/33/78302a59430d01dbfa3b1248e68395d1.png)
![[Diagram]](../../diagrams/1/7645eb2aa206dae6167bebb24a18db45.png)
![[Diagram]](../../diagrams/49/ce7d84c9634da9e2b056aa0ff3c3b323.png)
![[Diagram]](../../diagrams/51/577bc5b8eb8b1bb52261c2964a335246.png)
![[Diagram]](../../diagrams/47/5e832ba33c6ead6d8b700c7e0c8b3080.png)
![[Diagram]](../../diagrams/5/1a6a6ee2572239583d50d6a98fa84653.png)
![[Diagram]](../../diagrams/34/2dd24255146846520730bf065f7c2891.png)
![[Diagram]](../../diagrams/49/53a6e3191dfddfa412457c4338401845.png)
![[Diagram]](../../diagrams/22/5c0e5bed5dec71b1521569f63aa92e80.png)
![[Diagram]](../../diagrams/39/0746c5d92d26231adf708a0b69d43b16.png)
![[Diagram]](../../diagrams/47/3ab9664fa058832f637a6a0732435a5f.png)
![[Diagram]](../../diagrams/23/cec7b6a55fd0c39e2a528aea4347a2ea.png)
![[Diagram]](../../diagrams/22/8939c5ab86048dbe5742764e110b2bbd.png)
![[Diagram]](../../diagrams/32/ea23479e957bfc390af04383c34c8c69.png)
![[Diagram]](../../diagrams/1/6d5a3a7d48bbfa733ff6221851747fd4.png)
![[Diagram]](../../diagrams/31/02f64eafa9c1abe42be155205e72a3bf.png)
![[Diagram]](../../diagrams/14/54b147b20bcc127ed6775c62db8ef175.png)
![[Diagram]](../../diagrams/9/5180175cbbd97180a637f9156a1cc832.png)
![[Diagram]](../../diagrams/47/5172cc5ee52d1d645464d483641390a3.png)
![[Diagram]](../../diagrams/7/f4e73cd66f0a59c13e63a5b461855eec.png)
![[Diagram]](../../diagrams/37/2667baa05fde50e555e59ce07b718cef.png)
![[Diagram]](../../diagrams/51/e4c33f4794ab3a37b1b503aaf599797a.png)
![[Diagram]](../../diagrams/34/034295dbb9752a1685310fa05d7e09c5.png)
![[Diagram]](../../diagrams/34/413b1d3e91c369dd3c3a943e6116ab1e.png)
![[Diagram]](../../diagrams/50/ffaaa598d5e40bed450cec7f0228c794.png)
![[Diagram]](../../diagrams/10/e7f7cab07ec3336cec82a46b87ad0952.png)
![[Diagram]](../../diagrams/41/860e621e4bf294312a6c26b43c128ddc.png)
![[Diagram]](../../diagrams/38/39dfb0c7dc65e48905c8b777a35fbd6d.png)
![[Diagram]](../../diagrams/28/2ca7016daf707477906c253b99562abd.png)
![[Diagram]](../../diagrams/47/f681378aa531f716aa90b177f2a346be.png)
![[Diagram]](../../diagrams/28/c014a92fdc0d61ff214d70790e420170.png)
![[Diagram]](../../diagrams/28/dcb7b1e01a8c25e642dbcde9f3de2280.png)
![[Diagram]](../../diagrams/5/f002118d5775e24080b924e45cddfe3c.png)
![[Diagram]](../../diagrams/11/a399f0b6d75cf7712f8aa12e861114f4.png)
![[Diagram]](../../diagrams/25/6fb6f1daabfa8df177a8035a56e5f280.png)
![[Diagram]](../../diagrams/16/89c470ae7736deb8b647614ea2b78775.png)
![[Diagram]](../../diagrams/11/5e8912c2f330ce6c7d31eeadb8b612dc.png)
![[Diagram]](../../diagrams/27/2825907a223751455524fa58a3cde16b.png)
![[Diagram]](../../diagrams/4/6c29f804eaae62d5634977e2d26e2f4d.png)
![[Diagram]](../../diagrams/38/040f2af2a896812755442504a5c0d8fd.png)
![[Diagram]](../../diagrams/14/63289489218fd769ff75afc204d4ad49.png)
![[Diagram]](../../diagrams/38/2c8dbbedc842a5e8748a797f2cae62b6.png)
![[Diagram]](../../diagrams/1/dc260521bac3b827d46cdd5fbafb200a.png)
![[Diagram]](../../diagrams/51/b1a367ce1f50adf7e6a3dda879374ad3.png)
![[Diagram]](../../diagrams/52/a097126ab73c20cd6049bf67da135643.png)
![[Diagram]](../../diagrams/11/ecdd240aa12a972bde48e0bb115add7e.png)
![[Diagram]](../../diagrams/49/f97a9e89e54dc3afd64fd16df23afcf5.png)
![[Diagram]](../../diagrams/20/da981c5bf5c52a7553d05078f2a83e6a.png)
![[Diagram]](../../diagrams/43/3ad88c909aac05ee8a5bdd9a2a87516e.png)
![[Diagram]](../../diagrams/7/58e487d9eeea8446e5f7c71d7c072971.png)
![[Diagram]](../../diagrams/17/aa3551ea11d1e5dfa45795c47c56ff83.png)
![[Diagram]](../../diagrams/26/9156f4336841c7afde571bcd595673d9.png)
![[Diagram]](../../diagrams/46/41c03b6e6a753a32e42ad214f7e301b5.png)
![[Diagram]](../../diagrams/21/626b6b3329443fc377699268dce063cc.png)
![[Diagram]](../../diagrams/11/872482b2b2ca316e98112a26c3c41904.png)
![[Diagram]](../../diagrams/3/5316bb306c45a8307f4c55591c0e1963.png)
![[Diagram]](../../diagrams/29/95a585aa12daab088ad7c2742208d330.png)
![[Diagram]](../../diagrams/6/98048f8532ace6f11db23f28aed4ec92.png)
![[Diagram]](../../diagrams/38/f1ba4b368b8d4229f52688be15218732.png)
![[Diagram]](../../diagrams/21/570e26da819320d09e61d41f05fbbfa8.png)
![[Diagram]](../../diagrams/35/dca3394e46e032cd58eaeecbda626fd8.png)
![[Diagram]](../../diagrams/51/fc204fd5364ee928fadebb932d3bca37.png)
![[Diagram]](../../diagrams/0/328ed6dac2a87c9e384d067cd45377c8.png)
![[Diagram]](../../diagrams/17/b3899f0b977a11282046931c33196096.png)
![[Diagram]](../../diagrams/29/22180044e2701da8e8c4ddd15da2b0ee.png)
![[Diagram]](../../diagrams/32/60445bf9a9bb4a845f0b9f4864db19b0.png)
![[Diagram]](../../diagrams/12/7f3fd58e6e8c34e367541668b18bde88.png)
![[Diagram]](../../diagrams/21/ea3c0938c55143a5a57fcfa1537941c3.png)
![[Diagram]](../../diagrams/44/ef4d961751273cd1924e9cb3ee6048de.png)
![[Diagram]](../../diagrams/6/92c74b60ca347802c306e12b8bf45b46.png)
![[Diagram]](../../diagrams/8/7d6f84768b8ba1a370f3e8d2d2d85f5e.png)
![[Diagram]](../../diagrams/23/a6c267a3850a6d312c2d0e900f2c792e.png)
![[Diagram]](../../diagrams/6/504d11d92132475cb52f3cb0d72df118.png)
![[Diagram]](../../diagrams/35/55e94716ecb674326f46debf70573aa4.png)
![[Diagram]](../../diagrams/13/d741b9af140f8ca8bef491b465c34826.png)
![[Diagram]](../../diagrams/42/23a3ea332b9a73b4daabec5e28c9957e.png)
![[Diagram]](../../diagrams/5/13fb8da46271a91cb6618486f3521b4f.png)
![[Diagram]](../../diagrams/22/c0de327b7a473f1309dabe8f3380c3ed.png)
![[Diagram]](../../diagrams/13/63a92d71ac11c47151e52bc5f7bba859.png)
![[Diagram]](../../diagrams/4/3f2a51fb6165a547fe3c42639c7f80e7.png)
![[Diagram]](../../diagrams/19/4f5f3c817473be134f97333a58ae20e6.png)
![[Diagram]](../../diagrams/0/c28a4ff9d36fd3e330984b2c61141027.png)
![[Diagram]](../../diagrams/48/c5ed26803e5d46875fba2218cbe0ffc6.png)
![[Diagram]](../../diagrams/5/ad4fe4a68fa3c9c6220eff65d92c01c0.png)
![[Diagram]](../../diagrams/28/856c5fe4dd76f2d03ac5103e3c66d73e.png)
![[Diagram]](../../diagrams/11/38ffa51bd3f8de55797026e6ec5d670c.png)
![[Diagram]](../../diagrams/31/62724ed67036385356d6b5ebcd950bf4.png)
![[Diagram]](../../diagrams/50/3ed98f0a4c147cdb6cb07f68606cd9e8.png)
![[Diagram]](../../diagrams/29/8c880f869aeb4ce6521a415136e83cd6.png)
![[Diagram]](../../diagrams/45/676b970e3d0e6d52d3174927a1c3b1d3.png)
![[Diagram]](../../diagrams/17/309cb058995f782e77913cf4cea36021.png)
![[Diagram]](../../diagrams/29/34002889f3897c568f739fa780d07a34.png)
![[Diagram]](../../diagrams/4/aeca0134b8b0edb568f67ef23ac23608.png)
![[Diagram]](../../diagrams/28/859a4479eb799433d810decef2ab6bf5.png)
![[Diagram]](../../diagrams/7/f1d643cd1d20a98f3064835fde58519c.png)
![[Diagram]](../../diagrams/34/c79edc07c5bdeec8556a5707bc0428c3.png)
![[Diagram]](../../diagrams/38/2ca6b2f8b6972ddc9f236e8c710042d6.png)
![[Diagram]](../../diagrams/41/4c44eb8db2802f78fd79f2310327e260.png)
![[Diagram]](../../diagrams/1/ef5ea44c849e42c8d3a68cacbfa9362f.png)
![[Diagram]](../../diagrams/50/5a514917dda52e4024756ab170cbba64.png)
![[Diagram]](../../diagrams/49/20d78d354309832ee15506076653e546.png)
![[Diagram]](../../diagrams/36/60926bb0239afcc44884de881c27b79b.png)
![[Diagram]](../../diagrams/28/a509bf98a1a2314b8dd5d7f4863ab7bc.png)
![[Diagram]](../../diagrams/22/b2f66036eca5f240058d266a392eb99d.png)
![[Diagram]](../../diagrams/20/614a48da1d395772ec23b7db4768ec2f.png)
![[Diagram]](../../diagrams/38/4887d3081716a2d52c57e4f7cd63549f.png)
![[Diagram]](../../diagrams/36/7d897a571c8ac35725fd77c88960bcdb.png)
![[Diagram]](../../diagrams/50/7d6d3b58e90d353cbd17383c3e969ba0.png)
![[Diagram]](../../diagrams/8/1d69c3c08e510970e4ddabdbaa3960aa.png)
![[Diagram]](../../diagrams/9/3a8d6cd2ebaf5ba0d7e7e6f117183114.png)
![[Diagram]](../../diagrams/30/4b0c6879fe77104253c5eb7615c2db2e.png)
![[Diagram]](../../diagrams/42/192425a7e5f685787d397267875a01ce.png)
![[Diagram]](../../diagrams/12/00e47ce528bb5dfa53c9784d5b059e80.png)
![[Diagram]](../../diagrams/17/fde10abedcd530b086bbb6bfb831b7e8.png)
![[Diagram]](../../diagrams/44/4844360e5c261741d28394eaa35ec1e8.png)
![[Diagram]](../../diagrams/41/beb370af44d623dcd3ee13d4f5d0fa88.png)
![[Diagram]](../../diagrams/29/5a1c4618b254e610bad1f52869c0576d.png)
![[Diagram]](../../diagrams/43/cee699bea48ebe533de2c37e79bc2fe9.png)
![[Diagram]](../../diagrams/9/b2ced5e71eb011276aa9ff1ddcf28a87.png)
![[Diagram]](../../diagrams/36/e678ab03e3fa2313d2fec6b32e406b07.png)
![[Diagram]](../../diagrams/24/1c35673f043826129f9a59bddb8ca0a0.png)
![[Diagram]](../../diagrams/38/d70c503851ce3559109c6ee1ec2b7085.png)
![[Diagram]](../../diagrams/24/7277bb30f8cf80f45318bfc3c8b7e50c.png)
![[Diagram]](../../diagrams/48/77aced807dbd49de1c186c4cbda88d72.png)
![[Diagram]](../../diagrams/35/17a2cf17ef01cd05fd91087543951e04.png)
![[Diagram]](../../diagrams/12/37849d3c503d9a30fb2496bd471cb349.png)
![[Diagram]](../../diagrams/14/e257a43a021cb8431a726b6e7e18e91d.png)
![[Diagram]](../../diagrams/4/4537aafc1d828d83a07568d72ba58e68.png)
![[Diagram]](../../diagrams/4/252f7360403708cfc8393f5a78180ca1.png)
![[Diagram]](../../diagrams/23/5f88476c08599941cca3cec0dcd89cfe.png)
![[Diagram]](../../diagrams/19/2c95aa1b9b0b965c5c5b2719671e933d.png)
![[Diagram]](../../diagrams/28/f0b63776fd157b570894ee078c58361e.png)
![[Diagram]](../../diagrams/34/9149d423b5799823875eadd30e8321bb.png)


![[Diagram]](../../diagrams/6/65a7c4ea6b8227c13cbed3318cafbc61.png)
![[Diagram]](../../diagrams/42/c478fdd01b515689084a3d1baef62534.png)
![[Diagram]](../../diagrams/21/b964c7dc4524c32c796c8081ef77878a.png)
![[Diagram]](../../diagrams/7/ba5a6a2c84bbeb3dd6153a6bd70f4d55.png)
![[Diagram]](../../diagrams/11/1a3d6c659a5ee6e94aeed111bb967fd7.png)
![[Diagram]](../../diagrams/49/f32bef60102ea8f132801b1d927f63b9.png)
![[Diagram]](../../diagrams/36/5ab2b4f80f9d448ac650d64ad6beac09.png)
![[Diagram]](../../diagrams/15/ee138ac9afcb64ebc2c20db2498c1047.png)
![[Diagram]](../../diagrams/34/daf5f4c29ca49bb541c9fd9f03627678.png)
![[Diagram]](../../diagrams/47/33496cae5b6e5943e7f2f2a7ae7a4b12.png)
![[Diagram]](../../diagrams/20/b61f7fb0c4865da50aa92a6253124da4.png)
![[Diagram]](../../diagrams/43/c1722875981c6106523e093e11cc184b.png)
![[Diagram]](../../diagrams/20/9c618f63e8ca0420ed162ee23e693574.png)
![[Diagram]](../../diagrams/33/fd48b012692a8a1c09970492920fc3b4.png)
![[Diagram]](../../diagrams/31/fa6acd583f90ebdc3774cc4d67346c1b.png)
![[Diagram]](../../diagrams/19/920aabb0c5686bcfb68a38e9c203dffd.png)
![[Diagram]](../../diagrams/9/038c760de0272ccc92365a55e09c08f0.png)
![[Diagram]](../../diagrams/35/1f91d2cd3937c682e0d7e9aa1b0949ff.png)
![[Diagram]](../../diagrams/15/3c4f1cf3a83ba2786ce3a5af19649779.png)
![[Diagram]](../../diagrams/3/4fd9280f105ddced919ee1afe6661b43.png)
![[Diagram]](../../diagrams/45/77682dc5ac760aa6f9b2f1eddba4ddc0.png)
![[Diagram]](../../diagrams/22/827932618f7a3bc5fc3205724a4fab5d.png)
![[Diagram]](../../diagrams/3/509da84f571a64535f64161b4b769cfd.png)
![[Diagram]](../../diagrams/45/f34b58c3de308eb6805edc921aeac0b6.png)
![[Diagram]](../../diagrams/39/93b41b06d3a5fd7f8061231cefc95dd3.png)
![[Diagram]](../../diagrams/48/ec1b5082f195cb295edc6592b61eff43.png)
![[Diagram]](../../diagrams/4/393572d4893dea3f44b64a202db8519a.png)

![[Diagram]](../../diagrams/1/2fcd2f844d7ffb9f7cbceb369090fa41.png)
![[Diagram]](../../diagrams/36/a8ac7b9f530811a820700705a0bcaab9.png)
![[Diagram]](../../diagrams/36/c5bde7aaca03a6d478b68e5a27272d1f.png)
![[Diagram]](../../diagrams/26/3e3f16d1935fb661ebaa81fabd242e03.png)
![[Diagram]](../../diagrams/13/1d531b8a462e363541cc83e5c5c03f3e.png)
![[Diagram]](../../diagrams/15/678a6d1b71f3329f5cfc07d87db850ad.png)
![[Diagram]](../../diagrams/43/e02e882996690fc8635413b69f0e580c.png)
![[Diagram]](../../diagrams/29/95734b471958e38d4ae774b23c91fb09.png)
![[Diagram]](../../diagrams/27/a27d5f73c09964c5d9c58babf463e5e0.png)
![[Diagram]](../../diagrams/41/cbc55722bc3619e082dfb986fa3451ab.png)
![[Diagram]](../../diagrams/4/7d4af91b0cc707b811ef5dbaa20f76dd.png)
![[Diagram]](../../diagrams/25/42bb07ad1aef8361d4eefebf03bc7a41.png)
![[Diagram]](../../diagrams/3/e31fc17793c3e83f1b873242eadbcf63.png)
![[Diagram]](../../diagrams/28/9197c24aa291ff493db40a961c716e8e.png)
![[Diagram]](../../diagrams/46/a875efc175b60e28c58cf199657c1da0.png)


![[Diagram]](../../diagrams/38/ee4c68fe3a81191d3ad5d67600f4ba8b.png)
![[Diagram]](../../diagrams/29/c9037a77c3ef77ce01a2329416f8f307.png)
![[Diagram]](../../diagrams/49/f048968ee0c9528a889ac9dac612e82c.png)
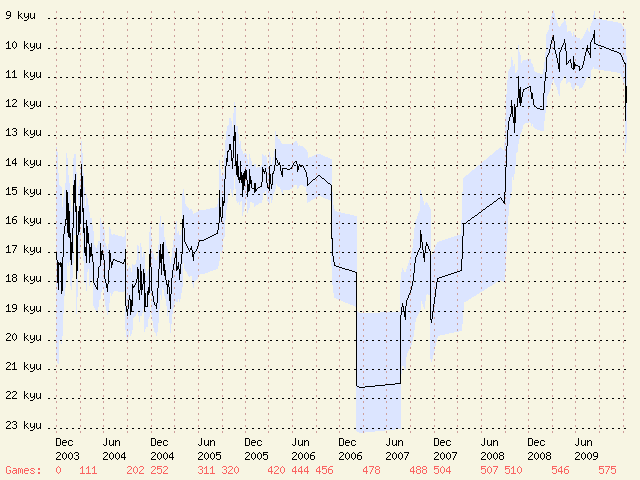
![[Diagram]](../../diagrams/4/c96a06f61c02ffab091f56c10cccad1f.png)
![[Diagram]](../../diagrams/42/68beba2103ff68bea3bfaed8d298de5d.png)
![[Diagram]](../../diagrams/43/8eb2f4cf5f010dcd8e680de41f88549e.png)
![[Diagram]](../../diagrams/37/7cda8a87c74655477b3e4dc7a28f0638.png)
![[Diagram]](../../diagrams/24/70e4ac4a51804ba2e3540802b5c27e6e.png)
![[Diagram]](../../diagrams/51/10af2641addb6dd4114b01d8d39270db.png)
![[Diagram]](../../diagrams/24/9683ff1fb2f8b4f2b7fb1e7467e41a42.png)
![[Diagram]](../../diagrams/49/b3f13cb65d2d40965df262337aff9c09.png)
![[Diagram]](../../diagrams/8/cb65a5a84985d71c4a87e21b77cecdf8.png)
![[Diagram]](../../diagrams/4/0fff817d86fa8f63a716f78b20903127.png)
![[Diagram]](../../diagrams/38/d84538a4c19fca29743abf8ec4aa4cb0.png)
![[Diagram]](../../diagrams/33/7d63128687a30d0070d04f31ce971659.png)
![[Diagram]](../../diagrams/10/c2d57da88cd4eecdb56f2f3c65aa6627.png)
![[Diagram]](../../diagrams/48/ecaca26565ebdcfec559e73248e88d74.png)
![[Diagram]](../../diagrams/23/fa289bd9f21e7128e2e82ec15e9a4f08.png)
![[Diagram]](../../diagrams/16/ea0605d5185218c9d3807bdbf4434c4c.png)
![[Diagram]](../../diagrams/14/2ab812c806c1dd1ba1d2639e3f936a7f.png)
![[Diagram]](../../diagrams/48/05f3c3e3bad1a902d8f8202795c472e9.png)
![[Diagram]](../../diagrams/28/0bbee3269a41594cd15a92cc4d09f16f.png)
![[Diagram]](../../diagrams/9/2a25e675f2fc99ac9b8be0982a0592c5.png)
![[Diagram]](../../diagrams/40/4c448c490980de7964dc6b7504e16910.png)
![[Diagram]](../../diagrams/13/3ce34d3dec7d5873a2f4e67999067927.png)
![[Diagram]](../../diagrams/24/444054a48e143d2e47123906d4e9699e.png)
![[Diagram]](../../diagrams/0/7d5c4a5b3e5b60a2443f6100a872295f.png)
![[Diagram]](../../diagrams/14/b53c7afd147f6dc388a6bf77452a0d9c.png)
![[Diagram]](../../diagrams/34/32d198480c1d71acc810cb8f384ab6e1.png)
![[Diagram]](../../diagrams/41/f03e3648f866aef387d6bcd12fad0b71.png)
![[Diagram]](../../diagrams/1/efe3b29f0462c0a1e9834375ab8f0307.png)
![[Diagram]](../../diagrams/23/7eff24cfc93a9a2a3052e65189477ce7.png)
![[Diagram]](../../diagrams/9/62cba3281649b9925a9b8921c83d7e98.png)
![[Diagram]](../../diagrams/27/d59e4c7ec138d899dcf7219378424780.png)
![[Diagram]](../../diagrams/22/93c33298faf189bfe79fd4a7474294fd.png)
![[Diagram]](../../diagrams/21/34b99db76d9202e850c29dcc22470b4c.png)
![[Diagram]](../../diagrams/33/d57b7f7a772b5744b2fda37729836bf3.png)
![[Diagram]](../../diagrams/9/da6b0010d44e054a975240559c34892a.png)
![[Diagram]](../../diagrams/35/3ee8326a7642cdafcca7bf69fe2bf555.png)
![[Diagram]](../../diagrams/26/481de6ab5773b95591e4a5f47fd1db30.png)
![[Diagram]](../../diagrams/35/38610812ab36f18037fbad5af47afd33.png)
![[Diagram]](../../diagrams/31/36fa6056196ccb2813e9c1c59cb700cd.png)
![[Diagram]](../../diagrams/45/3428a5783d6778782cd32f14957dc424.png)
![[Diagram]](../../diagrams/16/5f456a97ce7231064a0a6ec6a5088b10.png)
![[Diagram]](../../diagrams/39/b5f0af204b3227d8698c94fa376a643e.png)

![[Diagram]](../../diagrams/34/4946e9b8455fa095b4934dc9a681d74c.png)
![[Diagram]](../../diagrams/38/a300d0c18e6dd512878980002b5a36d8.png)
![[Diagram]](../../diagrams/46/4f6e278980d3c120174d7ba695ea5c91.png)
![[Diagram]](../../diagrams/37/a1e79341fdcdbe49c59a0523b92bc0c1.png)
![[Diagram]](../../diagrams/28/dc32dd1a8ae72955dc95e52b6292d49c.png)
![[Diagram]](../../diagrams/25/9b0ccf835414a60e3fe0ef324902dd06.png)
![[Diagram]](../../diagrams/20/4b6fa6a813d53db5e14472bff22d031c.png)
![[Diagram]](../../diagrams/0/8124e8dc50477dcadfae4252899aba1e.png)
![[Diagram]](../../diagrams/45/6d2398384462045900461e3c1c85789e.png)
![[Diagram]](../../diagrams/21/4a3d73be401078dfb567db02b5ec16b5.png)
![[Diagram]](../../diagrams/18/99ca395130e359da27affc15cffe68cb.png)
![[Diagram]](../../diagrams/41/ef8711a6f2a4c75becae9565a233629a.png)
![[Diagram]](../../diagrams/27/d11f6f90cabaa81bfa5e4ae65cd5a4ae.png)
![[Diagram]](../../diagrams/23/16bc5fafea4ded063742bf5b1921cf7d.png)
![[Diagram]](../../diagrams/22/1a5fe721db14679ec24234a356cde9c8.png)
![[Diagram]](../../diagrams/6/307a4cf107122fb19dabf20183da0617.png)
![[Diagram]](../../diagrams/34/9d3843bf65db45044a38209743da99fc.png)
![[Diagram]](../../diagrams/0/2d44752ab9d43e142af075c84291efbd.png)
![[Diagram]](../../diagrams/52/b22e338b68007d124a846eed34fe3cd4.png)
![[Diagram]](../../diagrams/36/8a3ed06b4e374256896155c0e5997c41.png)
![[Diagram]](../../diagrams/1/932fb159119ba6e6a916554667c15611.png)
![[Diagram]](../../diagrams/16/5655440fdce35591d101e0a1e51ff6e2.png)
![[Diagram]](../../diagrams/11/e380b68160e4a77678fb364f98888b64.png)
![[Diagram]](../../diagrams/52/3dd4486e929c2e5d5ccd89a40e9e7b8d.png)
![[Diagram]](../../diagrams/3/3e8fb4eeb77c546ebf112a2ea1c6a502.png)
![[Diagram]](../../diagrams/50/6f7b5f7b9e80c6eba50c334a07edd4fe.png)
![[Diagram]](../../diagrams/19/ea1ba2cdf4eb56d1cea47bc3057e20bd.png)
![[Diagram]](../../diagrams/8/b0e7d6ae55ddf92401fa03faef9ba99d.png)
![[Diagram]](../../diagrams/33/ab782cc197ebdba7d164fdde1e9ed2f8.png)
![[Diagram]](../../diagrams/46/a33edb6d6a9e457e15bf087abc78c9af.png)
![[Diagram]](../../diagrams/42/84a2621ffbd73168fe65361025be638f.png)
![[Diagram]](../../diagrams/32/e50c37e10340cff84d8414a76a4ecde4.png)
![[Diagram]](../../diagrams/18/bdba385c81bb16b0b9f20be740058c86.png)
![[Diagram]](../../diagrams/33/b67d27d7b8efcd337b253b7f5018d0d9.png)
![[Diagram]](../../diagrams/16/0725ca22c2e12897487d298f53aa803b.png)
![[Diagram]](../../diagrams/12/b92f21f28d9f247d62645373ef2810a6.png)
![[Diagram]](../../diagrams/13/d1acec077f7a6b410919e71180c833c6.png)
![[Diagram]](../../diagrams/47/7bae3770a8e67220f4f6ed0b709a58bb.png)
![[Diagram]](../../diagrams/52/937d6a766ca8788e668ab8973310acf0.png)
![[Diagram]](../../diagrams/29/fba78f53aa19e0db375039bb6b77fbc3.png)
![[Diagram]](../../diagrams/6/edf48fbe7910db78ad268dce8d90413b.png)
![[Diagram]](../../diagrams/16/210b88bf5458c6c48e297d29421b2bcd.png)
![[Diagram]](../../diagrams/10/ba1ca9870b38c39d9b56fb2a8d088666.png)
![[Diagram]](../../diagrams/49/e95103d63ae73817b4a6e8d4fc8d0ddc.png)
![[Diagram]](../../diagrams/25/d87b921bbc5e066e31900f6a4c3afa5a.png)
![[Diagram]](../../diagrams/10/1cf80ccf0cc7ed390c4068ba725de8eb.png)
![[Diagram]](../../diagrams/10/bd3c1bae7f9e8b119e565ee7e8019e0b.png)
![[Diagram]](../../diagrams/40/346af9b09081ff97626fbfc22f2b9855.png)
![[ext]](http://www.emptysky.org/images/photos/greg.jpg) http://www.emptysky.org/images/photos/greg.jpg
http://www.emptysky.org/images/photos/greg.jpg![[Diagram]](../../diagrams/11/1c468ca0a42835069d5f5c7afea07908.png)
![[Diagram]](../../diagrams/39/60b609a1353bb08e43a41751e9035166.png)
![[Diagram]](../../diagrams/39/de38d086b99a44bff1dcfaa5ba61c252.png)
![[Diagram]](../../diagrams/6/0648290fd553c59d2cf29ce130c0c767.png)
![[Diagram]](../../diagrams/20/0dbbb5811f115ebee0c47c69d9b3b9b6.png)
![[Diagram]](../../diagrams/19/2b0b4094f48ee48fce2ae4ff49f2fb06.png)
![[Diagram]](../../diagrams/26/63c9ce6e3c47be2be611c824605c45bb.png)
![[Diagram]](../../diagrams/5/6cf57af3f95ac8b508b25109ead3f7c6.png)
![[Diagram]](../../diagrams/7/7e34e9dbea1193303b33dea853a0ab2a.png)
![[Diagram]](../../diagrams/21/613eb56607fe127f0a8fc7a26c4b2fbe.png)
![[Diagram]](../../diagrams/16/fb25a422dc40f002dda37661d8103131.png)
![[Diagram]](../../diagrams/32/9d36cc5ca12a55f262af532332dba136.png)
![[Diagram]](../../diagrams/4/7feead21a049c7f86484c81f0303659a.png)
![[Diagram]](../../diagrams/28/5837f499963a2862f97c8eb2101d0371.png)
![[Diagram]](../../diagrams/31/931a3ee987f9bafff87facf3ff73c456.png)
![[Diagram]](../../diagrams/36/46cb4dbce133fe04fe5b29955de2f3d2.png)
![[Diagram]](../../diagrams/9/631db3475ae30b79ee129ec1648551a3.png)
![[Diagram]](../../diagrams/36/c81ff3ddecb8f9239a0a5e9404ee3b8a.png)
![[Diagram]](../../diagrams/15/5b6b7c376cf34b67c01ccfdf9017d373.png)
![[Diagram]](../../diagrams/8/0b23c95277c09626c52c0f275688e906.png)
![[Diagram]](../../diagrams/9/2b6bd4ed0c48cb9438f1e7698aca44d5.png)
![[Diagram]](../../diagrams/6/ca5d3688eeaf29bb6694ca86cab4e476.png)
![[Diagram]](../../diagrams/19/7be2ef4fff8f4dd91d8d45435cd7b636.png)
![[Diagram]](../../diagrams/12/a79c9d4f9e44895f2059d1254853decb.png)
![[Diagram]](../../diagrams/40/4b2a6100d6471c7b9d7f3ab488174c7b.png)
![[Diagram]](../../diagrams/4/4fd1ea0b27ae8763f5590097b08868c9.png)
![[Diagram]](../../diagrams/15/b79a1bad9f702dc11f2a3d995d4e32a4.png)
![[Diagram]](../../diagrams/43/21d27419cefd8b8c0b2b1e6ddb55fbb8.png)
![[Diagram]](../../diagrams/34/8a3d24487ae776fd95a860f6cec3c1ae.png)
![[Diagram]](../../diagrams/5/79fde24188db1bca040599f76b1aabc1.png)
![[Diagram]](../../diagrams/48/e15b91c8e7e06c51e0fa545c878617ee.png)
![[Diagram]](../../diagrams/14/9d4f57c7f89e6576ee6776959bb2d26f.png)
![[Diagram]](../../diagrams/23/e9694887bbe4ca69339b191f95efdefb.png)
![[Diagram]](../../diagrams/42/bda80b737258629c6b900df67edb88a2.png)
![[Diagram]](../../diagrams/0/c24788fb424ad375556311b9ffae11d4.png)
![[Diagram]](../../diagrams/41/8f9cfa3049b06832d1912f49984999ec.png)
![[Diagram]](../../diagrams/48/98fc3cc0f654f20ead0dd02d42366011.png)
![[Diagram]](../../diagrams/37/1c710e526f0993082f00cf2f2a906953.png)
![[Diagram]](../../diagrams/17/df14b32607800e741be4a66f4047478d.png)
![[Diagram]](../../diagrams/23/2b9d595f8d2eace2cda548f6b2a73ef1.png)
![[Diagram]](../../diagrams/48/0bc671bb39b4bb43c7604be3e7db7efc.png)
![[Diagram]](../../diagrams/37/32d9e7dcd91c8f406e9ae2b633ed0c87.png)
![[Diagram]](../../diagrams/26/bc1ca71221a15133d44fc1f217d2db08.png)
![[Diagram]](../../diagrams/19/eb356c2c194ffa51c7d06d4ee8039430.png)
![[Diagram]](../../diagrams/4/3b7bc28e47f80772441910fcc594b151.png)
![[Diagram]](../../diagrams/17/835090e4f2710b4df1bf290ee88fd4c9.png)
![[Diagram]](../../diagrams/1/d6458c238122c1ac1029419c883cd8b8.png)
![[Diagram]](../../diagrams/4/54df62f4167b096fc165b509c2d33241.png)
![[Diagram]](../../diagrams/52/efa0a928f3f28ec414ff37ffc467e4d8.png)
![[Diagram]](../../diagrams/27/24e9ba0ff675614e01f9b416f9383868.png)
![[Diagram]](../../diagrams/36/f85da317974ec5550a9aaa1202674096.png)
![[Diagram]](../../diagrams/30/55f3d07c57bf418cc3b889cab072ae09.png)
![[Diagram]](../../diagrams/11/9603445f5dbf01a500a131fdc715d958.png)
![[Diagram]](../../diagrams/32/08ccf0795899bec5dba7dedacc34a9b7.png)
![[Diagram]](../../diagrams/37/6f72b4158e7e31547872610c3292c052.png)
![[Diagram]](../../diagrams/42/847a4d54bdf1a37d45bd4ab6bb0bc193.png)
![[Diagram]](../../diagrams/49/9ea62bb2f6dd505ea264b9d1599e977e.png)
![[Diagram]](../../diagrams/31/dbcbf7a6aac9d9f396d5ff43b2193f56.png)

![[Diagram]](../../diagrams/29/98e2217a02b5772ead2a818f20dbb672.png)
![[Diagram]](../../diagrams/48/ad8c4fab8c2a2f946e82d4f1a5600be6.png)
![[Diagram]](../../diagrams/6/965bc869f034b96558b17365e5169312.png)
![[Diagram]](../../diagrams/43/1ab83db3daa962a3896ddeb402d9fe46.png)
![[Diagram]](../../diagrams/12/1ce0ab5f421b67645a111d780ca67bb2.png)
![[Diagram]](../../diagrams/26/878ed0d19fde2f7fca06d328b5a486d9.png)
![[Diagram]](../../diagrams/52/c5672ded50d47423645bef1a7132b601.png)
![[Diagram]](../../diagrams/37/10637ace4f1e482c49e70f1d8208be4c.png)
![[Diagram]](../../diagrams/21/57f1ea7541145a430a98522b5acf340b.png)
![[Diagram]](../../diagrams/35/c39d40ba58939f17a9ad802ea5d68acb.png)
![[Diagram]](../../diagrams/28/16341d890c9d96e4e9ae6ba6c95f564c.png)
![[Diagram]](../../diagrams/23/a24c7d59ed00e6847d388a139dfb0b3e.png)
![[Diagram]](../../diagrams/26/2d98c46cb52b795eb3e8f2cf083087e8.png)
![[Diagram]](../../diagrams/6/04394c0af628339f5d54340627cbbd24.png)
![[Diagram]](../../diagrams/22/2baa9dcafe400040a081cfe3b90c2e36.png)
![[Diagram]](../../diagrams/7/e12a77decc4accc23269d404cf70bfaa.png)
![[Diagram]](../../diagrams/48/23cce4468026aa250611843c519b4856.png)
![[Diagram]](../../diagrams/32/87c9c9d5ddfdc9a89036fb6ed420c7a0.png)
![[Diagram]](../../diagrams/52/3a49fbf602d0c80fe265969c5f787af0.png)
![[Diagram]](../../diagrams/11/f8504247d8239fdf4cd21cfe11814353.png)
![[Diagram]](../../diagrams/7/c1ecabff4f44cca2658d045806fa22a3.png)
![[Diagram]](../../diagrams/47/56c12517eb61ecbce1a0729540a667df.png)
![[Diagram]](../../diagrams/22/b662aef6aabc39df975547c5dfcdafce.png)
![[Diagram]](../../diagrams/39/5a318dacd4ae32e20e9adbd2643b9569.png)
![[Diagram]](../../diagrams/28/5fa38a6f3a1389785d814a45e4bb3fd9.png)
![[Diagram]](../../diagrams/30/3271ca84ed9f34b1b8c0a55479454ebe.png)
![[Diagram]](../../diagrams/12/35840cb781b8f0e1037de67736d6af02.png)
![[Diagram]](../../diagrams/23/5c506c10d2ccabda11a1ecde63420b24.png)
![[Diagram]](../../diagrams/19/49fde0f8706f417bba41949aeece2351.png)
![[Diagram]](../../diagrams/45/081e4b73eeafffa21538fb9a2f94eb1d.png)
![[ext]](http://goama.upstream.ru/gallery/albums/Shodan/2/normal_10.jpg) http://goama.upstream.ru/gallery/albums/Shodan/2/normal_10.jpg
http://goama.upstream.ru/gallery/albums/Shodan/2/normal_10.jpg![[Diagram]](../../diagrams/51/84b7a947936d478bcf2c918b3fe53055.png)
![[Diagram]](../../diagrams/34/68b42fa661ef67494af8169ae661c4e7.png)
![[Diagram]](../../diagrams/46/e37ce6187d8a81f076f7cf5e42ab636e.png)
![[Diagram]](../../diagrams/6/7d9efba9052c7151f493541cc643dc0c.png)
![[Diagram]](../../diagrams/2/123bb3d32503a6d5a79158224edeae7d.png)
![[Diagram]](../../diagrams/6/c1017cdf6c9c867998e9e965130e552f.png)
![[Diagram]](../../diagrams/30/eda51a76714b4e03181a8ee64d6a290e.png)
![[Diagram]](../../diagrams/29/780fe631904c85c04765ce3f00a2fb52.png)
![[Diagram]](../../diagrams/2/062c28808aa63e3ec6caf4c539836aff.png)
![[Diagram]](../../diagrams/42/741af2c11df876eab41454c585e5dc0e.png)
![[Diagram]](../../diagrams/9/17b4d9f72c8ac401af1f6f3a2251d552.png)
![[Diagram]](../../diagrams/19/3c04b38c75a6387a9c2b6dba05c511ae.png)
![[Diagram]](../../diagrams/23/73c1a3ac12a92303288cd5ac8bfed24b.png)
![[Diagram]](../../diagrams/46/f522486dba6687cf7594664f4b45d5f0.png)
![[Diagram]](../../diagrams/22/3a530bfc754c60b96b9344c6f947b9e7.png)
![[Diagram]](../../diagrams/44/7bc9622542815abe9ca173dcd78da2b2.png)
![[Diagram]](../../diagrams/9/ce7dd15753c4be3fc4ad9d825c0b53bc.png)
![[Diagram]](../../diagrams/23/d34309e88e1435f1ebfc599f0a074b6e.png)
![[Diagram]](../../diagrams/18/a272411eee6d2b835b9fd3a1a15cdeee.png)
![[Diagram]](../../diagrams/33/54cb3358159d1edd708633a7622c4ae7.png)
![[Diagram]](../../diagrams/13/6b32e3681df959252773041d4c86a011.png)
![[Diagram]](../../diagrams/14/a2317f1e79b4e1ac31f0c6de69f12663.png)
![[Diagram]](../../diagrams/46/f925d9a4869594360dc72a7bef9dc320.png)
![[Diagram]](../../diagrams/35/985159863f80de3105acb1d6cb8407c7.png)


![[Diagram]](../../diagrams/16/980488d5478a18e809bebdc1b02c74af.png)

![[Diagram]](../../diagrams/47/426982bee9af85e077799485d514e609.png)
![[Diagram]](../../diagrams/51/c51be36bb0ef32624b6aa6b3b74a36b8.png)
![[Diagram]](../../diagrams/47/8906f709b829764827a761a01f1c5e77.png)
![[Diagram]](../../diagrams/7/47446fd4e993bb5a26b6a68093e6a9ac.png)
![[Diagram]](../../diagrams/36/fcc9df48929fe75630d9c5727191c984.png)
![[Diagram]](../../diagrams/9/80ce251db59b7e0c67ac84137e6aa911.png)
![[Diagram]](../../diagrams/20/5679466fc77d687d9f7555ba1609c524.png)
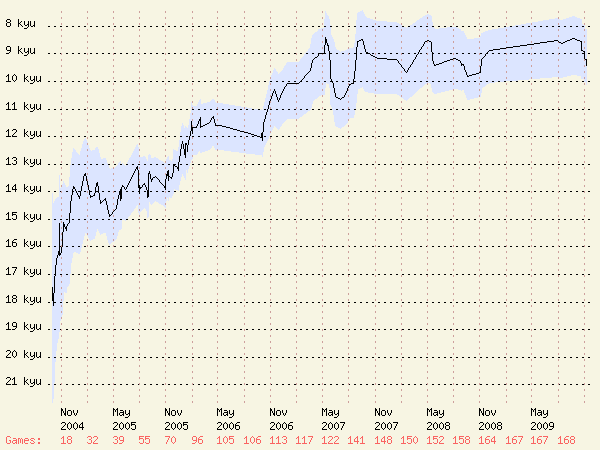
![[Diagram]](../../diagrams/52/ff0facce8fe1e1ba1920e195a9e84404.png)
![[Diagram]](../../diagrams/27/3fda09b21e619ae0104359184cdce9f2.png)
![[Diagram]](../../diagrams/37/ffbfda46c64d046edf4a9ae364b2d84c.png)
![[Diagram]](../../diagrams/24/9ead6a46920ca5568212db68a87fa963.png)
![[Diagram]](../../diagrams/26/d5728318f9fc90ca60887656c75f56cc.png)
![[Diagram]](../../diagrams/5/0714446b3883476c6b033221324b0f99.png)
![[Diagram]](../../diagrams/2/4c4caf67c91cd26a525917f281a1e359.png)


![[Diagram]](../../diagrams/47/ee7fc5a54b14cc40001ecf77c827546a.png)
![[Diagram]](../../diagrams/16/3fcb1812253c2142b65dcdafb34a7a32.png)
![[Diagram]](../../diagrams/51/932ccf192e20354668838d5faf707f37.png)
![[Diagram]](../../diagrams/27/0f699f74117a86e1bc4324d96b7774e2.png)
![[Diagram]](../../diagrams/44/3f08ed2fc869a7b8847fc8a6ba9d3607.png)
![[Diagram]](../../diagrams/9/0f69682643de3aefd89325f177727a10.png)
![[Diagram]](../../diagrams/45/470780a953e0285678dc94551c076b8f.png)
![[Diagram]](../../diagrams/25/659dced5c4293991f101d668fe21e82d.png)
![[Diagram]](../../diagrams/39/b5f7d1496e01860ab3efa369d8cd6f85.png)
![[Diagram]](../../diagrams/34/0b91aa41bfd6677c8ef9f9939ed7b13d.png)
![[Diagram]](../../diagrams/19/729b153bcd2186aac37ce84758436ee4.png)
![[Diagram]](../../diagrams/11/156728fdecd0d8ebb210e0403451c2af.png)
![[Diagram]](../../diagrams/24/be4c8c643a827cd8995ef7577ee50e89.png)
![[Diagram]](../../diagrams/21/7afff785b8a4685945cda66e0df480db.png)
![[Diagram]](../../diagrams/41/6cea80fbddbbae92ffc62fbadaab5893.png)
![[Diagram]](../../diagrams/25/0c37d894828ba481a5adb3c853a28612.png)
![[Diagram]](../../diagrams/42/9b144fd9936ffe693f4b3a89cca595c4.png)
![[Diagram]](../../diagrams/24/02421a13f0eb7591afd31fef59d55427.png)
![[Diagram]](../../diagrams/8/a99d31c111bd73bd1a7ea282ab319282.png)
![[Diagram]](../../diagrams/0/7b53baa469f10bec42a13038fe0b8d45.png)
![[Diagram]](../../diagrams/30/e6efc47f47e458fae8a49fcc8370eff4.png)
![[Diagram]](../../diagrams/43/546af908578c072c442f28dbacf617a0.png)
![[Diagram]](../../diagrams/47/f0c2891d94f30bc337e9111bc9b7b171.png)
![[Diagram]](../../diagrams/33/295acc354fe8a4658cfef8045fafeac8.png)
![[Diagram]](../../diagrams/15/118e7cde11d3611e51ed28b9f89e0024.png)
![[Diagram]](../../diagrams/21/c20b3c59c92f55c52d6f31c2177e39da.png)
![[Diagram]](../../diagrams/46/ba43c40c0be3e2d0fe9c6d21323cd9d2.png)
![[Diagram]](../../diagrams/49/6d607b7e4a71436cc022d7afcc6b005c.png)
![[Diagram]](../../diagrams/8/9746e9b8f0ab6a8957c40b8f050f2e7a.png)
![[Diagram]](../../diagrams/21/c8b0044776a89f35c73f12c6c21bb288.png)
![[Diagram]](../../diagrams/9/d6e501a72703148bed54f3cc2341217a.png)
![[Diagram]](../../diagrams/38/6b3a7411e2399d007db101657336bc39.png)
![[Diagram]](../../diagrams/24/7109145db56f8a6025d13826e2f7a2d1.png)
![[Diagram]](../../diagrams/9/7e9ab818d7c5d8738bd6fc6a829c9a44.png)
![[Diagram]](../../diagrams/14/b8fb89ee93330806dd161e47339c6562.png)
![[Diagram]](../../diagrams/25/1dfb49040e2b05f6bac25de89620fdd3.png)
![[Diagram]](../../diagrams/45/6daaa2f9cbe78405eecb1d38df2eb1f5.png)
![[Diagram]](../../diagrams/27/784bdb14fa06561cd39153c7a854debb.png)
![[Diagram]](../../diagrams/42/e9dc4844508ca42d86b0d5b8eb8de982.png)
![[Diagram]](../../diagrams/2/967882deab07df0fc170a758d242fd63.png)
![[Diagram]](../../diagrams/2/91817d676507d3e3707eb2e9e68442e8.png)
![[Diagram]](../../diagrams/12/380be778798351108916e80443072140.png)
![[Diagram]](../../diagrams/9/d7f7b5d48cba161f9c274493887f68b4.png)
![[Diagram]](../../diagrams/42/637ee1595d712e0a7129b8af8bf6c32c.png)
![[Diagram]](../../diagrams/7/312765493cee6bd33b1c88da5db0a356.png)
![[Diagram]](../../diagrams/0/6f4ad520ef9e51c7ca366ea891d78798.png)
![[Diagram]](../../diagrams/8/4256b0bd93d8575bc4ca6661bd052458.png)
![[Diagram]](../../diagrams/29/2edc20d7a4def3b18d9c59277d583be1.png)
![[Diagram]](../../diagrams/2/ed10a22c7ec4bdedaad041c1ab3173e7.png)
![[Diagram]](../../diagrams/47/809ccb9546a218806aa4167677dfa211.png)
![[Diagram]](../../diagrams/39/4c4fc129b88c119c0234c88999b5c585.png)
![[Diagram]](../../diagrams/46/8f27d5be50eb486d8d9e4612d5216814.png)
![[Diagram]](../../diagrams/27/6ece2429d40dd22e43b3956bf9fcddfc.png)
![[Diagram]](../../diagrams/32/724f14f21100a8e2694727d238e2c14c.png)
![[Diagram]](../../diagrams/28/a5004a917a062711411c47c91765952e.png)
![[Diagram]](../../diagrams/46/dff01ffc9549ffeea265d7f72402752d.png)
![[Diagram]](../../diagrams/9/2b27d1cbf5ee4d90da2f0284df9b541c.png)
![[Diagram]](../../diagrams/31/0843190c7efb592edd788e6d72f624a1.png)
![[Diagram]](../../diagrams/4/753514b9e31243378b75242d26785343.png)
![[Diagram]](../../diagrams/23/8dcb2a8c9e7971c3567b7fd646f42d06.png)
![[Diagram]](../../diagrams/11/59fe14d129839dd5d9ef1c8a9a8a3736.png)
![[Diagram]](../../diagrams/42/d2a46f5425ce98ae2fa4337a042121d2.png)
![[Diagram]](../../diagrams/21/77792d383ed2ccba4ef115f2fb6eb50e.png)
![[Diagram]](../../diagrams/28/fb83bd8417c38efa774196e05e1c12bb.png)
![[Diagram]](../../diagrams/27/af0e3d910ba1fca5f72ce6ab631d9315.png)
![[Diagram]](../../diagrams/18/1ebd425fbee1c820ec44d4dac81a162e.png)
![[Diagram]](../../diagrams/41/c821e872f594bccbe202b05b99557d32.png)
![[Diagram]](../../diagrams/2/a6a65a20755bb25f6f803abe89e4d6dd.png)
![[Diagram]](../../diagrams/12/9b8ed16f8c21c0428e1fa32559780050.png)
![[Diagram]](../../diagrams/38/0abd0ef785310bd24860b8a56fbd9e3a.png)
![[Diagram]](../../diagrams/22/60791513a38f055ca701a9ceb7da5fee.png)
![[Diagram]](../../diagrams/37/55c58d1dcf410e91a828e8eb65ffecbc.png)
![[Diagram]](../../diagrams/3/7ef3068d20576d11d40b2128c081145c.png)
![[Diagram]](../../diagrams/24/f9e70f5545694845805a5bc001f0b5c8.png)
![[Diagram]](../../diagrams/22/4165838e7eda6524dae214a2c72e592c.png)
![[Diagram]](../../diagrams/48/ddf9725a93797d1ce67c85f95ee1ab12.png)
![[Diagram]](../../diagrams/36/a6c015298c48601a69c036d3747b472f.png)
![[Diagram]](../../diagrams/17/0bd9332464db8a133ac9af26ab4fd23e.png)
![[Diagram]](../../diagrams/19/f994002971f81623bf3c1edaadfd6ceb.png)
![[Diagram]](../../diagrams/2/97d60caf617ef25a77423a2c0c15edd8.png)
![[Diagram]](../../diagrams/48/1ff49b915929e15d3d28b02a9e939a0e.png)
![[Diagram]](../../diagrams/52/fc4cbda5db4240d04d47bcb2f6063585.png)
![[Diagram]](../../diagrams/12/98f2eb547beff6129449e50d8f06d65a.png)
![[Diagram]](../../diagrams/25/ff176899d6a0d711f3d0cc4716050404.png)
![[Diagram]](../../diagrams/15/219a7f778713c582e5c81cfb865fc575.png)
![[Diagram]](../../diagrams/44/406b53b71ea28dfc3ccf0a70f73dda26.png)
![[Diagram]](../../diagrams/23/76f96155e96b6a06bb9567346a2bd1e6.png)
![[Diagram]](../../diagrams/44/245c09779dc5a508ea1c856cd46aefb3.png)
![[Diagram]](../../diagrams/11/1f6aa03afbe3997f6cd05e95f3350912.png)
![[Diagram]](../../diagrams/49/40db1bea83db06d699980d64fc90d94d.png)
![[Diagram]](../../diagrams/43/eb5b67798c3b61b5ba15b455685f7413.png)
![[Diagram]](../../diagrams/35/54ada2135175084f855a8c0fbcd66e8b.png)
![[Diagram]](../../diagrams/39/da07e8e2c0dc7bb51c09ba5572d25410.png)
![[Diagram]](../../diagrams/3/8c32bc782e3cb9b39e40f190babba12a.png)
![[Diagram]](../../diagrams/24/bc8a7bab2d612bafc47354856a91d4cc.png)
![[Diagram]](../../diagrams/48/0132c4b8b81733e6555a3a45adc8a5bd.png)
![[Diagram]](../../diagrams/20/a53642c8a3da7e6508ca7bbc64407b97.png)
![[Diagram]](../../diagrams/14/018a76be9b97dcde9d103d62845c5bce.png)
![[Diagram]](../../diagrams/51/f93e06d1592b92aac7fa3179a13badfc.png)
![[Diagram]](../../diagrams/5/8d86619ec57f65f1aced4184174e5acc.png)
![[Diagram]](../../diagrams/13/b7a01b5cd29a5a399d0788dad2f83754.png)
![[Diagram]](../../diagrams/33/4e126aec60ef7b3c6b7a14adf81f7b5d.png)
![[Diagram]](../../diagrams/36/1adf4551d63335edb3837764de2d0763.png)
![[Diagram]](../../diagrams/8/098eb650c6400d24c6b93afbb0b11221.png)
![[Diagram]](../../diagrams/13/5e6b147c2cf6a3aceb11e1bbbbb066f5.png)
![[Diagram]](../../diagrams/45/22242d5540603b8a09d3198f31246e39.png)
![[Diagram]](../../diagrams/21/ca6dbd4e44fa9ad2cd9251b4fe8bcf99.png)
![[Diagram]](../../diagrams/52/0ab72bcbd432d261e940e053a926773b.png)
![[Diagram]](../../diagrams/36/f1d588a65b86aa31805a7870defb3ab1.png)
![[Diagram]](../../diagrams/35/88b11380ae9ae0b8765f6857797092eb.png)
![[Diagram]](../../diagrams/23/52bb2c669d0a5facc9e35a602033919a.png)
![[Diagram]](../../diagrams/44/6dc1990f3b4e1a1e9a6dc57d306bc0ca.png)
![[Diagram]](../../diagrams/32/af8e5bc86f190ad51ac9199e7ca62b80.png)
![[Diagram]](../../diagrams/37/2c1042f11741556e2c53734b19d76fe0.png)
![[Diagram]](../../diagrams/0/cfba24bb4314cbd159f619d9d2586eb1.png)
![[Diagram]](../../diagrams/5/85c7aace7fc818032ebcfd510a450eca.png)
![[Diagram]](../../diagrams/29/d55d96ef51db340c2a17b8f41da909c4.png)
![[Diagram]](../../diagrams/14/db1bee8b70b6e8df1c8816d0b3e07f50.png)
![[Diagram]](../../diagrams/34/e8979a2e2e2c491e6c54df368ead4b30.png)
![[Diagram]](../../diagrams/37/9bd613fdd07b02f3893bb05c6477d97e.png)
![[Diagram]](../../diagrams/18/0b3deac115b0b7a06f835f8685cb11af.png)
![[Diagram]](../../diagrams/22/85f634bf871729a01f0ef0f47d5f0c24.png)
![[Diagram]](../../diagrams/2/6a66e264aec50165fb58a7b95d7377c5.png)
![[Diagram]](../../diagrams/39/c86bd7515be70b19744fcf811afeaf2a.png)
![[Diagram]](../../diagrams/43/7c4ae4cb1d65d199330cfced8dcffa55.png)
![[Diagram]](../../diagrams/8/e9477d85c876272f035c560d93c26423.png)
![[Diagram]](../../diagrams/42/f39b59892dd8f98af58dc055bf7532a3.png)
![[Diagram]](../../diagrams/0/9329e4233f21f54590abaee3e272491f.png)
![[Diagram]](../../diagrams/43/81de37a932daf65c78d843224cf9bb2a.png)
![[Diagram]](../../diagrams/6/17427ba3a96958d169a21d17013b2354.png)
![[Diagram]](../../diagrams/32/beb1a7436cbf50066afbd325a17ac410.png)
![[Diagram]](../../diagrams/40/3c0a12d6660693942cef6cfbea1cf7ab.png)
![[Diagram]](../../diagrams/47/2ca94d9260901dd169d61b327f400047.png)
![[Diagram]](../../diagrams/17/d7ed4854eed67c1a4ed1a190c9262436.png)
![[Diagram]](../../diagrams/9/7dec978484169d39ef38418d602d5e68.png)
![[Diagram]](../../diagrams/51/0a234ad3b6f1082b6c23d757fef00e81.png)
![[Diagram]](../../diagrams/39/732e77c197e4e0f0e067037b300a84d7.png)
![[Diagram]](../../diagrams/6/a38411ceae8839c2940b582d70a2af44.png)
![[Diagram]](../../diagrams/46/1f0f4946cdfb1405d945beb90db6b026.png)
![[Diagram]](../../diagrams/0/b5d582055e52788742d9749e17e2b565.png)
![[Diagram]](../../diagrams/44/d69ad724763d4f12b557946b3e7dbd89.png)
![[Diagram]](../../diagrams/6/d5d3096b06fc12290fa120abedbb0462.png)
![[Diagram]](../../diagrams/21/0f28d28e4044557fa39e0d41c2c6b179.png)
![[Diagram]](../../diagrams/34/b70b5bd944f519ead7746dd3972562ee.png)
![[Diagram]](../../diagrams/33/76bb83d159a6d5d2bbcee1d0e42e8470.png)
![[Diagram]](../../diagrams/40/2cd3917e7871d48cbecf0664d438940a.png)
![[Diagram]](../../diagrams/37/01d2c2ef3669691be98550fda6d1c265.png)
![[Diagram]](../../diagrams/38/1491dfc1cbdf665dab11663c1eab9d31.png)
![[Diagram]](../../diagrams/16/5a116589e284c1c509bcddf8ad9bf99c.png)
![[Diagram]](../../diagrams/32/4e3fa113d0a7f2d7dfcefae54e3ad24c.png)
![[Diagram]](../../diagrams/33/a787376ae8ed43c7ed5193c7ceeee4c7.png)
![[Diagram]](../../diagrams/21/bf30eb1fa28d682313c6b271e509f50f.png)
![[Diagram]](../../diagrams/30/f7b4405d089a8e1ba62ddc7cc0d61ee7.png)
![[Diagram]](../../diagrams/37/6b2f3d6561bd512693bd60998f4add09.png)
![[Diagram]](../../diagrams/8/9298f489c699b1fa2aab9903e072fef0.png)
![[Diagram]](../../diagrams/1/c978ffecb3c1b5f08a438e5e14764073.png)
![[Diagram]](../../diagrams/4/1bb2b07ce66a6d93abff347aff5b485e.png)
![[Diagram]](../../diagrams/41/638d979995e2d9b2f179eda0ca042477.png)
![[Diagram]](../../diagrams/3/8d5a7b816732fa6acd0bd035528c3271.png)
![[Diagram]](../../diagrams/12/c144fe27c7dc0ae7767ff1a0bda65d50.png)
![[Diagram]](../../diagrams/17/d9d4a3253600c54285f4f39b83e8205f.png)
![[Diagram]](../../diagrams/5/dd0e864a00b74a5a1d24977d466d3fd2.png)
![[Diagram]](../../diagrams/8/285f98b9caffad80538bedba6ebbb3f0.png)
![[Diagram]](../../diagrams/30/734bce48e4fb1c8a80b91ea7851dfe42.png)
![[Diagram]](../../diagrams/28/f936257a003c4ff4f229f9899312d477.png)
![[Diagram]](../../diagrams/44/78d35fd3fd335bb18b65e6d661c78213.png)
![[Diagram]](../../diagrams/12/4e4c7a14f874e13d562771ad8e0824b3.png)
![[Diagram]](../../diagrams/48/97ba04fe05635c1ae2a6718ac8640036.png)

![[Diagram]](../../diagrams/19/dfc6d86e6c696b3710b28b0e8f53463e.png)
![[Diagram]](../../diagrams/12/14dadeb54a67fbdf91d1e7df192b2756.png)
![[Diagram]](../../diagrams/23/648c1c96bb47eb5fa68c718d45435bd8.png)
![[Diagram]](../../diagrams/1/27ca1bd21eff8783c11795d6b54c4f53.png)
![[ext]](http://www.bresler.org/Go/Photos/Gao1ji2.jpg) http://www.bresler.org/Go/Photos/Gao1ji2.jpg
http://www.bresler.org/Go/Photos/Gao1ji2.jpg![[Diagram]](../../diagrams/48/9df75eeabee263d20ad3c484d15b47c3.png)
![[Diagram]](../../diagrams/40/e49166506db7ea211adc984020a8323d.png)
![[Diagram]](../../diagrams/30/6aaaf10939c8d7f394e768ada3771bf7.png)


![[Diagram]](../../diagrams/42/3aff1e02e4cabc77a34e50c71f0b8e2e.png)
![[Diagram]](../../diagrams/43/d4c306151f74408fb35c7ff1c5b2b127.png)
![[Diagram]](../../diagrams/52/76daf9ce9036eb7a5be6372188de3391.png)
![[Diagram]](../../diagrams/31/c2549c0b3ec2e11409bf08dcecbb305b.png)
![[Diagram]](../../diagrams/18/8d14f8a8bd9d2dca401fe633db0c5bad.png)
![[Diagram]](../../diagrams/26/de6be2e2c54bd77783d5deb9c842b0c9.png)
![[Diagram]](../../diagrams/10/772139b0b4882328b4f6fbf98d9f6448.png)
 Weiqi Tiandi - 围棋 天地
![[Diagram]](../../diagrams/21/3a95c5b00a4edb5d39e54af9e82aa695.png)
![[Diagram]](../../diagrams/16/2a8f107100d67e400c3baeb6f7557c1d.png)
![[Diagram]](../../diagrams/6/3275eb9969a957e39fbc51e618a453e1.png)
![[Diagram]](../../diagrams/31/1c79a8771b8eee9594cd6beec8bb201e.png)
![[Diagram]](../../diagrams/22/2974a5c7d027805986d909c6816ec5ce.png)
![[Diagram]](../../diagrams/4/fb87ae22f6f68278d67125d7ef277f56.png)
![[Diagram]](../../diagrams/0/c2c3c48851a549b180856d3cb342404e.png)
![[Diagram]](../../diagrams/14/4a0beecd422d59bff62ea698c8206f9f.png)
![[Diagram]](../../diagrams/34/1b0ef45f8ba25927906e9fdbaff93a81.png)
![[Diagram]](../../diagrams/50/fc3121d0428bdfe861dededc46b6ff4c.png)
![[Diagram]](../../diagrams/15/4af9b93636abc6d2db9326f769dfcb49.png)
![[Diagram]](../../diagrams/39/436db3e2a55d9e2da067e2e5b47fe80a.png)
![[Diagram]](../../diagrams/38/72f56b4939b53bd6c991729411989eed.png)
![[Diagram]](../../diagrams/45/c6c25e9769c979c888135fc5883b04bc.png)
![[Diagram]](../../diagrams/19/34ab8c870c78e7ed9179875205a5f103.png)
![[Diagram]](../../diagrams/3/82e6af66e8ca049464c3efdbd1f767fa.png)
![[Diagram]](../../diagrams/52/17a718e846a26ec806976a485420fc2f.png)
![[Diagram]](../../diagrams/35/68a0ca230666c220436fc5b7ae287bb5.png)
![[Diagram]](../../diagrams/12/afc8360d93fc8ef2ce618bde6cba8176.png)
![[Diagram]](../../diagrams/46/88917491de980567fc491ce75450d772.png)
![[Diagram]](../../diagrams/18/8e722e98abd833178692f98685d01766.png)
![[Diagram]](../../diagrams/46/5cfee3b2e25f790f7ccb71d190da63ec.png)
![[Diagram]](../../diagrams/43/ddf060ceea64f77b47ac69690b2ec157.png)
![[Diagram]](../../diagrams/30/f9e44f32787f3b96f28ecc9fdbbbd39b.png)
![[Diagram]](../../diagrams/8/03cd0d9c920edf4ffa8eb979e8609b84.png)
![[Diagram]](../../diagrams/13/8e9154ea633e7ad33fc72e2062073dc0.png)
![[Diagram]](../../diagrams/27/564989ebc943ef10329703c45d9e2a2c.png)


![[Diagram]](../../diagrams/11/96413b17ee61d7a1de6dc5c97c72027c.png)
![[Diagram]](../../diagrams/37/9ca09bf1e293d62977b1ead97d1d356a.png)
![[Diagram]](../../diagrams/19/33a7f2c19ec750c158590af36b408665.png)
![[Diagram]](../../diagrams/9/8be12d7aa7524dd07a364b15dc15afa6.png)
![[Diagram]](../../diagrams/6/32d69ad003b06f39d8d6119f4209b287.png)
![[Diagram]](../../diagrams/16/69e0b1601492f5dd84d288be3c76e538.png)
![[Diagram]](../../diagrams/14/8a4b3443c554628c3b0b20a3e82b945e.png)
![[Diagram]](../../diagrams/46/eb6f62da8b05e5b8c3576af07547b0a1.png)
![[Diagram]](../../diagrams/33/25df7f90e33d0c807444e94d5fd276ed.png)
![[Diagram]](../../diagrams/33/21ce1e12d68923fa1fe0ac73711940fb.png)
![[Diagram]](../../diagrams/46/714a2b8257e14536a4e8d6de8d13079a.png)
![[Diagram]](../../diagrams/45/957f23c69a3e941188cb2657d9524512.png)
![[Diagram]](../../diagrams/41/d5c20f3e595789f5afe5fb48de11c844.png)
![[Diagram]](../../diagrams/19/45639f20a32e48abfdafa63aba55e67b.png)
![[Diagram]](../../diagrams/30/d71d9491d9098907c72b64784206f67d.png)
![[Diagram]](../../diagrams/24/0dca7f6eced7da8d6ba8668e9df46e2f.png)
![[Diagram]](../../diagrams/46/5c8d8c81d1d6ad845f38b8fd5aae0e96.png)
![[Diagram]](../../diagrams/27/1e2471218917c5464151eca282a92fa1.png)
![[Diagram]](../../diagrams/11/88f32338123d57b717988b9739cb54c3.png)
![[Diagram]](../../diagrams/40/4b8553248acd9b2b3c1d99ca999881b6.png)
![[Diagram]](../../diagrams/28/ad61df76f7de387608e837c38d99e32c.png)
![[Diagram]](../../diagrams/24/06df72f480d88eca3112f33ad710cb43.png)
![[Diagram]](../../diagrams/49/b5c2a0ab4c06006f67641130f4ce51bb.png)
![[Diagram]](../../diagrams/23/163ab45fa5d63fd46d56288e8a8455cb.png)
![[Diagram]](../../diagrams/29/3f69697b975a60929e0ee4f9b8960b42.png)
![[Diagram]](../../diagrams/39/4801b945f6472ed3729819867cbfbfbe.png)
![[Diagram]](../../diagrams/45/9a3dbb5769ea2aa9083e67f18f615f51.png)
![[Diagram]](../../diagrams/49/86999ac0a68484377615444ed6bb136f.png)
![[Diagram]](../../diagrams/16/b6836e027c5839a949401422131232a2.png)
![[Diagram]](../../diagrams/42/be4decf40c26aa4cd3fd0c9c3c949f16.png)
![[Diagram]](../../diagrams/33/bafe4921dbfd492d17cf5892a8b825ec.png)
![[Diagram]](../../diagrams/47/3154565596668ad4b136c38b107b3209.png)
![[Diagram]](../../diagrams/11/7879a076e74865bf34790001f6b6c0ac.png)
![[Diagram]](../../diagrams/20/2536a5d65bbdc248a19d00257f43cada.png)
![[Diagram]](../../diagrams/35/ae9c2293e3009d26622b6ed361d0100e.png)
![[Diagram]](../../diagrams/27/0b50f8ea68145888ef72a5c902020947.png)
![[Diagram]](../../diagrams/18/2df12fd0fd46d5e47143e5189431fff1.png)
![[Diagram]](../../diagrams/33/e6c4d12b1e697df480014dfc0ba94bc3.png)
![[Diagram]](../../diagrams/9/884a1eff04795a377d238256216b6ec1.png)
![[Diagram]](../../diagrams/36/104bcca4828019f11438923769594622.png)

![[Diagram]](../../diagrams/4/b9a16c3ac32b0453506c92f62b362aba.png)
![[Diagram]](../../diagrams/27/ed3e3c243126768cef8a0eeb3962bddb.png)
![[Diagram]](../../diagrams/44/2995cf8b2fef0633434dc501a6658069.png)
![[Diagram]](../../diagrams/11/5d179f7bb6f4eb98889447d10a2f1815.png)
![[Diagram]](../../diagrams/49/4b8cc71adfc564f13a28177be0ed973d.png)
![[Diagram]](../../diagrams/4/e623f2274d8249b8f6f0df4130276083.png)
![[Diagram]](../../diagrams/49/3eb09d0c909e463964e9610084fcf9d9.png)
![[Diagram]](../../diagrams/7/715b7f8fbdf28f473bfa61b414339b8d.png)
![[Diagram]](../../diagrams/30/77255d44ade41c54da98dded458dfcbc.png)
![[Diagram]](../../diagrams/36/2378b39823034cf5785532eeaaaca365.png)
![[Diagram]](../../diagrams/27/e34fb169fad8f82df79e1af696499c1e.png)
![[Diagram]](../../diagrams/27/77e5278a23ca300a2e3287b537c69258.png)
![[Diagram]](../../diagrams/49/975ba187587f78ccda016e969014f95a.png)
![[Diagram]](../../diagrams/24/e5bbc5884c01f06f2092d25c52f85934.png)
![[Diagram]](../../diagrams/1/ae7d649f82d7571801573a0769e74a50.png)
![[Diagram]](../../diagrams/26/354d8261ed7ed6ffc4584548fcb31ca8.png)
![[Diagram]](../../diagrams/34/0d857e68f52dc70185a1818d5f0c2a8d.png)
![[Diagram]](../../diagrams/10/0087d565dd384753296562fe3f51f758.png)
![[Diagram]](../../diagrams/35/23c3f3c383ca2c217a58ff72fb91d836.png)
![[Diagram]](../../diagrams/42/b10f75977b059c64e0582ad4da49fb20.png)
![[Diagram]](../../diagrams/33/8219d8f11ede64a45ff42dd0637ab52e.png)
![[Diagram]](../../diagrams/42/fbe6fbc9a587f6c9e15257e4c5d5a3a7.png)
![[Diagram]](../../diagrams/10/f531626be810f947c436e2b19f68fa2f.png)
![[Diagram]](../../diagrams/24/19123dd67701be2a5c3fa9206173e4fe.png)
![[Diagram]](../../diagrams/23/3fca67e0ab74802dc8975a3e1ae9646e.png)
![[Diagram]](../../diagrams/49/ea7a1d15ab853a9d167f7a943cff98af.png)
![[Diagram]](../../diagrams/5/59ac7fe363fc0cc53f8d208ea65d0c39.png)
![[Diagram]](../../diagrams/46/e48c3d7d7daf304ae75e6b42d50463d8.png)
![[Diagram]](../../diagrams/52/9fd1f70f7b0bf670f03d05a42d7acdee.png)
![[Diagram]](../../diagrams/6/2fc8633511cd683845a117deefcbae55.png)
![[Diagram]](../../diagrams/43/dd5eebaaf8b8ed0e4e8f0a267ed7f103.png)
![[Diagram]](../../diagrams/18/6ef2b04ac03ebff4a34a32b73fbe9753.png)
![[Diagram]](../../diagrams/36/8b8ac17598eb06cbe4f25c985931aa1b.png)
![[Diagram]](../../diagrams/22/25d64f8c98b3f84e75b44bcc117dfc74.png)
![[Diagram]](../../diagrams/48/fa7c3c0b80171e0d8fa91a3d92f4c350.png)
![[Diagram]](../../diagrams/40/e02bfe04dcc115a25c636c4c86ad4af3.png)
![[Diagram]](../../diagrams/35/1b1f54b662c48207a4c56fcb387f6a3f.png)
![[Diagram]](../../diagrams/5/e91aeaeca4e85174e09651a89107a8f9.png)
![[Diagram]](../../diagrams/50/75638860aa8f229f1f0b8c82d9047915.png)
![[Diagram]](../../diagrams/25/62ba379f1e433380f6877c9ae8877545.png)
![[Diagram]](../../diagrams/4/c3f3e981bb066ff80810cbd343ea0806.png)
![[Diagram]](../../diagrams/11/c027b84837698eb832a07b6e5db0896c.png)
![[Diagram]](../../diagrams/25/a8955b092e7030717bf10040edc09d4b.png)
![[Diagram]](../../diagrams/32/bf840fbaf7535f277b4773d5a39c0b85.png)
![[Diagram]](../../diagrams/26/41c039e36acc34efe2f2ee9547ade9ce.png)
![[Diagram]](../../diagrams/42/68677cd2915ded57e3fd70f94a8d70e6.png)
![[Diagram]](../../diagrams/34/ed05cb41087a8831134a0887ee903a28.png)
![[Diagram]](../../diagrams/10/2b92beab66b6a4b14c9cd1a9b93dd8af.png)
![[Diagram]](../../diagrams/6/ad6f503e4fd4eac9dab8f3543a8be815.png)
![[Diagram]](../../diagrams/19/f471130a0780db0d3defd3b1d89b72c7.png)
![[Diagram]](../../diagrams/20/d2438b9e2d8250c745c6428af3c3b8bf.png)
![[Diagram]](../../diagrams/5/3a0ffb616750731bcbbb088b1b8ef9f3.png)
![[Diagram]](../../diagrams/29/77c537184aaf5d1d83858d5eb5b58a67.png)
![[Diagram]](../../diagrams/25/72194d616bf45a31af842f4218b6dc4c.png)
![[Diagram]](../../diagrams/19/99a0d2a6dca8720ca3a03ce977352fa0.png)
![[Diagram]](../../diagrams/30/35fcfc8339980ce34e76897cacd400a0.png)
![[Diagram]](../../diagrams/48/75094edba312f27af9a29237a181de8c.png)
![[Diagram]](../../diagrams/17/4ad93606aa3b04e1f33736e6a42f8955.png)
![[Diagram]](../../diagrams/6/fed0d3de010f48527a5bc15d0e2f85aa.png)
![[Diagram]](../../diagrams/0/d4e1abdb6a4f960779f416ae8913b197.png)
![[Diagram]](../../diagrams/13/a93148398121b6ef536f8f6e0758865b.png)
![[Diagram]](../../diagrams/52/eb7da3eaa7799676807c2622583437b6.png)
![[Diagram]](../../diagrams/46/76ac81c7808835e63ffab3d628f13c93.png)
![[Diagram]](../../diagrams/22/47f25e6319108f4325428c71ec8ac58a.png)
![[Diagram]](../../diagrams/3/5498ba92e9a10837864542f74d239da2.png)
![[Diagram]](../../diagrams/7/b9ab6939e7fd17609cb2aa4c54d76c53.png)
![[Diagram]](../../diagrams/25/73028fa4ce5f5d092feab7c6562dce8f.png)
![[Diagram]](../../diagrams/45/864426864e35903c4376ae704aae83aa.png)
![[Diagram]](../../diagrams/6/ec14f2336c01bc620e057572d43e9e61.png)
![[Diagram]](../../diagrams/18/097a6b9f56253f7a7d3565b612cda45d.png)
![[Diagram]](../../diagrams/51/c7aed4af18317dab433c751f7bd9b869.png)

![[Diagram]](../../diagrams/11/5738c477dab29cddee5cb20d57de01cd.png)
![[Diagram]](../../diagrams/52/034e1f5316b4805fa26032c53aab3474.png)
![[Diagram]](../../diagrams/13/990dde976faf874493af49e73ee0d5ae.png)
![[Diagram]](../../diagrams/28/790e9f2141dc3a7779e283b5dc67c5e9.png)
![[Diagram]](../../diagrams/30/bf5023f97d5b4ac61762cc52751a513c.png)

![[Diagram]](../../diagrams/47/d06625de049802920231da6f159b5276.png)
![[Diagram]](../../diagrams/23/37d185d353f6404b42946eaa6c53939f.png)
![[Diagram]](../../diagrams/5/15b81b1bfc1bc2a245a94958250380ac.png)
![[Diagram]](../../diagrams/8/f64c74bfe71a32a9a90712b1e7f8fdb6.png)
![[Diagram]](../../diagrams/27/0ef7f3dad68e071fe97099dad6c42171.png)
![[Diagram]](../../diagrams/13/7cdde8dfa8576e133d217795d68beead.png)
![[Diagram]](../../diagrams/5/b56fb997eeb0110c8b7d766b34bb0157.png)
![[Diagram]](../../diagrams/18/7f18c7986171c87ba4bcc325acb29ac7.png)
![[Diagram]](../../diagrams/15/ca70bf169385ae1554a94374e9c91f09.png)
![[Diagram]](../../diagrams/25/4919b9606cffdb0cca42abdb0aef95da.png)
![[Diagram]](../../diagrams/32/97bc080a6a902b3f1e39920a7b8bf5ab.png)
![[Diagram]](../../diagrams/11/0c329bda131281c65b2a1ab5ccd956d4.png)
![[Diagram]](../../diagrams/20/beec20f5e6ebe34fe1b40bf4d2cf007a.png)
![[Diagram]](../../diagrams/24/89a05c1270ad932cc28fc1394c90db00.png)
![[Diagram]](../../diagrams/13/fc45ecb0202fce9be7f11543efc9aec3.png)
![[Diagram]](../../diagrams/43/adfb224afd111541d74ee0ac84c2a532.png)
![[Diagram]](../../diagrams/44/3615f83185952f2686a57f464dafe4b5.png)
![[Diagram]](../../diagrams/49/1961c82863b720db7eaeabbbd46f53dd.png)
![[Diagram]](../../diagrams/22/d06d93a1bc26181c58b8b3bc1f0852b7.png)
![[Diagram]](../../diagrams/46/ad36c0e4455d573eeaec9bc1e565e203.png)
![[Diagram]](../../diagrams/35/d9b9241eaeabf04863bbc7b904a9660a.png)
![[Diagram]](../../diagrams/14/7ac7bd5391042d463e7b98f294033c8c.png)
![[Diagram]](../../diagrams/2/861d2d31f467469a3873656aed6f50eb.png)
![[Diagram]](../../diagrams/5/486379244f2b63af15ec10f904079c91.png)
![[Diagram]](../../diagrams/19/5c30e3a8d5959789f34aa63b1332dd1a.png)
![[Diagram]](../../diagrams/5/66b510157dc806ccc9001ed4abb74396.png)
![[Diagram]](../../diagrams/18/bc73fc6796c0486b0b839ed6f7dc0dfa.png)
![[Diagram]](../../diagrams/39/5dc9d9ab78a32f5f13863b23807f6ce4.png)
![[Diagram]](../../diagrams/22/ad6f5900b336daec7ccd64e3fcdb6b5f.png)
![[Diagram]](../../diagrams/6/062d2d8aa959f280254c4f630dcd8965.png)
![[Diagram]](../../diagrams/52/72c786786d4eaa952ddab9672b2baef2.png)
![[Diagram]](../../diagrams/3/2563b8093a76549b2e779642da098754.png)
![[Diagram]](../../diagrams/3/349ae8f50b2af38ee6faeaebf648ba49.png)
![[Diagram]](../../diagrams/11/42ec4ac11f4493d08b8bf3c7d431f0de.png)
![[Diagram]](../../diagrams/7/67deea897c5db195d6e6a848fd3378e6.png)
![[Diagram]](../../diagrams/36/fd066b264f11201d16601a4497e542e3.png)
![[Diagram]](../../diagrams/29/e33fae053e4cbed31a9025711993bbc9.png)

![[Diagram]](../../diagrams/39/eafdf736235983eb7545e433fc62705d.png)
![[Diagram]](../../diagrams/3/bc6aa80f3bb7a17c615e22216c8007db.png)
![[ext]](http://bresler.org/Go/Photos/FaYangLun_front.jpg) http://bresler.org/Go/Photos/FaYangLun_front.jpg
http://bresler.org/Go/Photos/FaYangLun_front.jpg![[ext]](http://bresler.org/Go/Photos/FaYangLun_back.jpg) http://bresler.org/Go/Photos/FaYangLun_back.jpg
http://bresler.org/Go/Photos/FaYangLun_back.jpg![[Diagram]](../../diagrams/34/dba898e83209379b9bcf630224cf8864.png)
![[Diagram]](../../diagrams/37/0c08b15d66ec963558418d6abcb5347f.png)
![[Diagram]](../../diagrams/16/4e2129ba4e34028f6e9d26f97463b0fe.png)
![[Diagram]](../../diagrams/14/c642338b459b748ba3182ffa3a40b56f.png)
![[Diagram]](../../diagrams/47/03714dd0a2c8f4d219c61c97f7b8b892.png)

![[Diagram]](../../diagrams/29/389d07883949829b3a2efecb17c6de00.png)
![[ext]](http://en.wikipedia.org/wiki/Image:Wu_Tang.JPG) http://en.wikipedia.org/wiki/Image:Wu_Tang.JPG
http://en.wikipedia.org/wiki/Image:Wu_Tang.JPG


![[ext]](http://i10.photobucket.com/albums/a137/voonboy/scan0001.jpg?t=1166146127) full size ( 800x584)
full size ( 800x584)
![[ext]](http://i10.photobucket.com/albums/a137/voonboy/PIC_0031.jpg?t=1166149292) full size(640x480)
full size(640x480)
![[ext]](http://i10.photobucket.com/albums/a137/voonboy/GroupPhotoattheSignaporeWeiqiAssoci.jpg?t=1174526720) full size(600x800)
full size(600x800)
![[ext]](http://i10.photobucket.com/albums/a137/voonboy/CHMSGOSOCIETY.jpg?t=1169819976) full size(600x800)
full size(600x800)![[Diagram]](../../diagrams/29/d15b8f9287f02f97f76a7a6715870f0d.png)
![[Diagram]](../../diagrams/6/e3f1a35dc55feec5ef1beeafa5f79f62.png)
![[Diagram]](../../diagrams/44/6e8c109c266d24b7d27f9e6eb8631d38.png)
![[Diagram]](../../diagrams/43/291c6c136bb6344e3332c5965c25e544.png)
![[Diagram]](../../diagrams/20/982dad1985a651ad715c17ed7a930eb2.png)
![[Diagram]](../../diagrams/44/5b7377d86c592e36a46ad352429f1d49.png)
![[Diagram]](../../diagrams/25/9faab00ea8148606d6bac49ecb9e7bc6.png)
![[Diagram]](../../diagrams/2/3edc4cc7e39e4ffbf20a2a9859510f41.png)


![[Diagram]](../../diagrams/41/601e67c6e767164fca21f20ac2f41a04.png)
![[Diagram]](../../diagrams/37/225c447f5f75933c1f5334503a9b572e.png)
![[Diagram]](../../diagrams/24/4c509be9fe59c74490d9fc1bf542e114.png)
![[Diagram]](../../diagrams/19/c40e9b1d537a9f5808127bc2441c85fd.png)
![[Diagram]](../../diagrams/40/cf2a251e1d01924595a7fdb0a0bb6aed.png)
![[Diagram]](../../diagrams/50/d6c23fa114cc171faa8b3ed2d9e87d4a.png)
![[ext]](http://www.nihonkiin.or.jp/player/img-2/000013.gif) http://www.nihonkiin.or.jp/player/img-2/000013.gif
http://www.nihonkiin.or.jp/player/img-2/000013.gif


![[Diagram]](../../diagrams/43/47a701ea1954c7c37fccd5c979f4c0cc.png)


![[ext]](http://badyk.ru/files/P6050013.jpg/) http://badyk.ru/files/P6050013.jpg/
http://badyk.ru/files/P6050013.jpg/![[ext]](http://badyk.ru/files/P6050012.jpg/) http://badyk.ru/files/P6050012.jpg/
http://badyk.ru/files/P6050012.jpg/![[ext]](http://badyk.ru/files/P6050010.jpg/) http://badyk.ru/files/P6050010.jpg/
http://badyk.ru/files/P6050010.jpg/![[ext]](http://badyk.ru/files/P6050007.jpg/) http://badyk.ru/files/P6050007.jpg/
http://badyk.ru/files/P6050007.jpg/![[Diagram]](../../diagrams/28/b3fc7da1d8ae03b4f376005ea7c5f27d.png)
![[Diagram]](../../diagrams/23/1778a51762c91258c5f13e1b15944124.png)
![[Diagram]](../../diagrams/0/37629af189f0e8b0773dd29badff8a06.png)
![[Diagram]](../../diagrams/52/f95f74976c0bd2f836a54182a9fb883f.png)
![[Diagram]](../../diagrams/1/835775fea09b31092a8ed18052d22c61.png)
![[Diagram]](../../diagrams/25/998bcb450a2fada51d985d72d966a9dc.png)
![[Diagram]](../../diagrams/35/c7327822bf9ec9afff444cdf35ff78e6.png)

![[Diagram]](../../diagrams/14/a57ea18e36ba53f44f4c411a261474e8.png)

![[Diagram]](../../diagrams/21/503ef8a0ec80a31e07ca89c82397c86b.png)
![[Diagram]](../../diagrams/34/d0d93afec24447a0bb66e775d684911b.png)
![[Diagram]](../../diagrams/6/4e6bd7b05f1c06b9e51618dd9e1af0a1.png)
![[Diagram]](../../diagrams/13/90f01c11bc822dfd2a27566eaad503dd.png)

![[Diagram]](../../diagrams/39/d67978b5528e84144fb8ad262ee7950b.png)
![[Diagram]](../../diagrams/4/16613034b69d949c2453172934b93b97.png)
![[Diagram]](../../diagrams/3/ed704dd2d3886afe471af3c5bd8b5385.png)
![[Diagram]](../../diagrams/2/49f6bb806631cfbe4456bc006abcc557.png)
![[Diagram]](../../diagrams/51/aac703f4f1d6bf3604b9a556b5b4ddd7.png)
![[Diagram]](../../diagrams/40/377da251a525a8623d6f2017ed476a65.png)
![[Diagram]](../../diagrams/23/b845f95359eeb579ede20a02c8814a27.png)
![[Diagram]](../../diagrams/18/0768813aaed383bc57ea08499351b4b4.png)
![[Diagram]](../../diagrams/7/58d43573babb8d97671f6b358ae02829.png)
![[Diagram]](../../diagrams/11/e3f2f57510cf6df7dca7e7e52499da8d.png)
![[Diagram]](../../diagrams/49/25b84d0eaead4b7a0dc2d608a32ff49e.png)
![[Diagram]](../../diagrams/27/3f4b0f1ec7c8b068b0612069742529b3.png)
![[Diagram]](../../diagrams/20/65376181f392a210b4008abad5be6526.png)
![[Diagram]](../../diagrams/32/c3f8c8bb4f90d6b80c861b0578c100b7.png)
![[Diagram]](../../diagrams/41/29faffa4b801329b329be180982f9d22.png)
![[Diagram]](../../diagrams/12/61c59c0b7b7b1250c6c3ba124d41decc.png)
![[Diagram]](../../diagrams/31/1de6abc696e1c6abf506e0ac4b70535c.png)
![[Diagram]](../../diagrams/41/eadbbece59249b5f06aefbc7adb2f190.png)
![[Diagram]](../../diagrams/31/dc1e4c8e4bc82f1707008ba032806068.png)
![[Diagram]](../../diagrams/20/849e76fc74aa98a022b36432828cc887.png)
![[Diagram]](../../diagrams/39/da76e3a9870e4e8b7d435cb0328cae2d.png)
![[Diagram]](../../diagrams/43/73d44fa6932014aa7f299c0ff53c6f4d.png)
![[Diagram]](../../diagrams/12/1816f0f750ad8a5ee179ec7d388f5692.png)
![[Diagram]](../../diagrams/37/cb2950330688303af4b4652de2e74163.png)
![[Diagram]](../../diagrams/32/c2bed0580d019a3db465ac00a9be2d39.png)
![[Diagram]](../../diagrams/30/d58da4ff8b496d49a5b94d116a641227.png)
![[Diagram]](../../diagrams/12/5f78e07d011d3d645da63fba148f3c5a.png)
![[Diagram]](../../diagrams/31/cb961068dbf469fc3253ed9e82b373df.png)
![[Diagram]](../../diagrams/4/dd147e1afc7705c1a283ec38571334f3.png)
![[Diagram]](../../diagrams/5/5e4fcb1b2a1cafb9a20dcc68ca987957.png)
![[Diagram]](../../diagrams/10/b905705323fb44e290c8e11f06084ca1.png)
![[Diagram]](../../diagrams/44/02e6b531cedd8222e31b1d4455bc3a46.png)
![[Diagram]](../../diagrams/45/cbbdcdc0946798450c91a343ed633a9d.png)
![[Diagram]](../../diagrams/16/ca6839f974fd48b81c9e15d90e67a40e.png)
![[Diagram]](../../diagrams/33/ff56350cc68d645446ffc42f1fb8c46a.png)
![[Diagram]](../../diagrams/24/5be2e223e91254678d8b078b663319d2.png)
![[Diagram]](../../diagrams/41/6bafcb5e99689ad6281d899149f2018e.png)
![[Diagram]](../../diagrams/10/82c015d7e9f61806653b1ba378f995a4.png)
![[Diagram]](../../diagrams/40/e069dc6aba1aa3d842a11b09007c2ce6.png)
![[Diagram]](../../diagrams/42/d1b64b6928f7d3bc3a7303d1f72c4d35.png)
![[Diagram]](../../diagrams/42/5a7e6b7b1e7b2b9fc313d3e55679e5cd.png)
![[Diagram]](../../diagrams/38/f426ff92b7109bbbf4e8f18656b2f757.png)
![[Diagram]](../../diagrams/12/6baac42916b259a3f834daf16c9766f7.png)
![[Diagram]](../../diagrams/46/f1654b6dbbde84b810d1e0f26244bf61.png)
![[Diagram]](../../diagrams/9/5386659ec77bf430426825b32cb02e37.png)
![[Diagram]](../../diagrams/37/8c698faee4a2ed2a0a79138199ae89fe.png)
![[Diagram]](../../diagrams/40/2a129bffd47faf8d14e55bd7ef7845bb.png)
![[Diagram]](../../diagrams/6/b4d097ae7ce9e535f2ec909517886ebd.png)
![[Diagram]](../../diagrams/25/aaf8a103b354c88586391202eb1df65d.png)
![[Diagram]](../../diagrams/28/c6e42fe76c17fcc922a75d7cef94ce98.png)
![[Diagram]](../../diagrams/15/23940d95a9545039e3dce1ec95feb0ff.png)
![[Diagram]](../../diagrams/13/8b868d3c0432f2abbe0b4946fc157aa0.png)
![[Diagram]](../../diagrams/14/2333ad4e66f1e736293053a337ed3bb6.png)
![[Diagram]](../../diagrams/47/db7f485ec5694b1244efd2c2718e165c.png)
![[Diagram]](../../diagrams/52/7ebdb5afcab9375c9ac16d854a244cd7.png)
![[Diagram]](../../diagrams/9/e519ec57a80071426fe928c315feb79b.png)
![[Diagram]](../../diagrams/49/4284241ba5eedac115fb35cbe971b72a.png)
![[Diagram]](../../diagrams/46/2627d62f43a518c1af1143712481192a.png)
![[Diagram]](../../diagrams/13/3cc4bd430621d29b7c9a8572ba384b02.png)
![[Diagram]](../../diagrams/42/956109f598883bc03e29b85228d3d207.png)
![[Diagram]](../../diagrams/33/d28a40c4ebcb379642e2a83477aae028.png)
![[Diagram]](../../diagrams/45/aff65369a4a56f1c11e220893e33ff88.png)
![[Diagram]](../../diagrams/7/00db1ea2be3654382fb29be8398481be.png)
![[Diagram]](../../diagrams/37/d38f6c5988ed2d3e24c448c443f353ab.png)
![[Diagram]](../../diagrams/52/9f870560d943258b67a8b418ed41eee4.png)
![[Diagram]](../../diagrams/6/49ef2ecfc5ae54e621f371c3ee463da4.png)
![[Diagram]](../../diagrams/33/acabf1765ec4fccef941e5fd5c3924dd.png)
![[Diagram]](../../diagrams/44/55d35c3b2e118b3f4c265adf775b358a.png)
![[Diagram]](../../diagrams/38/af8c8478b2150104eeb4370e24e6b085.png)

![[Diagram]](../../diagrams/36/64ceb8a94a800af240e6ce9bd0e41507.png)
![[Diagram]](../../diagrams/52/8052981bb1df2d79fd3817eab6364dc1.png)
![[Diagram]](../../diagrams/38/43f7ab77f4749dd4076e67b502b3b6b4.png)
![[Diagram]](../../diagrams/0/5fb7f292370b45472c90284d85e8a147.png)
![[Diagram]](../../diagrams/4/1b2ceeead223fa148f030b6e54180bdd.png)
![[Diagram]](../../diagrams/10/aa9ca0d854226476a04cdbe096a41b33.png)
![[Diagram]](../../diagrams/17/c05e84f564442bc0216becaa03487c3f.png)
![[Diagram]](../../diagrams/48/124e9020c3a29ceb62b40fb5a2243270.png)
![[Diagram]](../../diagrams/16/068a3fee111cf2689be786159c6194ab.png)
![[Diagram]](../../diagrams/20/35eeb554d843caf38392d1f250b54834.png)
![[Diagram]](../../diagrams/8/3247c8cd9ffb9fca26ba21f80e24b92e.png)
![[Diagram]](../../diagrams/38/5af9ca6e95964aa23acd5fa4da24cb64.png)
![[Diagram]](../../diagrams/29/8c9042d20b929d417bcc627bef8f6624.png)
![[Diagram]](../../diagrams/34/343440ad7b0f97711b72b18045436806.png)
![[Diagram]](../../diagrams/29/ee01d4bfc716117a0695d8a78b4af2f1.png)
![[Diagram]](../../diagrams/25/68a46841604e4db88c83acd73bb14b43.png)


![[Diagram]](../../diagrams/5/20a0c2a73df9ef0e7d6b08fcfedcc94e.png)
![[Diagram]](../../diagrams/0/b168e7f9de2b07988fa7f857cbef63dc.png)
![[Diagram]](../../diagrams/10/497dad25af59832df52ff38b2a016cd3.png)
![[Diagram]](../../diagrams/11/6836978f76c4f3c936acebd9edb9d301.png)
![[Diagram]](../../diagrams/41/2f7bd0872abe335823f12a22af4d6dea.png)
![[Diagram]](../../diagrams/29/b0176d9e24bc6770e1c2eeff85aafa71.png)
![[Diagram]](../../diagrams/40/312d2ca157cb549f52a595e250ed63f7.png)
![[Diagram]](../../diagrams/35/362cecb43669d1e039aad9a94c7c395d.png)
![[Diagram]](../../diagrams/49/5be3df548c0089e4bcd895cd8fdc57f6.png)
![[Diagram]](../../diagrams/32/813afb55f8b9f4250bd24690c2b02202.png)
![[Diagram]](../../diagrams/36/44bde4f3bfbc7a7b3816bd621a6cafd5.png)
![[Diagram]](../../diagrams/21/20d8158a62a519c81a488960421a0a7f.png)
![[Diagram]](../../diagrams/21/f7e78532f45056740fd41d312c701aad.png)
![[Diagram]](../../diagrams/20/3a80fa6ebd47cfcd48e1963c0834d74c.png)
![[Diagram]](../../diagrams/31/a5a2a16d7086de9d9a1fd1e3233b8140.png)
![[Diagram]](../../diagrams/19/ec23b7455ae78500d67e86fcb8c927ab.png)
![[Diagram]](../../diagrams/39/e319a8b33d2dcb0dd06bc7f289a3a1c2.png)
![[Diagram]](../../diagrams/50/bef5f7aaff7509cda7772126416b7dc3.png)
![[Diagram]](../../diagrams/6/45adad3b8140157d1b126c2c100f4732.png)
![[Diagram]](../../diagrams/2/0dee66e3493040a5310d3cada50ad4e4.png)
![[Diagram]](../../diagrams/21/af93393d94622051d810d68b3de0a16a.png)


![[Diagram]](../../diagrams/17/64d22a4e71ada7a046f3082a160f6457.png)
![[Diagram]](../../diagrams/31/fcea06218eb492d291e0860ec72dfc23.png)
![[Diagram]](../../diagrams/0/e1ec8f4164e9c602bdc954584e02cf4f.png)
![[Diagram]](../../diagrams/32/eff213585c8e0a642d874ac523b2a69c.png)
![[Diagram]](../../diagrams/17/32d9bd44decefb408af6f117a9f2c404.png)